Steve Pawlowski Intel Senior Fellow GM, Architecture and Planning CTO, Digital Enterprise Group...
21
Steve Pawlowski Intel Senior Fellow Intel Senior Fellow GM, Architecture and Planning GM, Architecture and Planning CTO, Digital Enterprise Group CTO, Digital Enterprise Group Intel Corporation Intel Corporation CHEP ‘09 March 24, 2009 More Computing More Computing with with Less energy Less energy
-
Upload
donald-boyd -
Category
Documents
-
view
217 -
download
2
Transcript of Steve Pawlowski Intel Senior Fellow GM, Architecture and Planning CTO, Digital Enterprise Group...

Steve PawlowskiIntel Senior FellowIntel Senior Fellow
GM, Architecture and PlanningGM, Architecture and PlanningCTO, Digital Enterprise GroupCTO, Digital Enterprise Group
Intel CorporationIntel Corporation
CHEP ‘09
March 24, 2009
More Computing More Computing with with
Less energy Less energy
2
Legal DisclaimerINFORMATION IN THIS DOCUMENT IS PROVIDED IN CONNECTION WITH INTEL® PRODUCTS. NO LICENSE, EXPRESS OR IMPLIED, BY ESTOPPEL OR OTHERWISE, TO ANY INTELLECTUAL PROPERTY RIGHTS IS GRANTED BY THIS DOCUMENT. EXCEPT AS PROVIDED IN INTEL’S TERMS AND CONDITIONS OF SALE FOR SUCH PRODUCTS, INTEL ASSUMES NO LIABILITY WHATSOEVER, AND INTEL DISCLAIMS ANY EXPRESS OR IMPLIED WARRANTY, RELATING TO SALE AND/OR USE OF INTEL® PRODUCTS INCLUDING LIABILITY OR WARRANTIES RELATING TO FITNESS FOR A PARTICULAR PURPOSE, MERCHANTABILITY, OR INFRINGEMENT OF ANY PATENT, COPYRIGHT OR OTHER INTELLECTUAL PROPERTY RIGHT. INTEL PRODUCTS ARE NOT INTENDED FOR USE IN MEDICAL, LIFE SAVING, OR LIFE SUSTAINING APPLICATIONS.
Intel may make changes to specifications and product descriptions at any time, without notice.
All products, dates, and figures specified are preliminary based on current expectations, and are subject to change without notice.
Intel, processors, chipsets, and desktop boards may contain design defects or errors known as errata, which may cause the product to deviate from published specifications. Current characterized errata are available on request.
This document may contain information on products in the design phase of development. The information here is subject to change without notice. Do not finalize a design with this information.
Designers must not rely on the absence or characteristics of any features or instructions marked "reserved" or "undefined." Intel reserves these for future definition and shall have no responsibility whatsoever for conflicts or incompatibilities arising from future changes to them.
Intel Corporation may have patents or pending patent applications, trademarks, copyrights, or other intellectual property rights that relate to the presented subject matter. The furnishing of documents and other materials and information does not provide any license, express or implied, by estoppel or otherwise, to any such patents, trademarks, copyrights, or other intellectual property rights.
Wireless connectivity and some features may require you to purchase additional software, services or external hardware.
Nehalem, Penryn, Westmere, Sandy Bridge and other code names featured are used internally within Intel to identify products that are in development and not yet publicly announced for release. Customers, licensees and other third parties are not authorized by Intel to use code names in advertising, promotion or marketing of any product or services and any such use of Intel's internal code names is at the sole risk of the user
Performance tests and ratings are measured using specific computer systems and/or components and reflect the approximate performance of Intel products as measured by those tests. Any difference in system hardware or software design or configuration may affect actual performance.
Intel, Intel Inside, Pentium, Xeon, Core and the Intel logo are trademarks of Intel Corporation in the United States and other countries.
*Other names and brands may be claimed as the property of others.
Copyright © 2009 Intel Corporation.

3
Real World Problems Taking Us
BEYOND PETASCALE
1 PFlops
100 TFlops
10 TFlops
1 TFlops
100 GFlops
10 GFlops
1 GFlops
100 MFlops1993 20171999 2005 2011
SUMOf
Top500
2023
#1
2029
Aerodynamic Analysis: Aerodynamic Analysis: Laser Optics: Laser Optics: Molecular Dynamics in Biology: Molecular Dynamics in Biology: Aerodynamic Design: Aerodynamic Design: Computational Cosmology: Computational Cosmology: Turbulence in Physics: Turbulence in Physics: Computational Chemistry: Computational Chemistry:
1 Petaflops1 Petaflops10 Petaflops10 Petaflops20 Petaflops20 Petaflops
1 Exaflops1 Exaflops10 Exaflops10 Exaflops
100 Exaflops100 Exaflops1 Zettaflops1 Zettaflops
Source: Dr. Steve Chen, “The Growing HPC Momentum in China”,Source: Dr. Steve Chen, “The Growing HPC Momentum in China”,June 30June 30thth, 2006, Dresden, Germany, 2006, Dresden, Germany
Example Real World Challenges:Example Real World Challenges:• Full modeling of an aircraft in all conditionsFull modeling of an aircraft in all conditions• Green airplanesGreen airplanes• Genetically tailored medicineGenetically tailored medicine• Understand the origin of the universeUnderstand the origin of the universe• Synthetic fuels everywhereSynthetic fuels everywhere• Accurate extreme weather prediction Accurate extreme weather prediction
10 PFlops
100 PFlops
10 EFlops
1 EFlops
100 EFlops
1 ZFlops
What we can just model today with <100TF

4
A look at CERN’s Computing Growth
0
20
80
100
2007 2008 2009 2010 2011 2012 2013
Source: CERN, Jarp Sverre
40
60
120
CERN Tape Library
Tape Space (PetaByte)
Disk Space (PetaByte)
Computing
21,500 Cores @ 1400 SI2K per core
Lots of computing (45% CAGR), lots of data; no upper boundary!

5
1.E+00
1.E+02
1.E+04
1.E+06
1.E+08
1986 1996 2006 2016
G
Tera
Peta
36X
Exa
4,000X
2.5M X
Transistor Performance
1
10
100
1000
1986 1996 2006 2016
Re
lati
ve
Tr
Pe
rfo
rma
nc
e
G
Tera
Peta
30X 250X
Moore’s Law and High Performance Computing
From Peta to Exa, 2X Transistor Performance, Requiring ~30K cores @2800 SPI2K
Source: Intel labs
Relative Performance (GFlops as the base)Exa
500X
Tera: ASCI Red 9,298
Processors
Peta: Today’s COTS 11.5K Processors assuming 2.7 GHz

6
A look at CERN’s Computing Growth
0
20
80
100
2007 2008 2009 2010 2011 2012 2013
Source: CERN, Jarp Sverre
40
60
120
Tape Space (PetaByte)
Disk Space (PetaByte)
Computing
21,500 Cores @ 1400 SI2K per core
2014
2015 2016
30,000 Cores @ 2800 SI2K per core

7

8
Reach Exascale by 2018From GigFlops to ExaFlops
Sustained T
eraFlo
p
Sustained P
etaFlo
p
Sustained G
igaFlop
Sustain
ed E
xaFlo
p
“The pursuit of each milestone has led to important breakthroughs in science and engineering.”
Source: IDC “In Pursuit of Petascale Computing: Initiatives Around the World,” 2007
~1987
~1997
2008
~2018
Note: Numbers are based on Linpack Benchmark. Dates are approximate.

9
10EB disk @ 10TB/disk @10W
100pJ comm per FLOP
0.1B/FLOP @ 1.5nJ per Byte
170K chips @ ~400W each
70MW
80MW
70MW
10MW
100+ MW?
Compute
Memory
Comm
Disk
An ExaFLOPS Machine without Power Management
EFLOP2015-18Power?
Power Consumption
Pow
er
(KW
)What is Preventing us?
Power is Gating Every Part of Computing
The Challenge of ExascaleThe Challenge of ExascaleSource: Intel, for illustration and assumptions, not product
representative
Other misc. power consumptions:…Power supply lossesCooling… etc
1000,000
Voltage is not scaling as in the past
10000
100
1000
1964 1985 1997 2008
MFLOPGFLOP
TFLOP
PFLOP
2018
100,000
?

10
22%
26%
11%
3%5% 2% 1%
31%
CPUs
Planar & VRs
Memory
PSUs
Fans
HDD
PCI+GFX
Peripherals
HPC Platform Power
Data from P3 Jet Power Calculator, V2.0DP 80W NehalemMemory – 48GB (12 x 4GB DIMMs) Single Power Supply Unit @ 230Vac
Need a platform view of power consumption: CPU, Memory and VR, etc.
CPU
MemoryPlanar &VRs

11
1.E+00
1.E+02
1.E+04
1.E+06
1.E+08
1986 1996 2006 2016
G
Tera
Peta
80X
Exa
4,000X
1M X
Relative Power
Relative Performance0.001
0.01
0.1
1
1986 1996 2006 2016
Re
lati
ve
En
erg
y/O
p G
Tera
Peta
5V
Vcc scaling
Exponential Power and Computing Growth
Unmanaged growth in power will reach Giga Watt level at Exascale
Relative Performance and Power (GFlops as the base)
Power at a glance:
(assume 31% CPU Power in a system) •Today’s Peta: 0.7- 2 nj/op•Today’s COTS: 2nj/op (assume 100W/50GFlops)
•Unmanaged Exa: if 1GW, 0.31nj/op; Exa
12
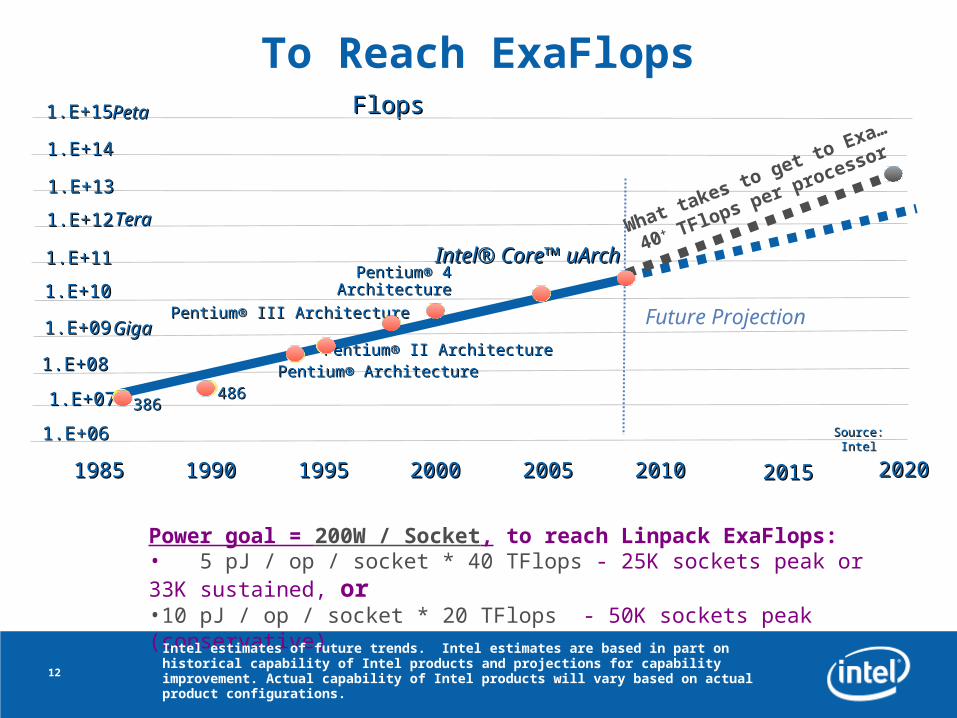
To Reach ExaFlopsFlopsFlops
Pentium® II ArchitecturePentium® II Architecture
Pentium® 4 Pentium® 4 ArchitectureArchitecture
Pentium® ArchitecturePentium® Architecture486486
386386
Intel® Core™ uArchIntel® Core™ uArch
1.E+061.E+06
1.E+071.E+07
1.E+081.E+08
1.E+091.E+09
1.E+101.E+10
1.E+111.E+11
1.E+121.E+12
1.E+131.E+13
1.E+141.E+14
1.E+151.E+15
19851985 19901990 19951995 20002000 20052005 20102010
Pentium® III ArchitecturePentium® III Architecture
TeraTera
PetaPeta
GigaGiga
Source: IntelSource: Intel
20152015 20202020
Future Projection
What takes to get to
Exa…
40+ TFlops per processor
Power goal = 200W / Socket, to reach Linpack ExaFlops:• 5 pJ / op / socket * 40 TFlops - 25K sockets peak or 33K sustained, or•10 pJ / op / socket * 20 TFlops - 50K sockets peak (conservative)
Intel estimates of future trends. Intel estimates are based in part on historical capability of Intel products and projections for capability improvement. Actual capability of Intel products will vary based on actual product configurations.

13
0.01
0.1
1
10
100
1000
10000
100000
1000000
1970 1980 1990 2000 2010
Rel
ativ
e P
erfo
rman
ceParallelism for Energy Efficient
Performance
Super Scalar
486386
2868086 Era of Era of
PipelinedPipelinedArchitectureArchitecture
Multi Threaded
Multi-Core
Era of Era of Thread & Thread & Processor Processor
Level Level ParallelismParallelism
Speculative, OOO
Era of Era of Instruction Instruction
LevelLevelParallelismParallelism
2020
10000000Many Core
Future Projection
Intel estimates of future trends. Intel estimates are based in part on historical capability of Intel products and projections for capability improvement. Actual capability of Intel products will vary based on actual product configurations.

14
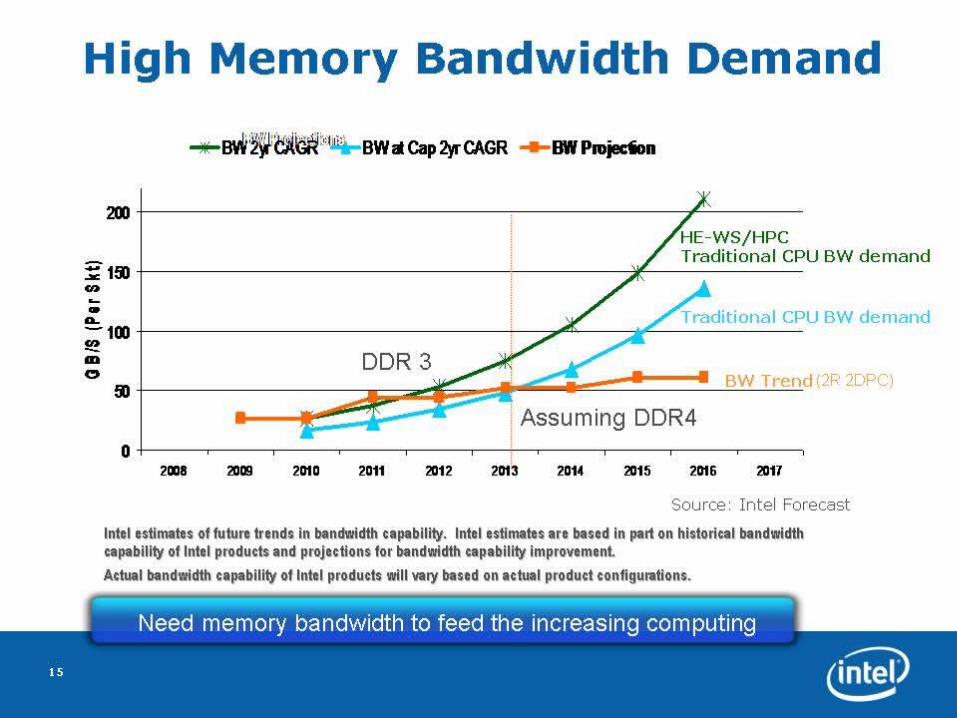
Reduce Memory and Communication Power
Core-to-core~10pJ per Byte
Chip to memory~1.5nJ per Byte~300pJ per Byte
Chip to chip~100pJ per Byte
Data movement is expensiveData movement is expensive
15

16

17
18
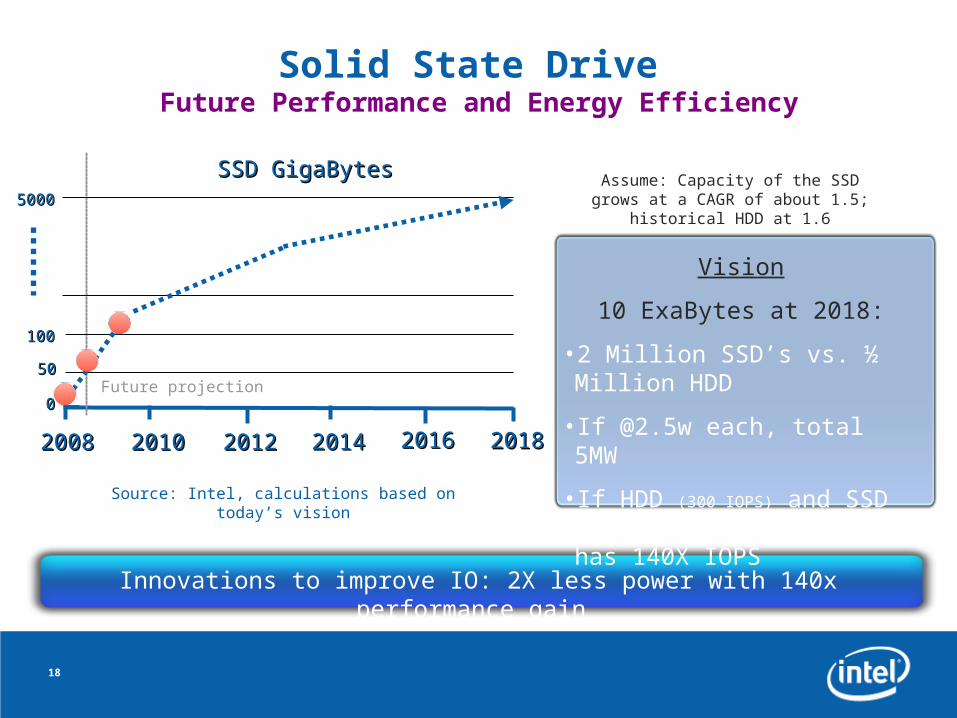
Solid State Drive Future Performance and Energy Efficiency
Assume: Capacity of the SSD grows at a CAGR of about 1.5; historical
HDD at 1.6
20082008 20122012 20142014 2016201620102010
00
100100
SSD GigaBytesSSD GigaBytes
Future projection
20182018
5050
50005000
Vision
10 ExaBytes at 2018:
•2 Million SSD’s vs. ½ Million HDD
•If @2.5w each, total 5MW
•If HDD (300 IOPS) and SSD (10k
IOPS) constant: SSD has 140X IOPS
Innovations to improve IO: 2X less power with 140x performance gain
Source: Intel, calculations based on today’s vision

19
Reliability, Reliability and Reliability
Density is on the Rise Reliability is an Issue Simplify for Reliability
•Moore’s Law provides more transistors
•Many core provides more computing
•HPC requires super high socket count
•Silent Data Corruption (SDC)
•Detectable Uncorrectable Errors (DUE)
•Solid State Drives or Diskless nodes
•Fewer cables by using backplanes
•Simpler node design (fewer Voltage Regulator Modules, fewer capacitors, …)
Mean Time Between Failure (MTBF) Trends down: (Probably) (large number) = Probably NOT
large numbers Computing Errors Simplification

20
Increase Data Center Compute Density
SiliconProcessSilicon
Process
Target 50% yearlyimprovements inperformance/watt
Target 50% yearlyimprovements inperformance/watt
YearYearCom
pute
Den
sity
Com
pute
Den
sity
Data CenterInnovation
Data CenterInnovation
PowerManagement
PowerManagement
SmallForm Factor
SmallForm Factor
NewTechnology
NewTechnology++ ++ ++ ++
Source: Intel, based on Intel YoY improvement with SpecPower Benchmark

21
Revised Exascale System Power
10EB SSD @ 5TB/SSD @2.5W
10pJ comm per FLOP
0.1B/FLOP @ 300pJ per Byte
25K - 80K chips@~200W each 8-16MW
16MW
7MW
5MW
<<100MW
Compute
Memory
Comm
SSD
ExaFLOPS Machine Future Vision
10EB disk @ 10TB/disk @10W
100pJ com per FLOP
0.1B/FLOP @ 1.5nJ per Byte
170K chips @ ~400W each70MW
80MW
70MW
10MW
Other misc. power consumption:…Power supply lossesCooling… etc100+ MW?
Memory
Comm
Disk
ExaFLOPS Machine without Power Mgmt
Compute
Other misc. power consumption:…Power supply lossesCooling… etc
Source: Intel, for illustration and assumptions, not product representative