Interest points CSE P 576 Ali Farhadi Many slides from Steve Seitz, Larry Zitnick.
Upload
aaron-drakeCategory
view
189download
28description
Candlestick Patterns
Introduction to Advanced Candlestick PatternsIntroduction to Advanced Introduction to Advanced Candlestick PatternsCandlestick Patterns
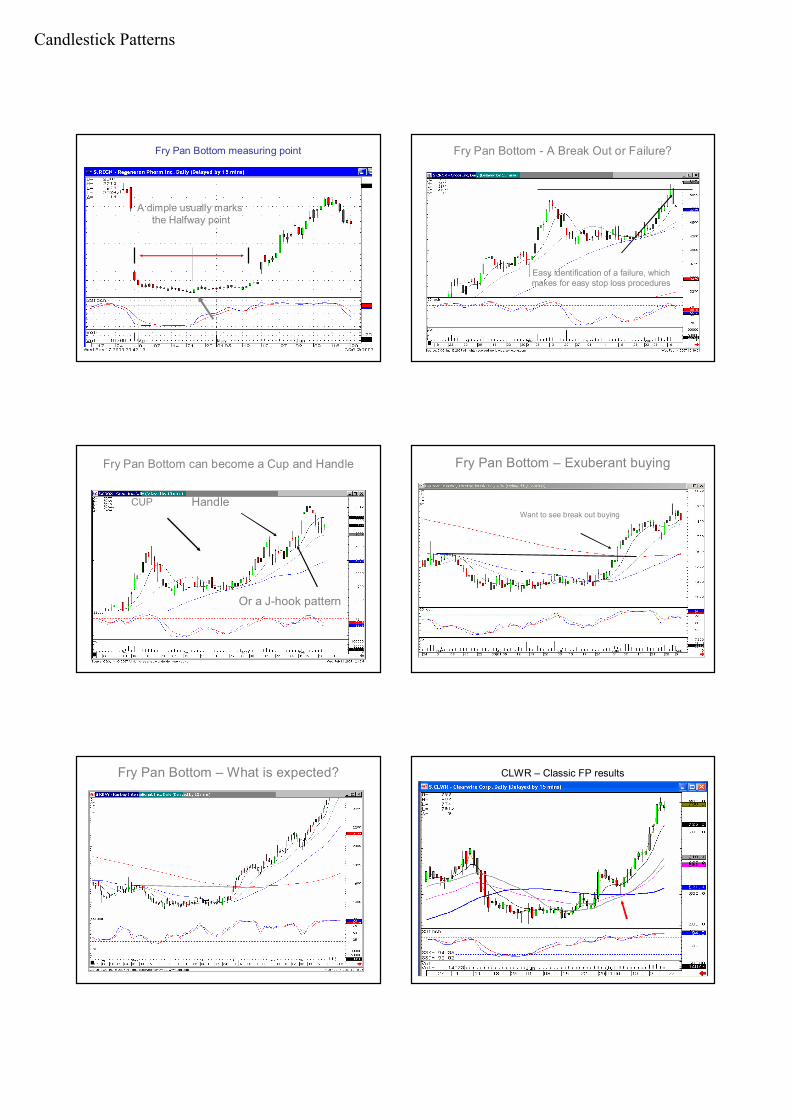
Advanced Candlestick Patterns
Fry Pan Bottom Cradle Pattern Jay-Hook Scoop Pattern Belt Hold Breakout Patterns
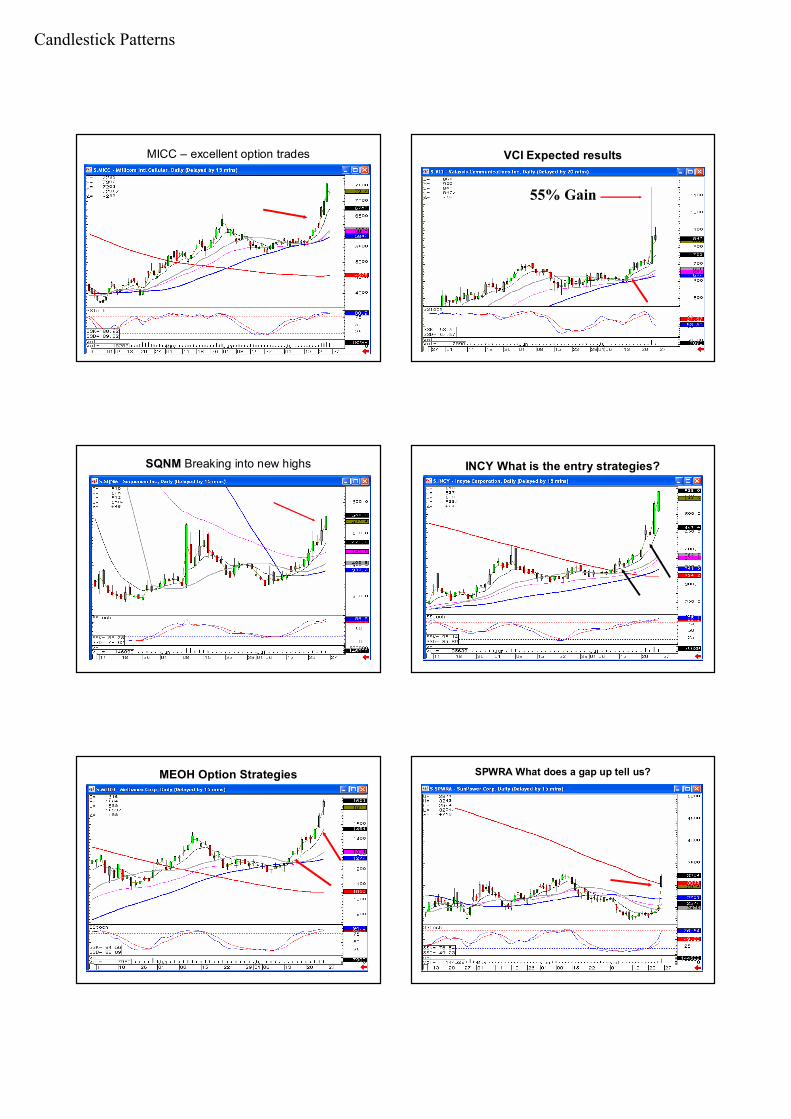
Fry Pan Bottom
The downtrend starts waning with the appearance of small trading bodies
As the trend starts slowly curling up, a gap up in price indicates that strong buying sentiment has now returned
Fry Pan Bottom
Long Rounded Curved bottom
Fry Pan Bottom – minutes, days, months
The indecisive rounding bottom is the predominant factor
Fry Pan Bottom - Past Analysis
Big Percent move at top has a different meaning when a pattern can be identified
Candlestick Patterns
Fry Pan Bottom measuring point
A dimple usually marksthe Halfway point
Fry Pan Bottom - A Break Out or Failure?
Easy identification of a failure, whichmakes for easy stop loss procedures
Fry Pan Bottom can become a Cup and Handle
CUP Handle
Or a J-hook pattern
Fry Pan Bottom – Exuberant buying
Want to see break out buying
Fry Pan Bottom – What is expected? CLWR – Classic FP results
Candlestick Patterns
MICC – excellent option trades VCI Expected results
55% Gain
SQNM Breaking into new highs INCY What is the entry strategies?
MEOH Option Strategies SPWRA What does a gap up tell us?

Candlestick Patterns
BAS – What do you do with this chart? MD What pattern?
MGM – Next target? Then what? What do we want to see at the end of a FPB?
What Are we looking for now? FPB/J-hook classic
Fry Pan Bottom
J-hook
Candlestick Patterns
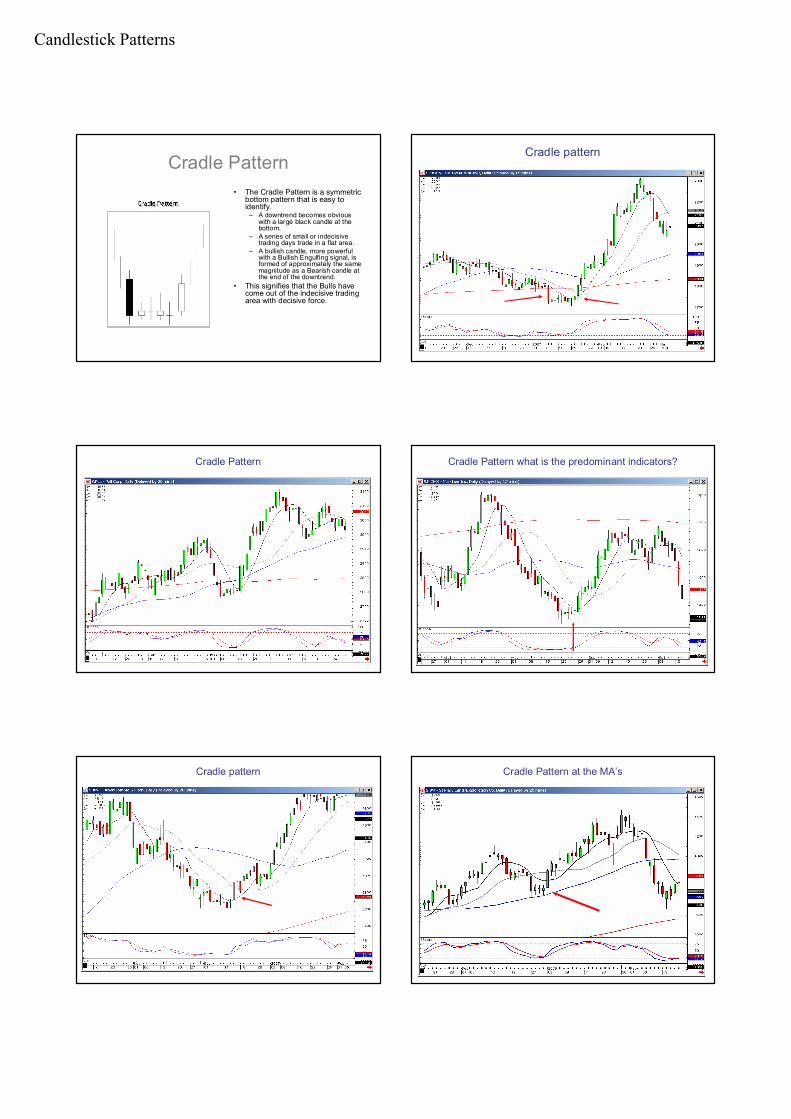
Cradle Pattern• The Cradle Pattern is a symmetric
bottom pattern that is easy to identify.
– A downtrend becomes obvious with a large black candle at the bottom.
– A series of small or indecisive trading days trade in a flat area.
– A bullish candle, more powerful with a Bullish Engulfing signal, is formed of approximately the same magnitude as a Bearish candle at the end of the downtrend.
• This signifies that the Bulls have come out of the indecisive trading area with decisive force.
Cradle pattern
Cradle Pattern Cradle Pattern what is the predominant indicators?
Cradle pattern Cradle Pattern at the MA’s
Candlestick Patterns
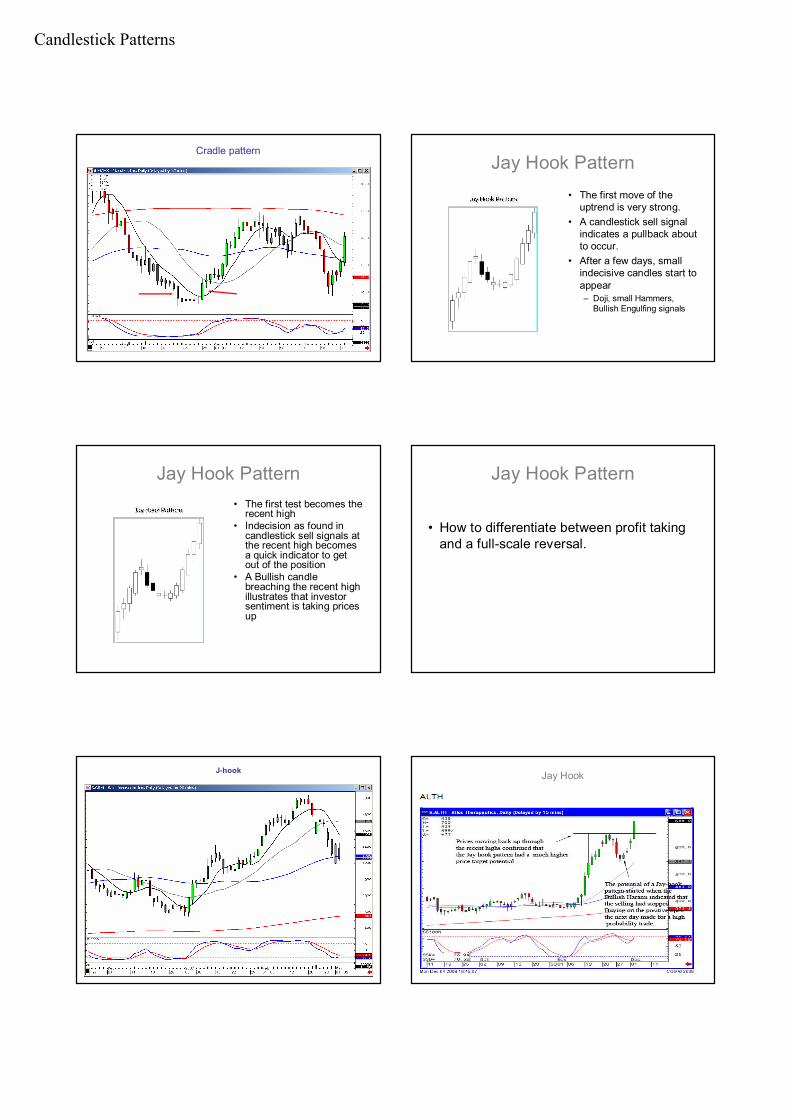
Cradle patternJay Hook Pattern
• The first move of the uptrend is very strong.
• A candlestick sell signal indicates a pullback about to occur.
• After a few days, small indecisive candles start to appear– Doji, small Hammers,
Bullish Engulfing signals
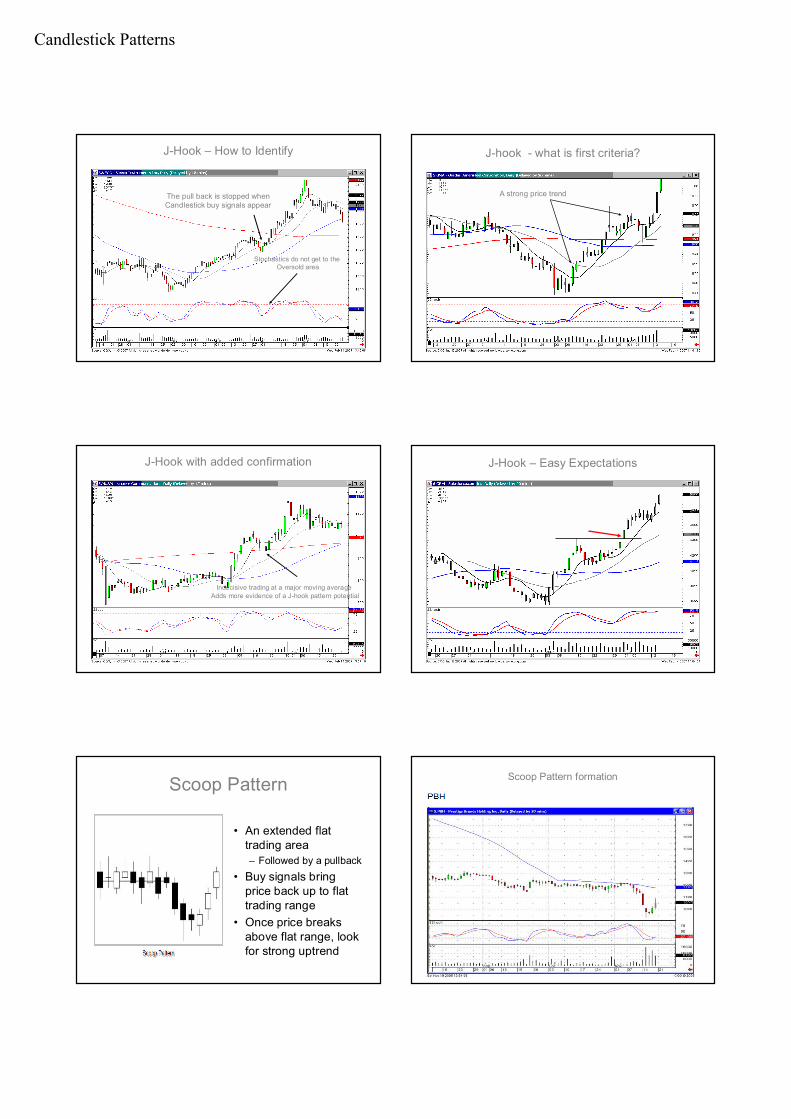
Jay Hook Pattern• The first test becomes the
recent high• Indecision as found in
candlestick sell signals at the recent high becomes a quick indicator to get out of the position
• A Bullish candle breaching the recent high illustrates that investor sentiment is taking prices up
Jay Hook Pattern
• How to differentiate between profit taking and a full-scale reversal.
J-hook Jay Hook
Candlestick Patterns
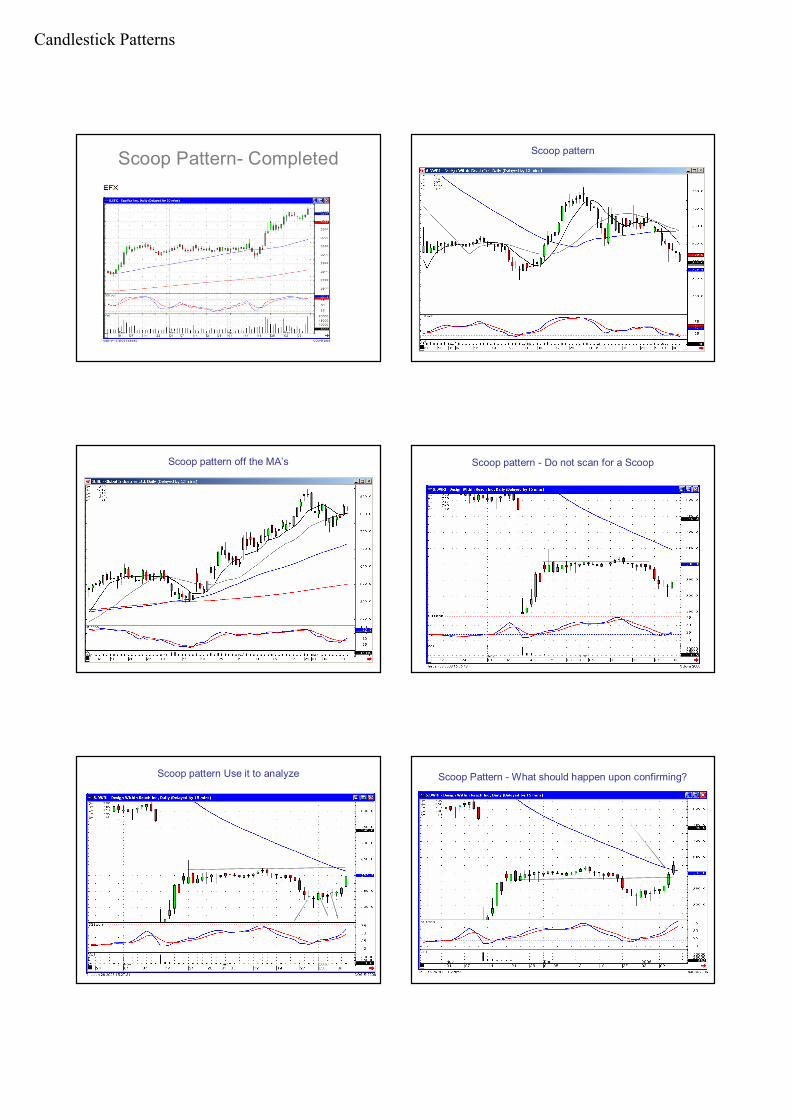
J-Hook – How to Identify
Stochastics do not get to the Oversold area
The pull back is stopped whenCandlestick buy signals appear
J-hook - what is first criteria?
A strong price trend
J-Hook with added confirmation
Indecisive trading at a major moving average Adds more evidence of a J-hook pattern potential
J-Hook – Easy Expectations
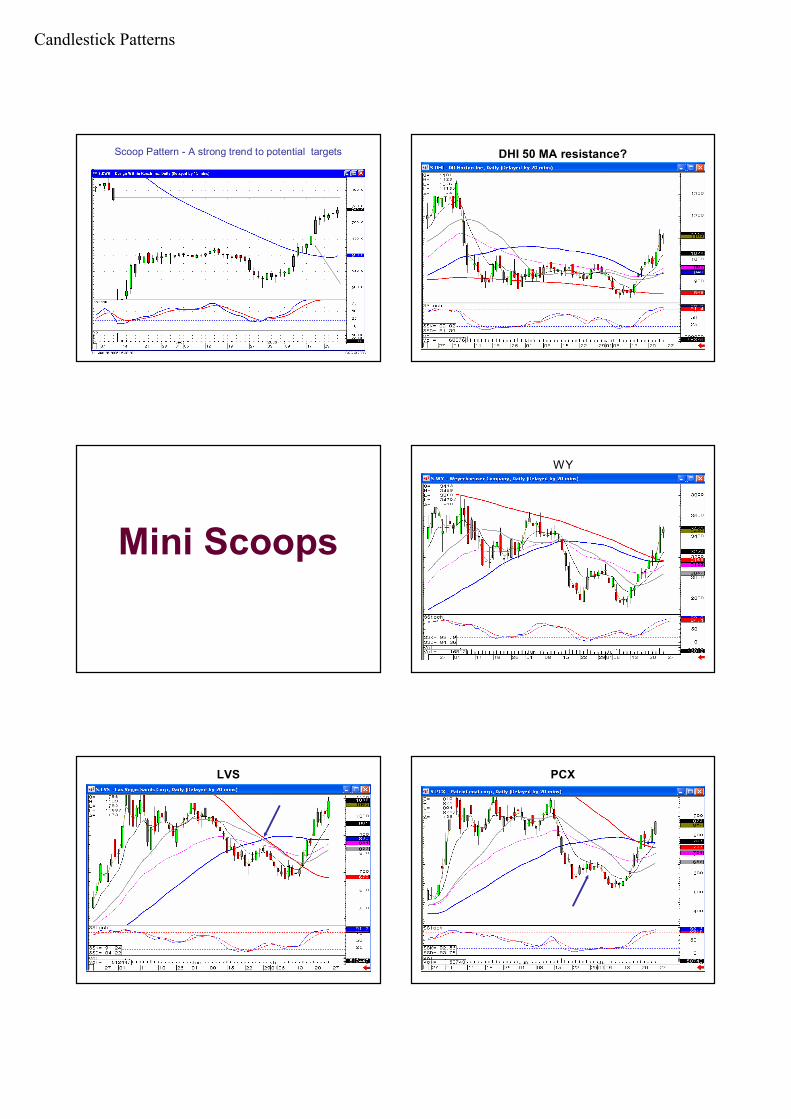
Scoop Pattern
• An extended flat trading area– Followed by a pullback
• Buy signals bring price back up to flat trading range
• Once price breaks above flat range, look for strong uptrend
Scoop Pattern formation
Candlestick Patterns
Scoop Pattern- Completed Scoop pattern
Scoop pattern off the MA’s Scoop pattern - Do not scan for a Scoop
Scoop pattern Use it to analyze Scoop Pattern - What should happen upon confirming?
Candlestick Patterns
Scoop Pattern - A strong trend to potential targets DHI 50 MA resistance?
Mini Scoops
WY
LVS PCX
Candlestick Patterns
MEE What is the buy criteria? WYNN
Belt Hold Pattern• Strong prevailing trend• The candlestick body
should be the opposite color of the prevailing trend
• Gap on the open, continuing the trend
• The open is the high or low of that trend
• The length of the body should be a long body.
Belthold
Belthold - Adds strength to existing trends Belthold – shows the sellers are flushed out
Candlestick Patterns
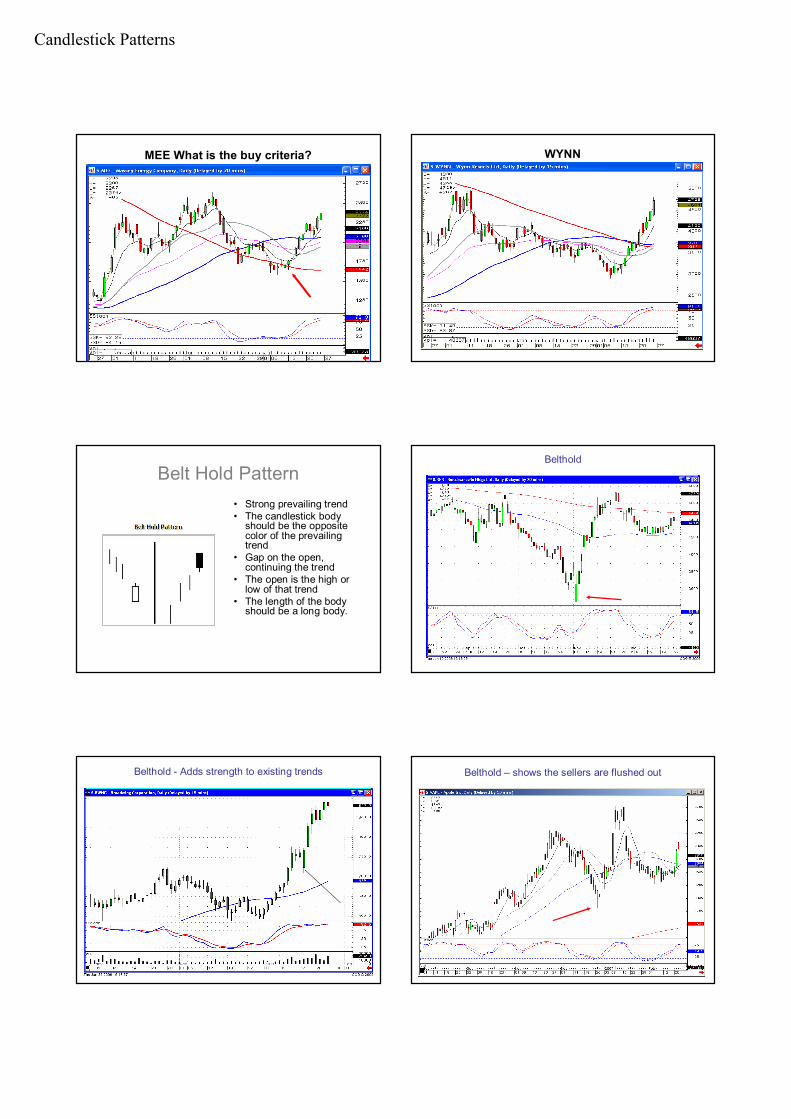
Belthold – gets rid of the last of the sellers Belthold
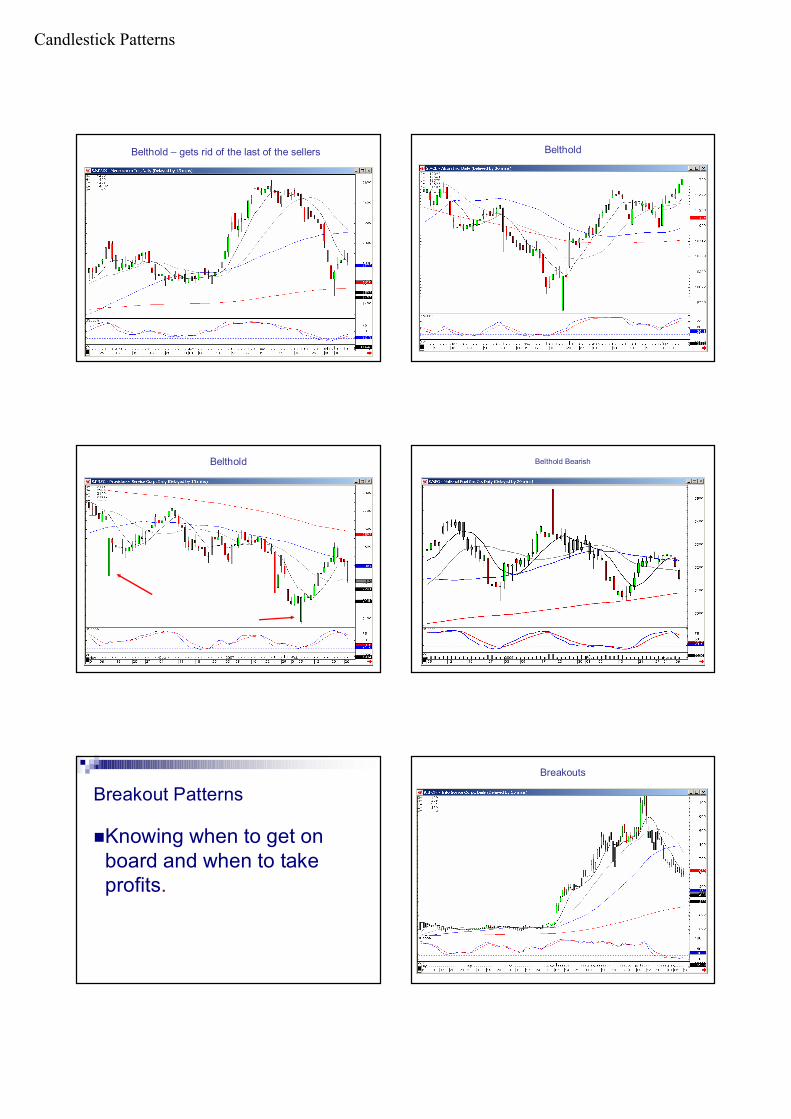
Belthold Belthold Bearish
Breakout Patterns
Knowing when to get on board and when to take profits.
Breakouts
Candlestick Patterns
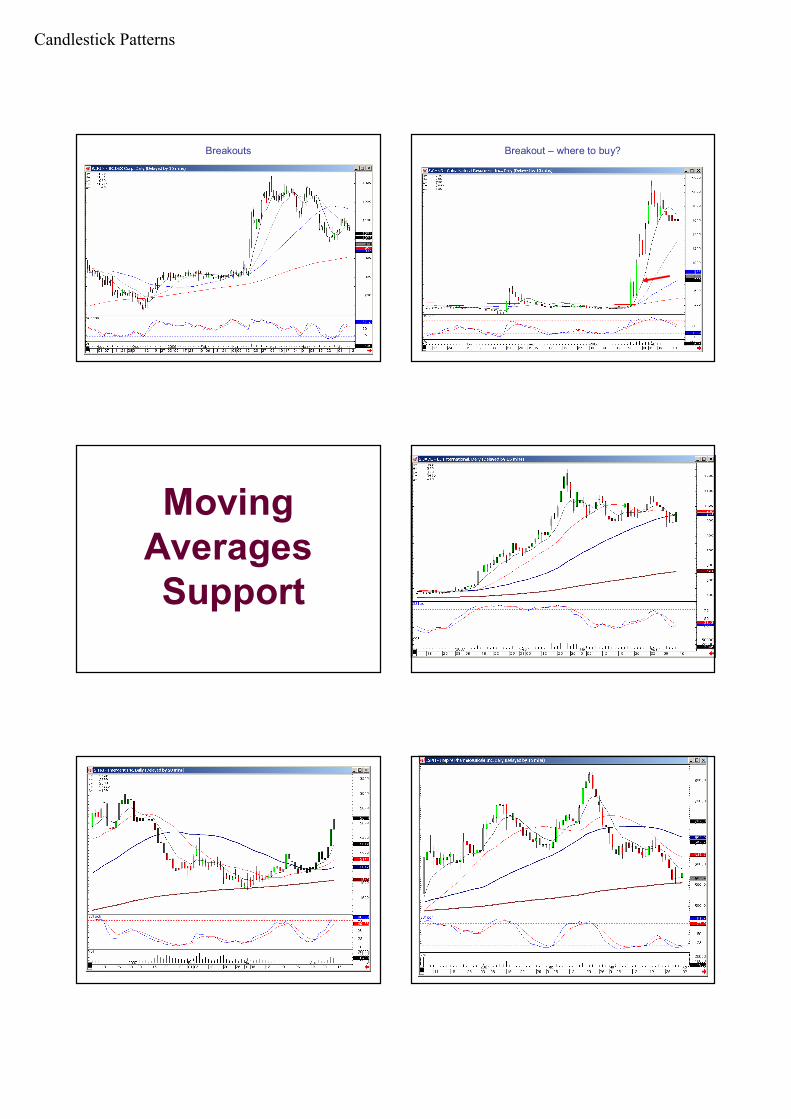
Breakouts Breakout – where to buy?
Moving AveragesSupport
Candlestick Patterns
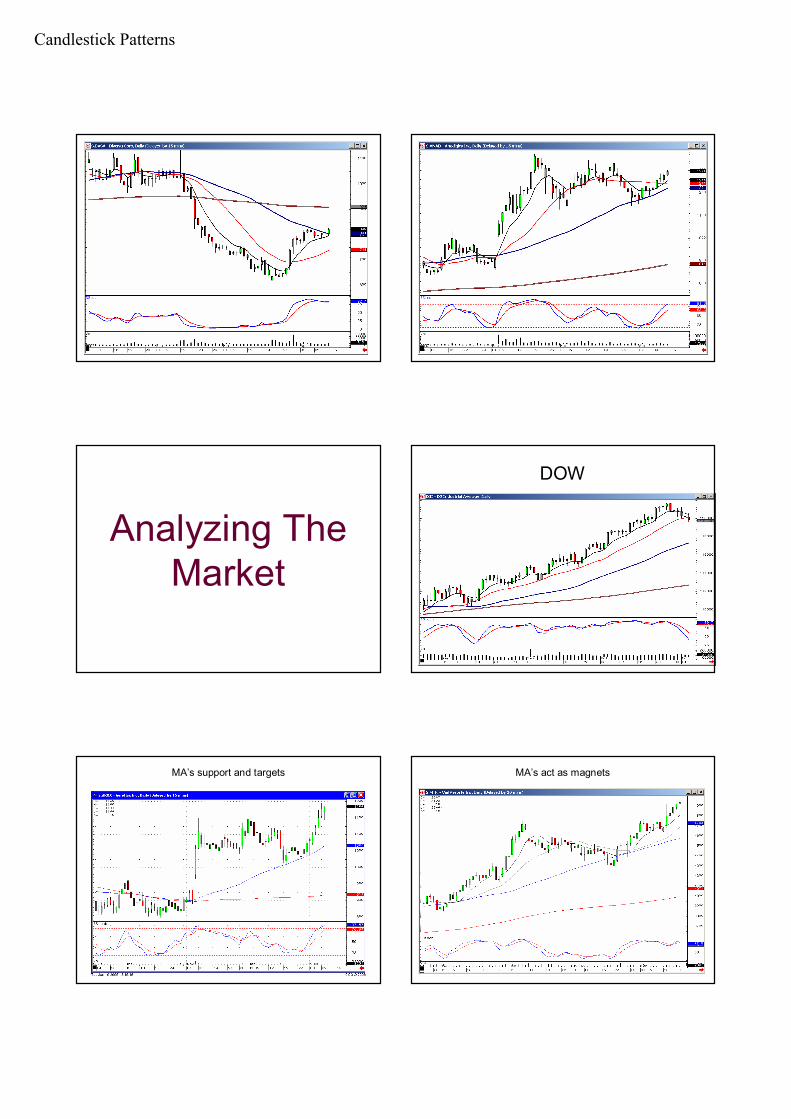
Analyzing The Market
DOW
MA’s support and targets MA’s act as magnets
Candlestick Patterns
MA’s and patterns MA’s once breached , will come back and test
MA’s Targets MA’s – first attempts usually fail
Wave 1-2-3 The T-line
Candlestick Patterns
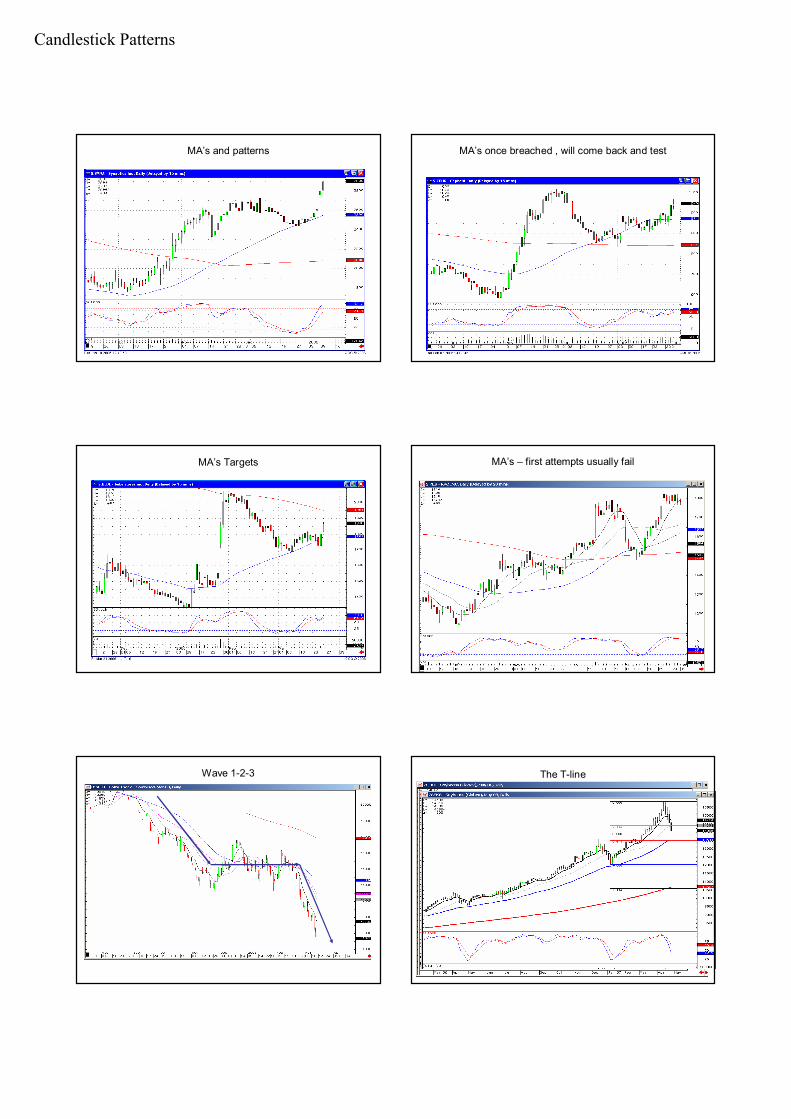
Trend channels Trading Gaps
• Gaps represent enthusiasm to get into a position to the point that investors will pay prices away from any of the previous day's trading range.
• Great for identifying panic selling at the bottom and exuberant buying at the top.
High Powered Scanning Techniques with Candlesticks
• Market trend• Strongest sectors• Strongest signals in those sectors• Additional indicators confirming• Best Target potentials• Easy stop loss points
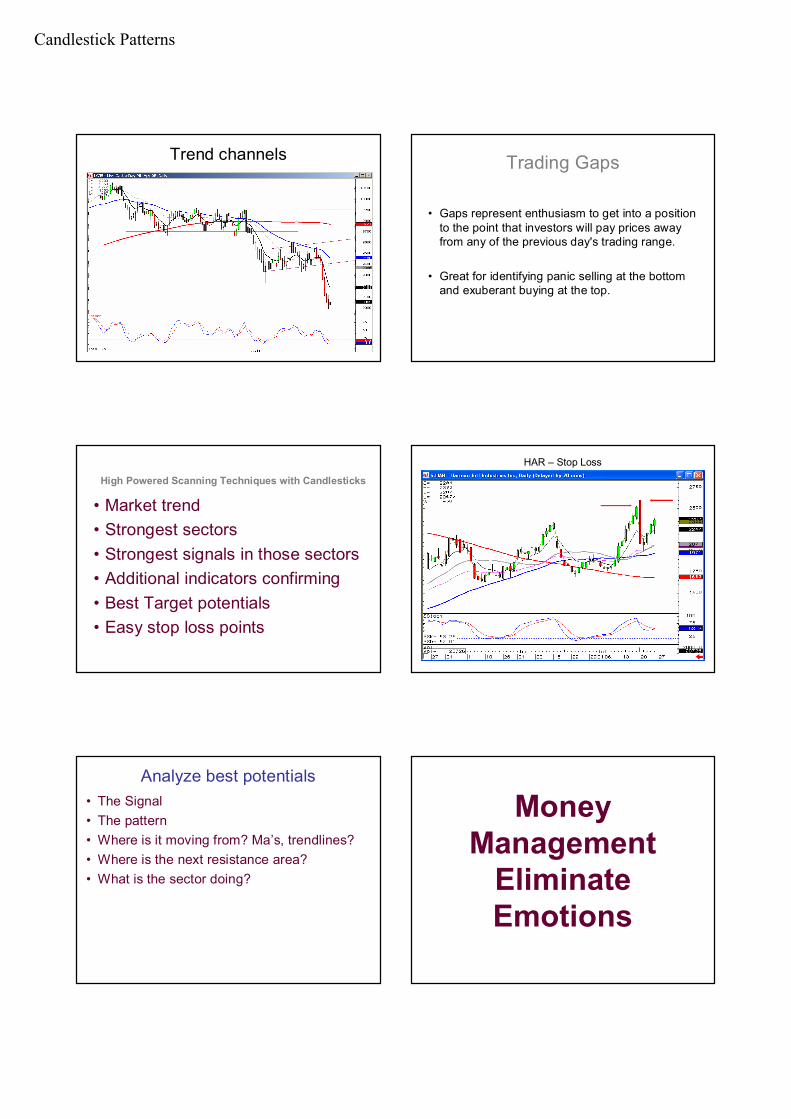
HAR – Stop Loss
Analyze best potentials• The Signal• The pattern• Where is it moving from? Ma’s, trendlines?• Where is the next resistance area?• What is the sector doing?
Money Management
Eliminate Emotions
Candlestick Patterns
The Point of investing is to have the probabilities in your favor!
Candlestick signals provide the positive probabilities
Candlesticks are merely the graphic depiction of what
investor sentiment is doing
Trend Analysis Made easy with
Candlesticks
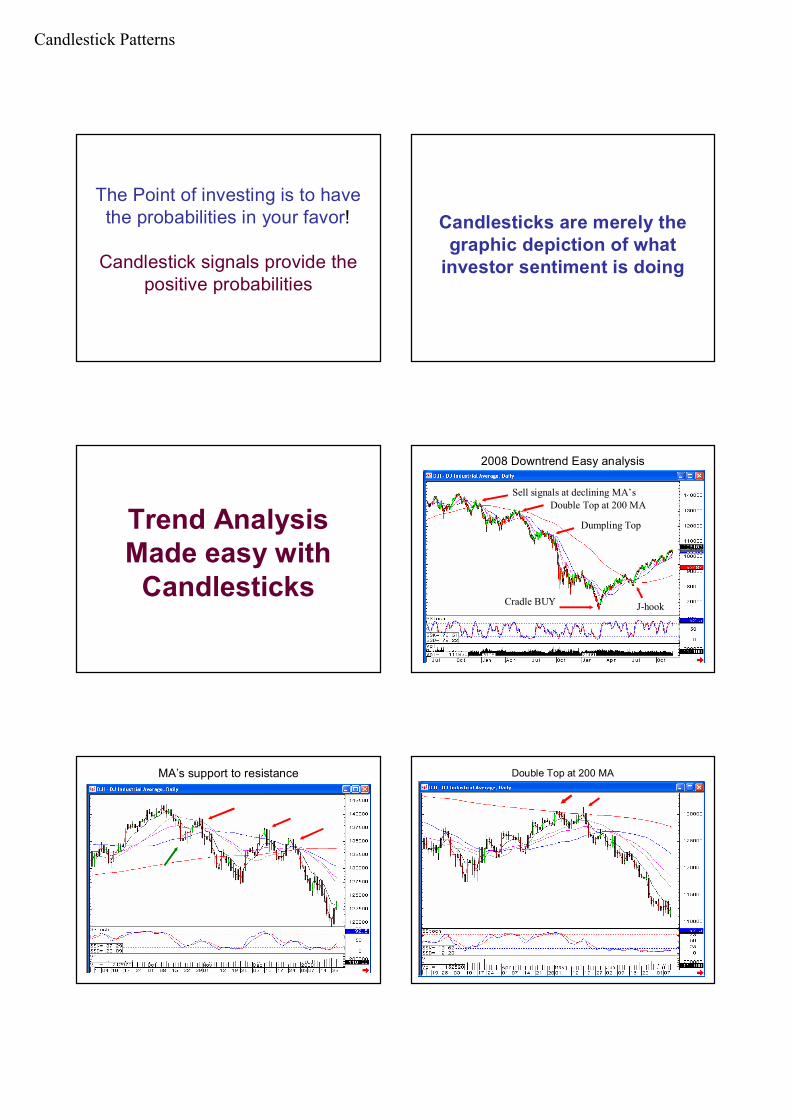
2008 Downtrend Easy analysis
Sell signals at declining MA’sDouble Top at 200 MA
Dumpling Top
Cradle BUY J-hook
MA’s support to resistance Double Top at 200 MA
Candlestick Patterns
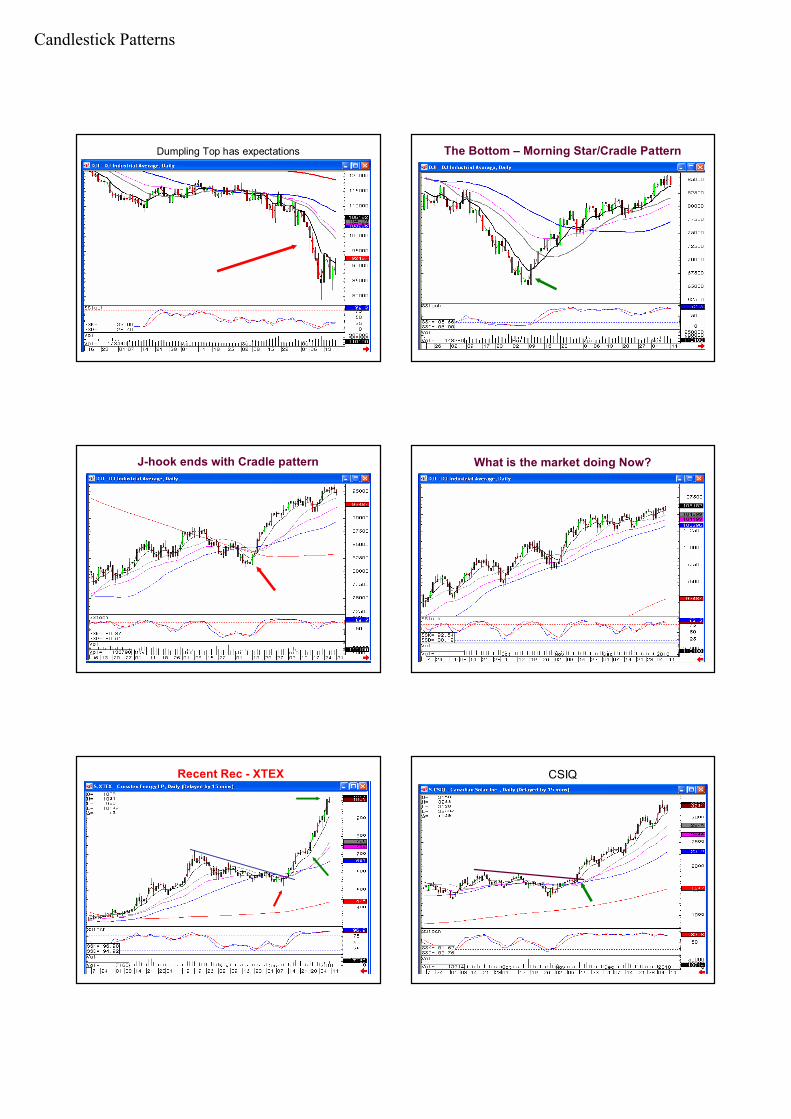
Dumpling Top has expectations The Bottom – Morning Star/Cradle Pattern
J-hook ends with Cradle pattern What is the market doing Now?
Recent Rec - XTEX CSIQ
Candlestick Patterns
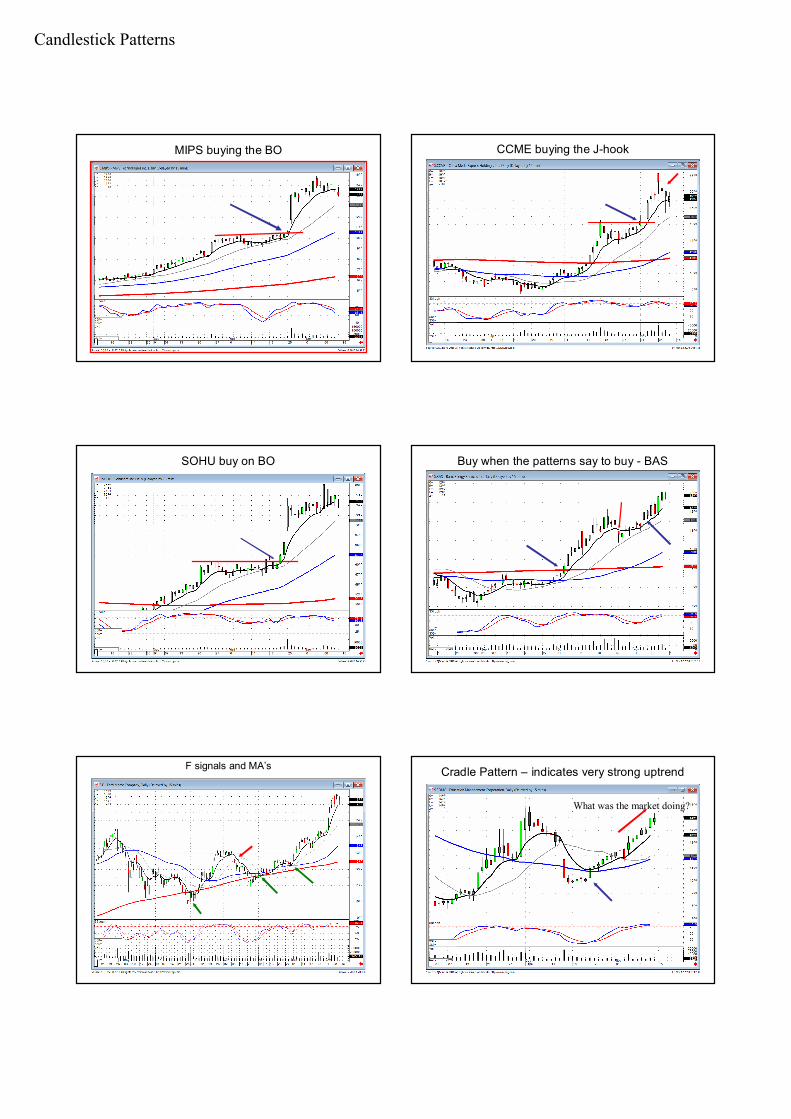
MIPS buying the BO CCME buying the J-hook
SOHU buy on BO Buy when the patterns say to buy - BAS
F signals and MA’s Cradle Pattern – indicates very strong uptrend
What was the market doing?
Candlestick Patterns
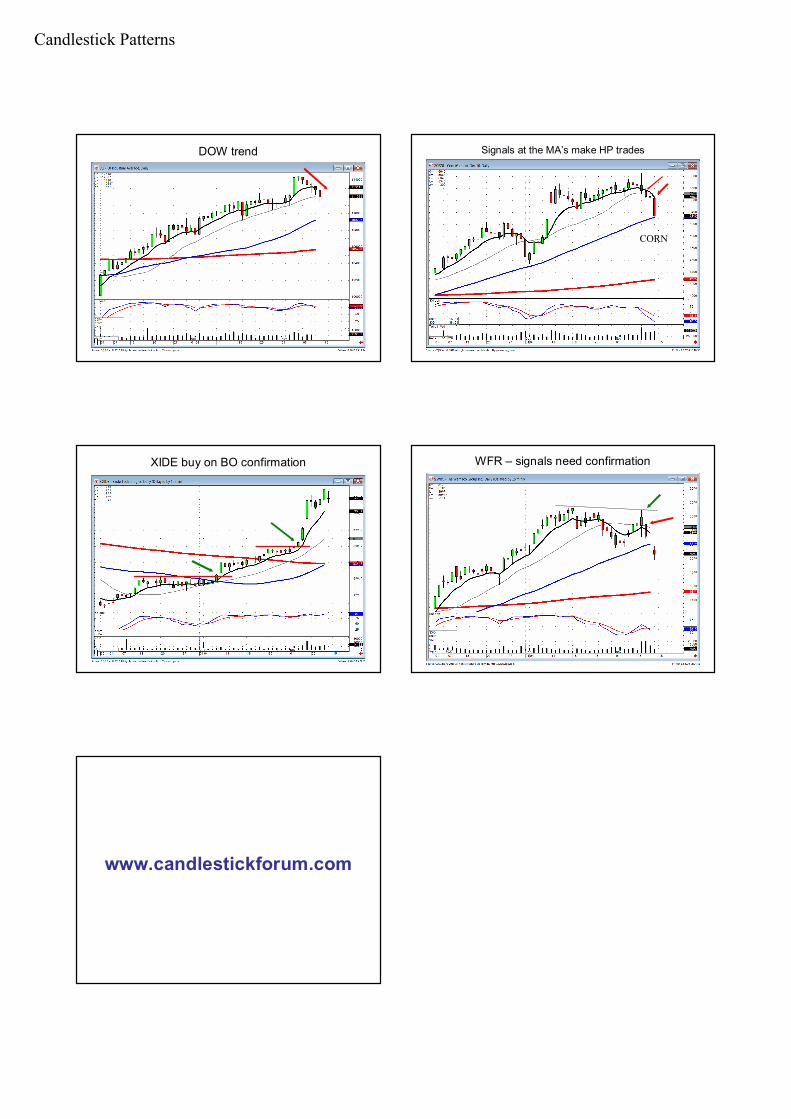
DOW trend Signals at the MA’s make HP trades
CORN
XIDE buy on BO confirmation WFR – signals need confirmation
www.candlestickforum.com