Stern Stewart Research on European Chemical … · Stern Stewart & Co. is a global consulting firm...
24
Stern Stewart Research on European Chemical Industry // October 2002 Value Creation in the Chemical Industry Challenging the Business Cycle
Transcript of Stern Stewart Research on European Chemical … · Stern Stewart & Co. is a global consulting firm...

Stern Stewart Research on European Chemical Industry // October 2002
Value Creation in the Chemical Industry
Challenging the Business Cycle


Stern Stewart & Co. Management Consultants Stern Stewart & Co. is a global consulting firm that specializes in helping client
companies in the creation of shareholder wealth. Since its foundation more
than twenty years ago, Stern Stewart has become the leading global consul-
ting firm for value based management. As a strategic partner to clients our
objective is effectively to generate sustainable value for companies. We im-
plement concepts for corporate strategy as well as for organizational design,
corporate governance and management. Stern Stewart & Co.’s financial per-
formance measure EVA (Economic Value Added) has become a global stan-
dard. Stern Stewart & Co. publishes the quarterly Journal of Applied Corporate
Finance.
About the Authors Gerhard Nenning is a Project Manager in the Munich office. Dr. Heinrich H.
Foerster is a Project Manager in the New York office. Thomas Wally is a
Senior Analyst in the Munich office. The authors have implemented value cre-
ating concepts and strategies for major companies in Europe and the United
States.
Acknowledgments
The authors further would like to thank Ronald Reschke and Banafsheh Moat-
tar for their support.
2002 // All rights reserved for Stern Stewart & Co. 2

Further Contact Questions and comments on this report are welcomed. Please contact:
Gerhard Nenning, Project Manager, Munich [email protected]
Heinrich H. Foerster, Project Manager, New York [email protected]
Markus Pertl, Managing Partner, Munich [email protected]
Disclaimer The views expressed in this report are based on Stern Stewart & Co.’s general
knowledge, analysis and understanding of value, incentives and corporate
governance issues. All estimates and opinions included in this report constitute
our judgement as of the date of the report and may be subject to change with-
out notice. No warranties are given and no liability is accepted in contract, tort
(including negligence) or otherwise by Stern Stewart for any loss, or damage
that may arise from actions based on any information, opinions, recommenda-
tions or conclusions contained in this report. This report is being submitted to
selected recipients only. It may not be reproduced (in whole or in part) to any
person without the prior written permission of Stern Stewart & Co.
EVA is a registered trademark of Stern Stewart & Co. Future Growth Value™
and FGV™ are trademarks of Stern Stewart & Co.
3 2002 // All rights reserved for Stern Stewart & Co.

Management Summary
Recently, companies in the chemical industry have faced a challenging busi-
ness environment. Increased resource prices in combination with falling de-
mand prices, overcapacity and lower operating rates have led to a sharp de-
cline in economic performance.
The industry now is confronted with a slowdown in the economic cycle. In fact,
today’s cumulative operative value created by all European companies in the
chemical industry is even lower than ten years ago when the industry was on
the floor of the last business cycle. From an investors’ point of view, the cumu-
lative Market Value Added (MVA)1 has been squeezed by almost 80% since its
height in 1999. In other words, the industry has created minimal value.
On average the industry does not meet investors’ expectations. The return
from operations both in the period of expansion from 1993 to 1997 and in the
contraction phase from 1998 until now has fallen short of the cost of capital.
Naturally this is a generalised observation which may not be reflected in the
performance of individual companies. For a more specific indication of how
value may be created given the nature of the chemical industry, we analysed
individual European companies2 on their ability to create value.
The results reveal a fundamental, but often overlooked insight on what creates
value in the industry. Companies that invested at the right time, i.e. at the bot-
tom of the business cycle, were rewarded by more value created during the
subsequent expansion phase. In fact these companies were rewarded on av-
erage by three times excess return during the following expansion phase com-
pared to their competitors. In addition, companies that consistently moved to-
wards a core activity, no matter if they are either key players or act as niche
1 Market Value Added (MVA) is an indicator of external value creation. It is measured as the difference between
the market value of a company and the capital invested over the years. 2 Base: n=39 companies in the European chemicals sector. See for details ‘4. Companies Covered’, p. 20.
2002 // All rights reserved for Stern Stewart & Co. 4

players, achieved the highest operational margin in their segment. In some
cases this strategy allowed for margins of up to five times the average competi-
tor margins.
Evidently there have been constraints on applying this understanding in prac-
tice. We believe that the answer is first to apply a clear value-based business
strategy. Value potential should be the clear focus of the decision-making pro-
cess. As a result, strategic decisions will automatically align with the creation of
value. Given the nature of the business cycle, making the right investments at
the right time is crucial for value creation. This requires a forecast of shifts and
the development of key indicators.
To be better prepared, we further suggest an active financial strategy to take
advantage of opportunities for profitable growth, especially in downturns. A
strategy of more efficient capital use may take advantage of lower acquisition
prices, coupled with an increase in capital discipline, which husbands money
more conscientiously. Investments in downturns can usefully energise man-
agement behaviour, focusing managers intently on maximizing performance.
When the business cycle finally rebounds, the assets are in full bloom and
ready to earn an excess return.
5 2002 // All rights reserved for Stern Stewart & Co.

Table of Contents
1. One Industry Cycle, Varied Value Creation Among Segments ..7
2. Go Against the Flow – Strategic Paths to Value Creation ........10
2.1 Investment Against the Tide ...........................................................11
2.2 Achieving Operational Excellence ..................................................14
3. Conclusion and Outlook .............................................................18
4. Companies Covered ....................................................................21
2002 // All rights reserved for Stern Stewart & Co. 6

1. One Industry Cycle, Varied Value Creation Among Segments
The chemical industry is highly cyclical, showing huge ups and downs both in
operational results and market valuation. The cyclical nature can easily be
traced by looking at the aggregate EVA3 and the aggregate MVA.
The period following the last recession in 1992 can be divided into an expan-
sion period (from 1993 to 1997) and a contraction period (from 1998 until to-
day). Over the last ten years, value creation at the operations level, repre-
sented by aggregate EVA, moved in line with the value created for
shareholders, represented by MVA. Only during the stock market boom at the
end of the millennium, mainly in 1999 and 2000, did the development of chemi-
cals stocks seem to move away from its intrinsic value – a fact mainly driven by
high valuations of hybrid chemical companies with a strong foothold in the
pharmaceutical business. Later this was corrected by a sharp decline in share
prices in 2001.
Until 1999 operative
value creation moved
well in line with the
value created for
shareholders
Exhibit 1: Development of EVA, Total Industry
(1991-2001)
Exhibit 2: Development of MVA, Total Industry
(1991-2001)
Apart from long-term trends, large swings on the demand side as well as on
the supply side impact all the industry participants. However the value created
shifted within the industry. Some sub-segments and players better managed
199219921992199219921992199219921992199219921992199319931993199319931993199319931993199319931993 1994 1994 1994 1994 1994 1994 1994 1994 1994 1994 1994 1994 1995 1995 1995 1995 1995 1995 1995 1995 1995 1995 1995 1995 1996 1996 1996 1996 1996 1996 1996 1996 1996 1996 1996 1996 1997 1997 1997 1997 1997 1997 1997 1997 1997 1997 1997 1997 1998 1998 1998 1998 1998 1998 1998 1998 1998 1998 1998 1998199919991999199919991999199919991999199919991999 2000 2000 2000 2000 2000 2000 2000 2000 2000 2000 2000 2000 2001 2001 2001 2001 2001 2001 2001 2001 2001 2001 2001 2001
TEUR TEUR 70,00070,000
1991 1992 1993 1994 1995 1996 1997 1998 1999 2000 2001991 1992 1993 1994 1995 1996 1997 1998 1999 2000 200 1 1
Total MVATotal MVA Chemical Industry Chemical Industry (1991 (1991 – – 2001) 2001)
1,000 1,000 2,000 2,000 TEURTEUR
-- 1,000 1,000 00
-- 5,000 5,000
-- 2,000 2,000 -- 3,000 3,000 -- 4,000 4,000
1991 1992 1993 1994 1995 1996 1997 1998 1999 21991 1992 1993 1994 1995 1996 1997 1998 1999 2 000 2001 Contraction Expansion
Total EVA Total EVA Chemical Industry Chemical Industry (1991(1991––2001) 2001) 60,00060,000
50,00050,000
40,00040,000
30,00030,000
20,00020,000
10,00010,000
00
--10,00010,000
--20,00020,000
3 EVA®, Economic Value Added: measures the periodic operational value created by deducting the cost of capital
from the net operating profit after taxes (NOPAT).
7 2002 // All rights reserved for Stern Stewart & Co.

risks and opportunities compared to others and were more successful in con-
vincing investors of the underlying potential of their businesses.
The chemical industry is highly fragmented and heterogeneous. The world’s
ten biggest chemical companies accounted for only 13% of the world’s chemi-
cals production in 2000. Chemical companies in Western Europe account for
approximately 32% of the worldwide chemical market volume. The industry’s
heterogeneous environment is mainly due to the fact that it supplies virtually all
sectors of the economy. Products may serve as intermediates for further indus-
trial processes, or may be used in the environment, health care or nutrition
segments. Despite fragmentation at a company level, going down to product
level reveals a much higher degree of concentration.
To correctly take the industry’s economics into account, we investigated devel-
opments in five segments:4
Analysing develop-
ments in
five segments
>> Conglomerates: chemical companies of
hybrid nature, engaged in various chemical
fields - from basic chemicals to pharmaceu-
ticals (companies with sales in the pharma-
ceutical business exceeding 50% were ex-
cluded from the study).
>> PPP: companies engaged mainly as
producers of plastic and polymer related
products.
>> Industrial Gases: companies whose
main business is to manufacture and sell
gases for large industries, electronics, or
the healthcare business.
>> Speciality Chemicals: industry partici-
pants focusing on high value added ser-
vices and selling chemical products for their
specific functionality or performance (usu-
ally in small quantities).
>> Petrochemicals: companies focusing on
base chemicals and oil derivatives – mainly
divisions of international oil & gas compa-
nies.
4 The assignment to segments of all companies covered is listed in chapter 5.
2002 // All rights reserved for Stern Stewart & Co. 8

Each of these sectors shows, in addition to general characteristics of the indus-
try, distinct segment features such as variations in sales volume, profitability, or
growth dynamics. Operative value creation, in combination with investors’ ex-
pectations of future performance, influences the total value created for share-
holders.
Shift of value creation
within the industry –
some sub-segments
were better able to
manage risks and op-
portunities
Exhibit 3: Share of segment sales as a percentage
of total industry sales volume (1997-2001)5
Exhibit 4: Share of segment FGV as a percentage of
total industry FGV (1997-2001)
A comparison between relative segments’ sales and relative expectation pre-
miums reflected in chemicals segments’ share prices (measured by Future
Growth ValueTM - FGVTM)6 clearly shows a shift of investors’ confidence away
from speciality chemicals. Companies in this segment accounted for nearly
60% of the industry’s total Future Growth Value7 in 1997. However, this pre-
mium shrank to about 12% at the end of 2001. At the same time, the segment
sales relative to total industry sales were quite stable. Industrial gas companies
managed to keep a high expectation level, given their relatively low sales.
Companies producing mainly plastics and polymer related products raised their
FGV. However, their valuations still remain low.
0%0%
10% 10% 20% 20% 30% 30% 40% 40% 50% 50% 60% 60% 70% 70% 80% 80% 90% 90%
100% 100%
19971997 1998 1998 19991999 2000 2000 2001 2001 Spec ality ChemicalsiPPP
Industrial Gases Conglomerates
-- 10% 10%
Segm
ent F
GV
rela
tive
to to
tal i
ndus
try
Segm
ents
ales
rela
tive
to to
tali
ndus
try
2001 2001 1999 1999 2000 2000 Industrial Gases Conglomerates
1997 1997 1998 1998 Spec ality Chemicals iPPP PPP
0%0% - 10% - 10%
10% 10% 20% 20% 30% 30% 40% 40% 50% 50% 60% 60% 70% 70% 80% 80% 90% 90%
100% 100%
5 Industry defined as sum of companies covered. 6 Future Growth Value™ (FGV™) measures the value of expected improvements in EVA from this point forward.
It represents the portion of market value not determined by a company’s current operational performance. 7 Excluding petrochemical companies, as they are mainly part of Oil & Gas Companies, and not separately listed.
9 2002 // All rights reserved for Stern Stewart & Co.

2. Go Against the Flow – Strategic Paths to Value
Creation Strategic decisions have to ensure that business continuously creates an ap-
propriate amount of value. In our view, any strategic decision-making process
should therefore be the result of a deep understanding of the underlying value
potentials of the industry, followed by a clear recognition of and response to
opportunities and challenges as they arise.
Every business decision should be driven by two main levers of value creation:
on the one hand the efficiency of existing operations and on the other hand
profitable growth. There are infinite combinations of operating efficiency –
measured by EVA spread8 – and growth – measured by invested capital. Each
combination leads to a specific level of periodic value creation or EVA9. Any
incremental investment that results in a positive EVA spread is profitable
growth. Notwithstanding, to better identify the industry’s actual ability to create
value we independently analysed the core forces driving the two levers.
Analysing the two
main levers of value
creation: operating
efficiency and
profitable growth
start
goal
22
Return
-
Spread
11
start
goal
21
Invested Capital
EVA
Spr
ead
12
Exhibit 5: Strategic Value Matrix
iso value lines
8 Operating efficiency or EVA Spread is defined as Return on Invested Capital (ROIC) above the Cost of Capital
(WACC), in technical terms [ROIC – WACC]. 9 EVA in technical terms is defined as [ROIC – WACC] x Invested Capital
2002 // All rights reserved for Stern Stewart & Co. 10
2.1 Investment Against the Tide
Industry cycles, including those within the chemical industry, are driven by two
main forces. In terms of demand, since the buyers’ businesses tend to be cy-
clical, products are affected by big changes in prices. On the supply side, when
economies of scale are large and demand is falling, overcapacity puts prices
even more under pressure, resulting finally in collapse.
Knowing this, it is surprising that consensus earnings forecasts for cyclical
companies ignore the cyclicity. Regardless of whether the cycle is at the top or
at the bottom, forecasts show upward trends. Also, managers often misinter-
pret investing opportunities, causing even more cyclicity. Taking a deeper view
inside companies based on cyclical business models often shows that they
commit heavily to investments when market prices are solid. In addition, the
companies are flush with cash at the top of the cycle, so external funding re-
quirements are slim. Capital expenditures when prices are high often send
wrong signals to the market. This tells the market that the future looks bright.
That leads analysts to higher forecasts, which confirms managers in their deci-
sion to invest.
However, at the same time competitors are also approving their own capital
programs. What results when the investments are operational is that capacity
soars ahead of demand and prices collapse. Awareness of this focuses atten-
tion on the timing of major capital spending projects.
Companies facing
cyclical business
models often show
that they commit to
heavy investments
when market prices
are solid
11 2002 // All rights reserved for Stern Stewart & Co.

Definition of capital
expenditure
For the analysis, the definition of capital
expenditure includes investments in
property, plant and equipment (PP&E) as
well as expenditures in acquiring other
companies. Being a major part of economic
assets R&D expenses were considered,
too: For this purpose, R&D expenses were
added back to the profit figure and were
capitalized and depreciated over their use-
ful life. To relate total capital expenditure to
the size of the sample companies, every
number had to be standardized by the total
capital invested of the company – first for
the expansion phase in 1992, second in
1997, which was the recent high of the last
cycle before contraction.
The adjusted numbers have been classified
into three groups: High, medium and low in-
vestment behaviour (each in comparison to
average total capital). For each group, value
creation was calculated by measuring cumu-
lated average EVA spreads for the years 1993
to 1997 and 1998 to 2001. To compare value
creation with capital expenditure, the results
have been classified as well: high value crea-
tion with an average cumulative excess return
of more than 6.7%, medium value creation as
2.4% to 6.7%, and low value creation with
excess returns of less than 2.4%.
The results of the analysis are a heavy slap in the face to many companies that
have focused in investment cutting programs in times of an economic slow-
down. Companies that invested more capital at the bottom of the last cycle
performed much better than other companies. In fact, our value proposition is
that cumulative excess returns of companies that made high investments at the
bottom of the cycle are significantly higher than those of companies that con-
centrated on conserving capital during tough periods (exhibit 6). Why is that?
The more companies
invested at the bottom
of the cycle the more
they performed better
during the following
upswing
Exhibit 6: Value Creation depending on investment
timing (bundles of companies in expansion phase)
Exhibit 7: Value Creation depending on investment
timing (bundles of companies in contraction phase)
High
Middle
Low
Low Middle High
High
Middle
Low
Low Middle High
Total Capital Expenditure & R&D 1997
Cum
ulat
ive
Del
ta E
VA S
prea
d 19
98 -
2001
High
Middle
Low
Low Middle High
High
Middle
Low
Low Middle High
Total Capital Expenditure & R&D 1997
Cum
ulat
ive
Del
ta E
VA S
prea
d 19
98 -
2001
High
Middle
Low
Low Middle High
High
Middle
Low
Low Middle High
High
Middle
Low
Low Middle High
High
Middle
Low
Low Middle High
Cum
ulat
ive
Del
ta E
VA S
prea
ds 1
993-
1997
Total Capital Expenditure & R&D 1992
High
Middle
Low
Low Middle High
High
Middle
Low
Low Middle High
High
Middle
Low
Low Middle High
High
Middle
Low
Low Middle High
Cum
ulat
ive
Del
ta E
VA S
prea
ds 1
993-
1997
Total Capital Expenditure & R&D 1992
2002 // All rights reserved for Stern Stewart & Co. 12

Investments are not
expected to create
value when they are
not timed right.
The opposite of the first value proposition (contraction phase, exhibit 7) implies
that companies with active investment behaviour at the top of cycle create less
value. Although this still holds true for more than half of the sample companies,
the picture is not as homogenous as it is in the economic upswing. On the one
hand there is a group of companies that invests less at the top of the cycle but
does have poor value creation. On the other hand there are still companies
with a distinctive value strategy that invest at the peak of a cycle and still create
value. This group of companies manages to invest only capital that is allocated
with a positive EVA spread. Value drivers that are addressed by looking at
capital expenditure therefore have to be complemented by the second compo-
nent of value creation, profitability. These players therefore achieve a high level
of “operational excellence”, which will be described later.
Why did companies that invested more capital at the bottom of the last cycle
perform much better than other companies? First of all, companies that are
relatively capital intensive are more affected by cyclicity than companies that
are relatively less capital intensive. Therefore a company should have already
invested at the beginning of an upswing. Second, capital expenditures in the
chemical industry require a considerable time period to reach full productivity.
Investments that are made at the bottom of the cycle become fully operational
in the middle of the following upswing. A company that timed investments at
the cycle bottom creates an ‘asset base’ to create value while all the other
companies still suffer from the last downturn. These companies missed the
chance to gain high economic profits because they have shortened their ex-
penditures. Third, suppliers of plant constructions are also having difficulties
when the cycle turns down and are probably more willing to accept lower nego-
tiated prices at the bottom of the cycle. This argument is also valid in the case
of growth by acquisition. Prices for acquired companies are much lower at the
bottom of the cycle than they are at the peak. Finally, the cash constraints of-
ten faced at the bottom of the cycle serve as a natural deterrent to unneces-
sary overspending. When cash is plentiful, human nature leads one to supple-
ment what is needed. Only the best and most expensive seems good enough
to fulfill all needs. At the bottom of the cycle, spending has to face very restric-
tive cash constraints.
13 2002 // All rights reserved for Stern Stewart & Co.
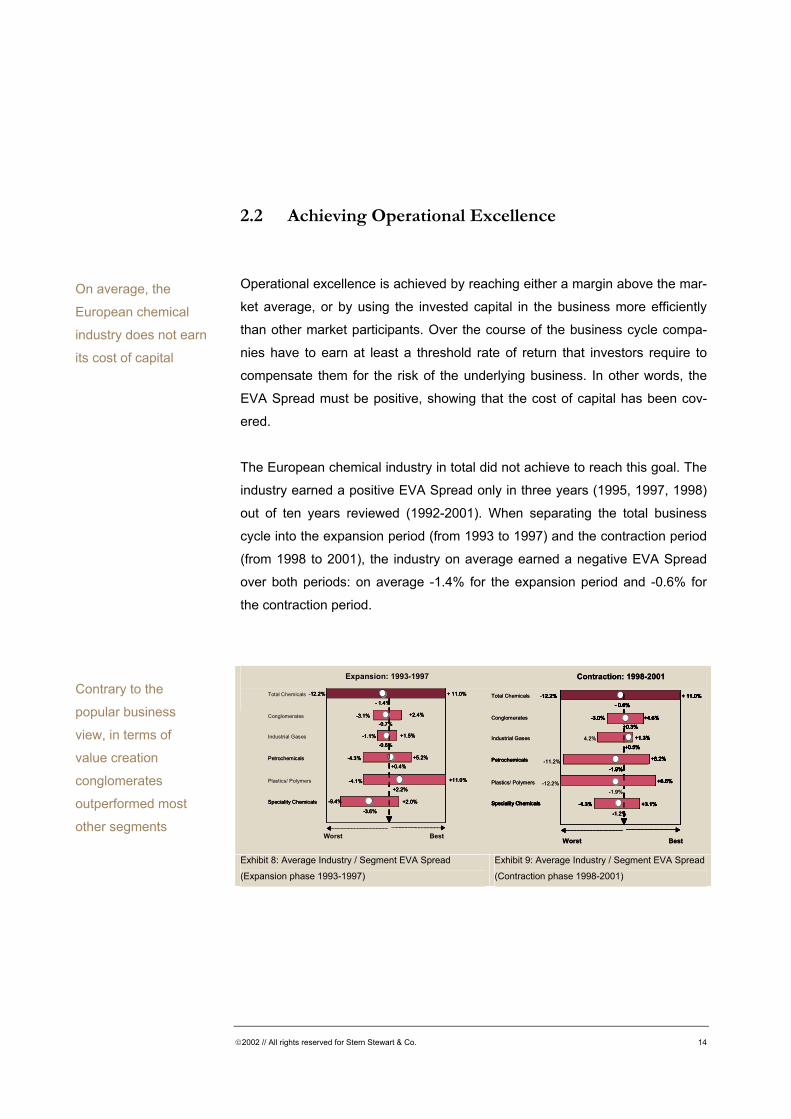
2.2 Achieving Operational Excellence
Operational excellence is achieved by reaching either a margin above the mar-
ket average, or by using the invested capital in the business more efficiently
than other market participants. Over the course of the business cycle compa-
nies have to earn at least a threshold rate of return that investors require to
compensate them for the risk of the underlying business. In other words, the
EVA Spread must be positive, showing that the cost of capital has been cov-
ered.
The European chemical industry in total did not achieve to reach this goal. The
industry earned a positive EVA Spread only in three years (1995, 1997, 1998)
out of ten years reviewed (1992-2001). When separating the total business
cycle into the expansion period (from 1993 to 1997) and the contraction period
(from 1998 to 2001), the industry on average earned a negative EVA Spread
over both periods: on average -1.4% for the expansion period and -0.6% for
the contraction period.
Contrary to the
popular business
view, in terms of
value creation
conglomerates
outperformed most
other segments
Exhibit 8: Average Industry / Segment EVA Spread
(Expansion phase 1993-1997) Exhibit 9: Average Industry / Segment EVA Spread
(Contraction phase 1998-2001)
On average, the
European chemical
industry does not earn
its cost of capital
Speciality Chemicals -9.4%
- 1.4% 12.2% + 11.0%
- 3.1% +2.4%
- 1.1% +1.5% - 4.3% +5.2%
+2.2% - 4.1% +11.0% +2.0%
- 3.6%
- 0.6%
- 0.7%
+0.4%
Speciality Chemicals -9.4%
- 1.4% - 12.2% + 11.0%
- 3.1% +2.4%
- 1.1% +1.5% Petrochemicals - 4.3% +5.2% Plastics/ Polymers
+2.2% - 4.1% +11.0% +2.0%
- 3.6%
- 0.6%
- 0.7%
+0.4%
Expansion: 1993-1997
Speciality Chemicals -9.4%
- 1.4% 12.2% + 11.0%
- 3.1% +2.4%
- 1.1% +1.5% - 4.3% +5.2%
+2.2% - 4.1% +11.0% +2.0%
- 3.6%
- 0.6%
- 0.7%
+0.4%
Total Chemicals Conglomerates
Worst Best
Industrial Gases
-9.4%
- 1.4% - 12.2% + 11.0%
- 3.1% +2.4%
- 1.1% +1.5% Petrochemicals - 4.3% +5.2%
+2.2% - 4.1% +11.0% +2.0%
- 3.6%
- 0.6%
- 0.7%
+0.4% +0.5%
-4.3%
- 0.6%
12.2% + 11.0%
-3.0% +4.6%
+1.3%
-1.9%
+6.2%
+6.6%
+3.1%
-1.2%
+0.3%
+0.5%
-4.3%
- 0.6%
12.2% + 11.0%
-3.0% +4.6%
4.2% +1.3%
-1.9%
+6.2%
+6.6%
+3.1%
-1.2%
+0.3%
+0.5%
-4.3%
- 0.6%
12.2% + 11.0%
-3.0% +4.6%
+1.3%
-1.9%
+6.2%
+6.6%
+3.1%
-
1.9%
+0.3%
+0.5%
-4.3%
- 0.6%
-12.2% + 11.0%
-3.0% +4.6%
+1.3%
-1.9%-11.2% +6.2%
-12.2% +6.6%
+3.1%
-
-
+0.3%
Contraction: 1998-2001
Worst Best
Speciality ChemicalsSpeciality Chemicals
Petrochemicals
Plastics/ Polymers
Speciality Chemicals
Total Chemicals
Conglomerates
Industrial Gases
Petrochemicals
+0.5%
-4.3%
- 0.6%
12.2% + 11.0%
-3.0% +4.6%
+1.3%
-1.9%
+6.2%
+6.6%
+3.1%
-1.2%
+0.3%
+0.5%
-4.3%
- 0.6%
12.2% + 11.0%
-3.0% +4.6%
4.2% +1.3%
-1.9%
+6.2%
+6.6%
+3.1%
-1.2%
+0.3%
+0.5%
-4.3%
- 0.6%
12.2% + 11.0%
-3.0% +4.6%
+1.3%
-1.9%
+6.2%
+6.6%
+3.1%
-
1.9%
+0.3%
+0.5%
-4.3%
- 0.6%
-12.2% + 11.0%
-3.0% +4.6%
+1.3%
-1.9%-11.2% +6.2%
-12.2% +6.6%
+3.1%
-
-
+0.3%
Contraction: 1998-2001
Worst Best
Speciality ChemicalsSpeciality Chemicals
Petrochemicals
Plastics/ Polymers
Speciality Chemicals
Total Chemicals
Conglomerates
Industrial Gases
Petrochemicals
2002 // All rights reserved for Stern Stewart & Co. 14

Looking at the industry’s segments the picture is quite mixed: both conglomer-
ates and industrial gases outperformed the overall industry in the expansion as
well as in the contraction periods (conglomerates achieved an average EVA
spread of -0.7% and +0.3%, and industrial gases -0.6% and +0.5%, respec-
tively). Due to a less cyclical nature, conglomerates with stakes in the pharma-
ceutical business did even better in the contraction period (+0.4%). This stands
in sharp contrast to the development of companies engaged mainly in the spe-
ciality chemicals segment, which underperformed the total industry during both
parts of the cycle (-3.6%, -1.2% respectively). In general we could not prove a
less than average cyclicity of the speciality chemicals business. Petrochemi-
cals and companies in the polymer and plastic business profited above aver-
age during the expansion phase, even reaching a positive spread over this
period, but dipped deep down into negative realms during the second part of
the cycle.
Highly capital-intensive manufacturers like basic chemicals earn much lower
margins than more knowledge-driven segments such as pharmaceuticals or
speciality chemicals. Thus, the more companies are facing a commodity busi-
ness, the more attention has to be directed to capital efficiency. In general:
strategies that consistently lead towards a core activity, where companies ei-
ther act as key players or where they are niche players, lead to a higher spread
and therefore higher operational value creation in a segment.
Companies that moved away from being a pure chemical player achieved the
highest margin, on average exceeding those of the overall industry by more
than 1.5% during the contraction period. Lonzagroup, for instance, has a mixed
portfolio of chemical and pharmaceutical activities and acts as a supplier to the
life science industry. Such knowledge-driven companies earn after-tax margins
of more than 20% even though, or probably because, personnel costs top the
industry average by nearly 10%. Players in this field have to win the so-called
war for talent to stay competitive, and must offer attractive opportunities to
people looking for challenges.
Although the pharmaceutical business in general shows higher margins than
the basic chemicals segment, operating in this growing segment is not the only
way to success. The German conglomerate BASF divested its pharmaceutical
Focus on core
competencies:
modus vivendi even
for conglomerates
15 2002 // All rights reserved for Stern Stewart & Co.

A success story of
value creation in the
highly competitive
PPP segment
business in 2000, after realizing that it lacked the necessary size to succeed in
this research-intensive segment. However, over both the expansion and con-
traction phases it reached a positive EVA Spread and demonstrated above
average operational performance. This was achieved by expanding less cycli-
cal segments like agrochemicals or gases, or by reaching a cost or technologi-
cal leadership position in more cyclical segments, such as polymer-related
products or fibres. Due to its ‘Verbund’ production, BASF is not forced to buy
all of its raw materials and intermediates on the world markets. Staying more
independent from world market prices has enabled BASF to reach an average
(pre-tax) margin in the cyclical plastics business as much as 2.1% higher than
the average margins of competitors in this field during the contraction period.
EVC, Europe’s largest producer of PVC-related products, shows how difficult it
is to earn an adequate return in the highly cyclical plastics business. The com-
pany did not earn a return exceeding its cost of capital from 1992 until 2001. Its
pre-tax return in its polymer-segment was positive only in 1995.
In contrast to EVC and despite the difficulties of the polymer-related segment,
Swiss player EMS Chemie achieved the highest average EVA Spread (+11.0%
in expansion, +6.6% in contraction), as well as the highest average margin of
all European chemical companies studied. Continuously reshaping its product
portfolio and putting a focus on high-grade and sophisticated products with a
strong market position created the foundation for EMS’ leadership position.
Furthermore its qualification as system provider for the automobile industry
allows EMS to propose ways to increase revenue or reduce total costs to its
customers and enjoy for itself some of the additional value created. This strat-
egy allowed for average (after-tax) margins of +21.3% during the contraction
period, which is quite remarkable given average after-tax margins in the PPP
segment of about +4.6% for this period. This leadership in profitability gives
access to another value opportunity – anti-cyclical growth. Fuelled by strong
operational performance the company continued to grow even stronger during
the contraction phase of the business cycle, and strengthened its position as
system provider to the automobile industry with several acquisitions.
2002 // All rights reserved for Stern Stewart & Co. 16

Exhibit 10: Operational performance 1993-1997: EMS
versus Polymer Related Product Segment 10
Exhibit 11: Operational performance 1998-2001: EMS
versus Polymer Related Product Segment10
Shareholders reward
efficient resource
management. Capital-
intensive segments
have to strive for a
high efficiency of
capital invested
Due to EMS’ engagement in segments such as fine chemicals and engineer-
ing, both showing considerably lower capital efficiency, EMS lags the PPP
segment’s average capital efficiency (measured by working capital turnover
and total capital turnover). Still, the company’s cutting edge margins easily
compensate for the less efficient use of its capital employed. However, im-
provement of capital efficiency clearly may be a driver of EMS’ future value
creation.
Especially in areas prone for overcapacity, such as the petrochemicals seg-
ment or basic chemicals, capital efficiency is an important lever for operating
excellence. This holds especially true for the industry’s most capital-intensive
sub-segment, the industrial gas sector. Air Liquide leads the sub-segment in
the efficient use of invested capital. After the massive capacity additions of the
past years, increased capital efficiency and active portfolio management will be
of increasing importance in this segment in the future. This can also be en-
hanced by further concentration on less capital-intensive client portfolios in the
industrial gas segment, such as the health care or service segments. Air Liq-
uide demonstrates that operational excellence consistently shows up in a
higher valuation. The company was, on average over the contraction period,
worth about 1.9 times the invested capital, compared to an average valuation
of peer companies of 1.5 over this period.
Expansion: 1993-1997
-3.3%
0.6x
1.8x
-4.9%
Polymer Polymer Polymer Polymer Polymer Polymer Related Product Related Product Related Product Related Product Related Product Related Product Segment (PPP) Segment (PPP) Segment (PPP) Segment (PPP) Segment (PPP) Segment (PPP) ------EMSEMSEMSEMSEMSEMSAverage Average Average Average Average Average
+ 11.0% + 11.0% + 11.0% + 11.0% + 11.0% Worst Worst Worst Worst Worst Worst
-12.2% BestBestBestBestBestBest
+24.3% +24.3% +24.3% +24.3% +24.3% +24.3% +4.6% +4.6% +4.6% +4.6% +4.6% +4.6% 8.5x 8.5x 8.5x 8.5x 8.5x 8.5x 5.8x 5.8x 5.8x 5.8x 5.8x 5.8x 1.9x 1.9x 1.9x 1.9x 1.9x 1.9x 1.3x 1.3x 1.3x 1.3x 1.3x 1.3x +23.3% +23.3% +23.3% +23.3% +23.3% +23.3% 12.4%12.4%12.4%12.4%12.4%12.4%
------ 1.9% 1.9% 1.9% 1.9% 1.9% 1.9% + 6.6% + 6.6% + 6.6% + 6.6% + 6.6% +21.3% +21.3% +21.3% +21.3% +21.3% +21.3%
2.3x 2.3x 2.3x 2.3x 2.3x 2.3x
Segment (PPP)Segment (PPP)Segment (PPP)Segment (PPP)Segment (PPP)Segment (PPP)------ Related Product Related Product Related Product Related Product Related Product Related Product Polymer Polymer Polymer Polymer Polymer PolymerEMS EMS EMS EMS EMS EMS Average Average Average Average Average Average
+8.9%+8.9%+8.9%+8.9%+8.9%+8.9%
+ 2.2% + 2.2% + 2.2% + 2.2% + 2.2% + 2.2%
+1.5% +1.5% +1.5% +1.5% +1.5% +1.5% 0.8x 0.8x 0.8x 0.8x 0.8x 0.8x
+1.2%+1.2%+1.2%+1.2%+1.2%+1.2% +23.3% +23.3% +23.3% +23.3% +23.3% +23.3% ------ 3.3% 3.3% 3.3% 3.3% 3.3% 3.3% 1.3x 1.3x 1.3x 1.3x 1.3x 1.3x 1.9x 1.9x 1.9x 1.9x 1.9x 1.9x 0.6x 0.6x 0.6x 0.6x 0.6x 0.6x
4.3x4.3x4.3x4.3x4.3x4.3x 8.5x 8.5x 8.5x 8.5x 8.5x 8.5x 1.8x 1.8x 1.8x 1.8x 1.8x 1.8x +24.3%+24.3%+24.3%+24.3%+24.3%+24.3 ------ 4.9% 4.9% 4.9% 4.9% 4.9% 4.9%
Best Best Best Best Best Best + 11.0% + 11.0% + 11.0% + 11.0% + 11.0% + 11.0% ------ 12.2% 12.2% 12.2% 12.2% 12.2% 12.2%
Worst Worst Worst Worst Worst Contraction: 1998-2001 .EVA.EVA.EVA.EVA.EVA.EVA - - - - - - Spread Spread Spread Spread Spread Spread AvgAvgAvgAvgAvgAvg
NOPAT-Margin
Working Working Working Working Working Working CTurnover CTurnover CTurnover CTurnover CTurnover CTurnover Total Ca tal Total Ca tal Total Ca tal Total Ca tal Total Ca tal Total Ca tal piTurnover piTurnover piTurnover piTurnover piTurnover piTurnover Capital Growth Capital Growth Capital Growth Capital Growth Capital Growth Capital Growth
apital apital apital apital apital apital
17 2002 // All rights reserved for Stern Stewart & Co.
10 NOPAT, Net Operating Profit After Taxes – before costs of financing activities
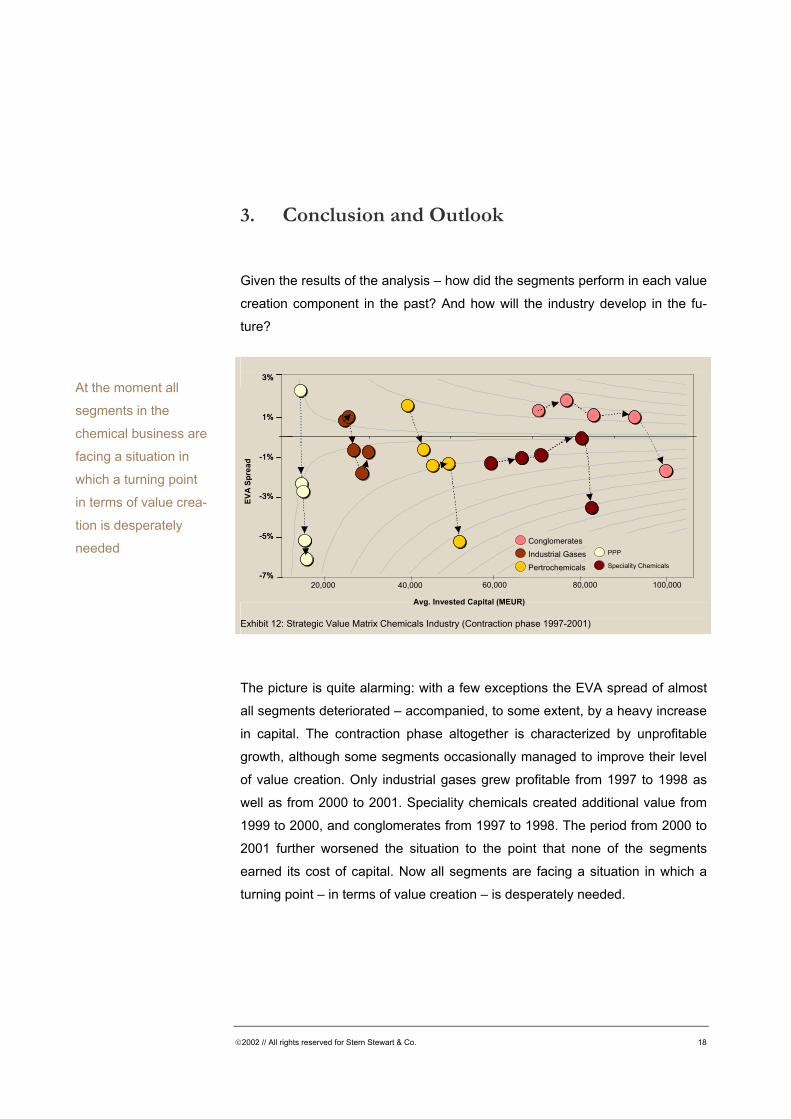
3. Conclusion and Outlook
Given the results of the analysis – how did the segments perform in each value
creation component in the past? And how will the industry develop in the fu-
ture?
At the moment all
segments in the
chemical business are
facing a situation in
which a turning point
in terms of value crea-
tion is desperately
needed
Exhibit 12: Strategic Value Matrix Chemicals Industry (Contraction phase 1997-2001)
The picture is quite alarming: with a few exceptions the EVA spread of almost
all segments deteriorated – accompanied, to some extent, by a heavy increase
in capital. The contraction phase altogether is characterized by unprofitable
growth, although some segments occasionally managed to improve their level
of value creation. Only industrial gases grew profitable from 1997 to 1998 as
well as from 2000 to 2001. Speciality chemicals created additional value from
1999 to 2000, and conglomerates from 1997 to 1998. The period from 2000 to
2001 further worsened the situation to the point that none of the segments
earned its cost of capital. Now all segments are facing a situation in which a
turning point – in terms of value creation – is desperately needed.
EVA
Spre
ad
Conglomerates Industrial GasesPertrochemicals
80,000 100,000
PPP Speciality Chemicals
20,0007% 7% --
5% 5% --
3% 3% --
1% 1% --
1% 1%
3% 3%
Avg. Invested Capital (MEUR) 60,000 40,000
2002 // All rights reserved for Stern Stewart & Co. 18

However, the unpleasant predicament is that nobody really knows for sure at
any given moment whether we are observing a trend or a cycle. In hindsight,
we know when an industrial sector collapsed. When we hit the bottom of the
cycle we just do not ‘know’ if it will ever rebound. An indication of the actual
position within a cycle could be the comparison of average EVA spreads. As
shown in section 2.2 the current average EVA spread (contraction phase) still
is 0.8% above its counterpart of the expansion period. This could be inter-
preted as a warning that the turning point of the cycle may not yet have been
reached – threatening a further downturn of the chemical industry as a whole in
the near future.
There is no secret blueprint for value creation in this industry. But there are a
few very important tasks that management must perform in order to maximise
a company’s potential for creating value in this industry:
Five useful applica-
tions for management
to foster the creation
of value in the
chemical industry
>> React appropriately by identifying nature of cycle: Any company facing
a downturn first of all needs to differentiate between a cyclical slide and a per-
manent trend. If it is cyclical, then some well-positioned investments now could
put the company in a future position of wealth creation. If it is a downward
trend, the first priority is to manage the key operative value drivers in order to
rapidly improve operating performance.
>> Employ an active financial strategy: How to invest when the operating
cash flows are low or even negative? This may be a constraint during a down
cycle, particularly if debt covenants are being violated. But as this analysis has
shown, the companies that have invested at the bottom of the business cycle
did so because of their strategic proposition. They had more cash and had built
a higher debt capacity. This strategy allows continuous investment during
downswings. The aim therefore must be to strive for an optimal capital struc-
ture, which preserves the flexibility to invest. While this may not be part of a
short-term focus, it will pay back in a long-term perspective by creating value.
19 2002 // All rights reserved for Stern Stewart & Co.

>> Implement an early warning system to take advantage of opportuni-ties and manage risks: To recognize shifts in the business environment a
systematic forecasting of key indicators is required. Any appropriate manage-
ment reaction further calls for value-based reporting in all business units as
well as consistent performance monitoring of value drivers and investments.
>> Choose the right value metrics: Measure the profit of all decisions the
way investors do. It sounds simple but until a business returns a profit that is
greater than its total cost – including cost of capital – it destroys value. EVA
(Economic Value Added) is the right measure. EVA is the only financial man-
agement system that provides a common language for employees across all
operating and staff functions and allows all management decisions to be mo-
delled, monitored, communicated and compensated in a single and consistent
way - always in terms of the value added to investor’s investment.
>> Apply a clear value-based business strategy: A value-based strategic
decision-making process is one of decentralized discovery of all value opportu-
nities. Thus, management’s main challenge is to determine value opportunities,
or, economically speaking, the present value of all future EVA, of each strate-
gic direction. This is best done by assessing the possible impact on the two
main levers: operating excellence and invested capital.
2002 // All rights reserved for Stern Stewart & Co. 20
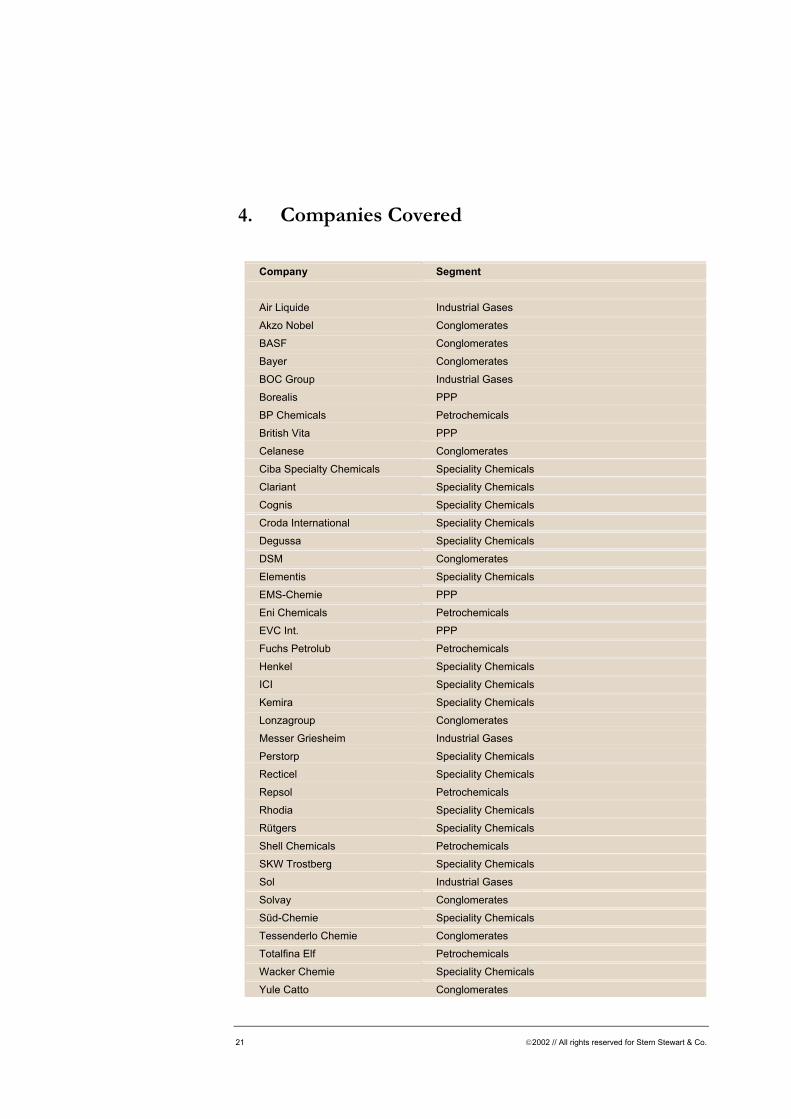
4. Companies Covered
Company Segment Air Liquide Industrial Gases Akzo Nobel Conglomerates BASF Conglomerates Bayer Conglomerates BOC Group Industrial Gases Borealis PPP BP Chemicals Petrochemicals British Vita PPP Celanese Conglomerates Ciba Specialty Chemicals Speciality Chemicals Clariant Speciality Chemicals Cognis Speciality Chemicals Croda International Speciality Chemicals Degussa Speciality Chemicals DSM Conglomerates Elementis Speciality Chemicals EMS-Chemie PPP Eni Chemicals Petrochemicals EVC Int. PPP Fuchs Petrolub Petrochemicals Henkel Speciality Chemicals ICI Speciality Chemicals Kemira Speciality Chemicals Lonzagroup Conglomerates Messer Griesheim Industrial Gases Perstorp Speciality Chemicals Recticel Speciality Chemicals Repsol Petrochemicals Rhodia Speciality Chemicals Rütgers Speciality Chemicals Shell Chemicals Petrochemicals SKW Trostberg Speciality Chemicals Sol Industrial Gases Solvay Conglomerates Süd-Chemie Speciality Chemicals Tessenderlo Chemie Conglomerates Totalfina Elf Petrochemicals Wacker Chemie Speciality Chemicals Yule Catto Conglomerates
21 2002 // All rights reserved for Stern Stewart & Co.


Stern Stewart & Co. Management Consultants Salvatorplatz 4 80333 Munich Germany T +49.89.242071.0 F +49.89.242071.11 E [email protected] I www.sternstewart.de
10 Baker's Yard Baker's Row London EC1R 3DD United Kingdom T +44.20.7713.0088 F +44.20.7713.0099 E [email protected] I www.sternstewart.co.uk
Beijing // Johannesburg // London // Los Angeles // Melbourne // München // Mumbai // New York // Sao Paulo // Shanghai // Singapore // Tokyo