Sterling Fluid Systems (UK) Limited Atlantic Street ...
17
Sterling Fluid Systems (UK) Limited Atlantic Street, Altrincham, Cheshire, England, WA14 5DH Telephone: +44 (0) 161 928 6371 Fax: +44 (0) 161 925 2129 e-mail: [email protected] Members of the Sterling Fluid Systems Group Tate & Lyle Sugars Ltd Thames Refinery Factory Road Solvertown London FAO: Mr Mark Lawrence Date: 1 st September 2011 Reference: Energy Audit Dear Sirs, Thank you for your hospitality shown and the assistance from the Tate & Lyle engineers received when we visited site recently. After careful consideration of your requirements we are convinced that substantial savings are possible regarding the operating costs of your AFFN-AO14 Melter Liquor Pump West and associated pumping system. Investigations have shown that savings in the region of £27,400 per annum can be saved in energy costs alone. Please read the enclosed assessment report that details our findings on site. Service offered is from our Energy Auditing scheme. It provides a framework for reduction of pumping systems Life Cycle Costs, mainly focused on energy and maintenance costs, while improving process reliability. Our aim is to provide an independent and objective consultancy service for pumping systems, without concern for the technology or brands installed. The provided consultancy focuses on the system operation and design rather than the hardware or technology used. This will lead to a real working tool that can be used by anybody to improve systems and operating conditions.
Transcript of Sterling Fluid Systems (UK) Limited Atlantic Street ...
Sterling Fluid Systems (UK) Limited Atlantic Street, Altrincham, Cheshire, England, WA14 5DH Telephone: +44 (0) 161 928 6371 Fax: +44 (0) 161 925 2129 e-mail: [email protected]
Members of the Sterling Fluid Systems Group
Tate & Lyle Sugars Ltd Thames Refinery Factory Road Solvertown London FAO: Mr Mark Lawrence Date: 1st September 2011 Reference: Energy Audit Dear Sirs, Thank you for your hospitality shown and the assistance from the Tate & Lyle engineers received when we visited site recently. After careful consideration of your requirements we are convinced that substantial savings are possible regarding the operating costs of your AFFN-AO14 Melter Liquor Pump West and associated pumping system. Investigations have shown that savings in the region of £27,400 per annum can be saved in energy costs alone. Please read the enclosed assessment report that details our findings on site. Service offered is from our Energy Auditing scheme. It provides a framework for reduction of pumping systems Life Cycle Costs, mainly focused on energy and maintenance costs, while improving process reliability. Our aim is to provide an independent and objective consultancy service for pumping systems, without concern for the technology or brands installed. The provided consultancy focuses on the system operation and design rather than the hardware or technology used. This will lead to a real working tool that can be used by anybody to improve systems and operating conditions.

Sterling-SIHI Have the Power… …To Save Your Energy Somebody recently suggested that Pumps typically account for 20% of a manufacturing plant’s total energy costs, though it could be argued that this percentage is likely to vary (depending on the nature of manufacturing involved). However, most people will agree, that Rota-Dynamic (Centrifugal) Pumps are a MAJOR power consumer. Sterling-SIHI has invested into an understanding of exactly where power is (a) useful - as in 100% efficient, (b) consumed, and (c) wasted through system absorption. Effective use of capital is the key to achieving low costs, and consequently the successful performance of a plant. Pump efficiency is a conventional element of Research & Development, but significant improvements in hydraulic design will still only save a manufacturing site a fraction of its energy bill. A full system approach must be utilised in order to conserve energy. Evidence can be seen within the Sankey diagram below. Full System Approach to Energy Conservation
Sounds easy, doesn’t it? Adopt a full system approach and reap the benefits (efficiency and savings)… However, despite the gains to be had, many manufacturing sites do not adopt energy saving practices. Why? Resources! Researching the plant history, designing a system and selecting components all takes time – not to mention capital expenditure (which needs to be justified). This is exactly why Sterling-SIHI are already working with a number of manufacturing sites, gathering data, taking a joint approach to Whole-System-Savings (WSS) and measuring Key Performance Indicators (KPI’s). Sterling-SIHI’s dedicated team work to the following principles:
1. Define the pumping system’s present duty 2. Establish the real need 3. Investigate where the main points of energy losses exist 4. Reduce energy losses accordingly 5. Fit the supply (pump - and - system) to demand (process)
Underpinned by the Department of Energy in the US, the system approach has proved successful for many years. Here in the UK, The British Pump Manufacturers Association (BPMA) is working with the same model in which to deliver concrete results – which means site savings. Collaborating with Sterling-SIHI not only enables staff to focus on their core duties, it also ensures that investments can be justified by real and reliable data. Moreover, an accurate calculation of ROI (Return on Investment) is made possible, and simple, because all Sterling-SIHI data is supported by time-scales. Additionally, not only does the WSS approach give a pump-using facility the ability to save energy, Sterling-SIHI can demonstrate that it will also improve machine reliability, inventory levels, and overall process efficiency.
Pump System Assessment August 30 & 31st 2011
Tate & Lyle Sugars, Silvertown

Tate & Lyle Sugars is a global provider of distinctive, high quality ingredients and solutions to the food, beverage and other industries. Thames Refinery is one the largest sugar cane refineries in the world. We carried out a pumping system assessment of the melter liquor transfer pump. The assessment team had participants from the plant, the on site energy manager and four independent pump system experts. Assessment Team: Mark Lawrence – Tate & Lyle Energy Manager Mel Everest- Electrician Steve Scofield – BPMA Technical Director Florent Violain – Pump System Expert / LCC Manager Mike Slater – Pump System Expert Alex Onslow – Pump System Expert. The purpose of this assessment was to find energy saving opportunities. The steps recommended in the ASME EA-2 - 2009 pump assessment standard for performing assessments and PSAT (Pump Systems Assessment Tool) were followed. These were:
• Pre-screening
• Identify Systems with opportunities
• Walk-Through of the complete system
• Evaluate System
• Data Gathering
• Quantify Results The Pumping System Opportunities primarily looked at were:
• Throttling Valves
• Oversized Pumps
• Oversized Motors
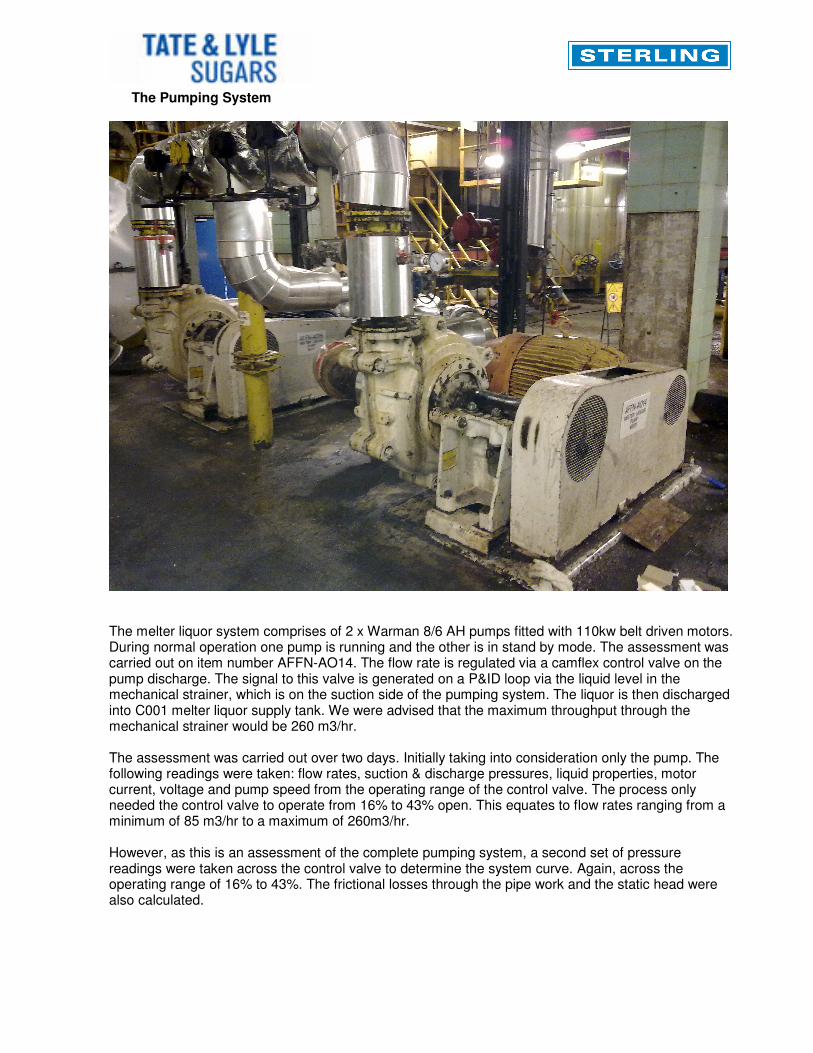
The Pumping System
The melter liquor system comprises of 2 x Warman 8/6 AH pumps fitted with 110kw belt driven motors. During normal operation one pump is running and the other is in stand by mode. The assessment was carried out on item number AFFN-AO14. The flow rate is regulated via a camflex control valve on the pump discharge. The signal to this valve is generated on a P&ID loop via the liquid level in the mechanical strainer, which is on the suction side of the pumping system. The liquor is then discharged into C001 melter liquor supply tank. We were advised that the maximum throughput through the mechanical strainer would be 260 m3/hr. The assessment was carried out over two days. Initially taking into consideration only the pump. The following readings were taken: flow rates, suction & discharge pressures, liquid properties, motor current, voltage and pump speed from the operating range of the control valve. The process only needed the control valve to operate from 16% to 43% open. This equates to flow rates ranging from a minimum of 85 m3/hr to a maximum of 260m3/hr. However, as this is an assessment of the complete pumping system, a second set of pressure readings were taken across the control valve to determine the system curve. Again, across the operating range of 16% to 43%. The frictional losses through the pipe work and the static head were also calculated.
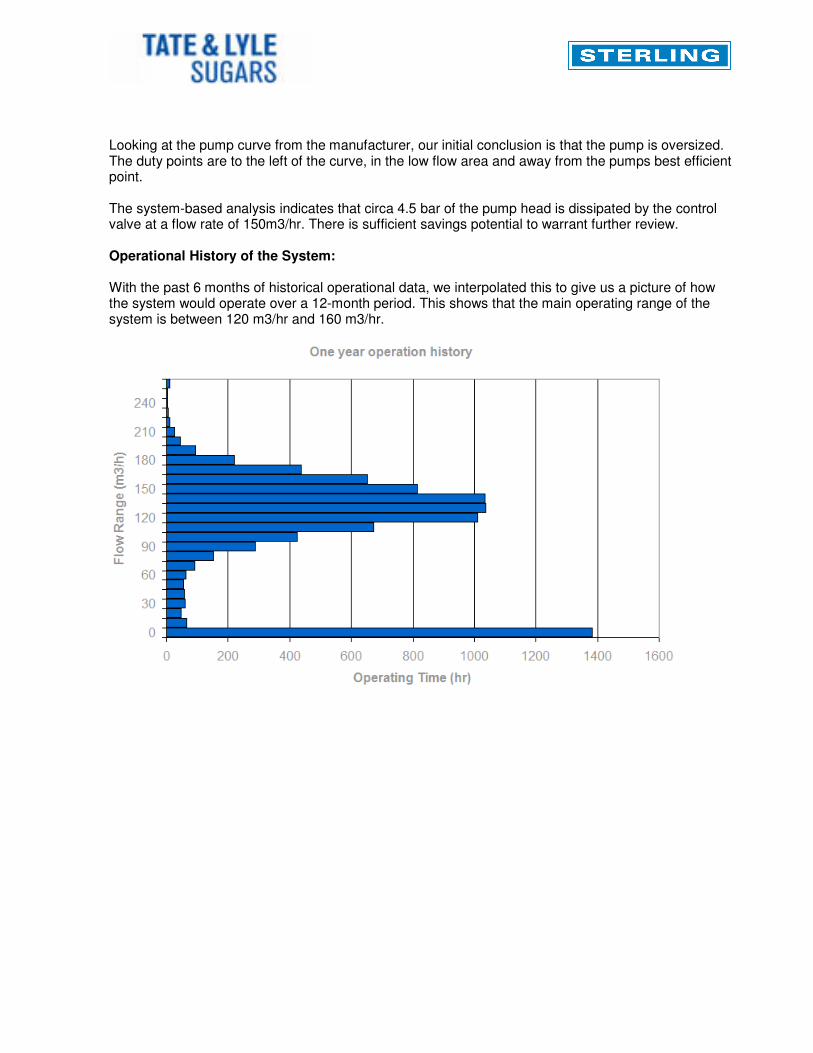
Looking at the pump curve from the manufacturer, our initial conclusion is that the pump is oversized. The duty points are to the left of the curve, in the low flow area and away from the pumps best efficient point. The system-based analysis indicates that circa 4.5 bar of the pump head is dissipated by the control valve at a flow rate of 150m3/hr. There is sufficient savings potential to warrant further review. Operational History of the System: With the past 6 months of historical operational data, we interpolated this to give us a picture of how the system would operate over a 12-month period. This shows that the main operating range of the system is between 120 m3/hr and 160 m3/hr.
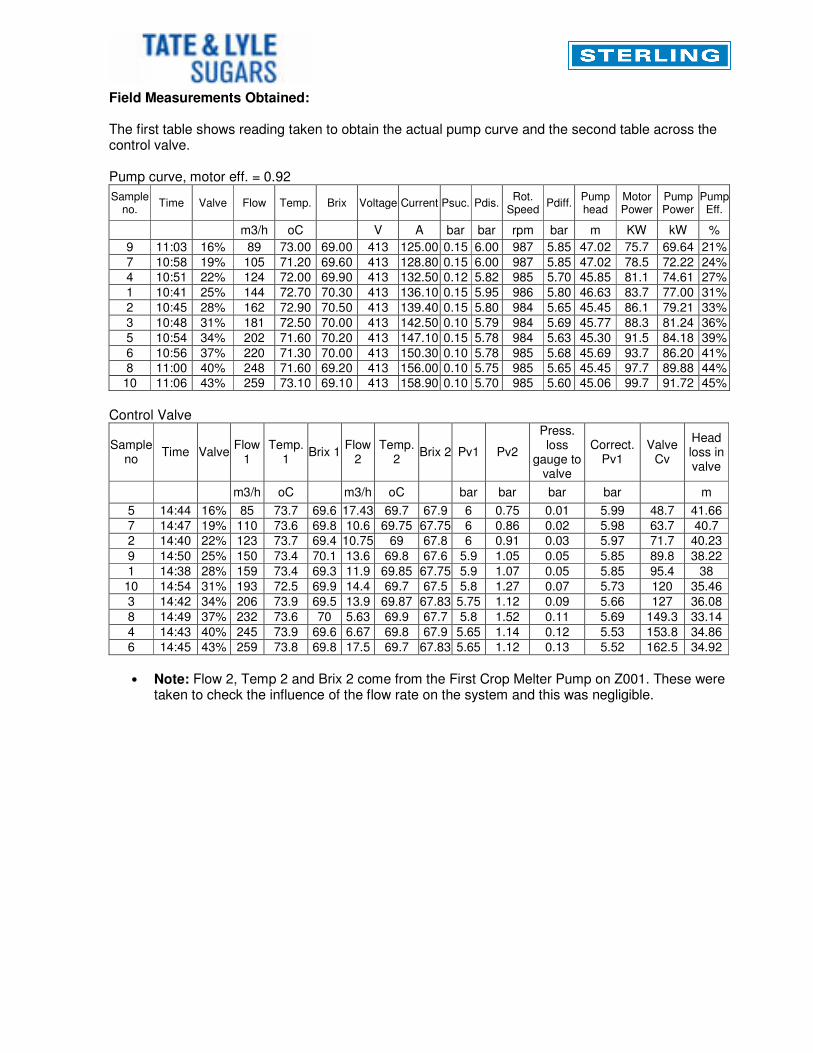
Field Measurements Obtained: The first table shows reading taken to obtain the actual pump curve and the second table across the control valve. Pump curve, motor eff. = 0.92
Sample no.
Time Valve Flow Temp. Brix Voltage Current Psuc. Pdis. Rot.
Speed Pdiff.
Pump head
Motor Power
Pump Power
Pump Eff.
m3/h oC V A bar bar rpm bar m KW kW %
9 11:03 16% 89 73.00 69.00 413 125.00 0.15 6.00 987 5.85 47.02 75.7 69.64 21%
7 10:58 19% 105 71.20 69.60 413 128.80 0.15 6.00 987 5.85 47.02 78.5 72.22 24%
4 10:51 22% 124 72.00 69.90 413 132.50 0.12 5.82 985 5.70 45.85 81.1 74.61 27%
1 10:41 25% 144 72.70 70.30 413 136.10 0.15 5.95 986 5.80 46.63 83.7 77.00 31%
2 10:45 28% 162 72.90 70.50 413 139.40 0.15 5.80 984 5.65 45.45 86.1 79.21 33%
3 10:48 31% 181 72.50 70.00 413 142.50 0.10 5.79 984 5.69 45.77 88.3 81.24 36%
5 10:54 34% 202 71.60 70.20 413 147.10 0.15 5.78 984 5.63 45.30 91.5 84.18 39%
6 10:56 37% 220 71.30 70.00 413 150.30 0.10 5.78 985 5.68 45.69 93.7 86.20 41%
8 11:00 40% 248 71.60 69.20 413 156.00 0.10 5.75 985 5.65 45.45 97.7 89.88 44%
10 11:06 43% 259 73.10 69.10 413 158.90 0.10 5.70 985 5.60 45.06 99.7 91.72 45%
Control Valve
Sample no
Time Valve Flow
1 Temp.
1 Brix 1
Flow 2
Temp. 2
Brix 2 Pv1 Pv2
Press. loss
gauge to valve
Correct. Pv1
Valve Cv
Head loss in valve
m3/h oC m3/h oC bar bar bar bar m
5 14:44 16% 85 73.7 69.6 17.43 69.7 67.9 6 0.75 0.01 5.99 48.7 41.66
7 14:47 19% 110 73.6 69.8 10.6 69.75 67.75 6 0.86 0.02 5.98 63.7 40.7
2 14:40 22% 123 73.7 69.4 10.75 69 67.8 6 0.91 0.03 5.97 71.7 40.23
9 14:50 25% 150 73.4 70.1 13.6 69.8 67.6 5.9 1.05 0.05 5.85 89.8 38.22
1 14:38 28% 159 73.4 69.3 11.9 69.85 67.75 5.9 1.07 0.05 5.85 95.4 38
10 14:54 31% 193 72.5 69.9 14.4 69.7 67.5 5.8 1.27 0.07 5.73 120 35.46
3 14:42 34% 206 73.9 69.5 13.9 69.87 67.83 5.75 1.12 0.09 5.66 127 36.08
8 14:49 37% 232 73.6 70 5.63 69.9 67.7 5.8 1.52 0.11 5.69 149.3 33.14
4 14:43 40% 245 73.9 69.6 6.67 69.8 67.9 5.65 1.14 0.12 5.53 153.8 34.86
6 14:45 43% 259 73.8 69.8 17.5 69.7 67.83 5.65 1.12 0.13 5.52 162.5 34.92
• Note: Flow 2, Temp 2 and Brix 2 come from the First Crop Melter Pump on Z001. These were
taken to check the influence of the flow rate on the system and this was negligible.
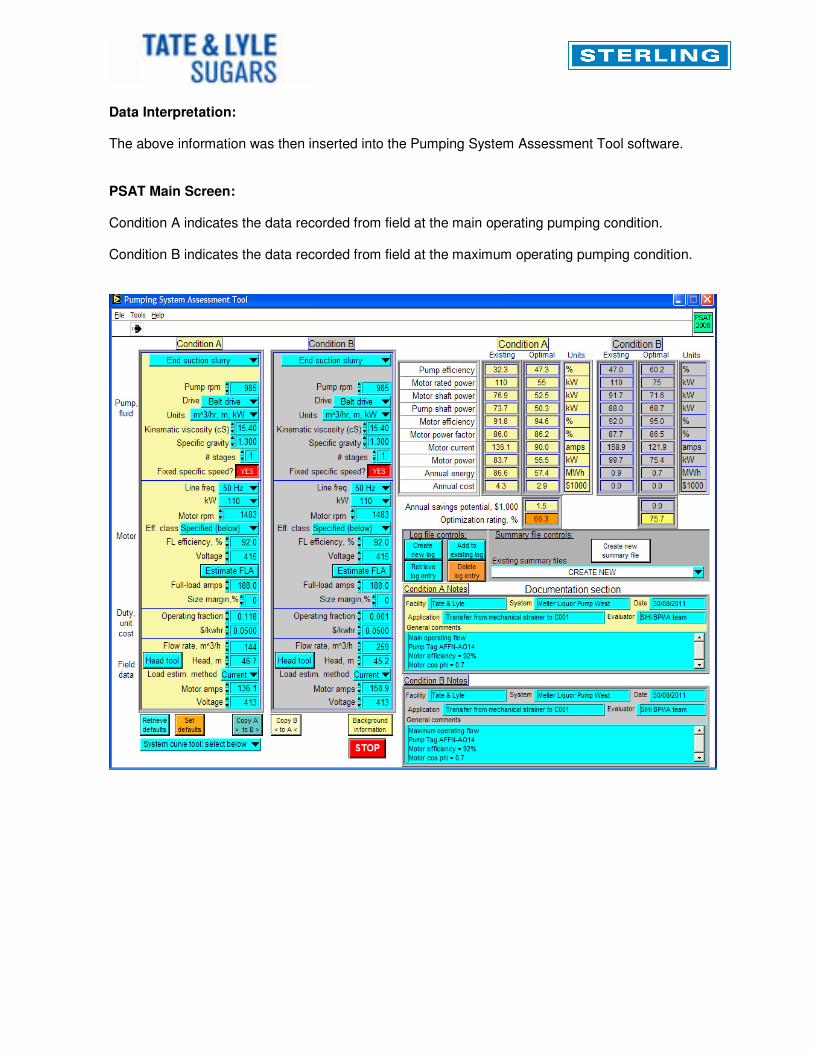
Data Interpretation: The above information was then inserted into the Pumping System Assessment Tool software.
PSAT Main Screen: Condition A indicates the data recorded from field at the main operating pumping condition. Condition B indicates the data recorded from field at the maximum operating pumping condition.
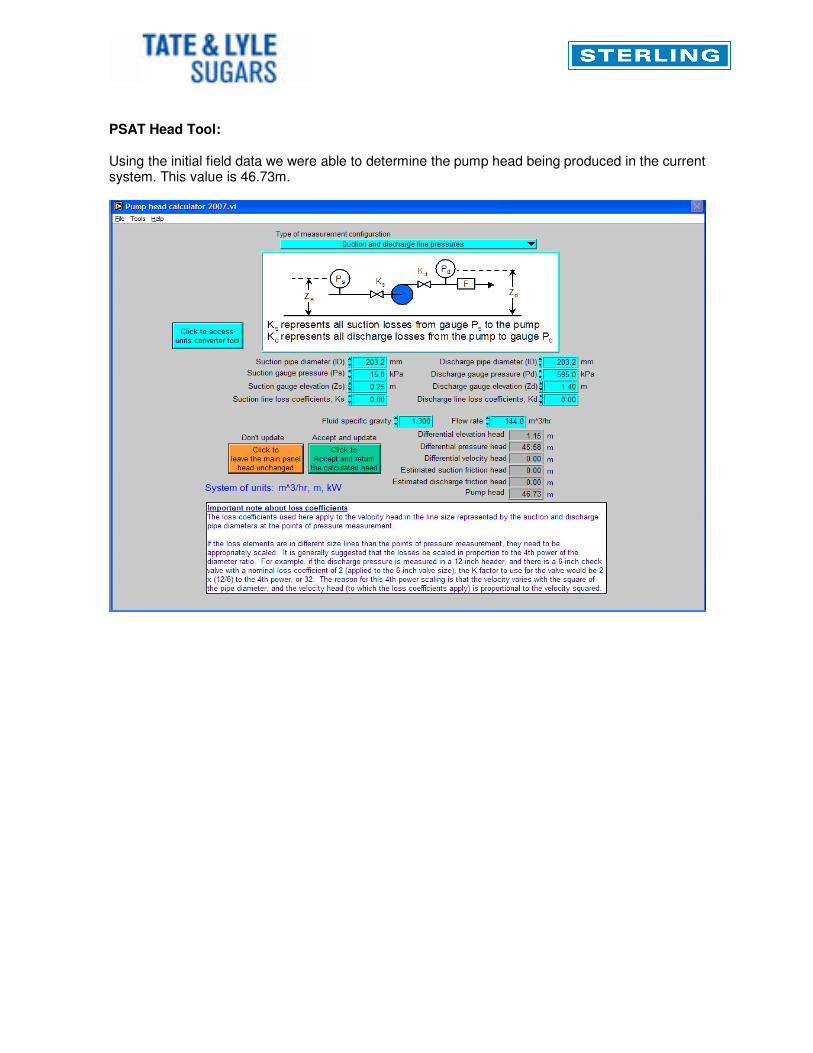
PSAT Head Tool: Using the initial field data we were able to determine the pump head being produced in the current system. This value is 46.73m.
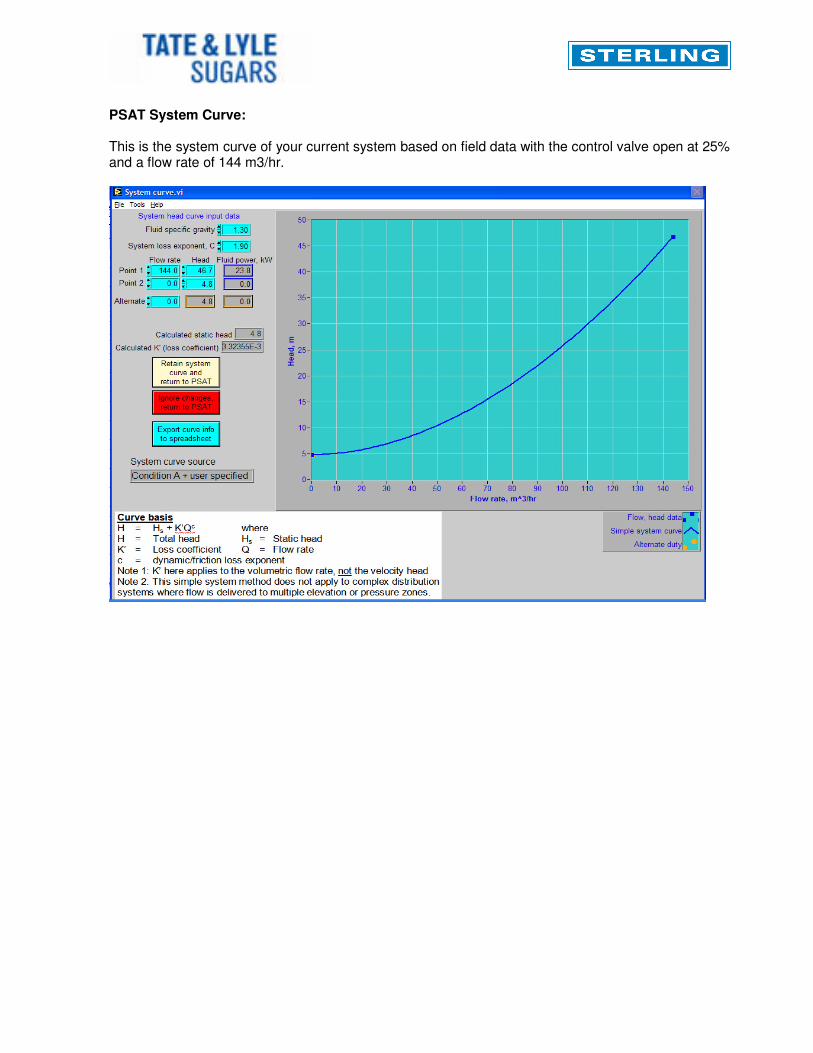
PSAT System Curve: This is the system curve of your current system based on field data with the control valve open at 25% and a flow rate of 144 m3/hr.
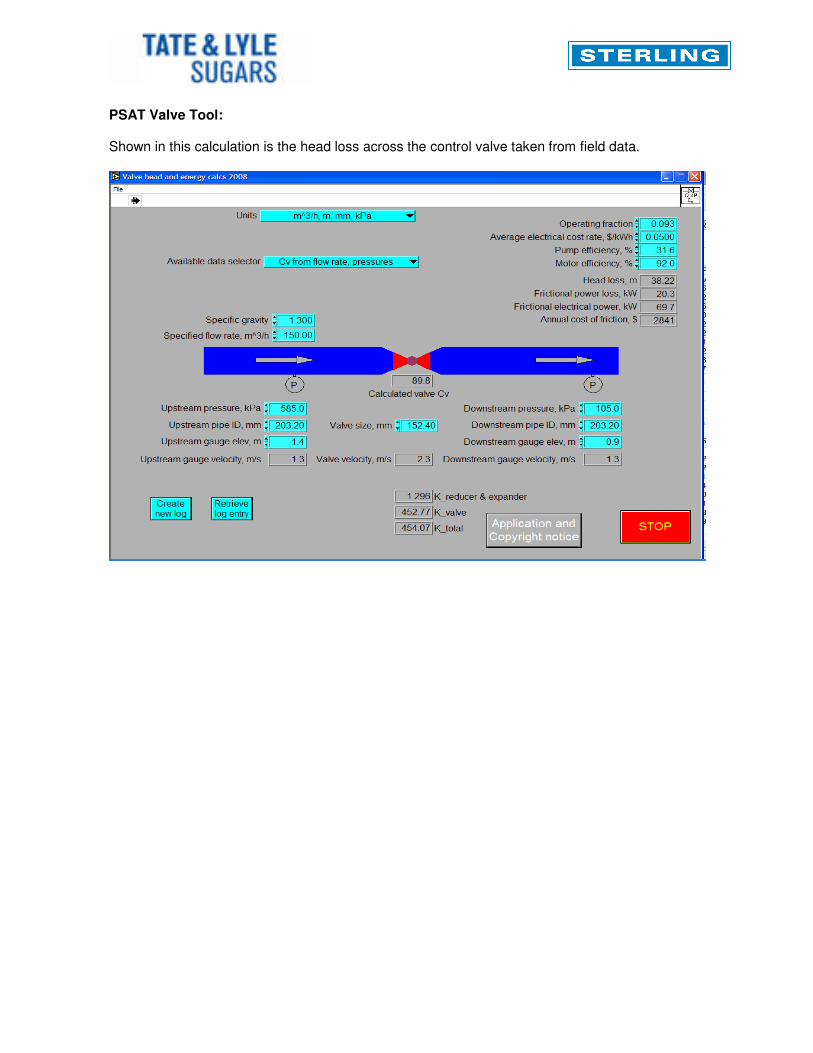
PSAT Valve Tool: Shown in this calculation is the head loss across the control valve taken from field data.
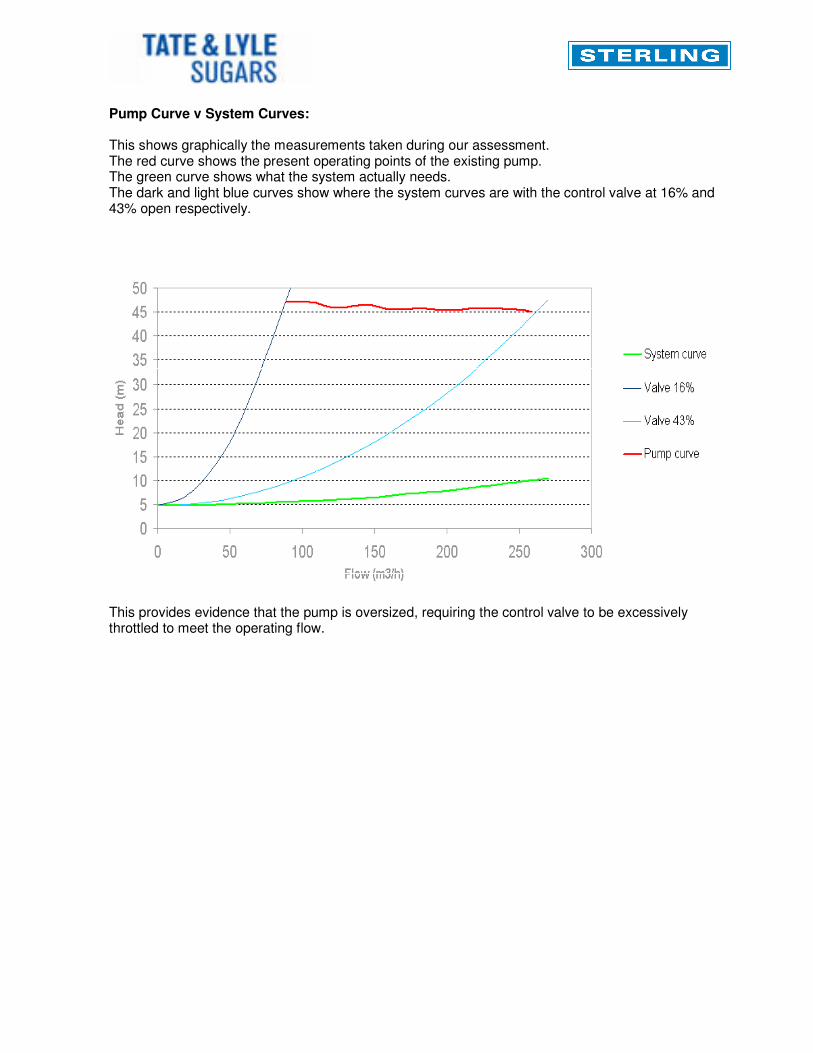
Pump Curve v System Curves: This shows graphically the measurements taken during our assessment. The red curve shows the present operating points of the existing pump. The green curve shows what the system actually needs. The dark and light blue curves show where the system curves are with the control valve at 16% and 43% open respectively.
This provides evidence that the pump is oversized, requiring the control valve to be excessively throttled to meet the operating flow.
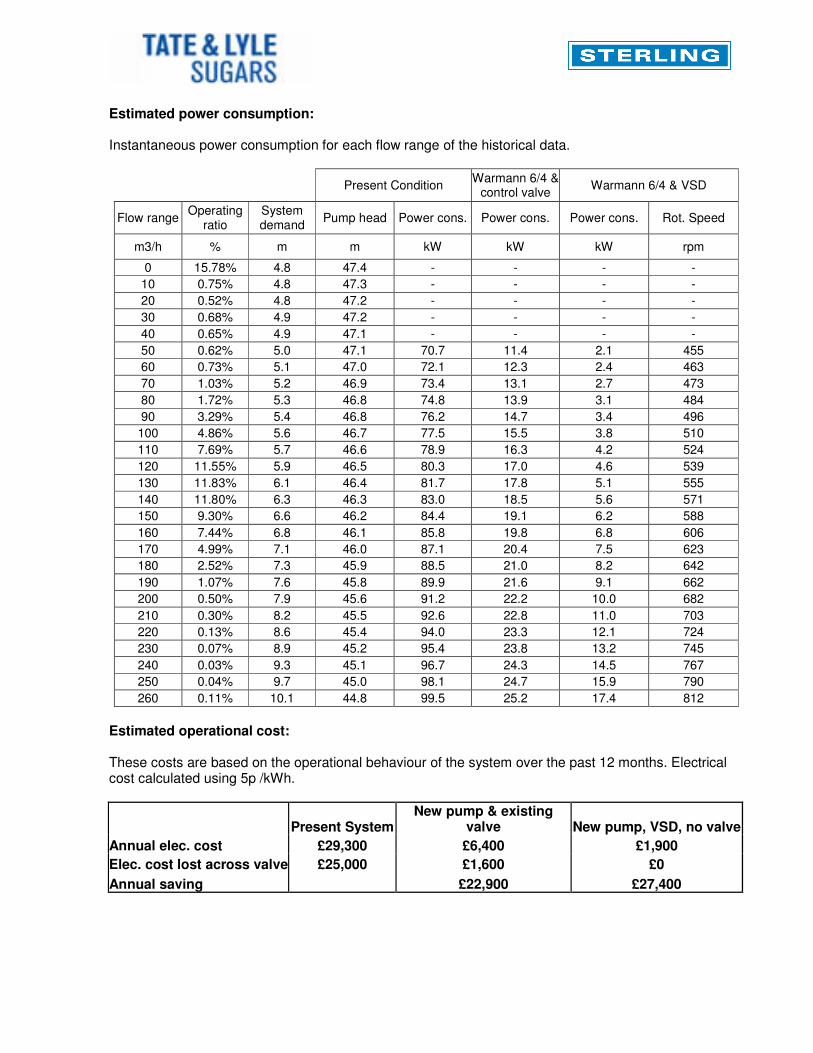
Estimated power consumption: Instantaneous power consumption for each flow range of the historical data.
Present Condition Warmann 6/4 &
control valve Warmann 6/4 & VSD
Flow range Operating
ratio System demand
Pump head Power cons. Power cons. Power cons. Rot. Speed
m3/h % m m kW kW kW rpm
0 15.78% 4.8 47.4 - - - -
10 0.75% 4.8 47.3 - - - -
20 0.52% 4.8 47.2 - - - -
30 0.68% 4.9 47.2 - - - -
40 0.65% 4.9 47.1 - - - -
50 0.62% 5.0 47.1 70.7 11.4 2.1 455
60 0.73% 5.1 47.0 72.1 12.3 2.4 463
70 1.03% 5.2 46.9 73.4 13.1 2.7 473
80 1.72% 5.3 46.8 74.8 13.9 3.1 484
90 3.29% 5.4 46.8 76.2 14.7 3.4 496
100 4.86% 5.6 46.7 77.5 15.5 3.8 510
110 7.69% 5.7 46.6 78.9 16.3 4.2 524
120 11.55% 5.9 46.5 80.3 17.0 4.6 539
130 11.83% 6.1 46.4 81.7 17.8 5.1 555
140 11.80% 6.3 46.3 83.0 18.5 5.6 571
150 9.30% 6.6 46.2 84.4 19.1 6.2 588
160 7.44% 6.8 46.1 85.8 19.8 6.8 606
170 4.99% 7.1 46.0 87.1 20.4 7.5 623
180 2.52% 7.3 45.9 88.5 21.0 8.2 642
190 1.07% 7.6 45.8 89.9 21.6 9.1 662
200 0.50% 7.9 45.6 91.2 22.2 10.0 682
210 0.30% 8.2 45.5 92.6 22.8 11.0 703
220 0.13% 8.6 45.4 94.0 23.3 12.1 724
230 0.07% 8.9 45.2 95.4 23.8 13.2 745
240 0.03% 9.3 45.1 96.7 24.3 14.5 767
250 0.04% 9.7 45.0 98.1 24.7 15.9 790
260 0.11% 10.1 44.8 99.5 25.2 17.4 812
Estimated operational cost: These costs are based on the operational behaviour of the system over the past 12 months. Electrical cost calculated using 5p /kWh.
Present System New pump & existing
valve New pump, VSD, no valve
Annual elec. cost £29,300 £6,400 £1,900
Elec. cost lost across valve £25,000 £1,600 £0
Annual saving £22,900 £27,400
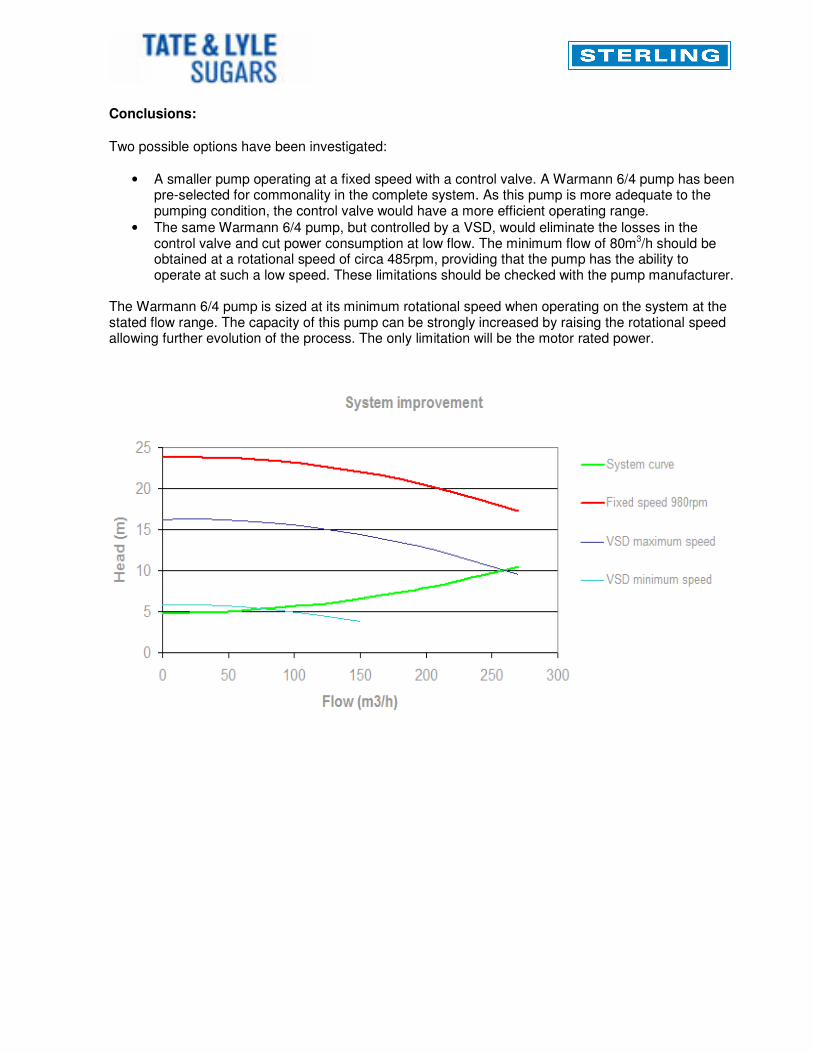
Conclusions: Two possible options have been investigated:
• A smaller pump operating at a fixed speed with a control valve. A Warmann 6/4 pump has been pre-selected for commonality in the complete system. As this pump is more adequate to the pumping condition, the control valve would have a more efficient operating range.
• The same Warmann 6/4 pump, but controlled by a VSD, would eliminate the losses in the control valve and cut power consumption at low flow. The minimum flow of 80m3/h should be obtained at a rotational speed of circa 485rpm, providing that the pump has the ability to operate at such a low speed. These limitations should be checked with the pump manufacturer.
The Warmann 6/4 pump is sized at its minimum rotational speed when operating on the system at the stated flow range. The capacity of this pump can be strongly increased by raising the rotational speed allowing further evolution of the process. The only limitation will be the motor rated power.
Other points for consideration Points for your consideration that were not clear from the information and results obtained during the assessment: Warman performance curve identified the existing pump should be running at circa 1100rpm to give the duty points collected. However, the speed taken with the tachometer was 985rpm. Why? Larger impeller fitted than curve states? Closer clearances within the pump? Please bear in mind before a smaller pump is considered what are the future plans for the system.
• New pump selection ideally should provide for future growth capability.
• Is there the physical space, environment and electrics for a VSD.
• If the pump type is changed, then is this likely to affect the reliability, process control, ability or maintenance costs?
Nothing in this final report shall be construed or interpreted as a service guarantee or warranty. Facts and figures given in the final report constitute non-binding information only. The Service team at Head Office are at your disposal to discuss our report in more detail and carry out further energy audits. Yours faithfully For and on behalf of Sterling Fluid Systems (UK) Limited. Alex Onslow Mike Slater Florent Violain