![IBM Sterling B2B Integrator [Infographic]](https://static.fdocuments.in/doc/165x107/58ed5fdc1a28aba7708b45bd/ibm-sterling-b2b-integrator-infographic.jpg)
Sterling B2B Integrator: Performance Management · Performance Management Y ou can manage the...
262
Sterling B2B Integrator Performance Management Version 5.2 IBM
Transcript of Sterling B2B Integrator: Performance Management · Performance Management Y ou can manage the...

Sterling B2B Integrator
Performance ManagementVersion 5.2
IBM

Sterling B2B Integrator
Performance ManagementVersion 5.2
IBM

NoteBefore using this information and the product it supports, read the information in “Notices” on page 247.
Copyright
This edition applies to Version 5 Release 2 of Sterling B2B Integrator and to all subsequent releases andmodifications until otherwise indicated in new editions.
© Copyright IBM Corporation 2000, 2015.US Government Users Restricted Rights – Use, duplication or disclosure restricted by GSA ADP Schedule Contractwith IBM Corp.

Contents
Performance Management . . . . . .. 1Overview . . . . . . . . . . . . . .. 1
Intended Audience . . . . . . . . . .. 2System Components . . . . . . . . . .. 2Performance Tuning Methodology . . . . .. 4
Performance Recommendations Checklists . . .. 5Sterling B2B Integrator: General RecommendationsChecklist . . . . . . . . . . . . .. 5IBM Sterling File Gateway: SpecificRecommendations Checklist . . . . . . .. 9EBICS Banking Server: SpecificRecommendations . . . . . . . . . .. 12
Database Management. . . . . . . . . .. 13Planning . . . . . . . . . . . . .. 13Server Sizing . . . . . . . . . . . .. 14Storage and File Systems . . . . . . . .. 14Database management for Sterling B2B Integrator 16Oracle Database Configuration and Monitoring 22IBM DB2 for LUW Configuration and Monitoring 35Microsoft SQL Server Configuration andMonitoring . . . . . . . . . . . .. 51
Java Virtual Machine . . . . . . . . . .. 61Garbage Collection Statistics . . . . . . .. 62JVM Verbose Garbage Collection . . . . .. 62IBM JVM Garbage Collection Example . . .. 62Introduction to HotSpot JVM Performance andTuning . . . . . . . . . . . . . .. 63Introduction to the IBM JVM Performance andTuning Guidelines . . . . . . . . . .. 78
Monitoring Operations . . . . . . . . .. 82Managing System Logs . . . . . . . .. 82Auditing . . . . . . . . . . . . .. 93Monitoring a Business Process Thread . . .. 94Monitoring Messages . . . . . . . . .. 96Reviewing System Information . . . . . .. 97Monitoring Node Status . . . . . . . .. 106Monitoring Deprecated Resources . . . .. 109Soft Stop of Sterling B2B Integrator . . . .. 110
Hard Stop of Sterling B2B Integrator . . .. 120Performance Tuning . . . . . . . . . .. 120
Performance Tuning Utility . . . . . . .. 120Manual Performance Tuning . . . . . .. 166
Performance Statistics . . . . . . . . .. 203Turning On and Turning Off PerformanceStatistics . . . . . . . . . . . . .. 213Reporting Performance Statistics . . . . .. 213
Troubleshooting . . . . . . . . . . .. 214Database Maintenance Check . . . . . .. 214Full Database Issues and Resolution . . . .. 218Database Connection Issues . . . . . .. 222Database Down Check . . . . . . . .. 224Tracking JDBC Connections . . . . . .. 226Types of Cache Memory. . . . . . . .. 227Symptoms and Causes of Inefficient CacheUsage . . . . . . . . . . . . . .. 228Resolving Inefficient Cache Usage . . . .. 228Correcting Dropped Data Problems . . . .. 229Correcting Out-Of-Memory Errors . . . .. 230Understanding Business Process . . . . .. 230Symptoms and Causes of Poor Business ProcessExecution Time . . . . . . . . . . .. 230Resolving Halted, Halting, Waiting, orInterrupted Business Processes . . . . .. 232Slow System: Symptoms, Causes, andResolution . . . . . . . . . . . .. 234Performing a Thread Dump . . . . . .. 236Scenario-Based Troubleshooting Tips andTechniques . . . . . . . . . . . .. 239
Performance and Tuning Worksheet . . . . .. 241workflowLauncher: Running a Business Processfrom a Command Line . . . . . . . . .. 244
Notices . . . . . . . . . . . . .. 247
Index . . . . . . . . . . . . . .. 251
© Copyright IBM Corp. 2000, 2015 iii

iv Sterling B2B Integrator: Performance Management
Performance Management
You can manage the performance of Sterling B2B Integrator according to yourneeds.
OverviewTypically, performance in general, and optimal performance in particular, areassociated with the following criteria: latency, throughput, scalability, and load.v Latency – The amount of time taken to generate a response to a request (speed).v Throughput – The amount of data transferred during a specified period
(volume).v Scalability – The ability of the system to adapt to increasing workload
(additional hardware).v Load – The ability of the system to continue performing at optimal level even
when the load on the system increases.
Sterling B2B Integrator performance can be tuned to meet various processingrequirements, including higher processing speed and ability to sustain highvolumes. The amount of resources given to the interactive and batch componentsof a mixed workload determines the trade-off between responsiveness (speed) andthroughput (work completed in a certain amount of time).
When using Sterling B2B Integrator, if you face any performance issues, performthe applicable task or tasks from the following list:v Change performance parameters in the properties files or through the
performance tuning utility. For more information about changing performanceparameters, refer to “Performance Tuning Utility” on page 120.
v Add additional hardware.v Tune your business processes to run more efficiently on Sterling B2B Integrator.v Monitor and archive the database to free up resources.v Create Sterling B2B Integrator cluster for load balancing and scaling.
Before You Begin Performance Tuning
Before you carry out performance tuning actions, you must consider capacityplanning issues. The “Performance and Tuning Worksheet” on page 241 providesinformation about how to determine your capacity requirements. This worksheet,and other capacity planning tools, also help you adjust your current workload,regardless of your future requirements.
Following is a list of some capacity issues that impact performance and tuning:v Daily volume requirements, including the average size and number of
transactions to be processed.v Additional processing requirements, for example, translation, and
straight-through processing.v Types of pay loads, including EDIFACT, XML, and other formats.v Translation requirements, for example, translation from EDIFACT to XML.
© Copyright IBM Corp. 2000, 2015 1
v Enterprise Resource Planning (ERP) integration requirements, for example,integration with SAP® or PeopleSoft®.
v Number of processors that are available and can be dedicated to Sterling B2BIntegrator.
v Memory available to meet your processing requirements.v Disk space available.v Hard disk Redundant Array of Independent Disks (RAID) level. RAID arrays
use two or more drives in combination for fault tolerance and performance. Therecommended RAID level for Sterling B2B Integrator is Level 5.
v Database size requirements.
Note: When conducting a performance tuning activity, keep the informationprovided in this topic at hand for easy reference and future planning.
Intended AudienceThis document is intended for, but not limited to:v Technical Architectsv Performance Engineersv Configuration Engineersv Application Administratorsv Database Administratorsv System Administrators
System ComponentsPerformance management activities affect all aspects of the system, includingcomputer nodes, network, disks, database, and so on.
One person or role may be responsible for one, several, or all the components.Some of the roles include:v Hardware Engineerv System Administratorv Network Engineer - Local Area or Wide Areav Application Server Administratorv Database Administratorv Capacity Planning Engineerv Performance Analystv IBM® Sterling B2B Integrator Administrator
Performance management documentation includes the following information:v Background information about the different performance and tuning issues
when running Sterling B2B IntegratorSterling B2B Integrator.v Step-by-step information that helps you:
– Optimize the performance.– Diagnose and resolve performance issues, if any, to suit your environment.
You can work through most performance and tuning issues using the followingtools:v Properties file settings, which you can access through the properties directory in
your installation directory.
2 Sterling B2B Integrator: Performance Management

v The Sterling B2B Integrator user interface. Use the Operations option in theAdministration menu to access the following tools:– JDBC Monitor (Operations > JDBC Monitor)– JVM Monitor (Operations > System > Performance > JVM Monitor)– Message Monitor (Operations > Message Monitor)– Performance Statistics Report (Operations > System > Performance >
Statistics)– Performance Tuning Wizard (Operations > System > Performance > Tuning)– System Troubleshooting (Operations > System > Troubleshooter)– Thread Monitor (Operations > Thread Monitor)
Based on the diversity of the roles and the responsibilities associated with them,the Sterling B2B Integrator Performance Management Guide is divided into thefollowing sections:v Overview - Provides performance tuning overview, audience information,
performance concepts overview, performance tuning methodologies, and tuningissues that may arise when running Sterling B2B Integrator.
v Performance recommendations checklist - Provides general, planning, andimplementation (single node and cluster) checklists. This topic caters tohardware engineers, system administrators, network engineers, capacityplanners, and Sterling B2B Integrator administrators.
v Database management system - Discusses key recommendations for Oracle®,IBM DB2®, Microsoft SQL Server™, and MySQL databases. This topic caters todatabase administrators.
v Java™ Virtual Machines - Explains configuration, recommendations, and so on.This topic caters to application server administrators.
v Monitoring operations, performance tuning, and performance statistics -Discusses monitoring operations, performance tuning (utility and manual), andmanagement of performance statistics.
v Monitoring operations - Provides information about system logs, auditing,business process threads, messages, system information, and cluster node status.
v Performance tuning - Explains performance tuning using the performance tuningwizard, and manual performance tuning recommendations such as schedulingpolicies, cache contents, persistence levels, property files, and system recovery.
v Performance statistics - Provides information about managing, enabling anddisabling, and reporting performance statistics.
v Troubleshooting - Provides information about resolving full database issues, JavaDatabase Connectivity (JDBC™) connections, cache issues, memory issues, slowsystem issues, and improving business process execution time.
v Performance and tuning worksheet - Helps you to take an inventory of thedifferent parts of your Sterling B2B Integrator installation that affectsperformance.
v workFlow Launcher - Explains how to run business processes from thecommand line.
Note: It is recommended that the performance analyst, capacity planner, andSterling B2B Integrator administrators read all the topics.
Performance Management 3

Performance Tuning MethodologyFor effective performance tuning, you must first identify the performance issuesand determine the corrective actions. Following is a methodology that helps youfocus your efforts and reduce redundant tasks.
Use the following methodology to identify and resolve performance issues inSterling B2B Integrator:1. Fill out the Requirements Planning Worksheet to determine the hardware
requirements for a given processing volume and speed.
Note: If you purchased IBM Consulting Services, you would have received areport containing information about your hardware requirements based onyour business needs.
2. Verify that your hardware and memory specifications match the hardware andmemory recommendations provided during the performance planning phase.
3. Verify that you have installed the requisite patches on your system, which willhelp you fix your performance issues from the IBM Customer Center Web siteat https://cn.sterlingcommerce.com/login.jsp.
4. Verify that you have the supported Java Virtual Machine (JVM™) on thecomputer running Sterling B2B Integrator, and on the DMZ computer if youare running perimeter servers. Both the JVM versions must match each otherand your Sterling B2B Integrator version requirements. The build date andlower release numbers must also match.
5. Verify that you are running the supported version of your operating system.6. Verify that you are running the supported versions of the JDBC drivers.7. Verify that you have created your business processes using the most current
adapters and services, well-structured XPath statements, and the lowestpersistence by step and business process.
8. Tune Sterling B2B Integrator using the Performance Tuning Utility and theinformation that you provided in the Requirements Planning Worksheet (referto the topic Performance and Tuning Worksheet). The Performance TuningUtility enables you to tune the cache, memory, and other system components,but not the business processes.For more information about this utility, refer to “Performance Tuning Utility”on page 120.
9. Navigate to Operations > System > Performance > Statistics. In the Statisticspage, select the Enable Performance Statistics option. The PerformanceStatistics reports provide information about the time taken to performbusiness processes and execute activities, database connections andpersistence, and business process queue performance. You can use thisinformation to tune your system according to your volume and speedrequirements.For more information about performance statistics, refer to the topic ManagePerformance Statistics.
10. Review your history of incoming and outgoing documents and enter thisinformation in charts, showing daily, weekly, and monthly processing trends.Use these charts to determine your peak volume processing levels based onyour processing pattern history.
11. Conduct initial performance testing by running your business processes withsample data that is the same size as the data that will be processed inproduction. In addition, run your business processes with data that
4 Sterling B2B Integrator: Performance Management

approximates your anticipated peak processing volume. This helps you tuneyour system as close to your production environment as possible.
12. Review the Performance Statistics Report for processing speeds, volumes, anddatabase connections.
13. Review the other reports, such as the Database Usage Report and the CacheUsage Report, for information about the areas that can be tuned.
14. Retune Sterling B2B Integrator using the Performance Tuning Utility, based onthe information you gathered from your initial performance testing.Continue this process until your processing time and volume requirements aremet.
15. Create a new Performance Statistics Report called Benchmarksdd/mm/yy.16. Conduct the same test that you conducted in step 11.17. Review the Benchmarksdd/mm/yy Performance Statistics Report. If the statistics
in this report are not similar to your previous statistics, repeat steps 11 - 14.18. Compare your monthly or weekly Performance Statistics Reports with this
Benchmark report to verify that your system is processing business processesefficiently and that your resources are being used efficiently. Using thismethodology as a proactive measure may reduce downtime and processingissues.
Performance Recommendations ChecklistsPerformance Recommendations Checklists provide guidelines to plan for therequired elements, and enhance the performance of Sterling B2B Integrator andrelated components.
Sterling B2B Integrator: General Recommendations ChecklistThe general recommendations checklist provides a list of guidelines to plan for therequired elements, and to enhance the performance of Sterling B2B Integrator.
In the following table, the Test and Production columns indicate whether therecommendations are Recommended (R), Critical (C), or Not Applicable (NA) inthe test and production environments.
Note: It is recommended to setup a Sterling B2B Integrator test environment witha sample set of data to verify the recommendations provided in this checklist.
Recommendation Test Production Comments
OS version and OSkernel parameters
C C You should ensure that you installSterling B2B Integrator on certifiedOS versions and levels.
Refer to the System Requirementsdocumentation of the correspondingOS versions.
Network speed C C You should ensure that yournetwork cards are operating at thehighest speeds. The networkinterface and the network switch cannegotiate to lower speed. When thathappens, performance degrades evenunder normal processing periods.
Performance Management 5

Recommendation Test Production Comments
AIX page spaceallocation
C C The AIX default page spaceallocation policy does not reserveswap space when processes allocatememory. This can lead to excessiveswap space, which forces AIX to killprocesses when it runs out of swapspace.
You should ensure that you eitherhave sufficient swap space, or set thefollowing environment policyvariables:
PSALLOC=EARLY
NODISCLAIM=TRUE
Monitor CPU Utilization NA C You should monitor CPU utilizationto ensure that there is no CPUcontention.
Monitor Swap Usage C C If not enough space is left on theswap device (or paging file), theoperating system may preventanother process from starting, or insome cases, be forced to kill therunning processes.
Monitor Paging C C The JVMs and database managementsystems rely on large memorybuffers or heaps, and are sensitive topaging. Performance can noticeablydegrade if enough memory is notavailable to keep the JVM heap inmemory.
You can monitor paging levels usingstandard operating system orthird-party measurement tools, suchas:
v UNIX/Linux – SAR
v Windows – System Monitor
Monitor Heap
Garbage CollectionPerformance
C C Monitoring heap GC performance iscritical for performance andavailability. For example, if theamount of heap that is free after aGC is continually increasing, andapproaching the maximum heapsize, the JVM can experienceOutOfMemory exceptions.
6 Sterling B2B Integrator: Performance Management

Recommendation Test Production Comments
EDI Encoder Service
EDI Envelope Service
R R As of Sterling B2B Integrator 5.2, theEDI Encoder Service and EDIEnvelope Service notify the user ofan incorrect value or mismatch inthe Mode parameter by writinginformation on how to correct theproblem in the status report of thebusiness process step. This can causea performance degradation in somevery heavy usage scenarios byadding additional load on thedatabase. It is recommended that allbusiness processes that use the EDIEncoder Service and/or EDIEnvelope Service be reviewed tomake certain they are using thecorrect Mode parameter, and that thevalues match in the business process.
v EDI Encoder Service should be setas Mode. For example: <assignto="Mode">IMMEDIATE</assign>
v EDI Envelope Service should beset as MODE. For example: <assignto="MODE">IMMEDIATE</assign>
Planning
Server node sizing NA C You should ensure that you havesufficient computing capacity toprocess peak transaction volumes.
Refer to System Requirementsdocumentation to get an estimate ofthe processor, memory, and otherrequirements.
You can also engage IBMProfessional Services to conduct acapacity plan study of your system.This study involves measuring yoursystem, and using the measurementsto forecast resource requirements atanticipated peak processing periods.
Database disk sizing NA C You should ensure that you havesufficient disk space for the databaseserver.
The size of the database disksubsystem may vary from a fewgigabytes to several terabytes. Thesize depends on the processingvolume, its complexity, and thelength of time you want to keep thedata active in the database.
JVM
Performance Management 7

Recommendation Test Production Comments
JVM version C C You must ensure that you installSterling B2B Integrator on certifiedJVM versions and levels.
Run the –version command in thecommand prompt to ensure that youhave installed the correct version.
Verbose GC statistics NA C You can enable verbose GC statisticscollection. Understanding the healthof GCs for each JVM is critical forperformance.
Paging C C The JVM heap must be resident inthe memory. The performance cannoticeably degrade if the operatingsystem has to page portions of theheap out to disk.
OutOfMemoryExceptions
C C OutOfMemory exceptions can causeunpredictable behavior. You shouldensure that you have allocatedsufficient physical memory toSterling B2B Integrator based onyour processing requirements.
JVM VM mode C C For HotSpot JVM, the server mode isapplicable for long-runningworkloads.
Heap size C C Correct heap size configuration iscritical for both performance andavailability. If the heap size is toobig, the GC pauses can be long.Similarly, if the heap size is toosmall, it can lead to OutOfMemoryexceptions. You should ensure thatheap size is not set larger thanphysical memory to avoid thrashing.
Sterling B2B Integrator supports both32-bit and 64-bit JVMs. You shouldallocate more heap space when youare running a 64-bit JVM.
Database
Monitor and regulateindexes
C C Sterling B2B Integrator comes with adefault set of indexes. In some cases,the indexes may not apply to youroperational environment.
You should regularly monitor theresource cost of frequently usedqueries to check if additional indexesare required. Similarly, you can alsomonitor the database to deleteindexes if they are not required.
8 Sterling B2B Integrator: Performance Management

Recommendation Test Production Comments
Cursor sharing C C If you are using Oracle database,cursor sharing enables dynamic SQLto be reusable, thereby reducing thecontention on the shared pool.
You should ensure that you setcursor_sharing=EXACT
Parameters governingDB2 locking strategy
C C Set DB2_EVALUNCOMMITTED,DB2_SKIPDELETED, andDB2_SKIPINSERTED to reduce lockcontention.
Parameters governingDB2 memory
C C Set parameters to manage variousmemory structures such asLOCKLIST, SORTHEAP, and so on,to AUTOMATIC.
Volatile table NA C Mark tables that change significantly,as volatile.
IBM Sterling File Gateway: Specific RecommendationsChecklist
IBM Sterling File Gateway is installed on an instance of Sterling B2B Integrator,and shares many of the resources with the latter, including:v Communication Adaptersv Business Processesv Security Servicesv Perimeter Servicesv Encryptionv Decryptionv Account Management
You should, therefore, tune your Sterling B2B Integrator installation first, and thenperform the Sterling File Gateway-specific tuning and troubleshooting tasks. Beaware that the changes you make to Sterling File Gateway can also affect theperformance of Sterling B2B Integrator.
Note: Do not edit the properties files. Make all the changes in thecustomer_overrides.properties file. For example, to change thepgpCmdline2svcname property, enter the following line in thecustomer_overrides.properties file:filegateway.pgpCmdline2svcname=CUSTOM
In this line, replace CUSTOM with the name of your Command Line 2 adapter. Formore information about the customer_overrides.properties file, refer to theproperty files documentation in the online documentation library.
The following table describes some of the key parameters that must be configuredto optimize Sterling File Gateway performance.
In the following table, the Test and Production columns indicate whether therecommendations are Recommended (R), Critical (C), or Not Applicable (NA) inthe test and production environments.
Performance Management 9
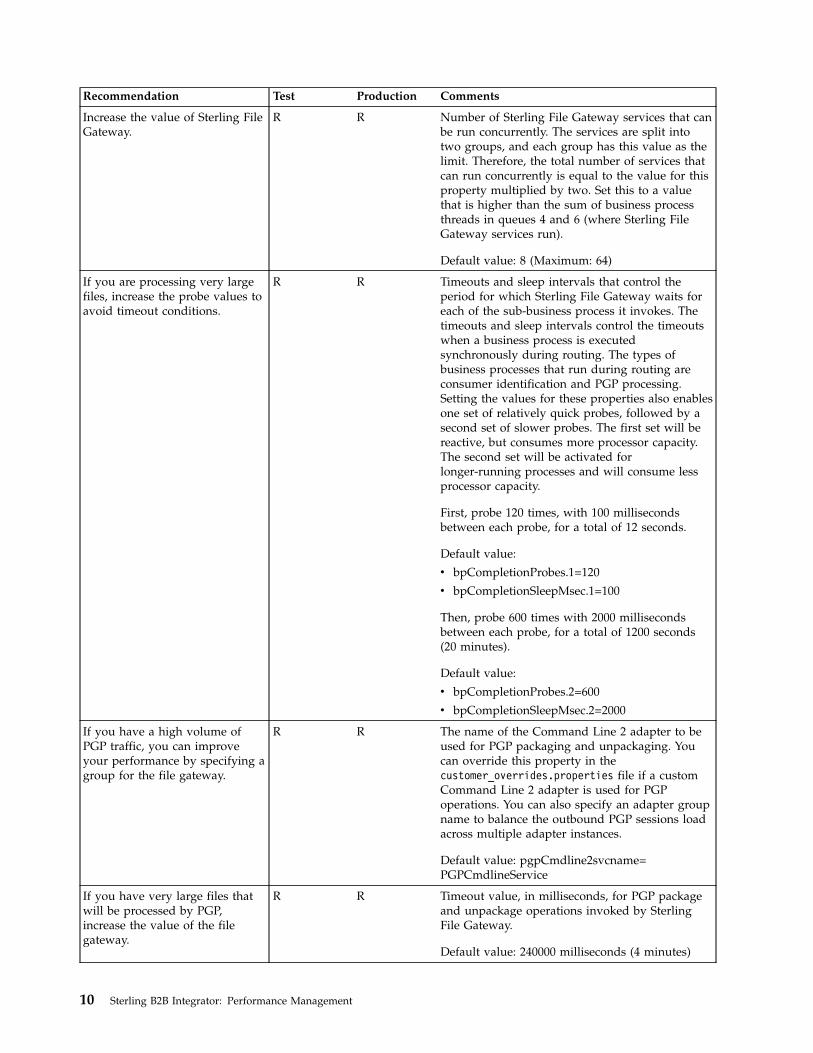
Recommendation Test Production Comments
Increase the value of Sterling FileGateway.
R R Number of Sterling File Gateway services that canbe run concurrently. The services are split intotwo groups, and each group has this value as thelimit. Therefore, the total number of services thatcan run concurrently is equal to the value for thisproperty multiplied by two. Set this to a valuethat is higher than the sum of business processthreads in queues 4 and 6 (where Sterling FileGateway services run).
Default value: 8 (Maximum: 64)
If you are processing very largefiles, increase the probe values toavoid timeout conditions.
R R Timeouts and sleep intervals that control theperiod for which Sterling File Gateway waits foreach of the sub-business process it invokes. Thetimeouts and sleep intervals control the timeoutswhen a business process is executedsynchronously during routing. The types ofbusiness processes that run during routing areconsumer identification and PGP processing.Setting the values for these properties also enablesone set of relatively quick probes, followed by asecond set of slower probes. The first set will bereactive, but consumes more processor capacity.The second set will be activated forlonger-running processes and will consume lessprocessor capacity.
First, probe 120 times, with 100 millisecondsbetween each probe, for a total of 12 seconds.
Default value:
v bpCompletionProbes.1=120
v bpCompletionSleepMsec.1=100
Then, probe 600 times with 2000 millisecondsbetween each probe, for a total of 1200 seconds(20 minutes).
Default value:
v bpCompletionProbes.2=600
v bpCompletionSleepMsec.2=2000
If you have a high volume ofPGP traffic, you can improveyour performance by specifying agroup for the file gateway.
R R The name of the Command Line 2 adapter to beused for PGP packaging and unpackaging. Youcan override this property in thecustomer_overrides.properties file if a customCommand Line 2 adapter is used for PGPoperations. You can also specify an adapter groupname to balance the outbound PGP sessions loadacross multiple adapter instances.
Default value: pgpCmdline2svcname=PGPCmdlineService
If you have very large files thatwill be processed by PGP,increase the value of the filegateway.
R R Timeout value, in milliseconds, for PGP packageand unpackage operations invoked by SterlingFile Gateway.
Default value: 240000 milliseconds (4 minutes)
10 Sterling B2B Integrator: Performance Management

Recommendation Test Production Comments
If you have high volumes of FTPtraffic, you can improve yourperformance by specifying agroup.
R R The FTP Client Adapter instance or service groupthat the FileGatewayDeliverFTP business processwill use. You can override this property in thecustomer_overrides.properties file to use acustom FTP Client Adapter instance to contacttrading partners. You can also specify an adaptergroup name to balance the outbound FTP sessionsload across multiple adapter instances.
Default value: ftpClientAdapterName=FTPClientAdapter
Decrease the value of evaluationfrequency.
R R You can enable eitherMailboxEvaluateAllAutomaticRules orMailboxEvaluateAllAutomaticRulesSubMin.
MailboxEvaluateAllAutomaticRulesSubMin verifies the presence ofroutable messages once every 10 seconds, and canbe edited for other intervals of less than oneminute by modifying the MailboxEvaluateAllAutomaticRulesSubMin business process.
Suppress Duplicate Messages R R Prevents duplicate messages from using systemresources.
Increase the number of steps abusiness process must completeprior to returning to the queue.
R R Number of steps involved in the completion of abusiness process before the business processreturns to the queue. Higher values will accelerateindividual business process execution, whilelower values will provide smoother multitaskingcapabilities. Interactive use favors a lower numberof steps, while batch processing favors a highernumber of steps. The value ofnoapp.AE_ExecuteCycle.# can be different foreach queue. .# indicates the queue number.
When a business process has one service to begina protocol session and another service to use theprotocol session, a very low AE_ExecuteCyclemay lead many business processes to be in thequeue, with only the first service running. Thismay result in many protocol sessionsaccumulating in an open state, and session limitsbeing met sooner than is necessary.
Increase the time period that abusiness process can use athread, before releasing it to beused for another businessprocess.
R R Maximum time period, in milliseconds, for whicha business process can use a thread beforereleasing it for use by another business process.This value will override the value set forAE_ExecuteCycle. Tuning the value for thisproperty ensures that a series of unusually slowsteps will not tie up a thread completely. Thisvalue can be different for each queue. .# indicatesthe queue number. A value that is too low mayresult in the accumulation of more sessions thanare recommended.
Performance Management 11
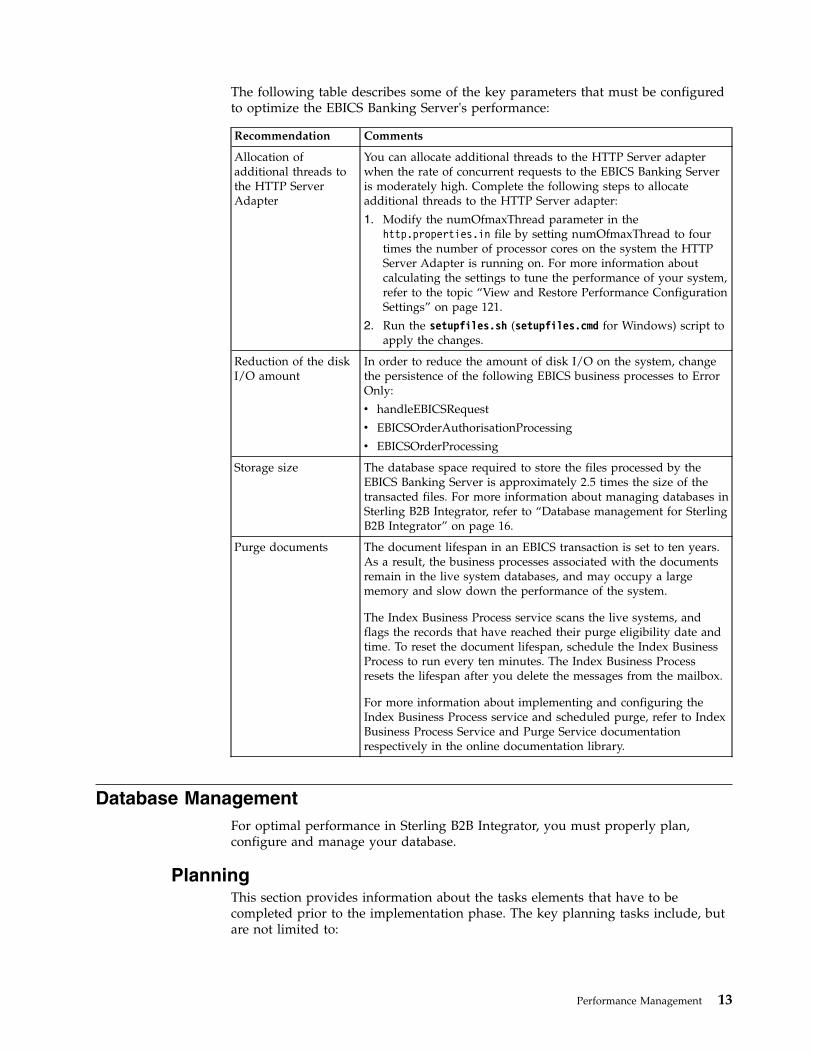
Recommendation Test Production Comments
Increase the number ofconcurrent threads.
R R Total number of concurrent threads that SterlingFile Gateway is allowed to use. This number maybe verified against the licensed number ofthreads. This value is the total number of threadsavailable to a workflow engine to executebusiness process steps. Other, non-workflowengine threads do not come under the purview ofthis limit. For example, the threads set infgRouteConcurrentSessionLimit do not comeunder the purview of this limit.
Set storage type. R R File System is more efficient.
Default value: database
The following table shows the properties that control the above parameters:
Recommendation Property
Increase the value of Sterling File Gateway. fgRouteConcurrentSessionLimit
If you are processing very large files, increase the probevalues to avoid timeout conditions.
v filegateway.bpCompletionProbes.2
v filegateway.bpCompletionSleepMsec.2
If you have a high volume of PGP traffic, you canimprove your performance by specifying a group for thefile gateway.
pgpCmdline2svcname
If you have very large files that will be processed byPGP, increase the value of the file gateway.
fgRoutePGPCmdLineSocketTimeout
If you have high volumes of FTP traffic, you canimprove your performance by specifying a group.
filegateway.ftpClientAdapterName
Decrease the value of evaluation frequency. v MailboxEvaluateAllAutomaticRules
or
v MailboxEvaluateAllAutomaticRulesSubMin
Suppress Duplicate Messages mailbox.disallowDuplicateMessages=true
Increase the number of steps a business process mustcomplete prior to returning to the queue.
noapp.AE_ExecuteCycle.#
Increase the time period that a business process can usea thread, before releasing it to be used for anotherbusiness process.
noapp.AE_ExecuteCycleTime.#
Increase the number of concurrent threads. noapp.MaxThreads
Set storage type. N/A
EBICS Banking Server: Specific RecommendationsThe EBICS Banking Server is installed on an instance of Sterling B2B Integrator,and shares many of the resources with the latter.
You should, therefore, tune your Sterling B2B Integrator installation first, and thenperform the EBICS Banking Server-specific tuning. Be aware that the changes youmake to the EBICS Banking Server can also affect the performance of Sterling B2BIntegrator.
12 Sterling B2B Integrator: Performance Management
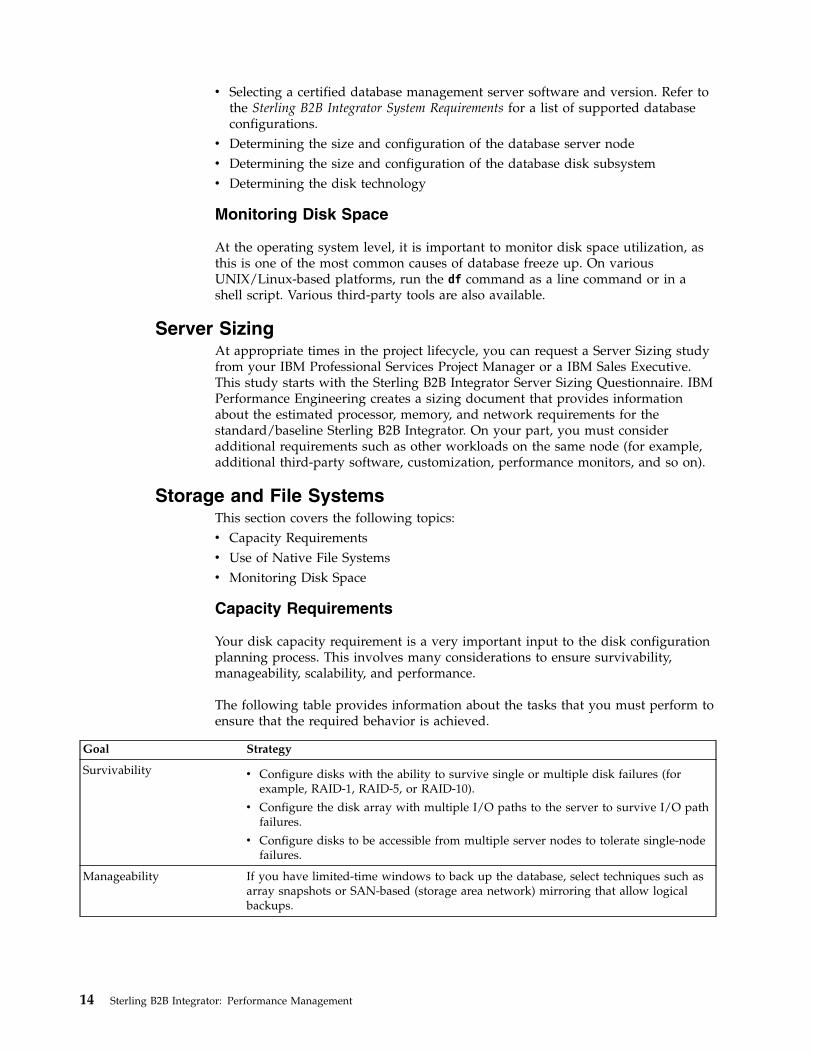
The following table describes some of the key parameters that must be configuredto optimize the EBICS Banking Server's performance:
Recommendation Comments
Allocation ofadditional threads tothe HTTP ServerAdapter
You can allocate additional threads to the HTTP Server adapterwhen the rate of concurrent requests to the EBICS Banking Serveris moderately high. Complete the following steps to allocateadditional threads to the HTTP Server adapter:
1. Modify the numOfmaxThread parameter in thehttp.properties.in file by setting numOfmaxThread to fourtimes the number of processor cores on the system the HTTPServer Adapter is running on. For more information aboutcalculating the settings to tune the performance of your system,refer to the topic “View and Restore Performance ConfigurationSettings” on page 121.
2. Run the setupfiles.sh (setupfiles.cmd for Windows) script toapply the changes.
Reduction of the diskI/O amount
In order to reduce the amount of disk I/O on the system, changethe persistence of the following EBICS business processes to ErrorOnly:
v handleEBICSRequest
v EBICSOrderAuthorisationProcessing
v EBICSOrderProcessing
Storage size The database space required to store the files processed by theEBICS Banking Server is approximately 2.5 times the size of thetransacted files. For more information about managing databases inSterling B2B Integrator, refer to “Database management for SterlingB2B Integrator” on page 16.
Purge documents The document lifespan in an EBICS transaction is set to ten years.As a result, the business processes associated with the documentsremain in the live system databases, and may occupy a largememory and slow down the performance of the system.
The Index Business Process service scans the live systems, andflags the records that have reached their purge eligibility date andtime. To reset the document lifespan, schedule the Index BusinessProcess to run every ten minutes. The Index Business Processresets the lifespan after you delete the messages from the mailbox.
For more information about implementing and configuring theIndex Business Process service and scheduled purge, refer to IndexBusiness Process Service and Purge Service documentationrespectively in the online documentation library.
Database ManagementFor optimal performance in Sterling B2B Integrator, you must properly plan,configure and manage your database.
PlanningThis section provides information about the tasks elements that have to becompleted prior to the implementation phase. The key planning tasks include, butare not limited to:
Performance Management 13
v Selecting a certified database management server software and version. Refer tothe Sterling B2B Integrator System Requirements for a list of supported databaseconfigurations.
v Determining the size and configuration of the database server nodev Determining the size and configuration of the database disk subsystemv Determining the disk technology
Monitoring Disk Space
At the operating system level, it is important to monitor disk space utilization, asthis is one of the most common causes of database freeze up. On variousUNIX/Linux-based platforms, run the df command as a line command or in ashell script. Various third-party tools are also available.
Server SizingAt appropriate times in the project lifecycle, you can request a Server Sizing studyfrom your IBM Professional Services Project Manager or a IBM Sales Executive.This study starts with the Sterling B2B Integrator Server Sizing Questionnaire. IBMPerformance Engineering creates a sizing document that provides informationabout the estimated processor, memory, and network requirements for thestandard/baseline Sterling B2B Integrator. On your part, you must consideradditional requirements such as other workloads on the same node (for example,additional third-party software, customization, performance monitors, and so on).
Storage and File SystemsThis section covers the following topics:v Capacity Requirementsv Use of Native File Systemsv Monitoring Disk Space
Capacity Requirements
Your disk capacity requirement is a very important input to the disk configurationplanning process. This involves many considerations to ensure survivability,manageability, scalability, and performance.
The following table provides information about the tasks that you must perform toensure that the required behavior is achieved.
Goal Strategy
Survivability v Configure disks with the ability to survive single or multiple disk failures (forexample, RAID-1, RAID-5, or RAID-10).
v Configure the disk array with multiple I/O paths to the server to survive I/O pathfailures.
v Configure disks to be accessible from multiple server nodes to tolerate single-nodefailures.
Manageability If you have limited-time windows to back up the database, select techniques such asarray snapshots or SAN-based (storage area network) mirroring that allow logicalbackups.
14 Sterling B2B Integrator: Performance Management

Goal Strategy
Scalability and Performance v Configure the disk array with many small disks instead of a few large disks toincrease the number of I/O paths.
v Configure the disk array with large NVRAM cache to improve read and writeperformance.
v Configure the disks with stripping (for example, RAID-0 or RAID-10).
v In some circumstances, you may also want to consider using solid-state disks.
Capacity Requirements: An Example
Let us consider the following example to understand the concept of capacityrequirements better. Assume you require 900 GB of storage and you have diskarrays or SANs that are made up of 93 GB disks. Let us further assume that thedatabase is implemented over ninety 10 GB data files.
The following table summarizes the choices for the common disk organizationsand the trade-offs involved.
Technology Scalability Survivability Maintainability Num Disks
JBOD Poor. Subject to throughputof individual disks
Poor. Single-disk failurecreates outage and requiresdatabase recovery
Poor. High disk utilizationskew.
10
RAID-0 Excellent. Striping n disksprovides read/writethroughput at n times asingle disk.
Poor. Single-disk failurecreates outage and requiresdatabase recovery.
Excellent. Expectnear-uniform diskutilization within a logicalunit. Potential LUNutilization skew.
10
RAID-1 Poor. Similar performanceto that of JBOD.
Better. Can survivemultiple disk failures,assuming that these occurin different mirrored sets.
Poor. High disk utilizationskew.
20
RAID-5 Excellent for read (similarto RAID-0). Potentiallypoor for write performance.
Better. Able to survive asingle-disk failure. Multipledisk failures create anoutage and requiredatabase recovery.
Excellent. Low diskutilization skew. PossibleLUN utilization skew.
11
RAID-6 Excellent for read (similarto RAID-0). Potentiallypoor for write performanceas parity calculations needto happen. Theperformance of RAID-6 andRAID-5 is about the sameand dependent on thecontrollers.
Better. Can survive adouble-disk failure. Thisgives it an edge overRAID-5. A failure of morethan two disks creates anoutage.
Excellent. Low diskutilization skew. PossibleLUN utilization skew.
12
RAID-01 Excellent read/writeperformance.
Can tolerate up to two diskfailures as long as bothfailures are not in the samemirrored set.
Excellent. Low diskutilization skew.
Possible LUN utilizationskew.
20
Performance Management 15

Technology Scalability Survivability Maintainability Num Disks
RAID-10 Excellent read/writeperformance.
Can tolerate up to n diskfailures as long as twofailures do not occur in thesame mirrored set.
Excellent. Low diskutilization skew.
Possible LUN utilizationskew.
20
Use of Native File Systems
Using file systems for storage can simplify administration tasks, althoughpotentially at some loss of some performance over using raw disks. It isrecommended that you consult with your storage administrator and storagevendor.
Operating System Native File System
Windows NTFS
Linux EXT3
Solaris UFS
AIX® JFS2
HP-UX VxFS
Database management for Sterling B2B IntegratorSterling B2B Integrator uses a database server as a repository for transactional,reference, and history data that it generates and uses.
Refer to the system requirements for a list of supported database configurations.
This topic covers the following concepts:v JDBC Connection Pool Overviewv Configuring Parameters for a Database Poolv Schema Objects
JDBC connection pool overview
Sterling B2B Integrator uses internal connection pooling to minimize delays in thecreation of new connections to the database server. When a connection isrequested, an existing connection is used whenever possible. Internal connectionpooling improves performance by removing the need to go to the driver andcreating and delete a new connection each time one is needed.
Internal connection pooling mechanism implements a connection pool in everyJVM started for the product. In a cluster with multiple nodes, the number ofconnections the database must establish is the total of all connections for all theconnection pools.
For example, if you have four JVM instances and each connection pool averagesaround 30 connections, your database server must establish 120 databaseconnections.
16 Sterling B2B Integrator: Performance Management

With this implementation, the database reports any idle connections to the system,which is the expected behavior. JDBC properties can be tuned in thejdbc.properties file to delete idle connections and minimize usage.
Note: Override the JDBC properties in the customer_overrides.properties file. Donot modify the jdbc.properties file directly. For more information about thejdbc.properties file, see the properties file documentation.
Implementation of connection pooling
Each database pool is created with an initial number of connections, as defined bythe initsize property in the jdbc.properties file. As more connections arerequired, Sterling B2B Integrator requests additional connections up to themaximum number defined by the maxsize property. When Sterling B2B Integratorfinishes with a connection, the connection is returned to the pool of connections forlater use.
If Sterling B2B Integrator requires connections beyond the maximum size limit foreach database pool, and every pool is in use, Sterling B2B Integrator can requestnew connections up to the value defined by the buffer_size property. Connectionsin this “buffer range” (that is, beyond the number of connections that are definedby the maxsize property) are created as needed, and deleted when the callingprocess is completed. To detect this condition, search for warning messages such asconnections exceeded in the noapp.log file. Performance drops if Sterling B2BIntegrator runs in this range for a long time.
The buffer_max value is a hard maximum. When the number of connections thatare defined by buffer_max (maxsize + buffersize) is reached, additional requestsfor connections are denied. An error is written to the logs that indicates that thepool is exhausted and the attempt to create a new connection failed.
Summary
Each JVM can create connections for each of the pools that are defined in thejdbc.properties file and configured in the customer_overrides.properties file.Each pool grabs the initial number of connections (initsize) configured.
Because a pool requires additional connections beyond the initial size, it createsnew connections up to the maxsize limit for that pool. Connections that are createdwith fewer than the maxsize are returned to that pool for reuse, thus improvingperformance.
If a pool is using all the connections up to the maxsize limit, it creates a newconnection as needed within the buffer size limit. Connections beyond maxsize andbelow the buffersize are not reused. Each connection is created when needed, anddeleted when no longer needed by the calling process. This method is expensiveand harms performance if Sterling B2B Integrator runs for continued amounts oftime in this state.
When the number of connections (maxsize + buffersize) is reached, new requestsfor connections are refused.
You can now manage JDBC pools dynamically. For more information aboutdynamically managing JDBC pools, see “Dynamically Manage JDBC Pools” onpage 20.
Performance Management 17
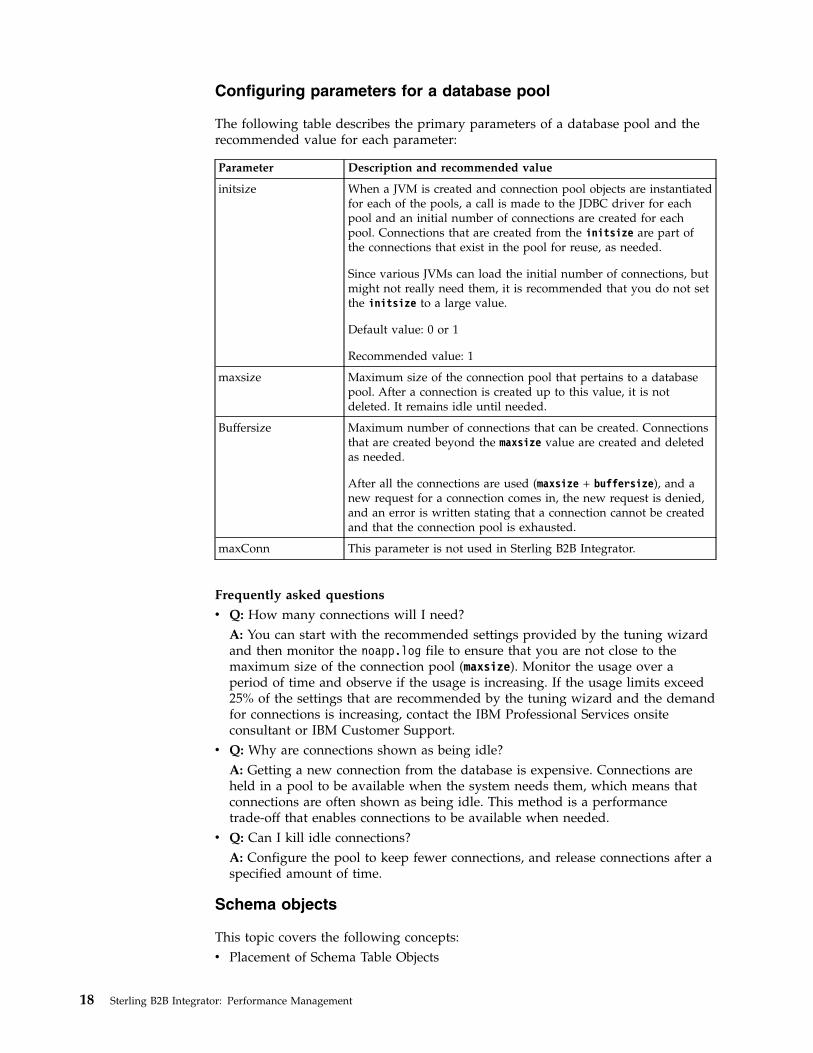
Configuring parameters for a database pool
The following table describes the primary parameters of a database pool and therecommended value for each parameter:
Parameter Description and recommended value
initsize When a JVM is created and connection pool objects are instantiatedfor each of the pools, a call is made to the JDBC driver for eachpool and an initial number of connections are created for eachpool. Connections that are created from the initsize are part ofthe connections that exist in the pool for reuse, as needed.
Since various JVMs can load the initial number of connections, butmight not really need them, it is recommended that you do not setthe initsize to a large value.
Default value: 0 or 1
Recommended value: 1
maxsize Maximum size of the connection pool that pertains to a databasepool. After a connection is created up to this value, it is notdeleted. It remains idle until needed.
Buffersize Maximum number of connections that can be created. Connectionsthat are created beyond the maxsize value are created and deletedas needed.
After all the connections are used (maxsize + buffersize), and anew request for a connection comes in, the new request is denied,and an error is written stating that a connection cannot be createdand that the connection pool is exhausted.
maxConn This parameter is not used in Sterling B2B Integrator.
Frequently asked questions
v Q: How many connections will I need?A: You can start with the recommended settings provided by the tuning wizardand then monitor the noapp.log file to ensure that you are not close to themaximum size of the connection pool (maxsize). Monitor the usage over aperiod of time and observe if the usage is increasing. If the usage limits exceed25% of the settings that are recommended by the tuning wizard and the demandfor connections is increasing, contact the IBM Professional Services onsiteconsultant or IBM Customer Support.
v Q: Why are connections shown as being idle?A: Getting a new connection from the database is expensive. Connections areheld in a pool to be available when the system needs them, which means thatconnections are often shown as being idle. This method is a performancetrade-off that enables connections to be available when needed.
v Q: Can I kill idle connections?A: Configure the pool to keep fewer connections, and release connections after aspecified amount of time.
Schema objects
This topic covers the following concepts:v Placement of Schema Table Objects
18 Sterling B2B Integrator: Performance Management

v Placement of Indexesv Sterling B2B Integrator Database Tables
Placement of Schema Table Objects
The Sterling B2B Integrator installation guide provides directions about how tocreate the database, including the necessary changes to some critical parameters.The DDL statements allow you to create a simple schema that is suitable forgeneral use. You need to review, and possibly modify, these statements beforeproduction.
Placement of Indexes
The DDL statements create a minimal set of indexes for general use. You mightneed to create more indexes to suit your business needs. Contact IBM ProfessionalServices or IBM Customer Support to create more indexes. You should alsomaintain a list of the indexes added and ensure that they are present after youupgrade Sterling B2B Integrator and monitor its usage. These indexes may or maynot be added to the Sterling B2B Integrator and is specific to your operatingenvironment.
You might want to create more table spaces for storing indexes in addition to thosetable spaces for the base tables. Table spaces should have multiple data files forI/O load balancing.
Important: Indexes can also be separated out into different storage areas. Thisaction should be done in coordination with your database administrator. However,if you are moving tables to different storage areas, do so only in coordination withIBM Professional Services to prevent upgrade issue in the future.
Database tables that can substantially grow
The following table lists some of the tables that are defined in Sterling B2BIntegrator experience substantial input, output, and rapid growth.
Table name Table function
DATA_TABLE These tables hold the binary payload of documents thatare used for processing within Sterling B2B Integrator.
v DOCUMENT
v CORRELATION_SET
Contain document metadata that is used for searchabilityand enablement of various document processing tasks.
WORKFLOW_CONTEXT Contains step status and business process flowinformation.
ARCHIVE_INFO Holds lifespan information that pertains to all businessprocesses and document storage in the system.
These tables are candidates for moving to a table space or segment that is separatefrom the rest of the database.
Important: Move these tables only in coordination with IBM Professional services.When patches or upgrades that need to re-create a table are installed, theinstallation attempts to create them in the default table space.
Performance Management 19

Controlling entries in the CORRELATION_SET table
You can control when correlation entries for different activities of Sterling B2BIntegrator are written to the CORRELATION_SET table. Reducing the number ofrecords in the CORRELATION_SET table improves the performance of Sterling B2BIntegrator.
The doc_tracking.properties file includes properties that enable or disablecorrelation entries for the following activities. The properties are in parentheses.v Mailbox (makeCorrelationForMailbox)v FTP (makeCorrelationForFTP)v SFTP (makeCorrelationForSFTP)v System tracking extension (makeTrackingExtensions)
The default value for each property is true, which means that correlation entriesare written to the CORRELATION_SET table.
Attention: If makeTrackingExtensions=false, then no mailbox correlation entriesare created, even if makeCorrelationForMailbox=true.
The doc_tracking.properties file is in the install_dir\install\propertiesdirectory.
Dynamically Manage JDBC PoolsSterling B2B Integrator now has the ability to dynamically add, modify, removeJDBC Pools and manage JDBC pools with effective dates for passwords.
Adding JDBC Pools:About this task
This procedure shows how to add JDBC pools using thecustomer_overides.properties file.
Procedure
1. In the customer_overrides.properties file, specify the database server name, portnumber, database/catalog name, user ID, and password. To encrypt yourdatabase password, use the encrypt_string.sh or encrypt_string.cmd utility inthe bin directory. Then place the encrypted password, prefixed by anencryption indicator, in the customer_overrides.properties file.
2. To update Sterling B2B Integrator with this new pool information, restart theapplication.
Modifying a Database Pool in jdbc.properties:Procedure
1. In the install_dir/install/properties directory, locate thecustomer_overrides.properties file.
2. Open the customer_overrides.properties file in a text editor.3. Modify the properties you want to change in the customer pools list of
properties.
Note: You can modify any properties for user added pools. For system pools,you cannot change the database type (for example, Oracle to MSSQL), but youcan change the database type for customer pools.
4. Save the customer_overrides.properties file.
20 Sterling B2B Integrator: Performance Management
5. After modifying the pool properties in customer_overrides.properties, go toJDBC monitor page and click the Refresh JDBC Pools button, or run theREFRESHJDBC OPS command from the install root directory: ./bin/opscmd.sh-cREFRESHJDBC -nnode1
Removing Pool from jdbc.properties:Procedure
1. In the install_dir/install/properties directory, locate thecustomer_overrides.properties file.
2. In the customer_overrides.properties file, delete the pool you want to remove.
Note: Verify that all the pool properties are removed for the pool you want todelete, including, jdbc.properties_*_ext, jdbc_customer.properties,customer_overrides.properties files and system_overrides.properties.
3. Save the customer_overrides.properties file.4. After removing the pool properties in customer_overrides.properties, go to
JDBC monitor page and click the Refresh JDBC Pools button, or run theREFRESHJDBC OPS command from the install root directory: ./bin/opscmd.sh-cREFRESHJDBC -nnode1
Controlling User and Password Credentials with Effective Dates: You can nowchange database passwords on a scheduled basis in Sterling B2B Integrator. Whenyou add or modify a pool, you now can control user and password credentialswith effective dates. Multiple user and password credentials are associated with apool. A date/time entry indicates to Sterling B2B Integrator when to start usingthat credential for new connections. This applies primarily to external pools,although Sterling B2B Integrator database pools will also work.
You can use the following variables for the date format:v 15:00:00 3/16/09v 3/16/09 15:00:00v 3/16/2009 15:00:00v Sat, 12 Aug 1995 13:30:00 GMTv Sat, 12 Aug 1995 13:30:00 GMT+0430
Note: Other formats may be used as long as they follow the Internet EngineeringTask Force (IETF) standard date syntax. For additional information, seehttp://www.ietf.org/rfc/rfc3339.txt.
Pool Property Description
newDBPool.password.1 =<new password>
You can specify alphabets and combination of alphabets andnumbers for the password. You can use numbers fornewDBPool.password.1 or newDBPool.password.2 as well asfollowing examples:
v newDBPool.password.a=password_a
v newDBPool.effective.a=1/01/2005 09:35:00
v newDBPool.password.b=password_b
v newDBPool.effective.b=02/01/2009 09:35:00
v newDBPool.password.c=password_c
v newDBPool.effective.c=06/18/2009 11:07:00
Performance Management 21

newDBPool.effective.1 =<The date for the newpassword starts to takeaffect>
You can specify alphabets and combination of alphabets andnumbers for the password. You can use numbers fornewDBPool.password.1 or newDBPool.password.2 as well asfollowing examples:
v newDBPool.password.a=password_a
v newDBPool.effective.a=1/01/2005 09:35:00
v newDBPool.password.b=password_b
v newDBPool.effective.b=02/01/2009 09:35:00
v newDBPool.password.c=password_c
v newDBPool.effective.c=06/18/2009 11:07:00
System Logs and Error Logs: System Logs
When applicable, the following items are logged in system logs:v Logging the switch from one credential to the next, as well as the initialization
of the pool dates and user IDs being used (not the passwords).v Logging if the connection is expired when it returns to the pool.v Logging if two passwords have the same effective dates. In this case, the system
randomly selects a password and log that two passwords had the same effectivedates. Additional logs on passwords and effective dates may be added.
v Logging when pool properties are changed. If you changed the pool relatedproperty like maxSize, or lifespan the following message appears in the systemlog: "for pool name ***** <PROPERTY> is changed".
Error Logs
The following list provides descriptions of the different types of errors that can belogged:v Failed to add the pool <pool name>v Failed to delete the pool <pool name>v Failed to modify the pool <pool name>v Failed to create the connections from the pool <pool name>
Oracle Database Configuration and MonitoringThis topic provides information about configuring and monitoring Oracle database.It also provides information about concepts such as init parameter configuration,rolling back or undoing changes to the database, database storage, and monitoringwith Automatic Workload Repository (AWR) reports.
Oracle init parameter configuration checklistThe Oracle init parameters have mandatory and recommended settings for SterlingB2B Integrator performance with an Oracle database.
Mandatory Oracle init parameters:
The Oracle init parameters have mandatory settings for Sterling B2B Integratorperformance with an Oracle database.
Parameter Mandatory value
cursor_sharing Exact
Character set AL32UTF8
22 Sterling B2B Integrator: Performance Management
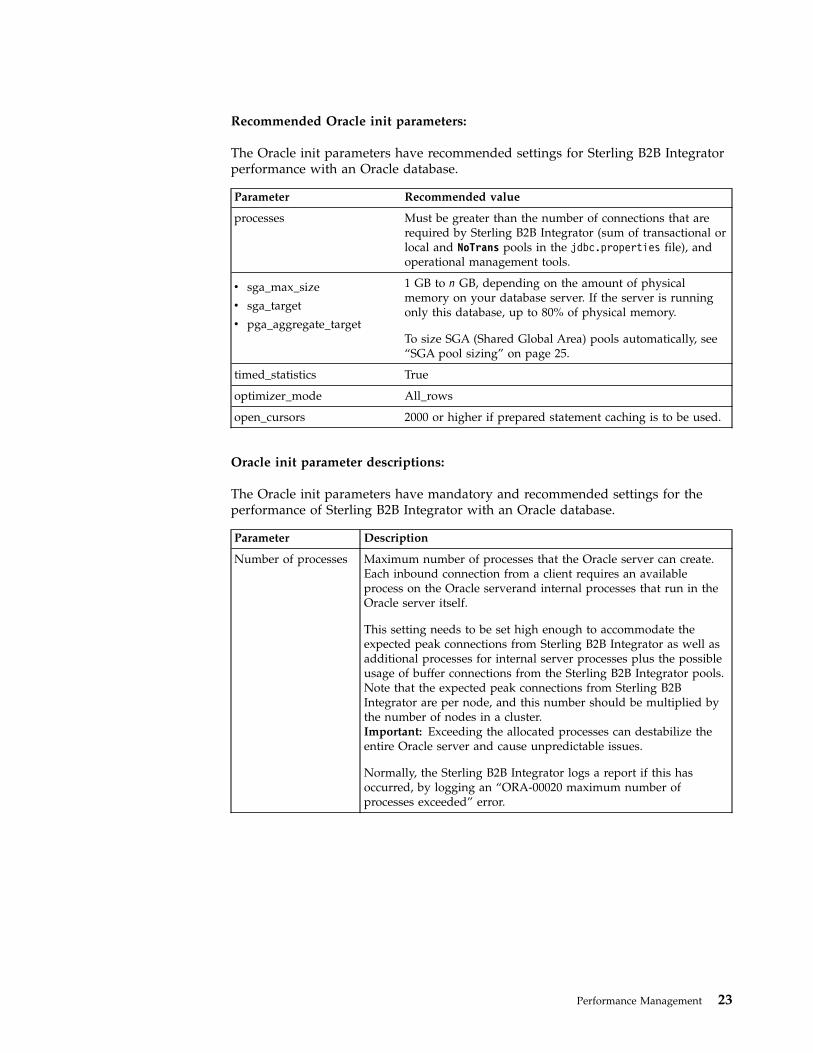
Recommended Oracle init parameters:
The Oracle init parameters have recommended settings for Sterling B2B Integratorperformance with an Oracle database.
Parameter Recommended value
processes Must be greater than the number of connections that arerequired by Sterling B2B Integrator (sum of transactional orlocal and NoTrans pools in the jdbc.properties file), andoperational management tools.
v sga_max_size
v sga_target
v pga_aggregate_target
1 GB to n GB, depending on the amount of physicalmemory on your database server. If the server is runningonly this database, up to 80% of physical memory.
To size SGA (Shared Global Area) pools automatically, see“SGA pool sizing” on page 25.
timed_statistics True
optimizer_mode All_rows
open_cursors 2000 or higher if prepared statement caching is to be used.
Oracle init parameter descriptions:
The Oracle init parameters have mandatory and recommended settings for theperformance of Sterling B2B Integrator with an Oracle database.
Parameter Description
Number of processes Maximum number of processes that the Oracle server can create.Each inbound connection from a client requires an availableprocess on the Oracle serverand internal processes that run in theOracle server itself.
This setting needs to be set high enough to accommodate theexpected peak connections from Sterling B2B Integrator as well asadditional processes for internal server processes plus the possibleusage of buffer connections from the Sterling B2B Integrator pools.Note that the expected peak connections from Sterling B2BIntegrator are per node, and this number should be multiplied bythe number of nodes in a cluster.Important: Exceeding the allocated processes can destabilize theentire Oracle server and cause unpredictable issues.
Normally, the Sterling B2B Integrator logs a report if this hasoccurred, by logging an “ORA-00020 maximum number ofprocesses exceeded” error.
Performance Management 23

Parameter Description
open_cursors Number of cursors that the Oracle server can create. Each processthat is servicing a connection will normally spawn two or morecursors, plus additional cursors that are needed for internal serverprocesses.
As with the processes, this needs to be set high enough toaccommodate the expected peak connections, multiplied by two,plus an allocation for possible buffer connections. This should alsobe multiplied by the number of nodes in the cluster.
A simple rule of thumb is to set this to four times the number ofprocesses, four times the number of nodes of Sterling B2BIntegrator, plus an additional 10%.
If the number of cursors is exceeded, Sterling B2B Integrator logs“ORA-01000: maximum open cursors exceeded.”
Character Set Controls the storage of character data in the Oracle database. TheUTF8 set most closely matches the default character set for Javaand will prevent any conversion of character data.
AL32UTF8 is the preferred setting for Oracle database.
cursor_sharing Controls whether SQL sent from a client is reparsed each time, orif the server can reuse (“share”) the complied plan.
Sterling B2B Integrator requires the setting to be “exact” for bothperformance and data integrity.
sga_max_size Maximum size of the memory allocated to the System Global Area(SGA). This controls the maximum memory that can be allocatedto the system area of the Oracle instance. The size of the SGAshould never exceed the size of the actual memory (RAM) installedon the server.
A rule of thumb is that the SGA maximum size should be allottedas much memory as possible, but should not exceed 80% of thetotal memory of the server.
sga_max_target Target value that Oracle uses for automatic allocation of SGA poolresources.
Recommended setting is equal to the sga_max_size. The exceptionis for extremely large databases, where this may need to beadjusted manually.
pga_aggregate_target Specifies the target aggregate Program Global Area memoryavailable to all server processes attached to the Oracle instance.These are normally internal Oracle processes, and are not used byclients connecting to the instance.
Recommended setting is a non-zero value. This allows the Oracleinstance to size the SQL working areas automatically as needed.
timed_statistics Controls whether database statistics for particular times are loggedby Oracle. This information may be useful to monitor system orapplication performance.
Setting timed_statistics to TRUE may incur a slight overall loadincrease on the Oracle instance. However, the information it createsis valuable for diagnosing issues with performance of the instance.
24 Sterling B2B Integrator: Performance Management

Parameter Description
optimizer_mode Controls the mode that the optimizer uses to select the properexecution path for fulfilling query results, among other functions.
Setting this to an incorrect mode can dramatically affect the overallperformance of the server.
Recommended setting for Sterling B2B Integrator: all_rows
SGA pool sizing:
As an alternative to manually sizing the main SGA pools in an Oracle database,IBM recommends that you use Automatic Shared Memory Management (ASMM).
This feature controls pool size dynamically at run time, readjusting the sizes of themain pools (db_cache_size, shared_pool_size, large_pool_size, java_pool_size)based on existing workloads.
Set the following values to enable Oracle ASMM:v Use an spfile for the init.ora valuesv Set sga_target to a non-zero valuev Set statistics_level to TYPICAL (the default) or ALLv Set shared_pool_size to a non-zero value
Rolling Back or Undoing Changes in Oracle DatabaseOracle database supports AUTO UNDO management. Its use is recommended toavoid manual monitoring of UNDO segments. Set theUNDO_MANAGEMENT=AUTO parameter in init<SID>.ora. Your databaseadministrator needs to determine the UNDO_RETENTION setting.
Ensure that the file system where UNDOTBS1 tablespace is located has enoughspace to use the AUTOGROW setting. As a starting point, size the undo tablespaceat 20% of the total database size.
Redo Logs
Redo logs are critical for database and instance recovery. Correct redo logconfiguration is also critical for performance. We have seen best performance whileimplementing redo logs on ASM. The following is recommended:v Consider implementing redo logs on dedicated disk devices, preferably RAID 10.v Consider implementing redo log group log files on alternating disks.
Redo File Size
Your choice of redo file size depends on your trade-off between performance andavailability, specifically the time required to recover the Oracle instance in theevent of a failure. For performance, some installations opt to create large redo logsin order to reduce the frequency of log switches. However, this means potentiallymore transactions in the redo logs that must be replayed during recovery.
The general rule for sizing redo log files is to consider the time it takes to switchlog files. Generally, do not switch logs more than once every 20 to 30 minutes.
Issue the following query to see how often the redo log files are changing:
Performance Management 25

select * from v$loghist order by first_time desc
Following is an example of the output:
THREAD# SEQUENCE# FIRST_CHANGE# FIRST_TIME SWITCH_CHANGE#
1 97 7132082 10/20/2008 11:47:53 PM 7155874
1 96 7086715 10/20/2008 11:32:04 PM 7132082
1 95 7043684 10/20/2008 11:15:07 PM 7086715
1 94 6998984 10/20/2008 11:00:57 PM 7043684
1 93 6950799 10/20/2008 10:48:03 PM 6998984
In this example, the logs are switched every 15 minutes.
Rollback Transaction Errors
If Sterling B2B Integrator is running with Oracle and is under load, the snap shottoo old SQL error may be found in the wf.log file. The SQL error can be resolvedwith the following:v Tune the Oracle database by increasing undo_retention and redo table space.v If the SQL error is from WFReportService (from the stack trace in wf.log),
change the useNewStateAndStatusLogic property in jdbc.properties andjdbc.properties.in to false. This will prevent the snap shot too old SQL error, butit might cause the Recover process to run longer.
Database StorageThis topic provides information about database storage.
ASM
It is recommended that you use Oracle Automatic Storage Management (ASM) tomanage database storage. The benefits of using ASM include:v Improved I/O performance and scalabilityv Simplified database administrationv Automatic I/O tuningv Reduction in number of objects to manage
For more information, consult these sources:v ASM documents available on the Oracle Web site.v Storage vendor best practice papers about how to configure ASM for their
storage products.
Raw Disks
For performance-critical systems, importing only raw devices into ASM isrecommended. For high-volume processing environments, ensure that ASM isconfigured with disk devices from high-performance disk storage arrays. Somecharacteristics that you should look for include large NVRAM caches in order tobuffer the disk reads and writes, and for efficient RAID implementation.
26 Sterling B2B Integrator: Performance Management
Configure ASM with External Redundancy to ensure that redundancy is providedby your storage array.
Raw devices (raw partitions or raw volumes) can be used directly under Oracle onUNIX-based or Linux-based systems and can help performance. However, rawdisks have the following potential disadvantages:v Raw devices may not solve problems with file size writing limits.
To display current UNIX file size limits, run the following command:ulimit -a
v It may not be possible to move files to other disk drives if you are using rawdevices. If a particular disk drive has intense I/O activity, and performance willbenefit from the movement of an Oracle data file to another drive, it is likelythat no acceptably-sized partition or volume exists on a drive with less I/Oactivity.
v Raw devices are more difficult to administer than data files stored on a filesystem or in an Automatic Storage Management disk group.
When deciding whether to use raw devices, consider the following issues:v Raw disk partition availability
Use raw partitions for Oracle files only if you have at least as many raw diskpartitions as Oracle data files. If disk space is a consideration, and the raw diskpartitions are already created, match the data file size to the partition size asclosely as possible to avoid wasting space.You must also consider the performance implications of using all the disk spaceon a few disks as opposed to using less space on more disks.
v Logical volume managerLogical volume managers manage disk space at a logical level and hide some ofthe complexity of raw devices. With logical volumes, you can create logical disksbased on raw partition availability.The logical volume manager controls fixed-disk resources by:– Mapping data between logical and physical storage– Enabling data to span multiple disks and to be discontiguous, replicated, and
dynamically expandedFor RAC, you can use logical volumes for drives associated with a singlesystem, as well as those that can be shared with more than one system of acluster. Shared drives enables all the files associated with a RAC database to beplaced on these shared logical volumes.
v Dynamic performance tuningTo optimize disk performance, you can move files from disk drives with highactivity to disk drives with low activity. Most hardware vendors who providethe logical disk facility also provide a graphical user interface (GUI) that you canuse for tuning.Refer to your operating system documentation on how to use raw devices withyour OS.
Tablespaces (Single or Multiple)
Prior to production, you should plan the overall storage strategy. The DDLs tocreate temporary tablespaces and data tablespaces are left to the discretion of thecustomer. General recommendations include:
Performance Management 27

v Implement these tablespaces as locally managed tablespaces (LMTs) byspecifying extent management as local when creating the tablespace.
v Implement tablespaces with Automatic Space Management by specifyingsegment space management as auto.
v With LMTs, you may want to consider creating tablespaces that store smallreference tables with the autoallocate extent allocation model.
v Consider putting large tables into their own tablespace and using the uniformextent allocation model. Use the default extent size 1 MB.
v Create your temporary tablespace as a temporary data file (temp files). Tempfiles are used to store intermediate results, such as from large sort operation.Changes to temp files are not recorded in the redo logs.
I/O Sub-System Response Time
Sterling B2B Integrator is an On-Line Transaction Processing (OLTP) application.As an OLTP application, database response time to the I/O sub-system needs to bein the single digit range even during the peak periods. The database response timeto the I/O sub-system should be less than:v 5 ms for logs. 1ms or better is recommended.v 10 ms or better for data. 5ms is recommended.
Monitoring with the AWR Report
Important: The information in an Automatic Workload Repository (AWR) reportneeds to be considered in relation to Sterling B2B Integrator performance. Thisinformation is not meaningful in isolation. You should monitor AWR over a periodof time to establish your steady state performance baseline. You should monitorAWR even if Sterling B2B Integrator is performing to your satisfaction; doing socould uncover issues before they become noticeable.
The AWR is used to collect performance statistics, including:v Wait events used to identify performance problemsv Time model statistics indicating the amount of DB time associated with a process
from the V$SESS_TIME_MODEL and V$SYS_TIME_MODEL viewsv Active Session History (ASH) statistics from the V$ACTIVE_SESSION_HISTORY
viewv Selected system and session statistics from the V$SYSSTAT and V$SESSTAT
viewsv Object usage statisticsv Resource-intensive SQL statements
The repository is a source of information for several other Oracle database features,including:v Automatic Database Diagnostic Monitorv SQL Tuning Advisorv Undo Advisorv Segment Advisor
By default, AWR snapshots of the relevant data are taken every hour and retainedfor seven days. It is recommended to set shorter intervals, for example, 30 minutes,because at longer intervals, the issues are less noticeable. Default values for thesesettings can be altered with statements such as:
28 Sterling B2B Integrator: Performance Management
BEGIN
DBMS_WORKLOAD_REPOSITORY.modify_snapshot_settings(
retention => 43200, -- Minutes (= 30 Days).
Current value retained if NULL.
interval => 30); -- Minutes. Current value retained if NULL.
END;
/
A typical Sterling B2B Integrator deployment contains characteristics of bothinteractive and batch data processing systems, including a high volume of smalltransactions that rapidly update the database and periodic long-runningtransactions that touch many records.
The key areas to inspect in an AWR report are:v Top SQL (by CPU or I/O)v Top wait eventsv Buffer cache hit ratio (refer to the topic "Instance Efficiency Percentages")v I/O contention (hot spots) on disks (refer to the topic " Tablespace IO Stats and
File IO Stats")
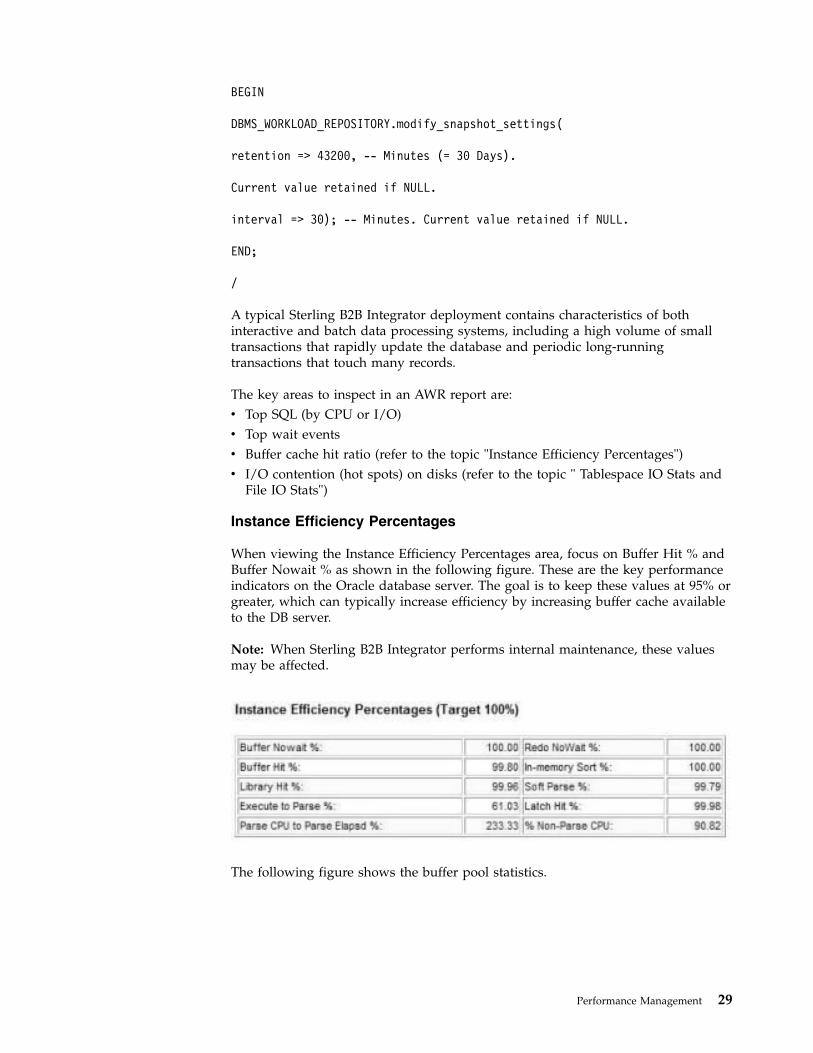
Instance Efficiency Percentages
When viewing the Instance Efficiency Percentages area, focus on Buffer Hit % andBuffer Nowait % as shown in the following figure. These are the key performanceindicators on the Oracle database server. The goal is to keep these values at 95% orgreater, which can typically increase efficiency by increasing buffer cache availableto the DB server.
Note: When Sterling B2B Integrator performs internal maintenance, these valuesmay be affected.
The following figure shows the buffer pool statistics.
Performance Management 29

Tablespace IO Stats and File IO Stats
Review the IO Stats area to obtain information about hotspots or drive contention.Analysis of information such as Buffer Wait and Average Buffer Waits can help youdetermine whether you are getting the best performance from your drives, andidentify potential bottlenecks. Separation of objects into their own uniquetablespaces can contribute to performance tuning of specific areas.
Wait Events
The AWR report for Sterling B2B Integrator shows typical wait events as displayedin the following figure. To see if the wait events are problematic, compare it to abaseline in your environment. The following figures are an example of what youcan see normally for Sterling B2B Integrator.
The SQL statements that should be inspected are SQL ordered by Gets and SQLordered by Reads as shown in the following figure. Again, compare these with thebaseline of the system to determine if any SQL statement is behaving oddly. If yes,refer to the query plans to determine if the query plan is appropriate.
30 Sterling B2B Integrator: Performance Management
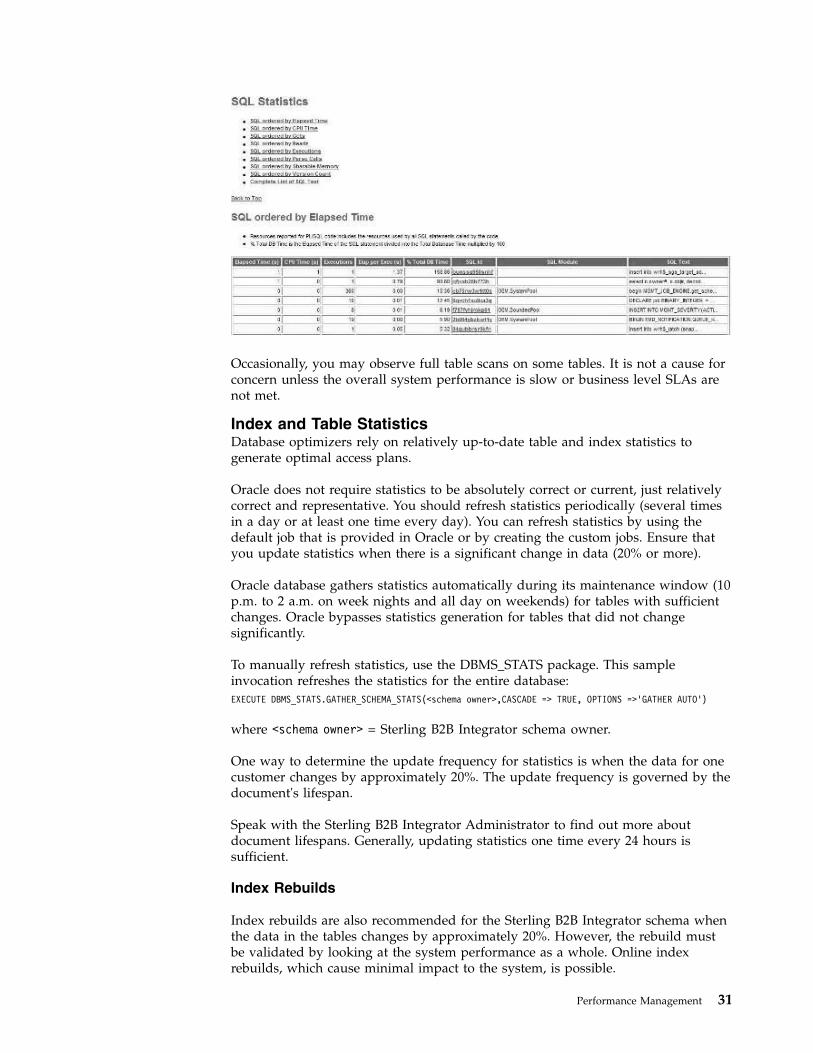
Occasionally, you may observe full table scans on some tables. It is not a cause forconcern unless the overall system performance is slow or business level SLAs arenot met.
Index and Table StatisticsDatabase optimizers rely on relatively up-to-date table and index statistics togenerate optimal access plans.
Oracle does not require statistics to be absolutely correct or current, just relativelycorrect and representative. You should refresh statistics periodically (several timesin a day or at least one time every day). You can refresh statistics by using thedefault job that is provided in Oracle or by creating the custom jobs. Ensure thatyou update statistics when there is a significant change in data (20% or more).
Oracle database gathers statistics automatically during its maintenance window (10p.m. to 2 a.m. on week nights and all day on weekends) for tables with sufficientchanges. Oracle bypasses statistics generation for tables that did not changesignificantly.
To manually refresh statistics, use the DBMS_STATS package. This sampleinvocation refreshes the statistics for the entire database:EXECUTE DBMS_STATS.GATHER_SCHEMA_STATS(<schema owner>,CASCADE => TRUE, OPTIONS =>’GATHER AUTO’)
where <schema owner> = Sterling B2B Integrator schema owner.
One way to determine the update frequency for statistics is when the data for onecustomer changes by approximately 20%. The update frequency is governed by thedocument's lifespan.
Speak with the Sterling B2B Integrator Administrator to find out more aboutdocument lifespans. Generally, updating statistics one time every 24 hours issufficient.
Index Rebuilds
Index rebuilds are also recommended for the Sterling B2B Integrator schema whenthe data in the tables changes by approximately 20%. However, the rebuild mustbe validated by looking at the system performance as a whole. Online indexrebuilds, which cause minimal impact to the system, is possible.
Performance Management 31

The Sterling B2B Integrator system administrator must work with the DBA toidentify the indexes that must be rebuilt. You must always rebuild indexes atschema level.
Sterling B2B Integrator is a high-volume OLTP application, and rarely, there mightbe times when you might need to shrink the tables or rebuild indexes. Oracledocumentation provides details about the following tasks:v Shrinking database segments online
– http://docs.oracle.com/cd/B28359_01/server.111/b28310/schema003.htm#ADMIN10161 (Oracle Database 11g Release 1)
– http://docs.oracle.com/cd/E18283_01/server.112/e17120/schema003.htm#ADMIN10161 (Oracle Database 11g Release 2)
– http://docs.oracle.com/database/121/ADMIN/schema.htm#CBBBIADA(Oracle Database 12c Release 1)
v Rebuilding an existing index– http://docs.oracle.com/cd/B28359_01/server.111/b28310/
indexes004.htm#ADMIN11734 (Oracle Database 11g Release 1)– http://docs.oracle.com/cd/E18283_01/server.112/e17120/
indexes004.htm#insertedID2 (Oracle Database 11g Release 2)– http://docs.oracle.com/database/121/ADMIN/indexes.htm#i1006864 (Oracle
Database 12c Release 1)
Enable BLOB CachingBy default, Oracle database configures itself with the BLOB caching disabled whenyou choose Oracle as your database during Sterling B2B Integrator installation.
You can significantly improve performance by enabling the cache on the BLOBdata object,. Run the following commands while connected to the database:
ALTER TABLE DATA_TABLE MODIFY LOB (DATA_OBJECT) (CACHE)
ALTER TABLE TRANS_DATA MODIFY LOB (DATA_OBJECT) (CACHE)
For regular tuning and best practices pertaining to Oracle, refer to thecorresponding Oracle documentation.
Using Oracle Real Application Clusters (RAC) for HighAvailabilityOracle Real Application Clusters (RAC) ensures high availability by supporting thedeployment of a database across multiple machines, thereby reducing thedowntime due to hardware failures or outages, planned or unexpected.
The following diagram shows how all transactions should be sent to one OracleRAC node at a time. If that database node goes down, all Sterling B2B Integratornodes reconnect to the second available database node. This scenario requires thatload balancing is turned off, and provides better overall system performance.
32 Sterling B2B Integrator: Performance Management

The following table lists the features and benefits of Oracle RAC when used withSterling B2B Integrator:
Features Benefits
Load balancing Oracle RAC supports initial connection time load balancing and runtimeconnection load balancing. However, running Sterling B2B Integratorwith load balancing turned on is likely to result in performance issues.On the client side (jdbc url), you should set the parameter LOAD_BALANCEto OFF. On the server side, turn off load balancing on the databaseservice.
SCAN (SingleClient AccessName)
Available in Oracle RAC 11g R2, SCAN allows you to set up RACfailover without specifying nodes. Using traditional RAC in Sterling B2BIntegrator, you configure the JDBC URL to name an initial node and afailover node. With SCAN, you configure the JDBC URL so that SCANselects the initial node and fails over to the other available node.
A benefit to using SCAN over traditional RAC is that you do not needto update the URL when a node name changes. There is, however, apotential performance degradation as SCAN searches for an availablenode.
Performance Management 33
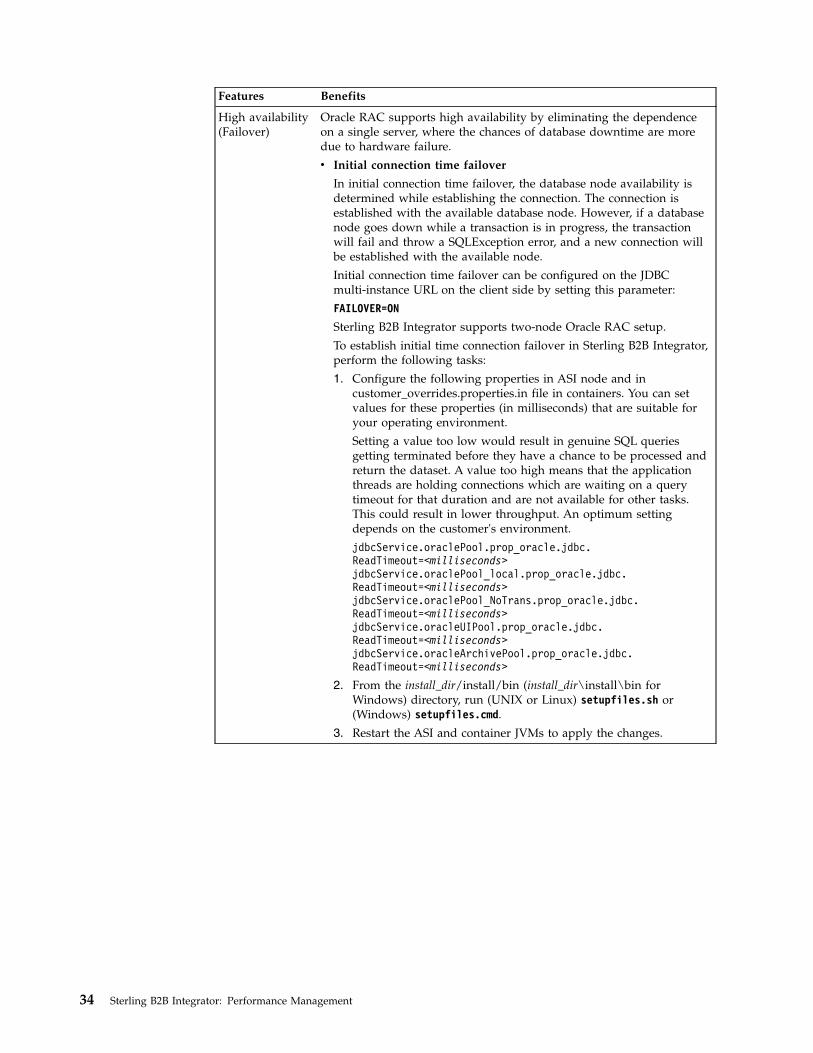
Features Benefits
High availability(Failover)
Oracle RAC supports high availability by eliminating the dependenceon a single server, where the chances of database downtime are moredue to hardware failure.
v Initial connection time failover
In initial connection time failover, the database node availability isdetermined while establishing the connection. The connection isestablished with the available database node. However, if a databasenode goes down while a transaction is in progress, the transactionwill fail and throw a SQLException error, and a new connection willbe established with the available node.
Initial connection time failover can be configured on the JDBCmulti-instance URL on the client side by setting this parameter:
FAILOVER=ON
Sterling B2B Integrator supports two-node Oracle RAC setup.
To establish initial time connection failover in Sterling B2B Integrator,perform the following tasks:
1. Configure the following properties in ASI node and incustomer_overrides.properties.in file in containers. You can setvalues for these properties (in milliseconds) that are suitable foryour operating environment.
Setting a value too low would result in genuine SQL queriesgetting terminated before they have a chance to be processed andreturn the dataset. A value too high means that the applicationthreads are holding connections which are waiting on a querytimeout for that duration and are not available for other tasks.This could result in lower throughput. An optimum settingdepends on the customer's environment.
jdbcService.oraclePool.prop_oracle.jdbc.ReadTimeout=<milliseconds>jdbcService.oraclePool_local.prop_oracle.jdbc.ReadTimeout=<milliseconds>jdbcService.oraclePool_NoTrans.prop_oracle.jdbc.ReadTimeout=<milliseconds>jdbcService.oracleUIPool.prop_oracle.jdbc.ReadTimeout=<milliseconds>jdbcService.oracleArchivePool.prop_oracle.jdbc.ReadTimeout=<milliseconds>
2. From the install_dir/install/bin (install_dir\install\bin forWindows) directory, run (UNIX or Linux) setupfiles.sh or(Windows) setupfiles.cmd.
3. Restart the ASI and container JVMs to apply the changes.
34 Sterling B2B Integrator: Performance Management

Features Benefits
High availability(Failover),continued
v Runtime connection failover
When one Oracle RAC node goes down, the active connections fromthe node that went down will failover to the active node. When thenode that went down is up and running again, the connections arenot redistributed. You can redistribute the connection pools by settinglifespan parameter to a value greater than 0, which ensures thatconnection pools are terminated after the lifespan value is met andload balancing occurs when new connections are established.However, configuring a low value lifespan may lead to connectionsbeing terminated quickly thereby losing the benefit of connectionpool.
To override all the Oracle pools lifespan to a value greater than 0, setthe following value in the customer_overrides.properties file:
jdbcService.<oraclepool>.lifespan=180000
Visibility EventQueues
You can increase the number of visibility queues and event input queuecapacity in customer_overrides.properties to ensure that adapters areresponsive.
To increase the default queue size and the thread counts, perform thefollowing tasks:
1. Set the following values in the ASI node and incustomer_overrides.properties.in file in containers:
dmivisibility.number_visibility_threads=6dmivisibility.event_input_queue_capacity=3072
2. From the install_dir/install/bin (install_dir\install\bin for Windows)directory, run (UNIX or Linux) setupfiles.sh or (Windows)setupfiles.cmd.
3. Restart the ASI and container JVMs to apply the changes.
Fast ConnectionFailover (FCF)
Sterling B2B Integratordoes not support Fast Connection Failover (FCF).
TransparentApplicationFailover (TAF)
Sterling B2B Integratordoes not support Transparent ApplicationFailover (TAF).
IBM DB2 for LUW Configuration and MonitoringThis topic provides information about configuring and monitoring IBM DB2® forLUW (Linux, UNIX, and Windows). It describes the recommended registryvariables and DBM CFG parameters. It also provides details about the storagesubsystem, log configuration, database monitoring, and index and table statistics.
Mandatory settings for IBM DB2 registry variablesMandatory IBM DB2 registry values are critical for IBM DB2 performance withSterling B2B Integrator.
Performance Management 35

Variable Mandatory value
DB2_SKIPDELETED ON
Allows index-range queries or table-scan queries to skiprecords that are in an uncommitted delete state. Thisreduces the amount of lock contention from Read Shareand Next Key Share locks from range queries in tableswith a high frequency of deletes.
When enabled, DB2_SKIPDELETED allows, wherepossible, table or index access scans to defer or avoidrow locking until a data record is known to satisfypredicate evaluation. This allows predicate evaluationto occur on uncommitted data.
This variable is applicable only to statements usingeither Cursor Stability or Read Stability isolation levels.For index scans, the index must be a type-2 index.Deleted rows are skipped unconditionally on table scanaccess while deleted keys are not skipped for type-2index scans unless DB2_SKIPDELETED is also set.
Recommended value: ON
DB2_SKIPINSERTED ON
Allows SELECTs with Cursor Stability or Read Stabilityisolation levels to skip uncommitted inserted rows. Thisreduces record lock contention on tables with heavyinsert rates.
Recommended settings for IBM DB2 registry variablesIBM DB2 registry values include recommended settings for IBM DB2 performancewith Sterling B2B Integrator.
Variable Recommended value
DB2_USE_ALTERNATE_PAGE_CLEANING
ON
DB2_EVALUNCOMMITTED
ON
Enabling this variable can reduce the amount ofunnecessary lock contention from Read Share and NextKey Share. By default, DB2 requests share locks on theindex or record before verifying if the record satisfiesthe query predicate. Queries that scan a set of recordsin tables with high frequency of inserts or updates canunnecessarily block records that do not belong to itsresult set.
When you set DB2_EVALUNCOMMITTED to ON, DB2performs an uncommitted read on the record toperform the predicate verification. If the record satisfiesthe predicate, DB2 requests a share lock on that record.
36 Sterling B2B Integrator: Performance Management

Variable Recommended value
DB2_PARALLEL_IO Changes the way in which DB2 calculates I/Oparallelism to the tablespace. By default, DB2 sets I/Oparallelism to a tablespace equal to the number ofcontainers in that tablespace. For example, if thetablespace has four containers, prefetches to thattablespace are performed as four extent-sized prefetchrequests.
Set the DB2_PARALLEL_IO variable if you haveimplemented containers on stripped devices (forexample, RAID-5, RAID-10, or RAID-01). If you setDB2_PARALLEL_IO=ON or DB2_PARALLEL_IO=*,DB2 assumes that containers are implemented on aRAID 5 (6+1) configuration: six data disks plus oneparity disk.
In this example, prefetches to the four-containertablespace mentioned above are performed in 24extent-sized prefetch requests.
To assess the effectiveness of your prefetch parallel I/Osettings, monitor the unread_prefetch_pages andprefetch_wait_time monitor element with thesnapshot_database monitor. The unread_prefetch_pagesmonitor element tracks the number of prefetch pagesthat were evicted from the buffer pool before it wasused. A continually growing number indicates that theprefetch requests are too large, either because theprefetch size is larger than the pages needed or theprefetch activities are bringing in too many pages forthe capacity of the buffer pool. In either case, you maywant to consider reducing the prefetch size.
If you have high prefetch_wait_time values, theapplication might be waiting for pages.
DB2_NUM_CKPW_DAEMONS
0
Set this on IBM AIX 5.3 only if you observe a memoryleak during connect authentication within DB2'sauthentication daemons (db2ckpwd processes) as aresult of calling the AIX loginsuccess() API.
Symptoms may include excessive memory usage, aninstance crash due to a trap in the db2ckpwd process,or general authentication failures. Verify by monitoringthe SZ and RSS values for db2ckpwd processes. Use theps aux | grep db2ckpwd command and look at the fifthand sixth columns of output.
DB2 workaround exists for this problem. Set thefollowing registry variable, and recycle this instance:
db2set DB2_NUM_CKPW_DAEMONS=0
Also see IBM APAR IY78341.
DB2LOCK_TO_RB STATEMENT
Performance Management 37
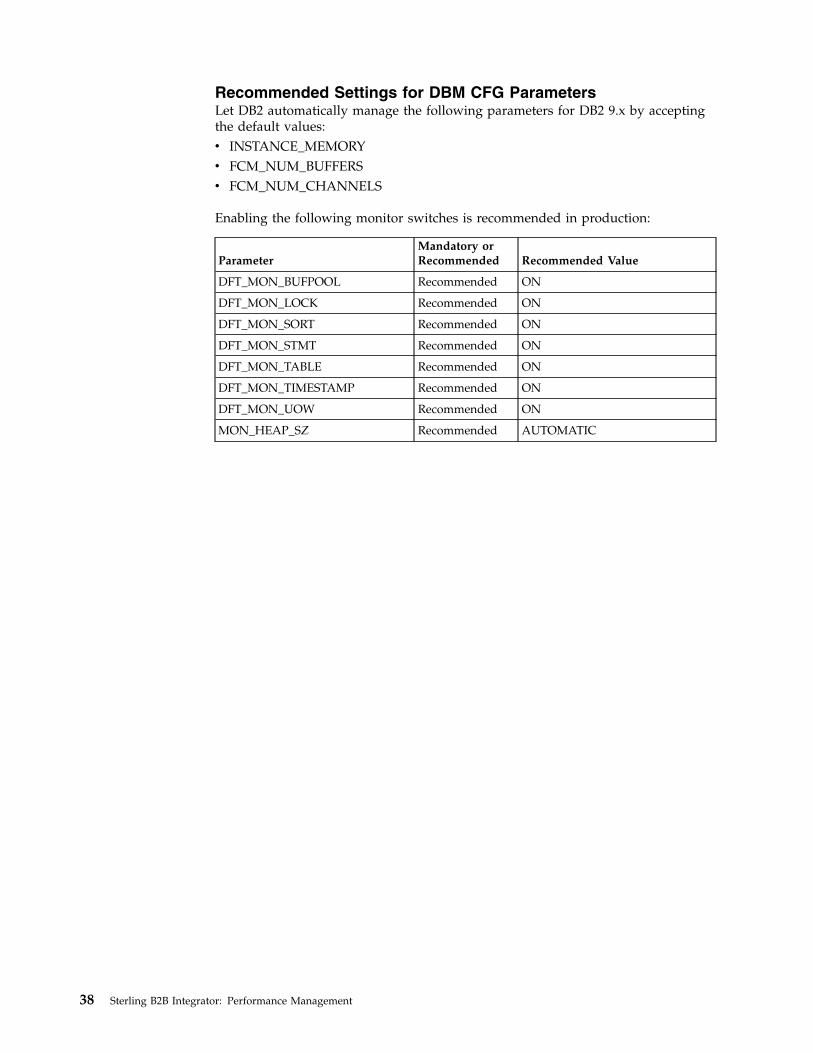
Recommended Settings for DBM CFG ParametersLet DB2 automatically manage the following parameters for DB2 9.x by acceptingthe default values:v INSTANCE_MEMORYv FCM_NUM_BUFFERSv FCM_NUM_CHANNELS
Enabling the following monitor switches is recommended in production:
ParameterMandatory orRecommended Recommended Value
DFT_MON_BUFPOOL Recommended ON
DFT_MON_LOCK Recommended ON
DFT_MON_SORT Recommended ON
DFT_MON_STMT Recommended ON
DFT_MON_TABLE Recommended ON
DFT_MON_TIMESTAMP Recommended ON
DFT_MON_UOW Recommended ON
MON_HEAP_SZ Recommended AUTOMATIC
38 Sterling B2B Integrator: Performance Management

ParameterMandatory orRecommended Recommended Value
MAXAGENTS Recommended Limits the number of databasemanager agents (both coordinatoror subagents) that can runconcurrently. Pick a high enoughnumber so that the combinedconnection requirements from theapplication servers, agents,monitoring tools, and so on do notexceed the MAXAGENTS limitduring peak processing periods. Ifyou do, you must restart the DB2instance to increase this limit.
Recommend value: Must be greaterthan the number of connectionsneeded by Sterling B2B Integrator(that is, the sum of transactional(local) plus NoTrans pools injdbc.properties file) plus theconnections needed by operationalmanagement tools.
With the use of connection poolingin the NoApp Server, the numberof database connections is less thanthe number of users who arelogged in. Depending on youranticipated peak workload traffic,this parameter may range from asmall number such as 25 to a largenumber in the thousands.
Monitor the number of concurrentconnections in production(especially during peak periods) toensure that it does not reach themaximum. When theMAXAGENTS limit is reached,DB2 refuses to establish newconnection requests.
Estimation Guidelines for Number of Connections
You can roughly estimate the number of concurrent user connections required forSterling B2B Integrator with this formula:
Concurrent (DB2) connections = A + B + C + D
Variable Description
A Maximum number of UI-based connections
B Maximum NoApp Server connection pool max size times thenumber of NoApp Server instances (as in a cluster)
Performance Management 39
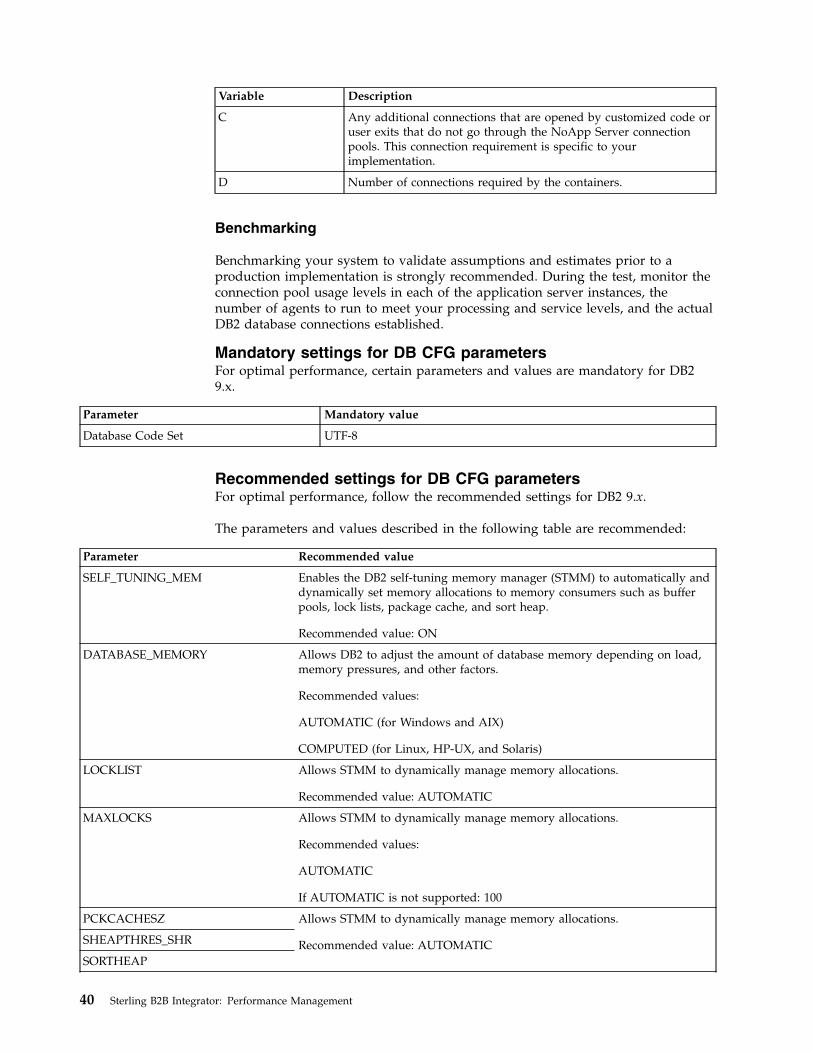
Variable Description
C Any additional connections that are opened by customized code oruser exits that do not go through the NoApp Server connectionpools. This connection requirement is specific to yourimplementation.
D Number of connections required by the containers.
Benchmarking
Benchmarking your system to validate assumptions and estimates prior to aproduction implementation is strongly recommended. During the test, monitor theconnection pool usage levels in each of the application server instances, thenumber of agents to run to meet your processing and service levels, and the actualDB2 database connections established.
Mandatory settings for DB CFG parametersFor optimal performance, certain parameters and values are mandatory for DB29.x.
Parameter Mandatory value
Database Code Set UTF-8
Recommended settings for DB CFG parametersFor optimal performance, follow the recommended settings for DB2 9.x.
The parameters and values described in the following table are recommended:
Parameter Recommended value
SELF_TUNING_MEM Enables the DB2 self-tuning memory manager (STMM) to automatically anddynamically set memory allocations to memory consumers such as bufferpools, lock lists, package cache, and sort heap.
Recommended value: ON
DATABASE_MEMORY Allows DB2 to adjust the amount of database memory depending on load,memory pressures, and other factors.
Recommended values:
AUTOMATIC (for Windows and AIX)
COMPUTED (for Linux, HP-UX, and Solaris)
LOCKLIST Allows STMM to dynamically manage memory allocations.
Recommended value: AUTOMATIC
MAXLOCKS Allows STMM to dynamically manage memory allocations.
Recommended values:
AUTOMATIC
If AUTOMATIC is not supported: 100
PCKCACHESZ Allows STMM to dynamically manage memory allocations.
Recommended value: AUTOMATICSHEAPTHRES_SHR
SORTHEAP
40 Sterling B2B Integrator: Performance Management

Parameter Recommended value
NUM_IOCLEANERS Recommended value: AUTOMATIC
NUM_IOSERVERS Recommended value: AUTOMATIC
DFT_PREFETCH_SZ Recommended value: AUTOMATIC
MAXAPPLS Recommended value: AUTOMATIC
APPLHEAPSZ Recommended value: AUTOMATIC
APPL_MEMORY Recommended value: AUTOMATIC
APP_CTL_HEAP_SZ 512Note: APP_CTL_HEAP_SZ is deprecated in DB2 9.5.
DBHEAP Amount required depends on the amount of memory available and thetraffic volume.
Recommended value: AUTOMATICNote: The default DBHEAP value is inadequate.
LOGFILSIZ Refer to the topic Log Configuration.
Recommended value: 65536 if configuring 20 transaction logs of 256 MB(65536 4 K pages)
LOGPRIMARY Number of primary transaction logs. Refer to the topic Log Configuration.
Recommended value: 40 or more
LOGSECOND Number of secondary transaction logs. These are allocated by DB2 when itcannot reuse any of the primary logs due to active transactions. Refer to thetopic Log Configuration.
Recommended value: 12
NUM_LOG_SPAN Refer to the topic Log Configuration.
Recommended value: LOGPRIMARY - Safety buffer
DFT_DEGREE Sets the default degree of parallelism for intrapartition parallelism. Ingeneral, online transactional applications such as Sterling B2B Integratortypically experience a high volume of short queries that do not benefit fromparallel queries.
Recommended value: 1 – Disable intrapartition parallelism
DB2LOCK_TO_RB Recommended value: STATEMENT
Performance Management 41

Recommended Settings for DB2 9.7The following table lists the recommended settings specific to DB2 9.7:
Feature Description Value
Currently CommittedSemantics
The DB2 database used the default CursorStability (CS) isolation level in all versionsuntil DB2 9.7. If an application changed arow and another application tried to readthat row before the first applicationcommitted the changes, the secondapplication waited until the commit.
You can now set the currently committedsemantics of the CS level, which informsDB2 that when the second application triesto read a locked row, it will get an image ofwhat the row looked like before committingthe change.
In the enhanced currently committedsemantics, only committed data is returned,as it used to be earlier. However, now readoperation does not wait for the writeoperation to release the row locks. Instead,the read operation returns the data prior tothe start of the write operation.
The currently committed semantics isturned on by default in the new DB 9.7database. The new database configurationparameter, cur_commit is used to overridethis behavior.
Currently committed semantics requiresmore log space for write operations. Inaddition, extra space is required for loggingthe first update of a data row during atransaction, which can have an insignificantor measurable impact on the total log spaceused.
Recommended value:ON
42 Sterling B2B Integrator: Performance Management

Feature Description Value
Limitations
The following list provides limitations thatapply to the currently committed semantics:
v The target table in sections that is usedfor data update or delete operation doesnot use currently committed semantics.
v An uncommitted modification to a rowforces the currently committed readoperation to access appropriate logrecords and determine the currentlycommitted version of the row. Althoughlog records that are no longer present inthe log buffer can be physically read,currently committed semantics does notsupport the retrieval of log files from thelog archive.
v The following scans does not usecurrently committed semantics:
– Catalog table scans
– Referential integrity constraintenforcement scans
– LONG VARCHAR or LONGVARGRAPHIC column reference scans
– Range-clustered table (RCT) scans
– Spatial or extended index scans
Statementconcentrator
DB2 uses less server resources whileprocessing queries that have parametersinstead of queries that have literal values inthem. DB2 will compile an SQL statementonce and will cache it. It presents the samequery execution plan from the cache thenext time for the same query therebyutilizing fewer resources tocompile/prepare the same statement.
However, it becomes a difficult task whenSQL statements use literal values instead ofparameters matching incoming statementsto what is already present in the statement.To prevail over this situation, statementconcentrator modifies dynamic SQLstatements at the database server so thatsimilar, but not identical, SQL statementscan share the same access plan.
You can enablestatementconcentrator byrunning the followingSQL statement:
db2 update db cfgfor <db-alias> usingstmt_conc literals
Performance Management 43

Feature Description Value
Inline LOBs Sterling B2B Integrator extensively useslarge objects (LOBs). These LOBs areusually a few kilobytes in size.
The LOB data access performance can beimproved by placing the LOB data withinthe rows on data pages instead of the LOBstorage object.
Typically, LOBs are stored in a separatestorage object that is outside the base table.LOBs can be stored in the formatted rowsof the base table if they are sufficientlysized. Depending on the page size, themaximum length of a LOB that can qualifyfor in table in-lining is 32660 bytes. SuchLOBs are commonly known as inline LOBs.
Earlier, the processing of such LOBs createdbottlenecks for application. However, nowLOBs improve the performance of queriesthat access the LOB data as there is noadditional I/Os required for fetching,inserting, or updating the data.
LBO inlining is enabled for all LOBcolumns in the new or existing tables forDB2 9.7 and for all existing LOB columns inan upgrade.
Enable LOB inliningthrough the INLINELENGTH option onthe CREATE TABLEstatement or theALTER TABLEstatement.
Recommended Settings for DB2 for Linux on System z (5.2.4.0 orlater)IBM recommends special settings for DB2 when using Sterling B2B Integrator5.2.4.0 or later on the Linux operating system on System z.
When you are running Sterling B2B Integrator 5.2.4.0 or later using the DB2database on the Linux operating system on System z (or zLinux), IBM recommendsthe following settings:v SCSI over FCP (fiber channel protocol) disks for data and transaction logs.v RAID 5 for data logs and RAID 10 or solid state drives (SSDs) for transaction
logs. All volumes should be striped across as many disks as possible. With thissetup, DB2 can be configured to use direct input and output.
An alternative setup is the use of separate extended count key data (ECKD) diskswith PAV (parallel access volumes) or HyperPAV for data and transaction logs. ThePAV and HyperPAV features are available on the IBM DS8000 series of IBM SANs.This setup tries to overcome the limitations of the typical ECKD disk setup. AllECKD volumes should be striped.
Storage SubsystemPrior to production, plan the overall storage strategy. The DDLs to createtemporary tablespaces and data tablespaces are left to the discretion of thecustomer. This topic discusses some general recommendations.
The Sterling B2B Integrator installation creates tables and indexes. The tables usedifferent page sizes: 4K, 8K, and 16K. You should have a tablespace to
44 Sterling B2B Integrator: Performance Management

accommodate tables with these page sizes. DB2 automatically places tables andindexes in the available tablespaces using its internal logic.
SMS Tablespaces in DB2
In an SMS (System Managed Space) table space, the operating system's file systemmanager allocates and manages the space where the table is stored. The storagemodel typically consists of many files, representing table objects, stored in the filesystem space. The user decides on the location of the files, DB2 controls theirnames, and the file system is responsible for managing them. By controlling theamount of data written to each file, the database manager distributes the dataevenly across the table space containers. By default, the initial table spaces createdat database creation time are SMS.
SMS table spaces are defined using the MANAGED BY SYSTEM option in theCREATE DATABASE command, or in the CREATE TABLESPACE statement.
Consider two key factors when you design your SMS table spaces:v Containers for the table space. You must specify the number of containers that
you want to use for your table space. It is crucial to identify all the containersyou want to use, because you cannot add or delete containers after an SMS tablespace is created.
v In a partitioned database environment, when a new partition is added to thedatabase partition group for an SMS table space, the ALTER TABLESPACEstatement can be used to add containers for the new partition.Each container used for an SMS table space identifies an absolute or relativedirectory name. Each of these directories can be located on a different file system(or physical disk). Estimate the maximum size of the table space with:Number of containers * maximum file system size supported by the operatingsystemThis formula assumes that there is a distinct file system mapped to eachcontainer, and that each file system has the maximum amount of space available.In practice, this may not be the case, and the maximum table space size may bemuch smaller. There are also SQL limits on the size of database objects, whichmay affect the maximum size of a table space.
v Extent size for the table spaceThe extent size can only be specified when the table space is created. Because itcannot be changed later, it is important to select an appropriate value for theextent size. If you do not specify the extent size when creating a table space, thedatabase manager will create the table space using the default extent size asdefined by the dft_extent_sz database configuration parameter. Thisconfiguration parameter is initially set based on the information provided whenthe database is created. If the dft_extent_sz parameter is not specified in theCREATE DATABASE command, the default extent size is set to 32.
DMS Tablespaces in IBM DB2
In a DMS (Database Managed Space) table space, the database manager controlsthe storage space. The storage model consists of a limited number of devices orfiles whose space is managed by DB2. The database administrator decides whichdevices and files to use, and DB2 manages the space on those devices and files.The table space is essentially an implementation of a special-purpose file systemdesigned to meet the needs of the database manager.
Performance Management 45
A DMS table space containing user-defined tables and data can be defined as:v A regular table space to store any table data, and optionally, index datav A large table space to store long field or LOB data, or index data
When designing your DMS table spaces and containers, you should consider thefollowing:v The database manager uses striping to ensure an even distribution of data across
all containers.v The maximum size of regular table spaces is 64 GB for 4 KB pages, 128 GB for 8
KB pages, 256 GB for 16 KB pages, and 512 GB for 32 KB pages. The maximumsize of large table spaces is 2 TB.Unlike SMS table spaces, the containers that make up a DMS table space do nothave to be the same size. However, the use of unequal container sizes is notusually recommended because it results in uneven striping across the containers,and results in suboptimal performance. If any container is full, DMS table spacesuse the available free space from other containers.
v Because space is preallocated, it must be available before the table space can becreated. When using device containers, the device must also exist with enoughspace for the definition of the container. Each device can have only onecontainer defined on it.To avoid wasted space, the size of the device and the size of the containershould be equivalent. If, for example, the device is allocated with 5000 pages,and the device container is defined to allocate 3000 pages, 2000 pages on thedevice will not be usable.By default, one extent in every container is reserved for overhead. Only fullextents are used. For optimal space management, use the following formula todetermine an appropriate size when allocating a container:extent_size * (n + 1)
In this formula:– extent_size is the size of each extent in the table space– n is the number of extents that you want to store in the container
v Device containers must use logical volumes with a "character-special interface,"and not physical volumes.You can use files instead of devices with DMS table spaces. No operationaldifference exists between a file and a device; however, a file can be less efficientbecause of the run-time overheads associated with the file system. Files areuseful when devices are not directly supported, a device is not available,maximum performance is not required, or you do not want to set up devices.If your workload involves LOBs or LONG VARCHAR data, you can deriveperformance benefits from file system caching.
Automatic Storage Management (ASM)
Automatic storage grows the size of your database across disk and file systems. Itremoves the need to manage storage containers manually by taking advantage ofthe performance and flexibility of database managed storage. In DB2 9.x, automaticstorage is enabled by default.
A database needs to be enabled for automatic storage when it is created. DB2 9.5and DB2 9.7 enable automatic storage by default when you create new databases.
46 Sterling B2B Integrator: Performance Management

You cannot enable automatic storage for a database if it was not created toaccommodate for it. Similarly, you cannot disable automatic storage for a databasethat was originally created to use it.
With automatic storage, you no longer need to worry about tasks such as creatingadditional table spaces for capacity, adding containers, and monitoring containergrowth. When you want to restore a database backup, on a different system (usingdifferent directory or path structures), you can redefine the storage paths, such thatthe new paths are used instead of the ones stored in the backup.
The following examples illustrate automatic storage usage on UNIX and Linuxsystems.
When a database is created, you can specify the storage pool for use by thedatabase. If no storage paths are specified, the default database path (dftdbpath) isused.
CREATE DATABASE test on /data/path1, /data/path2
You can add additional storage paths to the pool:
ALTER DATABASE ADD STORAGE /data/path3, /data/path4
Earlier, when you created tablespaces, you had to specify containers for them. Youcan now specify that they automatically use the database storage pool:
CREATE TABLESPACE ts1 MANAGED BY AUTOMATIC STORAGE
You can also define policies for storage growth and limits:
CREATE TABLESPACE ts2
INITIAL SIZE 500K
INCREASE SIZE 100K
MAXSIZE 100M
Note: For performance and simplicity, Automatic Storage Management isrecommended. If this is not possible, define SYSCATSPACE and SYSTOOLSPACE,temporary tablespaces as SMS, and other tablespaces holding application data asDMS.
I/O Sub-System Response Time
Sterling B2B Integrator is an On-Line Transaction Processing (OLTP) application.As an OLTP application, database response time to the I/O sub-system needs to bein the single digit range even during the peak periods. The database response timeto the I/O sub-system should be less than:v 5 ms for logs. 1ms or better is recommended.v 10 ms or better for data. 5ms is recommended.
Log ConfigurationThis topic provides information about the following logs:v LOGFILSIZ, LOGPRIMARY, LOGSECOND
Performance Management 47

v NUM_LOG_SPAN
LOGFILSIZ, LOGPRIMARY, LOGSECOND
At a minimum, configure 20 transaction logs (LOGPRIMARY=20) of 256 MB(LOGFILSIZ=65536 4K-pages) for Sterling B2B Integrator.
As an additional precaution, configure at least 12 secondary transaction logs(LOGSECOND=12). DB2 allocates secondary logs when it cannot reuse any of theprimary logs due to active transactions.
Track the following monitor elements to assess the effectiveness of these settings,and adjust as needed:v total_log_used and tot_log_used_top to see how much of the logs are usedv Which workloads are consuming or holding the transaction logs when
LOGPRIMARY approaches the total primary log capacity. If needed, raise thesetting for LOGPRIMARY.
v sec_log_used_top and sec_logs_allocated to see if secondary transaction logs areused. Investigate how often logging spills over to the secondary logs and whatworkloads are running during the spill. If needed, increase LOGPRIMARY toprevent log spills.
NUM_LOG_SPAN
This parameter limits the number of logs a transaction can span, which preventssituations where DB2 cannot switch transaction logs because all the transactionlogs are active. For example:v Someone may have updated a record in IBM Sterling Control Center, but may
have forgotten to commit the change.v Updates to one or more database records might not get committed due to a
software bug.
Set NUM_LOG_SPAN to a minimum of 12 so that valid long-running transactionsare not prematurely forced, and a maximum of LOGPRIMARY minus a safetybuffer. For example, if LOGPRIMARY=20 and you decide upon a safety buffer of 4,the maximum NUM_LOG_SPAN=16.
DB2 MonitoringDB2 includes many facilities for tracing system activity at just about any level ofdetail. This section covers the following topics:v Snapshot Monitorsv Snapshot Monitor Commandsv DB2 Event Monitorsv Use an Event Monitor to Diagnose and Flush Deadlocksv DB2 Performance Expert
Snapshot Monitors
Information about snapshot monitors is available by searching athttp://www.ibm.com/developerworks/.
Snapshot monitors collect information about the state of a DB2 instance and anydatabases it controls at a specific point in time. Snapshots are useful fordetermining the status of a database system. When taken at regular intervals, they
48 Sterling B2B Integrator: Performance Management

can provide information that lets you observe trends and identify potentialproblem areas. Snapshot monitoring is performed by executing the GET SNAPSHOTcommand from the DB2 Command-Line Processor (CLP).
Snapshot Monitor Commands
To use snapshot monitors, turn on the monitor switches and view data. Thefollowing table describes the command and syntax for specific tasks:
Task Command and Syntax
Turn on monitorswitches
db2 UPDATE MONITOR SWITCHES USING options
Options are:
lock on
sort on
statement on
table on
timestamp on
uow onNote: Monitor switches can also be controlled in the databasemanager configuration.
Check status ofmonitor switches
GET MONITOR SWITCHES
View snapshot data Switches must be turned on to view data.
GET SNAPSHOT FOR options
Options:
bufferpools on database_name
locks on database_name
dynamic sql on database_name
tables on database_name
applications on database_name
tablespaces on database_name
database on database_name
DB2 Event Monitors
Information about snapshot monitors is available by searching athttp://www.ibm.com/developerworks/.
Event monitors are used to monitor events in an area over time, such as byproducing event records at the start and end of multiple events. These records areuseful for resource planning, trend analysis, and so on.
Performance Management 49

The most common uses for event monitors are for connections, locks, andstatements. Output can be written to files, named pipes (useful if writing programsto retrieve monitor data), or to tables.
Event monitor output can be either blocked or nonblocked. Blocked output ensuresagainst data loss, but should generally be avoided for systems that produce a largevolume of records and for statement event monitors to avoid crashes.
You can limit the granularity of an event monitor to a single user or application.
Connection events can be used to track system usage on a user basis or applicationbasis. This data allows you to identify poorly performing programs, the heaviestusers, and usage trends. Daily review facilitates discussions with users about theactivity or about adjusting the DB2 physical design.
Use an Event Monitor to Diagnose and Flush Deadlocks
Sterling B2B Integrator, along with the necessary DB2 registry variables, isdesigned to minimize the occurrence of deadlocks. However, deadlocks may stilloccur in some situations, including the following:v Custom BP code may obtain records in a different order.v DB2 may choose an access plan that retrieves records in a different order.
The following table describes the actions to be performed for specific tasks:
Task What to Do
Set an event monitorto help diagnosedeadlocks
Run this command:
db2 -v create event monitor $MON for deadlocks with detailswrite to file $OUTDIR buffersize 64 nonblocked
db2 -v set event monitor $MON state = 1
Options:
MON – Monitor name (for example, DLMON)
OUTDIR – directory to store deadlock information
Determine that adeadlock has occurred
View data in the db2diag.log or in the Sterling B2B Integrator logs
Release a deadlock byflushing buffers
Run the following command:
db2 flush event monitor $MON
db2evmon -path $OUTDIR
The flush ensures that the deadlock records in the buffers arewritten out. The db2evmon command formats the deadlockinformation.
Optim™ Performance Manager Extended Edition
Optim Performance Manager is a performance analysis and tuning tool formanaging a mix of DB2 systems. It can be used to identify, diagnose, solve, andprevent performance problems.
50 Sterling B2B Integrator: Performance Management

For more information about the Optim Performance Manager Extended Edition,refer to:
http://www-01.ibm.com/software/data/optim/performance-manager-extended-edition
DB2 Index and Table StatisticsDB2 uses catalog statistics to determine the most efficient access plan for a query.Out-of-date or incomplete statistics for a table or an index may slowdown queryexecution.
Manual statistics management can be time-consuming. Automatic statisticscollection can run the RUNSTATS utility in the background to collect and maintainthe statistics you require.
To configure your database for automatic statistics collection, set each of thefollowing parameters to ON:v AUTO_MAINTv AUTO_TBL_MAINTv AUTO_RUNSTATS
Volatile Tables
In some cases, the content of the WORKFLOW_CONTEXT, TRANS_DATA, andother tables can fluctuate significantly during the day. The resulting statistics,which represent a table at a single point in time, can be misleading. In suchsituations, mark the table as volatile with the following command:
alter table <table name> volatile cardinality
For information about regular tuning and best practices for DB2, refer to thecorresponding IBM documentation.
Update Table Statistics Manually
In rare cases you may need to update statistics for a table manually. Run thefollowing command for the table in the Sterling B2B Integrator schema:
db2 runstats on table <table name> on key columns with distribution on keycolumns and sampled detailed indexes all allow read access
Microsoft SQL Server Configuration and MonitoringThis section provides information about configuring and monitoring Microsoft®
SQL Server® 2005, Microsoft® SQL Server® 2008, and Microsoft® SQL Server® 2012.
It describes the recommended instance-specific settings, database-specific settings,maintenance plan, and system monitoring. It also provides information aboutAddress Windowing Extensions (AWE), storage subsystem, dynamic managementviews, and index and table statistics.
Mandatory settings for Microsoft SQL ServerThe default collation of Microsoft SQL Server must match the collation for theSterling B2B Integrator database to prevent collation conversions.
Performance Management 51

The tempdb database that is used by Microsoft SQL Server must be created with thesame collation as the default collation of Microsoft SQL Server. The Microsoft SQLServer uses the tempdb database for results that are too large to fit in memory.
If the collations of the tempdb database and the Sterling B2B Integrator databasediffer, the database engine must convert from the Sterling B2B Integrator collationto the tempdb collation, and then back again before it sends the results to theSterling B2B Integrator server. These conversions might lead to severe performanceissues.
The collation that is required for the Sterling B2B Integrator database is a collationthat most closely matches the character set used by Java. By using this collation,you can avoid character data conversions before the data is stored in the databasetables. Use the mandatory parameter that is described in the following table whenyou configure the collation setting:
Parameter Value
Database Collation SQL_Latin1_General_CP850_Bin
Additionally, you must perform these tasks:v Allow Microsoft SQL Server to manage memory dynamically (default).v Disable any antivirus software that is running on the Microsoft SQL Server
data, transaction log, and binary files directory.
Recommended instance-specific settings for Microsoft SQLServerThe use of the Microsoft SQL Server database with Sterling B2B Integrator includessome recommended instance-specific settings for the database.
Parameter Value
Max server memory (MB) 500 MB to x MB depending on the amount of physicalmemory available on your database server. if the server isrunning only this SQL Server instance; x can be up-to 80%of the physical memory (RAM).
Min server memory (MB) 0
Recommended database-specific settings for Microsoft SQLServerThe use of the Microsoft SQL Server database with Sterling B2B Integrator includessome recommended database-specific settings.
Parameter Value Notes®
IsAutoCreateStatistics True This parametercan be set toFalse if youhave amaintenanceplan.
IsAutoUpdateStatistics True This parametercan be set toFalse if youhave amaintenanceplan.
52 Sterling B2B Integrator: Performance Management

Parameter Value Notes®
Page_verify_option Checksum (Microsoft SQL Serverdefault)
READ_COMMITTED_SNAPSHOT
On
Microsoft SQL Server Memory with Address WindowingExtensions (AWE)You can use the Microsoft SQL Server memory (with AWE) when runningMicrosoft SQL Server (32 bit) on Windows Server (32 bit).
This is helpful when your server has more than 4 GB of RAM and you wantMicrosoft SQL Server to be able to use that. For using Microsoft SQL Server withAWE, use the recommended values for Min and Max server memory for instancelevel settings.
For more information on Enabling AWE Memory for Microsoft SQL ServerMemory, refer to the Microsoft Developer Network Web site:v http://msdn.microsoft.com/en-us/library/ms190673(SQL.90).aspx (Microsoft
SQL Server 2005)v https://technet.microsoft.com/en-us/library/ms190673%28v=sql.105%29.aspx
(Microsoft SQL Server 2008)
This feature was removed in Microsoft SQL Server 2012. For more information, seehttps://support.microsoft.com/en-us/kb/2663912.
Row Versioning-Based Isolation Level(READ_COMMITTED_SNAPSHOT) for Microsoft SQL ServerThis feature is available in Microsoft SQL Server 2005 and later versions,
This feature can help in the following ways:v Resolve concurrency issues such as excessive blockingv Reduce deadlocks
The following T-SQL statement enables the READ_COMMITTED_SNAPSHOT fora database:
ALTER DATABASE <DB NAME> SET READ_COMMITTED_SNAPSHOT ON;
This snapshot option increases the number of I/Os as well as the size of tempdb. Itis important to have tempdb on fast disks as well as to have it sized according toyour workload.
For more information about Using and Understanding Snapshot Isolation and RowVersioning, refer to the Microsoft Developer Network Web site, which can beaccessed from: http://msdn.microsoft.com/en-us/library/tcbchxcb(VS.80).aspx.
Recommended Settings for Microsoft SQL Server 2008 and 2012Recommended settings for Microsoft SQL Server 2008 and Microsoft SQL Server2012 are provided.
These are shown in the following table:
Performance Management 53

Feature Description
Activity Monitor During troubleshooting, a database administrator (DBA) executesseveral scripts or verifies number of sources to collect generalinformation about the processes being executed and to find out thesource of the problem. Microsoft SQL Server consolidates thisinformation in detail graphically by running the recently executedprocesses.
For more information about Activity Monitor, refer to the MicrosoftDeveloper Network Web site:
v https://technet.microsoft.com/en-us/library/cc879320%28v=sql.105%29.aspx (Microsoft SQL Server 2008)
v https://msdn.microsoft.com/en-us/library/hh212951%28v=sql.110%29.aspx (Microsoft SQL Server 2012)
54 Sterling B2B Integrator: Performance Management

Feature Description
Data Compression The following list describes the two type of data compressionsupported by Microsoft SQL Server:
v Row compression
Row compression compresses the individual columns of a table.Row compression results in lower overhead on the applicationand utilizes more space.
v Page compression
Page compression compresses the data pages using row, prefix,and dictionary compression. Page compression affectsapplication throughput and processor utilization, but requiresless space. Page compression is a superset of row compression,which implies that an object or a partition of an object that iscompressed using page compression is compressed at the rowlevel too.
The amount of compression achieved is dependent on the datatypes and the data contained in the database.
Compression, row or page, can be applied to a table or an index inan online mode without interrupting the availability of SterlingB2B Integrator. The hybrid approach, where only the largest tablesthat are few in number, are compressed, results in bestperformance in saving significant disk space and resulting inminimal negative impact on performance. Disk space requirementsshould be considered before implementing compression.Compressing the smallest objects first minimizes the additionaldisk space requirements.
Run the following SQL query to determine how compressing anobject may affect its size:
sp_estimate_data_compression_savings
The following Sterling B2B Integrator tables may be the most likelycandidates for compression:
v DATA_TABLE
v TRANS_DATA
v CORRELATION_SET
v WORKFLOW_CONTEXT
v ARCHIVE_INFO
For more information about implementing row and pagecompression, refer to the Microsoft Developer Network Web site:
v https://msdn.microsoft.com/en-us/library/cc280576%28v=sql.105%29.aspx (Row compression)
v https://msdn.microsoft.com/en-us/library/cc280464%28v=sql.105%29.aspx (Page compression)
v https://msdn.microsoft.com/en-us/library/cc280449%28v=sql.110%29.aspx (Data compression)
Performance Management 55

Feature Description
Hot Add CPU andHot Add Memory
Hot Add CPU enables you to add CPUs dynamically to the serverswithout shutting down the server or limiting client connections.
Hot Add Memory enables you to add physical memorydynamically without restarting the server.
For more information about dynamically adding CPU and physicalmemory, refer to the Microsoft Developer Network Web site, whichcan be accessed from:
v http://msdn.microsoft.com/en-us/library/bb964703.aspx (HotAdd CPU)
v http://msdn.microsoft.com/en-us/library/ms175490.aspx (HotAdd Memory)
Note: The above pages are for Microsoft SQL Server 2008.However, Hot Add CPU and Hot Add Memory are also supportedin Microsoft SQL Server 2012. For more information, see the HighAvailability section at https://msdn.microsoft.com/en-us/library/bb630282%28v=sql.110%29.aspx.
Extended Events The extended events infrastructure enables administrators toinvestigate and address complex problems such as excessive CPUusage, deadlocks, application timeouts, and so on. Extended eventscan be correlated with Windows events to obtain more informationof the problem.
For more information about extended events, refer to the MicrosoftDeveloper Network Web site:
v http://msdn.microsoft.com/en-us/library/bb630354.aspx(Microsoft SQL Server 2008)
v https://msdn.microsoft.com/en-us/library/bb630282%28v=sql.110%29.aspx (Microsoft SQL Server 2012)
Storage SubsystemPrior to production, you should plan the overall storage strategy.
You must have DDLs to create and place tempdb and the user database forSterling B2B Integrator. A typical subsystem configuration would be:v OS and SQL Server binaries on a RAID 1 disk setv SQL Server data files on one or more RAID 5 disk setsv SQL Server transaction logs on a RAID 10 disk set
Consider and ensure the following when planning a storage subsystem:v Place SQL Server binaries on a separate set of physical disks other than the
database data and log files.v Place the log files on physical disk arrays other than those with the data files.
This is important because logging is more write-intensive, and the disk arrayscontaining the SQL Server log files require sufficient disk I/O to ensure thatperformance is not impacted.
v Set a reasonable size for your database. Estimate how big your database will be.This should be done as part of presales exercise working with IBM ProfessionalServices.
v Set a reasonable size for the transaction log. The transaction log's size should be20–25 per cent of the database size.
56 Sterling B2B Integrator: Performance Management
v Leave the Autogrow feature on for the data files and the log files. This helpsthe SQL Server to automatically increase allocated resources when necessary.
v Set a reasonable size for the Autogrow increment. Setting the database toautomatically grow results in some performance degradation. Therefore youshould set a reasonable size for the Autogrow increment to prevent the databasefrom growing automatically often.
v Set the maximum size for the data files and log files in order to prevent thedisk drives from running out of space.
v If you have several physical disk arrays, try to create at least as many files asthere are physical disk arrays so that you have one file per disk array. Thisimproves performance because when a table is accessed sequentially, a separatethread is created for each file on each disk array in order to read the table's datain parallel.
v Place the heavily accessed tables in one file group and place the tables' indexesin a different file group on a different physical disk arrays. This improvesperformance, because separate threads will be created to access the tables andindexes. For more information about Sterling B2B Integrator tables, refer to the"Schema Objects" and "Sterling B2B Integrator Database Tables" sections in thetopic “Database management for Sterling B2B Integrator” on page 16.
I/O Sub-System Response Time
Sterling B2B Integrator is an On-Line Transaction Processing (OLTP) application.As an OLTP application, database response time to the I/O sub-system needs to bein the single digit range even during the peak periods. The database response timeto the I/O sub-system should be less than:v 5 ms for logs. 1ms or better is recommended.v 10 ms or better for data. 5ms is recommended.
Monitoring Microsoft SQL Server Using Microsoft SQL ServerManagement StudioMicrosoft SQL Server Management Studio is a tool kit for configuring, managing,and administering all components of Microsoft SQL Server.
Microsoft SQL Server Management Studio combines the features of EnterpriseManager, Query Analyzer, and Analysis Manager.
For more information about Microsoft SQL Server Management Studio, refer to theMicrosoft Developer Network Web site, which can be accessed from:http://msdn.microsoft.com/en-us/library/ms174173(SQL.90).aspx.
Monitoring Microsoft SQL Server Using SQL Server ProfilerSQL Server Profiler is a graphical tool used to monitor an instance of MicrosoftSQL Server.
This tool is a good troubleshooting tool, but should not be enabled for day-to-dayoperations because there is an inherent overhead in capturing this data daily. Thedata about each event can be captured to a file or a table for analysis at a laterdate.
The SQL Server Profiler can be used to:v Monitor the performance of an instance of the SQL Server Database Enginev Identify procedures and queries that are executing slowlyv Replay traces of one or more users
Performance Management 57
v Perform query analysisv Troubleshoot problemsv Audit and review activityv Correlate performance countersv Configure trace problems
For more information about Using the SQL Server Profiler, refer to the MicrosoftDeveloper Network Web site, which can be accessed from: https://technet.microsoft.com/en-us/library/ms181091%28v=sql.105%29.aspx.
Enable the following events in SQL Server Profiler to capture deadlock-relatedinformation:v Deadlock graphv Lock: Deadlockv Lock: Deadlock Chainv RPC:Completedv SP:StmtCompletedv SQL:BatchCompletedv SQL:BatchStarting
For more information about Analyzing Deadlocks with SQL Server Profiler, refer tothe Microsoft Developer Network Web site, which can be accessed from:http://msdn.microsoft.com/en-us/library/ms188246(SQL.90).aspx.
For more information about Troubleshooting Deadlocks in Microsoft SQL Server,refer to the Microsoft Developer Network Web site, which can be accessed from:http://blogs.msdn.com/sqlserverstorageengine/archive/2006/06/05/617960.aspx.
Microsoft SQL Dynamic Management ViewsThe Dynamic Management Views (DMVs) introduced in Microsoft SQL Server 2005provide DBA information about the current state of the SQL Server machine.
These values help an administrator diagnose problems and tune the server foroptimal performance. For more information about dynamic management viewsand functions, refer to the Microsoft Developer Network Web site, which can beaccessed from:
http://msdn.microsoft.com/en-us/library/ms188754(SQL.90).aspx
Microsoft SQL System MonitorThe performance monitor (Perfmon) or system monitor is a utility used to track arange of processes and provide a real-time graphical display of the results.
It can also be used to measure SQL Server performance. You can view SQL Serverobjects, performance counters, and the behavior of other objects, such asprocessors, memory, cache, threads, and processes. For more information aboutMonitoring Resource Usage (System Monitor), refer to the Microsoft TechNet Website, which can be accessed from: http://technet.microsoft.com/en-us/library/ms191246(SQL.90).aspx.
Microsoft SQL Server Maintenance PlanA maintenance plan is a set of measures (workflows) taken to ensure that adatabase is properly maintained and routine backups are scheduled and handled.
58 Sterling B2B Integrator: Performance Management

Microsoft SQL Server maintenance plans can be configured by a wizard inMicrosoft SQL Server Management Studio, which can help alleviate some of theburden involved in creating the plan. In Microsoft SQL Server Database Engine,maintenance plans create an Integration Services package, which is run by an SQLServer Agent job. The goal of a maintenance plan is to:v Back up the Sterling B2B Integrator database regularly using either the simple
model or the full recovery modelv Update the statistics on all Sterling B2B Integrator tables and associated indexesv Rebuild or reorganize indexes on Sterling B2B Integrator tablesv Run database consistency checks
For more information about MS SQL Maintenance Plans, see the MicrosoftDeveloper Network Web site: https://msdn.microsoft.com/en-us/library/ms187658%28v=sql.105%29.aspx
You can use either the simple recovery model or the full recovery model with thedatabase. If you are unsure about which model to use, use the full recovery model.
Consider the simple recovery model if you are agreeable to the following:v Point of failure recovery is not necessary. If the database is lost or damaged,
you are willing to lose all the updates between a failure and the previousbackup.
v You are willing to risk the loss of some data in the log.v You do not want to back up and restore the transaction log, preferring to rely
exclusively on full and differential backups.v You are willing to perform a differential database backup every day and a full
database backup over the weekends (during low activity period).
For more information about Backup Under the Simple Recovery Model, see theMicrosoft Developer Network Web site: https://msdn.microsoft.com/en-us/library/ms191164%28v=sql.105%29.aspx or https://msdn.microsoft.com/en-us/library/ms186289%28v=sql.105%29.aspx
Consider the full recovery model if you are agreeable to the following:v You want to recover all the data.v You want to recover to the point of failure.v You want to be able to restore individual pages.v You are willing to incur the cost of additional disk space for transaction log
backups.v Performance of transaction log backups every 30-45 minutes.
For more information about Backup Under the Full Recovery Model, refer to theMicrosoft Developer Network Web site, which can be accessed from:https://msdn.microsoft.com/en-us/library/ms186289%28v=sql.105%29.aspx.
For more information about Transaction Log Backups, refer to the MicrosoftDeveloper Network Web site, which can be accessed from: https://msdn.microsoft.com/en-us/library/f4a44a35-0f44-4a42-91d5-d73ac658a3b0%28v=sql.105%29 .
Note: The Microsoft Developer Network Web site links provided access pages forMicrosoft SQL Server 2008 R2. To view pages for other versions, such as MicrosoftSQL Server 2012, use the Other Versions feature on the viewed page.
Performance Management 59

Microsoft SQL Server Index, Table Statistics, and Index RebuildsYour maintenance plan should include updating of statistics and rebuilding orreorganizing indexes.
If you have a maintenance plan for updating statistics, set IsAutoCreateStatisticsand IsAutoUpdateStatistics, at the database level, to False. This helps control whenthe maintenance plan runs, which should be at low load periods. If you have notincluded this in your maintenance plan, then set IsAutoCreateStatistics andIsAutoUpdateStatistics, at the database level to True.
Following is an example of a T-SQL statement for updating the statistics on a table,including the statistics pertaining to all the indexes on the table:
UPDATE STATISTICS <TABLE NAME>
When the data in the tables have changed by approximately 20 per cent, indexrebuilds are recommended for the Sterling B2B Integrator database. This must bevalidated by looking at system performance as a whole. Online index rebuilds,which cause minimal impact to the system, are possible. To find out more aboutdocument life-spans, and when the data in the tables change by approximately 20per cent, speak to the Sterling B2B Integrator system administrator.
You can rebuild indexes either online or offline. Online indexes can be rebuilt, withthe following exceptions:v Clustered indexes if the underlying table contains LOB data typesv Nonclustered indexes that are defined with LOB data type columns.
Nonclustered indexes can be rebuilt online if the table contains LOB data types,but none of these columns are used in the index definition as either key ornonkey columns.
For ease of maintenance, it is easier to either build all the indexes offline becauseoffline rebuilding does not have the restrictions listed previously, or reorganize theindex.
Following is an example of a T-SQL statement for rebuilding indexes offline:
ALTER INDEX ALL ON <TABLE NAME> REBUILD
Following is an example of a T-SQL statement for reorganizing indexes offline:
ALTER INDEX ALL ON <TABLE NAME> REORGANIZE
For more information about Reorganizing and Rebuilding Indexes, refer to theMicrosoft Developer Network Web site, which can be accessed from:http://msdn.microsoft.com/en-us/library/ms189858(SQL.90).aspx.
For more information about Alter index (Transact-SQL), refer to the MicrosoftDeveloper Network Web site, which can be accessed from: http://msdn.microsoft.com/en-us/library/ms188388(SQL.90).aspx.
Windows DefragmentationYou must run Windows defragmentation on disks with SQL Server data files andtransaction logs once a month.
60 Sterling B2B Integrator: Performance Management

This helps reduce the fragmentation in the SQL Server files at the file system level.You can create a schedule for this using Windows Task Scheduler.
For more information about the Disk Defragmenter Tools and Settings, refer to theMicrosoft TechNet Web site, which can be accessed from: http://technet.microsoft.com/en-us/library/cc784391(WS.10).aspx.
Microsoft SQL Server TipsAdditional tips are provided pertaining to Microsoft SQL Server in the context ofSterling B2B Integrator.v When using Sterling B2B Integrator with Microsoft SQL Server, Windows
Integrated authentication is not supported.v Ensure that network components such as routers, firewalls, and so on, do not
drop the idle connections between Sterling B2B Integrator and Microsoft SQLServer where they are on separate physical servers. Sterling B2B Integrator usesJDBC connection pool, and idle connections are typical.
v It is recommended that you run Microsoft SQL Server and Sterling B2BIntegrator on separate physical servers because this helps improve performance,ease of maintenance, and recoverability.
v It is important to understand the difference between simple blocking anddeadlocks:– Blocking is an unavoidable characteristic of Microsoft SQL Server because it
uses lock-based concurrency. Blocking occurs when one session holds a lockon a specific resource, and a second session attempts to acquire a conflictinglock type on the same resource. Typically, the time frame for which the firstsession locks the resource is small. When it releases the lock, the secondsession is free to acquire its own lock and continue processing. This is thenormal behavior of Microsoft SQL Server with Sterling B2B Integrator, and isgenerally not a cause for concern. It is a cause for concern only when sessionsare getting blocked for a long time.
– Deadlocks are much worse than simple blocking. A deadlock typically occurswhen a session locks the resources that another session has to modify, and thesecond session locks the resources that the first session intends to modify.Microsoft SQL Server has a built-in algorithm for resolving deadlocks. It willselect one of the deadlock participants and roll back its transaction. Thissession becomes the deadlock victim. Microsoft SQL Server has two traceflags that can be set to capture deadlock-related information. The flags areTrace Flag 1204 and Trace Flag 1222. These trace flags can be used as analternative to using SQL Server Profiler.For more information about trace flags, see https://msdn.microsoft.com/en-us/library/ms188396%28v=sql.105%29.aspxFor more information about Detecting and Ending Deadlocks in MicrosoftSQL Server 2005 and Microsoft SQL Server 2008, refer to the MicrosoftDeveloper Network Web site, which can be accessed from:http://msdn.microsoft.com/en-us/library/ms178104(SQL.90).aspx.In Microsoft SQL Server 2012, the System Health session detects deadlocks.See https://technet.microsoft.com/en-us/library/ff877955%28v=sql.110%29.aspx for more information.
Java Virtual MachineJava Virtual Machine (JVM) is a platform-independent programming language thatconverts Java bytecode into machine language and executes it.
Performance Management 61

When you compile a Java source, you get an intermediate Java file called the Javaclass. The class file is made up of bytecodes representing abstract instruction codes.These codes are not directly executable by any computer processor.
To run a Java program, you start a JVM and pass the class file to the JVM. TheJVM provides many services, including loading the class file and interpreting(executing) the byte codes. The JVM is the core technology that provides theruntime environment in which a Java application runs.
Each Java program or application runs in its own JVM. For example, if youconfigured an application server cluster with ten managed server instances that arecontrolled by one administrative instance, your configuration runs 11 JVMprocesses.
Since JVM is the underlying processing engine, it is critical that the JVMs areoptimally configured and are running efficiently. Incorrect JVM settings may leadto poor application performance or JVM outages.
Run the following command to find out the JVM version installed in your system:
$JAVA_HOME/bin/java -version
Note: If your environment handles large concurrent communications traffic, it isrecommended to increase the value of the gmm.maxAllocation property in theperimeter.properties file, along with increasing the maximum heap size of yourJVM. In such a scenario, set gmm.maxAllocation to a value greater than 384 MB. Formore information about the gmm.maxAllocation property, refer to the inlinecomments in the perimeter.properties file.
Garbage Collection StatisticsGarbage Collection (GC) statistics provide heap-related information such as:v What are the sizes of the different heaps?v How full is each section of heap?v How fast is the heap getting full?v What is the overall overhead of GC to clean the non-live objects?
Collecting and analyzing GC statistics help size the different sections of a heapcorrectly. It is recommended that you continuously collect garbage collectionstatistics for all the JVMs, even in production. The collection overhead is minorcompared to the benefit. With these statistics, you can tell if:v The JVM has or is about to run into a memory leakv Garbage collection is efficientv Your JVM heap settings are optimal
JVM Verbose Garbage CollectionJVM Verbose garbage collection (GC) statistics are critical and must always beenabled in production environments. These statistics can be used to understand thebehavior of the JVM heap management and the efficiency of the JVM.
IBM JVM Garbage Collection ExampleFollowing is an example of the GC output for JVM:
62 Sterling B2B Integrator: Performance Management

<af type="tenured" id="100" timestamp="Sun Nov 25 15:56:09 2007"intervalms="120245.593"><minimum requested_bytes="10016" /><time exclusiveaccessms="0.045" /><tenured freebytes="2704" totalbytes="1073741824" percent="0" ><soa freebytes="2704" totalbytes="1073741824" percent="0" /><loa freebytes="0" totalbytes="0" percent="0" />
</tenured><gc type="global" id="100" totalid="100" intervalms="120245.689"><refs_cleared soft="0" threshold="32" weak="0" phantom="0" /><finalization objectsqueued="0" /><timesms mark="35.301" sweep="5.074" compact="0.000" total="40.426" /><tenured freebytes="808526296" totalbytes="1073741824" percent="75" >
<soa freebytes="808526296" totalbytes="1073741824" percent="75" /><loa freebytes="0" totalbytes="0" percent="0" />
</tenured></gc><tenured freebytes="808516280" totalbytes="1073741824" percent="75" ><soa freebytes="808516280" totalbytes="1073741824" percent="75" /><loa freebytes="0" totalbytes="0" percent="0" />
</tenured><time totalms="40.569" />
</af>
In this example, <af type=”tenured” id=”100” indicates that this is the 100th timean attempt to allocate memory has failed, and as a result, a GC was initiated. Anallocation failure is not an error in the system or code. When enough free space isnot available in the heap, the JVM automatically initiates a garbage collection. Thelast time an allocation failure occurred was 120245.593 milliseconds ago (or 120.245seconds).
The lines starting with <gc type=”global” id=”100” provide information about thecollection process. In this example, garbage collection initiated the mark phase andthe sweep phase, which were completed in 35.301 and 5.074 millisecondsrespectively. The JVM determined that the heap was not fragmented, and thatcompacting the heap was not required. At the end of the GC, the heap had808,516,280 bytes of available memory.
It is important that the frequency of GCs be monitored. This can easily be achievedby looking at the time between the allocation failures. Typically, a healthy JVM willspend less than 0.5 seconds in each GC cycle. Also, the overall percentage of timespent on garbage collection should be less than 3 percent. To calculate the percentof time spent performing garbage collection, divide the sum of the garbagecollection time over a fixed interval by the fixed interval.
IBM provides documentation pertaining to its Garbage Collector and how tointerpret its GC statistics.
Refer to either the IBM JDK 6.0: Java Diagnostics Guide or the IBM DeveloperWorksarticle "Fine-tuning Java garbage collection performance", which is available at thefollowing Web site:
http://www.ibm.com/developerworks/ibm/library/i-gctroub/
Introduction to HotSpot JVM Performance and TuningThe Sun HotSpot JVM is used when you deploy Sterling B2B Integrator on a SunSolaris operating system running on Sun UltraSPARC processor-based servers andon a Windows operating system.
Performance Management 63

The HP HotSpot JVM is used when you deploy Sterling B2B Integrator on aHP-UX for IA64 (Itanium) or HP-UX on any other processor.
HotSpot JVMs provide many tuning parameters. There is no golden set of JVMsettings that apply to all customers and conditions. Fortunately, the HotSpot JVMsprovide good measurement feedback that allows you to measure the effectivenessof the settings. The settings, especially memory settings, are highly dependent on:v Transaction mixv Amount of data cachedv Complexity of the transactionsv Concurrency levels
This topic describes the processes involved in planning, implementing, configuring,monitoring, and tuning the HotSpot Java Virtual Machines.
To enable JVM verbose garbage collection, refer to the documentation on JVMparameters for the server in “Edit Performance Configuration Settings” on page123.
To enable JVM verbose garbage collection for the container JVM, refer to thedocumentation on JVM parameters for container nodes in “Edit PerformanceConfiguration Settings” on page 123.
For information on the default parameters for the HotSpot JVM, refer to “HotSpotJVM Default Parameters” on page 66.
HotSpot JVM Heap Memory and Garbage CollectionThe JVM run-time environment uses a large memory pool called the heap, forobject allocation. The JVM automatically invokes garbage collections (GC) to cleanup the heap of unreferenced or dead objects. In contrast, memory management inlegacy programming languages such as C++ is left to the programmer. If the JVMheap settings are not set correctly, the garbage collection overheads can make thesystem appear unresponsive. In the worst case, your transactions or the JVM mayabort due to outOfMemory exceptions.
Garbage collection techniques are constantly being improved. For example, the SunJVM supports a "stop-the-world" garbage collector where all the transactions haveto pause at a safe point for the entire duration of the garbage collection. The SunJVM also supports a parallel concurrent collector, where transactions can continueto run during most of the collection.
The Sun heap and HP heap are organized into generations to improve theefficiency of their garbage collection, and reduce the frequency and duration ofuser-perceivable garbage collection pauses. The premise behind generationalcollection is that memory is managed in generations or in pools with differentages. The following diagram illustrates the layout of the generational heap.
64 Sterling B2B Integrator: Performance Management

At initialization, a maximum address space is virtually reserved, but not allocated,to physical memory unless it is needed. The complete address space reserved forobject memory can be divided into young and tenured (old) generations.
New objects are allocated in the Eden. When the Eden fills up, the JVM issues ascavenge GC or minor collection to move the surviving objects into one of the twosurvivor or semi spaces. The JVM does this by first identifying and moving all thereferenced objects in the Eden to one of the survivor spaces. At the end of thescavenge GC, the Eden is empty (since all the referenced objects are now in thesurvivor space) and ready for object allocation.
The scavenge GC's efficiency depends on the amount of referenced objects it has tomove to the survivor space, and not on the size of the Eden. The higher theamount of referenced objects, the slower the scavenge GC. Studies have, however,shown that most Java objects live for a short time. Since most objects live for ashort time, one can typically create large Edens.
Referenced objects in the survivor space bounce between the two survivor spacesat each scavenge GC, until it either becomes unreferenced or the number ofbounces have reached the tenuring threshold. If the tenuring threshold is reached,that object is migrated up to the old heap.
When the old heap fills up, the JVM issues a Full GC or major collection. In a FullGC, the JVM has to first identify all the referenced objects. When that is done, theJVM sweeps the entire heap to reclaim all free memory (for example, because theobject is now dead). Finally, the JVM then moves referenced objects to defragmentthe old heap. The efficiency of the Full GC is dependent on the amount ofreferenced objects and the size of the heap.
The HotSpot JVM sets aside an area, called permanent generation, to store theJVM's reflective data such as class and method objects.
HotSpot JVM Garbage Collection ToolsIf you want to analyze the Garbage Collection (GC) logs, use some of the toolsdescribed in the following table:
Tool Name For Additional information, Refer To
GCViewer http://www.tagtraum.com/gcviewer.html
Performance Management 65

Tool Name For Additional information, Refer To
IBM Pattern Modelingand Analysis Tool forJava GarbageCollector
http://www-01.ibm.com/support/docview.wss?uid=swg27015310
visualgc http://java.sun.com/performance/jvmstat/visualgc.htmlNote: Visaulgc can be tied to running JVM processes at any time.It is helpful if you have not enabled the GC flags, but want to takea look at the heaps and GC overheads, and you do not want torestart your JVM.
HPjmeter https://h20392.www2.hp.com/portal/swdepot/displayProductInfo.do?productNumber=HPJMETER
HotSpot JVM Startup and Runtime Performance OptimizationIn some cases, an application's startup performance is more important than itsruntime performance. Applications that start once and run for a longer periodshould be optimized for runtime performance. By default, HotSpot JVMs areoptimized for startup performance.
The Java Just-In-Time (JIT) compiler impacts the startup and runtime performance.The time taken to compile a class method and start the server are influenced bythe initial optimization level used by the compiler. You can reduce the applicationstartup times by reducing the initial optimization level. This degrades yourruntime performance because the class methods will now compile at the loweroptimization level.
It is not easy to provide a specific runtime performance impact statement, becausecompilers may recompile the class methods based on the impression thatrecompiling provides better performance. Short-running applications will havetheir methods recompiled more often than long-running applications.
HotSpot JVM Default ParametersThe following tuning options are configured and shipped out-of-the-box in SterlingB2B Integrator on HotSpot JVMs in Windows, Solaris, and HP-UX.
The options, -d32 and –d64 are added to the Java launcher to specify if theprogram should be run in a 32-bit or a 64-bit environment. On Solaris, theycorrespond to the ILP32 and LP64 data models. Since Solaris contains both 32-bitand 64-bit J2SE implementation within the same Java installation, you can specifyeither version. If neither –d32 nor –d64 is specified, it will run in 32-bitenvironment by default. Java commands such as javac, javadoc, and so on mayrarely need to be run in a 64-bit environment. However, it may be required to passthe -d32 or –d64 options to these commands and then to the Java launcher using –Jprefix option, for example, -J-d64. For other platforms such as Windows and Linux,32-bit and 64-bit installation packages are separate. If you have installed both32-bit 64-bit packages on a system, you can select either one of them by adding theappropriate bin directory to the path.
Sterling B2B Integrator 5.2 supports 64-bit architecture on most operating systems.The –d64 option is the default value on Windows Server 2008, Solaris, and HP-UXfor both noapp JVM and container JVM. However, on Windows Server 2003, the–d32 option is default as it uses a 32-bit JDK.
66 Sterling B2B Integrator: Performance Management

Parameter / Description Default Value
-server
HotSpot-based JVMs generally uselow optimization levels, whichtakes less time to start up, but leadsto low runtime performance.Normally, a simple JIT compiler isused. To increase the runtimeperformance for applications suchas Sterling B2B Integrator, anoptimizing compiler isrecommended. Using this methodmay, however, lead a JVM to takelonger time to warm up.
For both noapp and container JVMs:
v Solaris = -server (optimizing compiler)
v HP-UX = -server (optimizing compiler)
-Xmx
If this parameter is tuned correctly,it can:
v Reduce the overhead associatedwith the garbage collection andthe risk of encountering anOut-Of-Memory (OOM)condition
v Improve the server response timeand throughput
If you see a large number ofgarbage collections, try increasingthe value. You can set a maximumheap limit of 4 GB for a 32-bit JVM.However, due to variousconstraints such as available swap,kernel address space usage,memory fragmentation, and VMoverhead, it is recommended to seta lower value. In 32-bit Windowssystems, the maximum heap sizecan be set in the range from 1.4 GBto 1.6 GB. Similarly, on 32-bitSolaris kernels, the address space islimited to 2 GB. The maximumheap size can be higher if your64-bit operating system is running32-bit JVM, reaching until 4 GB onSolaris systems. Java SE 6 does notsupport Windows /3GB boot.inifeature. If you require a large heapsetting, you should use a 64-bitJVM on an operating systemsupporting 64-bit applications.
Refer to “Edit Performance Configuration Settings”on page 123 for the default values for the:
v Maximum heap size for the server JVM(MAX_HEAP)
v Maximum heap size for the container JVM(MAX_HEAP_CONTAINER)
Performance Management 67
Parameter / Description Default Value
-XX:+DisableExplicitGC
Disables the explicit garbagecollection calls that are caused byinvoking System.gc() inside theapplication.
It is recommended that thedevelopers avoid the System.gc()calls to cause programmer-initiated,full-compaction garbage collectioncycles, because such calls caninterfere with the tuning ofresources and garbage collection forthe entire application system. Ifyour application pause timescaused by System.gc() are morethan your expected pause times, itis strongly recommended that youuse this option to disable theexplicit GC, so that the System.gc()calls will be ignored.
For both 32-bit/64-bit noapp and container JVMs:
v Windows = -XX:+DisableExplicitGC
v Solaris = -XX:+DisableExplicitGC
v HP-UX = -XX:+DisableExplicitGC
-XX:NewSize= and -Xmn<Size>=
–XX:NewSize controls theminimum young generation size ina heap, and the –Xmn sets the sizeof the young generation heap.
It is recommended to use thefollowing formula to compute -XX:NewSize and -Xmn valueswhen the minimum heap size andmaximum heap sizes are modified.
v -XX:NewSize = (0.33333* value of–Xms)
v -Xmn = (0.33333 * value of -Xmx)
Refer to “Edit Performance Configuration Settings”on page 123 for the default values for the:
v Initial new heap size for the server JVM(INIT_AGE)
v Initial new heap size for the container JVM(INIT_AGE_CONTAINER)
v Maximum new heap size for the server JVM(MAX_AGE)
v Maximum new heap size for the container JVM(MAX_AGE_CONTAINER)
-XX:MaxPermSize
Stores all the class code andclass-like data. The value of theparameter should be large enoughto fit all the classes that areconcurrently loaded. Sometimes, itis difficult to determine the actualvalue of this parameter becausegenerally, this region is smaller andexpands slowly, and the utilizationis commonly observed at 99-100percent of its current capacity. Ifyou have not configured this regioncorrectly, the JVM might fail withthe Java.lang.OutOfMemoryError:PermGen space error.
Refer to “Edit Performance Configuration Settings”on page 123 for the default values for the:
v Maximum permanent generation heap size for theserver JVM (MAX_PERM_SIZE)
v Maximum permanent generation heap size for thecontainer JVM (MAX_PERM_SIZE_CONTAINER)
68 Sterling B2B Integrator: Performance Management

Parameter / Description Default Value
-Xss
Determines the stack size for eachthread in the JVM.
Every thread in a JVM gets a stack,and this value determines thenumber of threads you can start ina JVM. If this value is too large,you might run into an OOM. Eachtime a method is invoked, a stackframe is created and pushed intothe thread stack. At a minimum, astack frame contains a method'slocal variables and arguments. If athread's actual stack size reachesbeyond this limit, you will get ajava.lang.StackOverflowErrorexception.
Refer to “Edit Performance Configuration Settings”on page 123 for the default values for the:
v Maximum Java stack size for any thread for theserver JVM (STATIC_STACK)
v Maximum Java stack size for any thread for thecontainer JVM (STATIC_STACK_CONTAINER)
-XX:CompileThreshold
Determines the number of methodinvocations and branches beforecompiling.
Setting a low value for thisparameter will trigger thecompilations of hot methodssooner.
For both 32-bit/64-bit noapp and container JVMs:
v Windows = -XX:CompileThreshold=1000
v Solaris = -XX:CompileThreshold=1000
-Xnocatch
Disables the Java catch-all signalhandler. This option is used to getclean, native code stack traces.
For both noapp and container JVMs:
HP-UX = -Xnocatch
Display HotSpot Statistics for HP JVMTo display HotSpot Statistics for the HP JVM, enable one of the following options:v -XX:+PrintGCDetails -XX:+PrintGCTimeStamps –Xloggc:<gcfilename>
-verbose:<gc>
This displays the following:11.010: [GC [PSYoungGen: 196608K->20360K(229376K)] 196608K->20360K(753664K), 0.0514144 secs] 13.987: [GC [PSYoungGen:216968K->32746K(229376K)] 216968K->48812K(753664K), 0.1052434 secs]
v -Xverbosegc [:help] | [0 | 1] [:file = [stdout | stderr | <filename>]]
This displays the following:<GC: 1 4 11.988605 1 64 7 201326592 64 201326592 0 20850824 33554432 0 0536870912 15563792 15563792 21757952 0.040957 0.040957 > <GC: 1 413.400027 2 864 7 201326592 864 201326592 20850824 33539216 33554432 016479936 536870912 17504224 17504224 21757952 0.088071 0.088071 >
Display HotSpot Statistics for Sun JVMTo display HotSpot Statistics for the Sun JVM, enable the following option:
-XX:+PrintGCDetails -XX:+PrintGCTimeStamp –Xloggc:<gcfilename>
Performance Management 69

This displays the following:
0.000: [GC 0.001: [DefNew: 32192K->511K(33152K), 0.0383176 secs]32192K->511K(101440K), 0.0385223 secs] 1.109: [GC 1.110: [DefNew:32703K->198K(33152K), 0.0344874 secs] 32703K->697K(101440K), 0.0346844secs]
Refer to the corresponding Sun documentation, which can be accessed from thefollowing Web site:
http://java.sun.com/javase/technologies/hotspot/gc/gc_tuning_6.html
HotSpot JVM Heap MonitoringYou may want to monitor the following items in a healthy heap:v During steady state, you should mostly see minor Garbage Collections (GC)
and an occasional full GC caused by allocation failures.v The sum of the GC times should not exceed 3 percent of the measurement
interval. For example, in a 1-hour measurement interval, the time taken for allthe GCs should not be more than 108 seconds.
v The JVM will choose to perform a full GC when it realizes that the live objectsin the Eden and Survivor spaces cannot fit in the old generation. The JVM thentries to free up the space in the old generation by performing a full GC. The fullGC pauses the application. The amount of pause time depends on the GCalgorithm you are using (Sterling B2B Integrator uses the default JVM GCalgorithm, that is, Parallel GC algorithm on 1.6 JDK on server class machines),and the size of the heap. The JVM will choose to perform a full GC when itrealizes that the live objects in the Eden and Survivor spaces will not fit into theold generation. In an attempt to free up the space in the old generation, the JVMwill perform a full GC, which pauses the application. The amount of pause timedepends on:– Type of GC algorithm currently in use. Sterling B2B Integrator uses the
default JVM GC algorithm, that is, Parallel GC algorithm, on 1.6 JDK onserver class machines.
– Size of the heap. Too many full GCs have a negative effect on performance.
If you observe many full GCs, try to determine if your old generation is sizedtoo small to hold all the live objects collected from the Survivor and Edenspaces. Alternatively, there may be too many live objects that do not fit into theconfigured heap size. If it is the latter, increase the overall heap size.
v If you are monitoring the heap and notice an increase in the number of liveobjects, and see that the GC is not able to clear these objects from the heap, youmight run into an Out-Of-Memory (OOM) condition, and there may be apossible memory leak. In such a situation, take a heap dump at various intervalsand analyze the dump for the leak suspect.
HotSpot JVM Thread MonitoringMonitoring JVM threads will help you locate thread deadlocks if there are blockedthreads in a Java code or in SQL. It also helps you to understand which part of thecode the threads are blocked in a hung application or running application.
Following is an example of a thread dump:"Thread-817" daemon prio=10 tid=0x00b9c800 nid=0x667 in Object.wait() [0xa4d8f000..0xa4d8faf0]at java.lang.Object.wait(Native Method)- waiting on <0xf678a600> (a EDU.oswego.cs.dl.util.concurrent.LinkedNode)at EDU.oswego.cs.dl.util.concurrent.SynchronousChannel.poll(SynchronousChannel.java:353)- locked <0xf678a600> (a EDU.oswego.cs.dl.util.concurrent.LinkedNode)at EDU.oswego.cs.dl.util.concurrent.PooledExecutor.getTask(PooledExecutor.java:707)
70 Sterling B2B Integrator: Performance Management

at EDU.oswego.cs.dl.util.concurrent.PooledExecutor$Worker.run(PooledExecutor.java:731)at java.lang.Thread.run(Thread.java:595)
"Low Memory Detector" daemon prio=10 tid=0x001e64e8 nid=0x19 runnable [0x00000000..0x00000000]
"CompilerThread1" daemon prio=10 tid=0x001e5388 nid=0x18 waiting on condition [0x00000000..0xb72fed2c]
"CompilerThread0" daemon prio=10 tid=0x001e4510 nid=0x17 waiting on condition [0x00000000..0xb73febac]
"AdapterThread" daemon prio=10 tid=0x001e3698 nid=0x16 waiting on condition [0x00000000..0x00000000]
"Signal Dispatcher" daemon prio=10 tid=0x001e2928 nid=0x15 waiting on condition [0x00000000..0x00000000]
"Finalizer" daemon prio=10 tid=0x001d6078 nid=0x14 in Object.wait() [0xfdf6f000..0xfdf6fa70]at java.lang.Object.wait(Native Method)at java.lang.ref.ReferenceQueue.remove(ReferenceQueue.java:116)- locked <0xc9e89940> (a java.lang.ref.ReferenceQueue$Lock)at java.lang.ref.ReferenceQueue.remove(ReferenceQueue.java:132)at java.lang.ref.Finalizer$FinalizerThread.run(Finalizer.java:159)
"Reference Handler" daemon prio=10 tid=0x001d5b20 nid=0x13 in Object.wait() [0xfe04f000..0xfe04f8f0]at java.lang.Object.wait(Native Method)at java.lang.Object.wait(Object.java:474)at java.lang.ref.Reference$ReferenceHandler.run(Reference.java:116)- locked <0xc9e90860> (a java.lang.ref.Reference$Lock)
"VM Thread" prio=10 tid=0x001d3a40 nid=0x12 runnable
"GC task thread#0 (ParallelGC)" prio=10 tid=0x000d8608 nid=0x2 runnable
The output consists of a header and a stack trace for each thread. Each thread isseparated by an empty line. The Java threads (threads that are capable of executingJava language code) are printed first. These are followed by information on VMinternal threads.
The header line contains the following information about the thread:v Thread Name indicates if the thread is a daemon threadv Thread Priority (Prio)v Thread ID (TID) is the address of a thread structure in memoryv ID of the native thread (NID)v Thread State indicates what the thread was doing at the time of the thread
dumpv Address range gives an estimate of the valid stack region for the thread
The following table lists the possible thread states that can be printed:
Thread State Definition
NEW The thread has not yet started.
RUNNABLE The thread is executing in the JVM.
BLOCKED The thread is blocked, waiting for a monitor lock.
WAITING The thread is waiting indefinitely for another thread to performa particular action.
TIMED_WAITING The thread is waiting for another thread to perform an actionfor up to a specified waiting time.
TERMINATED The thread has exited.
Note: The thread header is followed by the thread stack.
Performing a Thread DumpAbout this task
To perform a thread dump in UNIX (Solaris and HP-UX):
Performance Management 71

Procedure1. From the Administration menu, select Operations > System > Performance >
JVM Monitor.2. In the JVM MONITOR page, under Thread Dump, next to Take Thread Dump,
click Go!. The Thread Dump pop-up window is displayed.3. To see the latest Dumps in the View Dumps list, click Go! in the Thread Dump
pop-up window.4. Close the Thread Dump pop-up window.5. Under View Dumps, select the Name of the thread dump file and click Go! to
view it. The Download Dumps pop-up window is displayed.6. Click the Dumps download link.7. Open or save the file.8. Close the Download Dumps pop-up window.
What to do next
For Windows, if you have started Sterling B2B Integrator as a Windows service,use the stacktrace tool to take a thread dump. Follow the same procedure toperform a thread dump for container JVMs.
For more information, refer to the following Web site: http://www.adaptj.com/main/stacktrace.
You can use VisualVM in remote mode to take a thread dump on Windows whenyou start Sterling B2B Integrator noapp or container in service mode.
Refer to the corresponding VisualVM documentation for information about remotemonitoring of JVM, which is available in the following Web site:
https://visualvm.dev.java.net/
HotSpot Thread Dump Analysis ToolsFollowing is a list of tools that can be used to analyze thread dumps:v Thread Dump Analyzer (TDA): (Refer to https://tda.dev.java.net/)
Note: In order to use TDA, you must strip off any starting “< “ symbols in thethread dump if you are using Sterling B2B Integrator UI to take thread dumps.
v You can also use VisualVM for live monitoring of threads in JVM. (Refer tohttps://visualvm.dev.java.net/)
HotSpot JVM DeadLock DetectionIn addition to the thread stacks, the Ctrl+Break handler executes a deadlockdetection algorithm. If any deadlocks are detected, it prints additional informationafter the thread dump on each deadlocked thread.Found one Java-level deadlock:============================="Thread2":
waiting to lock monitor 0x000af330 (object 0xf819a938, a java.lang.String),which is held by "Thread1"
"Thread1":waiting to lock monitor 0x000af398 (object 0xf819a970, a java.lang.String),which is held by "Thread2"
Java stack information for the threads listed above:==================================================="Thread2":
72 Sterling B2B Integrator: Performance Management
at Deadlock$DeadlockMakerThread.run(Deadlock.java:32)- waiting to lock <0xf819a938> (a java.lang.String)- locked <0xf819a970> (a java.lang.String)
"Thread1":at Deadlock$DeadlockMakerThread.run(Deadlock.java:32)- waiting to lock <0xf819a970> (a java.lang.String)- locked <0xf819a938> (a java.lang.String)
Found 1 deadlock.
If the Java VM flag -XX:+PrintConcurrentLocks is set, Ctrl+Break will also printthe list of concurrent locks owned by each thread.
HotSpot JVM Blocked Thread DetectionLook for threads that are blocked. Threads might be waiting on SQL or might beserialized on a synchronized block. If you see threads that are blocked they arewaiting on another thread to complete, it means that you are serializing on somepart of code.
HotSpot JVM Troubleshooting TipsJava.lang.OutOfMemory errors occur when either the Java heap or the native heaprun out of space. These exceptions may indicate that the number of live objects inthe JVM require more memory than what is available (which can be adjusted bytuning the heap), or that there is a memory leak (which may indicate a problemwith an application component, the JVM, or the OS). There are many variants ofthis error, with each variant having its own cause and resolution.
Generally, java.lang.OutOfMemory (OOM) indicates that insufficient space hasbeen allocated for a requested object in the heap, or in a particular area of theheap, even after a garbage collection is attempted. An OutOfMemory exceptiondoes not always indicate a memory leak. It could indicate that the heap parametersare not configured properly for an application or that the bug is complex, with youhaving to troubleshoot different layers of native code.
When an OOM error is from the native code, it is difficult to tell whether it is fromJava heap exhaustion or native heap exhaustion because of low space. The firststep in diagnosing an OOM is identifying whether the Java heap is full or thenative heap is full.
Exception in thread “main” java.lang.OutOfMemoryError
This error condition might be due to a simple configuration issue. It might be thatthe –Xms value configured for this type of application is throwing the error. Thiserror generally occurs when object allocation fails even after a Garbage Collection(GC).
This error condition may be because of a memory leak, in which case, the objectreferences are held by the application even if they are no longer needed. Over aperiod of time, this unintentional object growth increases and causes this OOM.
This type of OOM error can also be seen in applications in which excessivefinalizer calls are made. In such applications, where the finalizer call is made, theGCs cannot reclaim the object space. Instead, they are queued for finalization tooccur, which might happen some time later. In a Sun implementation, the finalizercall is made by a separate daemon thread. If there are excessive finalize calls, thefinalization thread cannot keep up with the load, and eventually, the heap mightbecome full and an OOM might occur. For example, applications that createhigh-priority threads that cause the finalization to increase at a rate that is faster
Performance Management 73

than the rate the finalization thread can process, may generate this error.
Exception in thread “main” java.lang.OutOfMemoryError: PermGenspace
This error is seen when permanent generation is full. Permanent generation is thearea in which the class and method objects are stored. For an application that loadsa large number of classes, the value of –XX:MaxPermSize should be sizedaccordingly. Permanent generation also gets used when the java.lang.String intern()method is invoked on an object of class java.lang.String. Exhaustion of thepermanent generation area may occur if an application interns a large number ofstrings.
Generally, java.lang.String maintains the string pool, and when an interned methodis called on a string, it first verifies that an equal string is already present in thepool. If an equal string exists, java.lang.String returns the canonical representationof the string, which points to the same class instance; otherwise, java.lang.Stringadds the string to the pool.
Exception in thread “main” java.lang.OutOfMemoryError: Requestedarray size exceeds VM limit
This error occurs when the application requests the JVM to allocate an array that islarger than the heap size. For example, if the application requests an allocation of512 MB array and your heap size is only 256 MB, this error will be seen. This errormay occur because of a low –Xms value, or a bug in the application in which it istrying to create a huge array.
Exception in thread “main” java.lang.OutOfMemoryError: request<size> bytes for <reason>. Out of swap space?
Although the error is an OOM condition, the underlying cause is that the JVMfailed to allocate the requested size from the native heap, and the native heap isclose to exhaustion.
The <size> in the error message is the size that failed to allocate. The <reason> isthe name of the source module reporting failure. In a few cases, the actual reasonis printed.
In order to troubleshoot this error, use the OS utilities to find the actual cause. Onepossible cause is that the OS has been configured with insufficient swap space.Another possible cause is that other processes in the machine are consuming all thememory, or possibly a native leak, in which the application or the library code iscontinuously allocating memory, and the OS is not releasing it.
Exception in thread "main" java.lang.OutOfMemoryError: <reason><stack trace>(Native method):
If you see this OOM, it means that the native method encountered an allocationfailure. The main difference between this error and the Exception in thread“main” java.lang.OutOfMemoryError: request <size> bytes for <reason>. Outof swap space? error is that the allocation failure in this case occurred in theJNInative method rather than the JVM code. In order to troubleshoot this error, usethe OS utilities to find the actual cause.
74 Sterling B2B Integrator: Performance Management

A Crash, Instead of an OutOfMemoryError
In rare cases, you may have a JVM crash instead of OOM because of the allocationfrom the native heap failing because the native code that does not check for errorsreturns memory allocation functions. For example, this may occur if the nativecode malloc returns NULL (no memory available), and if the native code is notchecking for that error, and references the invalid memory location. If the diagnosisof this failure results in native code not checking for errors because of memoryallocation failures, the reasons for memory allocation failures should be examined.The failures may be due to reasons such as insufficient swap space, some otherprocesses consuming all the memory, or a native leak.
Hung Processes or Looping Processes
Generally, the most common reasons for a hang to occur are deadlocks inapplication code, API code, library code, or a bug in the HotSpot VM. However, ina few cases, the hang might be because of a JVM consuming all the available CPUcycles, most likely because of a bug, which in turn causes one or more threads togo into an infinite loop.
If a hang is seen, determine whether the JVM is idle or consuming all the CPUcycles. You can use the OS utilities to determine the CPU utilization. If youconclude that the hang process is using the entire CPU, the hang might be becauseof a looping thread. On the other hand, if the process is idle, it is most likelybecause of deadlock. On Solaris, for example, prstat -L -p <pid> can be used toreport the statistics for all the LWPs in the target process. This will identify thethreads that are consuming a lot of CPU cycles.
Diagnosing a Looping Process
If your observations on CPU utilization indicate that the process is looping, take athread dump, and from the thread dump and stack trace, you should be able togather information about where and why the thread is looping.
In the thread dump, look for the runnable threads. You will in all probability findthe threads that are looping. In order to be certain about the threads that arelooping, take multiple thread dumps to see if the thread remains busy.
Diagnosing a Hung Process
If you have determined that a process is hanging, and not looping, the cause islikely to be an application (thread) deadlock.
Take a thread dump and analyze it to find the deadlocked threads.
When you take a thread dump on a HotSpot JVM, the deadlock detectionalgorithm is also executed and the deadlock information in the thread dumpprinted.
Following is an example of some deadlock output from a document. For moreinformation, refer to the Java Troubleshooting and Diagnostic Guide.Found one Java-level deadlock:============================="AWT-EventQueue-0": waiting to lock monitor 0x000ffbf8 (object 0xf0c30560, ajava.awt.Component$AWTTreeLock),
which is held by "main""main":
Performance Management 75
waiting to lock monitor 0x000ffe38 (object 0xf0c41ec8, a java.util.Vector),which is held by "AWT-EventQueue-0"
Java stack information for the threads listed above:==================================================="AWT-EventQueue-0":at java.awt.Container.removeNotify(Container.java:2503)- waiting to lock <0xf0c30560> (a java.awt.Component$AWTTreeLock)at java.awt.Window$1DisposeAction.run(Window.java:604)at java.awt.Window.doDispose(Window.java:617)at java.awt.Dialog.doDispose(Dialog.java:625)at java.awt.Window.dispose(Window.java:574)at java.awt.Window.disposeImpl(Window.java:584)at java.awt.Window$1DisposeAction.run(Window.java:598)- locked <0xf0c41ec8> (a java.util.Vector)at java.awt.Window.doDispose(Window.java:617)at java.awt.Window.dispose(Window.java:574)atjavax.swing.SwingUtilities$SharedOwnerFrame.dispose(SwingUtilities.java:1743)atjavax.swing.SwingUtilities$SharedOwnerFrame.windowClosed(SwingUtilities.java:1722)at java.awt.Window.processWindowEvent(Window.java:1173)at javax.swing.JDialog.processWindowEvent(JDialog.java:407)at java.awt.Window.processEvent(Window.java:1128)102at java.awt.Component.dispatchEventImpl(Component.java:3922)at java.awt.Container.dispatchEventImpl(Container.java:2009)at java.awt.Window.dispatchEventImpl(Window.java:1746)at java.awt.Component.dispatchEvent(Component.java:3770)at java.awt.EventQueue.dispatchEvent(EventQueue.java:463)atjava.awt.EventDispatchThread.pumpOneEventForHierarchy(EventDispatchThread.java:214)atjava.awt.EventDispatchThread.pumpEventsForHierarchy(EventDispatchThread.java:163)at java.awt.EventDispatchThread.pumpEvents(EventDispatchThread.java:157)at java.awt.EventDispatchThread.pumpEvents(EventDispatchThread.java:149)at java.awt.EventDispatchThread.run(EventDispatchThread.java:110)"main":at java.awt.Window.getOwnedWindows(Window.java:844)- waiting to lock <0xf0c41ec8> (a java.util.Vector)atjavax.swing.SwingUtilities$SharedOwnerFrame.installListeners(SwingUtilities.java:1697)atjavax.swing.SwingUtilities$SharedOwnerFrame.addNotify(SwingUtilities.java:1690)at java.awt.Dialog.addNotify(Dialog.java:370)- locked <0xf0c30560> (a java.awt.Component$AWTTreeLock)at java.awt.Dialog.conditionalShow(Dialog.java:441)- locked <0xf0c30560> (a java.awt.Component$AWTTreeLock)at java.awt.Dialog.show(Dialog.java:499)at java.awt.Component.show(Component.java:1287)at java.awt.Component.setVisible(Component.java:1242)at test01.main(test01.java:10)Found 1 deadlock.
Note: In J2SE 6.0, the deadlock detection algorithm works only with the locks thatare obtained using the synchronized keyword. This means that deadlocks that arisethrough the use of the java.util.concurrency package are not detected.
In the deadlock output, you can see that the thread main is the locking object<0xf0c30560>, and is waiting to enter <0xf0c41ec8>, which is locked by the thread“AWT-EventQueue-0”. However, the thread “AWT-EventQueue-0” is also waitingto enter <0xf0c30560>, which is in turn locked by “main”.
76 Sterling B2B Integrator: Performance Management

Stack Overflow
This error generally occurs when the stack space is exhausted in a JVM. Generally,this occurs because of:v A deeply nested applicationv An infinite loop within an applicationv A problem in the Just-In-Time (JIT) compiled code
Not all instances of this error should be considered as programming errors. In thecontext of some applications, you may require a greater value for the stack size(-Xss), for example, applications having intensive graphics might require morestack size.
The stack overflow error can be either from the native code or because of aninfinite loop in the Java program.
To determine if the error is in the native code, review the stack trace. In mostcases, the information you get will be difficult to interpret. However, if the error isdue to an infinite loop, you can see the stack trace of the error. Verify whetherthere are any recursive method calls, and whether they are deep. If it does notappear to be an infinite loop, try increasing either the Java stack or the native stackto resolve the issue.
Taking Heap Dumps and Profiling JVM Using Hprof
A JVM's HPROF can be used get information about CPU usage and heap allocationstatistics, and to monitor contention profiles. You can also get complete heapdumps and the states of all the monitors and threads in the JVM.
In Sterling B2B Integrator, HPROF can be invoked by adding the following optionas a JVM parameter by using the Sterling B2B Integrator tuning wizard and addingthe below option to the JVM argument suffix option for both noapp and container.For more details, please refer to “Edit Performance Configuration Settings” onpage 123. Run the setupfiles.sh command (UNX/Linux) or the setupfiles.cmdcommand (Windows) and restart ASI and container JVMs.
-agentlib:hprof[=options]
Or
-Xrunhprof[:options]
For more information about how to use HPROF on Sun JVM, refer to the followingWeb site:
http://java.sun.com/developer/technicalArticles/Programming/HPROF.html
For more information about how to use HPROF HP JVM, refer to the followingWeb site:
http://bizsupport2.austin.hp.com/bc/docs/support/SupportManual/c02697864/c02697864.pdf
On HP JVM, you can also use –Xeprof to collect profiling data for performancetuning. For information about –Xeprof, refer to the following Web site:
Performance Management 77

http://bizsupport2.austin.hp.com/bc/docs/support/SupportManual/c02697864/c02697864.pdf
In order to analyze the data using -agentlib:hprof and –Xeprof, you can useHPJmeter. For more information about this tool, refer to the following Web site:
http://www.hp.com/go/hpjmeter
Introduction to the IBM® JVM Performance and TuningGuidelines
The IBM® Java™ Virtual Machine (JVM) contains a number of private andproprietary technologies that distinguish it from other implementations of JVM.For instance, the IBM JVM uses mixed-mode interpretation (MMI). When the MMIdetects that bytecodes have been interpreted multiple times, it invokes ajust-in-time (JIT) compiler to compile those bytecodes to native instructions. Due tothe significant performance benefits, the JIT and MMI are enabled by default. TheJVM performance degrades considerably when JIT is disabled. For moreinformation about the JIT compiler and MMI, refer to the IBM JDK 6.0: JavaDiagnostics Guide.
Refer to the Sterling B2B Integrator System Requirements documentation for thesupported operating system and JVM combination.
This topic describes the processes involved in tuning, monitoring, and performingbasic troubleshooting when deploying the Sterling B2B Integrator using the IBMJVM.
For information about using the tuning wizard to set the IBM JVM parameters, see“Edit Performance Configuration Settings” on page 123.
Before You Begin Tuning Your IBM® JVMUsing the Performance Tuning Utility, Sterling B2B Integrator calculates therecommended settings based on the number of cores and the amount of physicalmemory that is being made available to Sterling B2B Integrator.
The resulting performance properties are stored in the tuning.properties file in theinstall_dir/properties directory. The formulae used to calculate these setting can befound in the tuningFormulas.properties file in the install_dir/properties directory.
The calculated values should be used as a guideline. Further tuning may benecessary to attain a well-tuned system. If you are still unable to attain awell-tuned system, you may want to engage IBM Professional Services. Contactyour Sales Representative for more information about this.
IBM® JVM Default Parameters for Sterling B2B IntegratorThe follow table provides the IBM® JVM parameters and the default values youshould use when configuring the system.
Note: For information about using the tuning wizard to set the IBM JVMparameters, see “Edit Performance Configuration Settings” on page 123.
78 Sterling B2B Integrator: Performance Management

Parameter Description
-Xmns v Controls the initial size of the new area to the specified valuewhen using -Xgcpolicy:gencon.
v Corresponds to the JVM short-lived memory (min) value
It is recommended to use the following formula to compute –Xmnsvalue when the minimum heap size is modified.
-Xmns = (0.33333 * value of -Xms)
-Xmnx v Controls the maximum size of the new area to the specifiedvalue when using -Xgcpolicy:gencon
v Corresponds to the JVM short-lived memory (max) value
It is recommended to use the following formula to compute –Xmnxvalue when the maximum heap size is modified.
-Xmnx = (0.33333 * value of -Xmx)
-Xjit:count v Controls the compilation threshold of the JIT compiler
v Value given to count causes the Java method to be compiledafter n runs
For 64-bit noapp JVM and 64-bit container JVM:
v Default Value for Linux: 1000
v Default Value For AIX: 1000
-Xgcpolicy:gencon Controls the behavior of the Garbage Collector. They maketrade-offs between the throughput of the application and theoverall system, and the pause times that are caused by garbagecollection. By specifying the gencon value, the GC policy requeststhe combined use of concurrent and generational GC to helpminimize the time that is spent in any garbage collection pause.
IBM® JVM Troubleshooting TipsThis topic describes the various issues that may arise when using the IBM® JVMand the troubleshooting tip pertaining to each of these errors.
OutOfMemoryError Exceptions and Memory Leaks
OutOfMemoryError exceptions occur when either the Java heap or the native heaprun out of space. These exceptions indicate that there is either a memory leak orthat the number of live objects in the JVM require more memory than is available.
The first step to troubleshooting an OutOfMemoryError exception is to determinewhether the error is caused because of lack of space in either the Java heap or thenative heap. When the OutOfMemoryError is caused because of lack of space inthe native heap, an error message is displayed with an explanation about theallocation failure. If an error is not present, the exception is likely to have occurredbecause of lack of space in the Java heap. In the latter scenario monitor the Javaheap by using the Verbose GC output.
The Java heap is consumed when the Garbage Collector is unable to compact orfree the objects being referenced. Objects that are no longer referenced by otherobjects, or are referenced from the thread stacks, can be freed by performing thegarbage collection task. As the number of referenced objects increases, garbagecollection will take place more frequently. With each garbage collection instance,
Performance Management 79

less memory will be freed. If this trend continues, the Garbage Collector will notbe able to free enough objects to allocate new objects. When this happens, the heapwill be near 100% utilized and the JVM will fail with an OutOfMemoryErrorexception.
Increasing the size of the Java heap may resolve an OutOfMemoryError exception.However, if the exception is due to a memory leak, increasing the heap size willnot resolve this issue. In this case, further troubleshooting, including analyzing thecontents of the heap using heap dump analysis or a tool such as JProbe® orOptimizeIt™ is necessary. Refer to the IBM 6.0: Java Diagnostics Guide for moreinformation about heap dump analysis.
The Application Hangs
The application hangs when either a deadlock occurs or a loop is encountered. Apotential deadlock scenario is one in which multiple threads in the JVM areblocked and are waiting on the same object resource. Another situation that mayresult in a deadlock is when there is a missed notification between threads becauseof a timing error. Similarly, a loop may be encountered if there is a missed flag,which in turn may terminate the loop. A loop can also be encountered if the wronglimit has been set for the loop iterator. In either of these cases, the thread will failto exit in a timely manner.
The recommended approach is to trigger a thread dump and interpret it. Thethread dump provides all the information pertaining to the object resources in theJVM. A thread dump can be triggered to take a snapshot of all the informationrelated to the JVM and a Java application at a particular point during execution.The information that is captured includes the OS level, hardware architecture,threads, stacks, locks, monitors, and memory.
By default, thread dumps are enabled. A thread dump is triggered when the JVMis terminated unexpectedly, an OutOfMemoryError is encountered, or when a usersends specific signals to the JVM. Sterling B2B Integrator also enables users totrigger a thread dump through the Sterling B2B Integrator UI.
Trigger Thread Dump
To trigger a thread dump for the ASI JVM:1. From the Administration menu, select Operations > System > Performance >
JVM monitor.2. In the JVM MONITOR page, under Thread Dump, next to Take Thread
Dump, click Go!.The Thread Dump Taken page is displayed. It may take some time to generatethe thread dump. During this time you may not be able to access other pages.If heap dumps are enabled, the delay will be longer before the process iscompleted.
3. Click Go! in the Thread Dump pop-up window to have the thread dumpspopulated on the JVM MONITOR page.
4. Close the Thread Dump Taken pop-up window.5. To view the dump, in the JVM MONITOR page, under View Dumps, select the
dump file, and click Go!.6. In the Dumps download pop-up window, click the Download link to
download the file to the local machine.
80 Sterling B2B Integrator: Performance Management

The thread dump can also be found on the host machine in theinstall_dir/noapp/bin directory. After the download is complete, close the Dumpsdownload pop-up window.
To trigger a thread dump for the container JVM:1. Change your working directory to install_dir.2. In the command line, enter ps -ef | grep <container_name>.
This lists the container Java process id.3. Enter kill -3 <pid>.
The thread dump is placed in the install_dir/noapp/bin directory for youranalysis.
Because thread dumps are created in a text format, they do not require anysoftware to make them human readable. A thread dump is broken into sections.Following is a brief description of each thread dump tag:
Thread Dump Tag Description
TITLE Basic information about the event that caused the thread dump,along with the timestamp and the generated name.
GPINFO Contains general information about the operating system. GeneralProtection Fault (GPF) information is included in this section if thefailure was caused by a GPF.
ENVINFO Contains the JRE level and details about the environment andcommand-line arguments that were used to launch the JVMprocess.
MEMINFO Contains information about the Memory Manager, and free space,current size of the heap and the garbage collection history data.
LOCKS Contains information about the locks and monitors being held byeach Java object.
THREADS Contains a complete list of threads that have not been stopped.
CLASSES Contains the class loader summaries, including the class loadersand their relationships.
For more information about interpreting thread dump, refer to the IBM JDK 6.0:Java Diagnostics Guide.
Heapdumps
Heapdumps are useful for troubleshooting memory-related issues since theycontain all the live objects used by the Java application. With this information, theobjects that are using large amounts of memory can be identified. The contents of aheapdump can also help a user understand why objects cannot be freed by theGarbage Collector.
By default, a heapdump is generated in a compressed binary format know asPortable Heap Dump (PHD). Several tools are available to help analyze the dump.IBM recommends the use of the Memory Dump Diagnostic for Java (MDD4J) whenperforming the heapdump analysis. This tool can be downloaded from IBMSupport Assistant (http://www-01.ibm.com/software/support/isa/).
Performance Management 81

Heapdumps are generated when the Java heap is exhausted by default. They canalso be configured so that they are generated when a user sends a specific signal tothe JVM.
To enable a heapdump, refer to the documentation on JVM parameters for theserver in “Edit Performance Configuration Settings” on page 123.
For more information about heapdumps, refer to the IBM JDK 6.0: Java DiagnosticsGuide.
Monitoring OperationsThe Operations functions enable you to monitor the operational status of SterlingB2B Integrator, its components and services, current threads and system logging,and to troubleshoot system problems.
Managing System LogsSterling B2B Integrator comprises multiple components, including softwareapplications such as archive tools, Web servers, and database servers. To monitorthe activities of each component, Sterling B2B Integrator generates log files basedon the system's monitoring activity. These log files are one of the tools that enableyou to monitor the way the system operates.
Each operations server on a host has its own operations log file. Log files arecreated in the logs directory of the installation directory. To prevent the system logfiles from taking up excessive storage space and main memory, Sterling B2BIntegrator generates a log file only when a component runs. This in turn improvesthe performance of Sterling B2B Integrator.
Each open log file is closed once every 24 hours (usually at midnight), and a newfile is created. When moving into or out of Daylight Savings Time (DST), you muststop and restart both Sterling B2B Integrator and its database to ensure that logfiles are created with the correct timestamp.
Log files are allowed to grow only up to a maximum size. If a log file reaches itsmaximum size, it is closed and another file is created. There is a limit to thenumber of log files that can exist simultaneously. If this limit is exceeded, the oldlogs files are automatically deleted. If the Sterling B2B Integrator Dashboardinterface links to a deleted log file (which will display a blank page), click the linkto a newer log file.
Note: If you are working in a clustered environment, the log information that isdisplayed is determined by the node you select from the Select Node list.
Naming Conventions
This section provides information about the naming conventions to be used inSterling B2B Integrator.
Use the following naming convention for a directory:v UNIX - install_dir/logs/directoryv Windows - install-dir\logs\directory
In this convention:v install_dir or install-dir refers to the name of the installation directory.
82 Sterling B2B Integrator: Performance Management
v logs refers to the primary log directory.v directory refers to the subdirectory created when you start Sterling B2B
Integrator.All the old log files are moved to this subdirectory for archiving. The namingconvention to be used for the old log directory is logs_mmddyy_hhmmss.
Use the following naming convention for a log file:
name.log.Dyyyymmdd.Thhmmss_#
In this convention:v name identifies the type of the log file.v log refers to the file name extension, which indicates the file type.v Dyyyymmdd refers to the date in the year, month, and day format. The D at the
beginning refers to Date.v Thhmmss refers to the time in hours, minutes, and seconds format. The T at the
beginning refers to Time.v _# is the increment of the log file. If you attempt to write a log file that already
exists, _# is appended to the log file name, allowing you to write a new file andsave the integrity of the existing file.For example, if mylog.D20041101.T092022 exists, and you try to save a new logfile with the same name, the new file becomes mylog.D20041101.T092022_2,where _2 indicates that it is the second log in a sequence using the same filename.
Note: The date and time components in a naming convention may or may not bepresent, depending on the type of the log. For example, the noapp.log does notinclude date and time information, but ui.log.Dyyyymmdd.Thhmmss includes dateand time information.
Each time Sterling B2B Integrator is started, the log files created since the last timeit was started are archived in a time-stamped subdirectory. New log files, thosecreated subsequent to the most recent execution of Sterling B2B Integrator, arewritten to the install_dir/logs directory.
Viewing Log File Contents
Users of Sterling B2B Integrator can view the contents of both current log files andold log files.
Note:
v If you are working in a clustered environment, the log information that isdisplayed is determined by the node you select from the Select Node list.
v The Sterling B2B Integrator interface displays only the last 2500 lines of a currentlog file. To view the entire log, you must have read permission for the filesystem on which Sterling B2B Integrator is installed. Open the log file inread-only mode using a text editor.
To view the current log file contents in Sterling B2B Integrator:1. From the Administration menu, select Operations > System > Logs.2. Click the appropriate log file.
To view the old log file contents in Sterling B2B Integrator:
Performance Management 83

1. In the install_dir/logs/log directory, locate the old log file that you want toview.
2. Open the log file in read-only mode using a text editor.
Analyzing Log File Contents
The contents of a log file provide information about system activities andproblems. The format used for entries written to a log file is [YYYY-MM-DDHH:MM:SS.ss] loglevel ‘message code' Scope.Subsystem.Name ‘informationstring'[2008-04-22 09:02:43.404] ERROR 000310160001 UTIL.FRAME_POOL.ERR_Pool [Pool] Could not create the initial objects for the pool gentranTPPool[2008-04-22 09:02:43.405] ERROR 000000000000 GLOBAL_SCOPE [1208869363405] The driver manager could not obtain a database connection.
In this convention:v YYYY-MM-DD refers to the date in year, month, day format.v HH:MM:SS.ss refers to the time in hour, minutes, seconds, and hundredths of a
second format.v loglevel indicates how much information is logged and the relative importance
of the message. A subsystem may log only a subset of these messages (asdefined in the subsystem.loglevel property of log.properties), discarding thosethat have a severity that is lower (less severe) than the current log level set forthat subsystem.
Log Level Description
FATAL Collects fatal and critical error information.
ERRORDTL Collects only error conditions, with a detailed description of theerror.
ERROR Collects only error conditions such as exceptions and errormessages (including errors from the user interface).
WARN Collects non-fatal configuration messages.
SQLDEBUG Collects SQL statements that are being executed.
INFO Collects basic operational information.
TIMER Collects timing information.
COMMTRACE Collects communication trace information.
DEBUG Collects basic debugging statements including system state andcode paths.
VERBOSE Collects extra debugging statements (like XML information) thatdescribe and explain what is happening in the system.
ALL Collects information about all the conditions.
v message code describes the activity or problem, using the following format:– The first four digits specify the scope (like Workflow, Ops, Util).– The next digit specifies the log severity level (default conventions use 1 for
error or exception, 2 for debug messages, 3 for warnings, and 4 forinformation or all messages.
– The next three digits specify the subsystem (like Workflow Queue orWorkflow Engine).
– The last four digits specify the error number.v Scope.Subsystem.Name is a text description of the affected part of Sterling B2B
Integrator (such as WORKFLOW, OPS, or UTIL), the Sterling B2B Integrator
84 Sterling B2B Integrator: Performance Management

subsystem (such as FRAME_POOL, NOAPP, or SERVER), and what occurred(such as ERR_Pool or INFO_NamingException1).
v information string is a brief description of the activity that occurred.
Following is an example of this format:[2006-05-30 11:06:55.661] ALL 000440020297SERVICES.SERVICES_CONTROLLER.INFO_sdi_getName startup: loading HTTP_SEND_ADAPTER
This indicates that at 11:06:55.661 a.m. on May 30, 2006, Sterling B2B Integratorwas started, and attempted to load the HTTP Send adapter(HTTP_SEND_ADAPTER). The message also provides information about:v Scope (Services)v The affected part of Sterling B2B Integrator (Services Controller)v What occurred (INFO_sdi_getName)v Error code (0297)
Changing Log Settings
Sterling B2B Integrator enables you to change the log settings globally and locally.
Changing Log Settings Globally
You can change log settings globally using the customer_overrides.properties file,which prevents customized property file changes from being overridden byupdates or patches. You can change global settings in the log.properties file. Formore information about the customer_overrides.properties file, refer to Sterling B2BIntegrator Property Files documentation.
Note: The customer override property file is not a part of the initial Sterling B2BIntegrator installation. It must be created and namedcustomer_overrides.properties.
To change the property file settings using the customer_overrides.properties file,perform the following tasks:1. In the install_dir/properties directory, either create or locate the
customer_overrides.properties file.2. Open the customer_overrides.properties file using a text editor.3. Specify the settings for the global log properties described in the following
table. These properties are displayed in the following format:logService.Property=Value
v logService identifies the log.properties file in thecustomer_overrides.properties file.
v Property is the global property of the log.properties file that you want to set.See the following table for a list of properties.
v Value is the property setting of the log.properties file.
Property Description
newloggers Specifies whether to allow new log files to be created when themaximum log file size setting has been exceeded. Valid values:
v true – Allow new logs to be created (Default)
v false – Do not allow new logs to be created
Example: logService.newloggers=true
Performance Management 85
Property Description
defaultlog Specifies the name of the default log. Default is systemlogger.
Example: logService.defaultlog=logtype
logtype.maxnumlogs Specifies the maximum number of logs to retain before deleting theold logs. Default is 10.
Examples:
logService.defaultlog.maxnumlogs=15 sets the maximum numberof a log type specified as the default log (systemlogger, by default)to 15.
logService.uilogger.maxnumlogs=20 sets the maximum number ofUI type logs to 20.
The following table provides the log type name for each log file name definedby default in the log.properties file and extension files. If you have changed thefile name, use the original file name to find the log type name.
File Name of Log
(As Shown on the System Logs Screen)
Log Type
(For the customer_overrides.properties file)
alerterlogger.log alerterlogger
archive.log archivelogger
Authentication.log AuthenticationLogger
cdinterop.log cdinteroplogger
cdinterop_cdjava.log cdinteropcdjavalogger
ceuinterop.log ceulogger
common3splogger.log common3splogger
delete.log deletelogger
ebXML.log ebXMLlogger
EDIINT.log EDIINTLogger
event.log event
ftp.log ftplogger
ftpclient.log psftpclientlogger
http.log httplogger
httpclient.log httpclientlogger
jetty.log jettylogger
lifecycle.log lifecycleLogger
mailbox.log mailboxlogger
mgmtdash.log neo
noapp.log noapplogger
ocsp.log ocsplogger
oftp.log oftplogger
ops_exe.log opslogger
Perimeter.log PSLogger
pipeline.log pipelinelogger
86 Sterling B2B Integrator: Performance Management
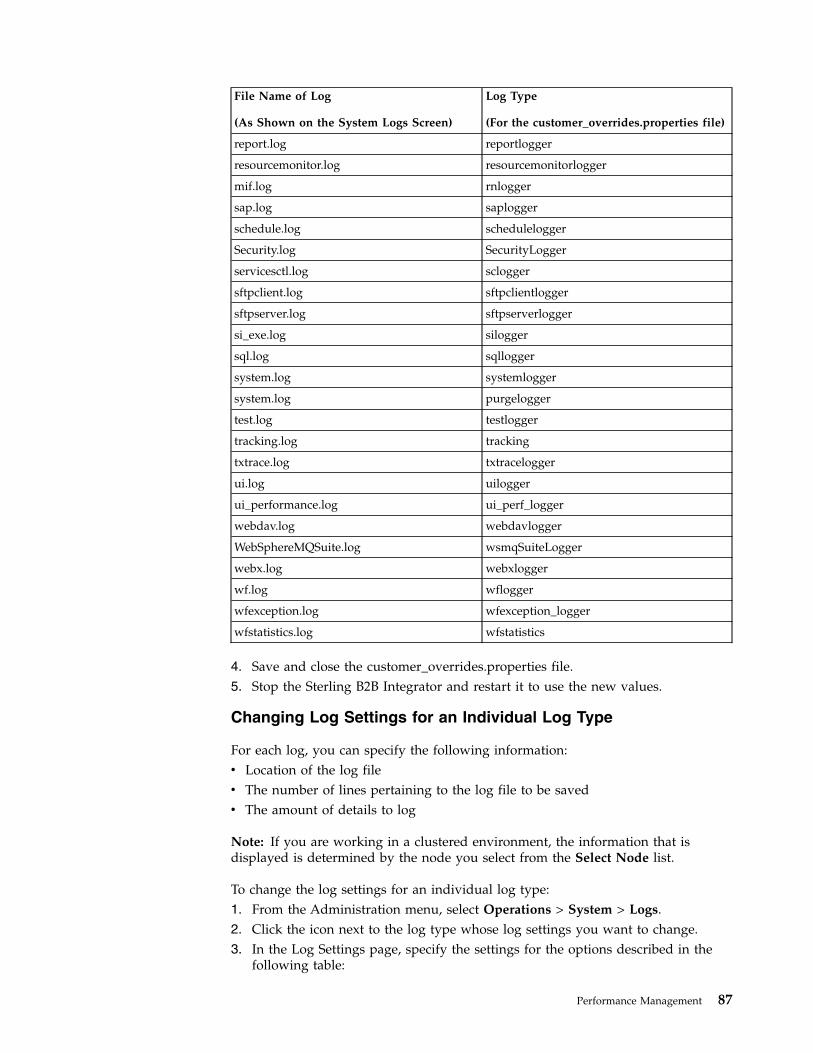
File Name of Log
(As Shown on the System Logs Screen)
Log Type
(For the customer_overrides.properties file)
report.log reportlogger
resourcemonitor.log resourcemonitorlogger
mif.log rnlogger
sap.log saplogger
schedule.log schedulelogger
Security.log SecurityLogger
servicesctl.log sclogger
sftpclient.log sftpclientlogger
sftpserver.log sftpserverlogger
si_exe.log silogger
sql.log sqllogger
system.log systemlogger
system.log purgelogger
test.log testlogger
tracking.log tracking
txtrace.log txtracelogger
ui.log uilogger
ui_performance.log ui_perf_logger
webdav.log webdavlogger
WebSphereMQSuite.log wsmqSuiteLogger
webx.log webxlogger
wf.log wflogger
wfexception.log wfexception_logger
wfstatistics.log wfstatistics
4. Save and close the customer_overrides.properties file.5. Stop the Sterling B2B Integrator and restart it to use the new values.
Changing Log Settings for an Individual Log Type
For each log, you can specify the following information:v Location of the log filev The number of lines pertaining to the log file to be savedv The amount of details to log
Note: If you are working in a clustered environment, the information that isdisplayed is determined by the node you select from the Select Node list.
To change the log settings for an individual log type:1. From the Administration menu, select Operations > System > Logs.2. Click the icon next to the log type whose log settings you want to change.3. In the Log Settings page, specify the settings for the options described in the
following table:
Performance Management 87

Option Description
Location Specifies the absolute path for the log file.
Rollover Interval If newloggers is set to false, the rollover interval specifies the pointat which the oldest lines in the log file are deleted as new lines arecreated. If newloggers is set to true (default), the rollover intervalis the maximum number of lines allowed in the log file before anew file is created. Select one of the following rollover intervalvalues:
v 50000 lines
v 100000 lines
v 150000 lines
v 200000 lines
Note: Here, the term “lines” refers to logical lines (entries) and notphysical lines. For example, following is a “line”:
[2005-07-11 08:12:07.679] ALL 000440020297SERVICES.SERVICES_CONTROLLER.INFO_sdi_getNamestartup: loading HTTP_SEND_ADAPTERFtpConfig.logConfiguration()client configuration: ftpListenPort=[10021]localDataPortCollection=[null]localControlPortCollection=[null]minThreadPoolSize=[3]maxThreadPoolSize=[6]systemCertificateId=[null]caCertificatesIds=[null]passphrase=[******]cipher=[Strong]sslOption=[SSL_NONE]sslAllowed=[false]sslRequired=[false]sslImplicit=[false]cccAllowed=[false]cccRequired=[false]clusterNodeName=[Node1]perimeterServerName=[local]nonTerminationCharsToTotalCharsRatio=[0.9]
Logging Level Specifies the amount of details to log. Select one of the followingvalues:
v On – Set the logging level to ALL, which includes debugging(creates larger files)
v Off – Set the logging level to ERROR (Default), which only logserrors (creates smaller files)
Note: Setting the logging level to ALL may generate an excessiveamount of debugging information. You should lower the logginglevel after you have retrieved the debugging information yourequire.
4. Click Save.
Changing Log File Location
Sterling B2B Integrator enables you to modify the location of the log files. Performthe following tasks:1. Modify the LOG_DIR setting in sandbox.cfg.2. Run the setupfiles.sh script to apply the changes.
88 Sterling B2B Integrator: Performance Management

However, the following log files created by the Sterling B2B Integrator dashboardinterface are not moved to the changed location indicated in sandbox.cfg:v jetspeed.log
v jetspeedservices.log
v torque.log
v turbine.log
v access.log
To modify the location of these log files, run the deployer.sh script. This scriptrebuilds and redeploys the Web ARchive (WAR) files of the dashboard interface.
The locations of the log files created by the service configuration are hard coded inthe configuration. As a result, the location of the einvoicing.log files cannot bechanged by modifying the setting in sandbox.cfg. To modify the location of theselog files, you must modify the settings at the service configuration level.
Log File Types
The log files in Sterling B2B Integrator can be classified under various types. Thefollowing table lists these types along with a description of the same.
Note: If you are working in a clustered environment, the log information that isdisplayed is determined by the node you select from the Select Node list.
Log Type Log Name Description
Central Operations Server
Operations Security opsSecurity.log Used by the security components.Indicates problems with startup,passwords, and passphrases.
Operations Server ops.log Used by the operations server.
opsServer.log Receives all the log messages theoperations servers generate duringstartup.
IBM Sterling Gentran:Server® for UNIX
Data Adapter Logs activities of the SterlingGentran:Server for UNIX adapter.You cannot turn logging on or off forSterling Gentran:Server for UNIXdata adapter.Note: The Sterling Gentran:Server forUNIX logs are displayed only if youhave Sterling B2B Integratorconfigured for SterlingGentran:Server for UNIX.
Application Logs
Adapter Server servicesctl.log Used by the service controllercomponent.
AFT Routing aftrouting.log
Performance Management 89
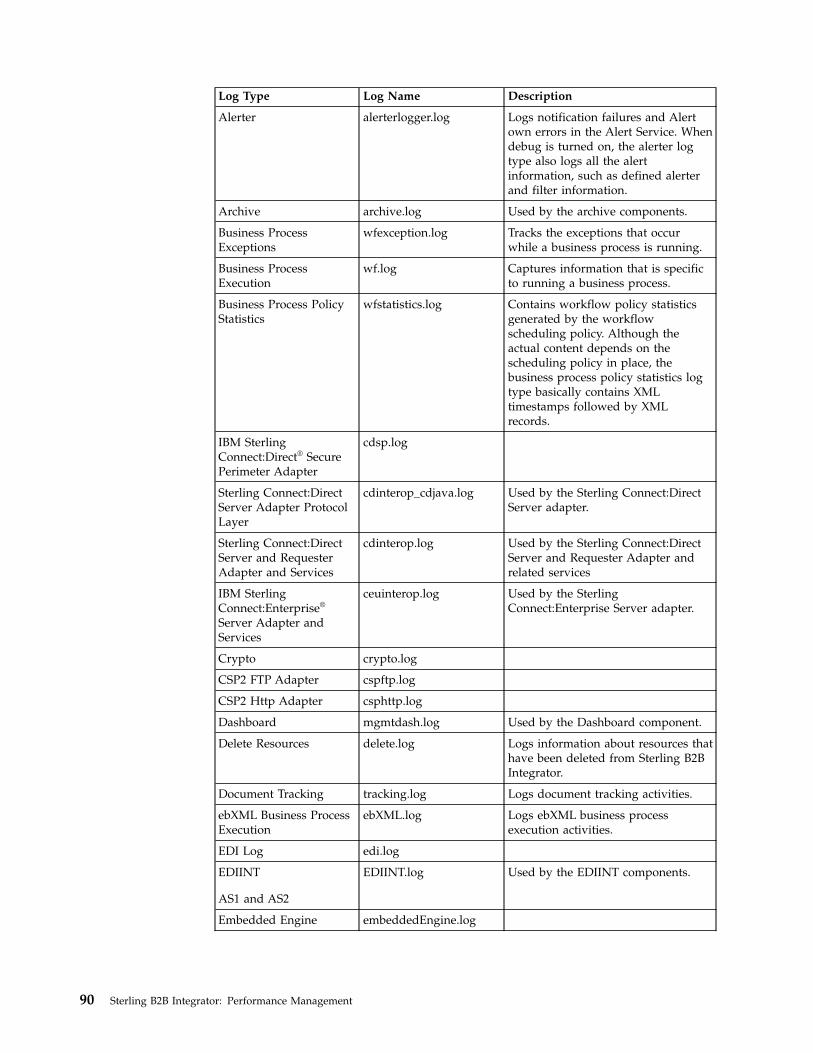
Log Type Log Name Description
Alerter alerterlogger.log Logs notification failures and Alertown errors in the Alert Service. Whendebug is turned on, the alerter logtype also logs all the alertinformation, such as defined alerterand filter information.
Archive archive.log Used by the archive components.
Business ProcessExceptions
wfexception.log Tracks the exceptions that occurwhile a business process is running.
Business ProcessExecution
wf.log Captures information that is specificto running a business process.
Business Process PolicyStatistics
wfstatistics.log Contains workflow policy statisticsgenerated by the workflowscheduling policy. Although theactual content depends on thescheduling policy in place, thebusiness process policy statistics logtype basically contains XMLtimestamps followed by XMLrecords.
IBM SterlingConnect:Direct® SecurePerimeter Adapter
cdsp.log
Sterling Connect:DirectServer Adapter ProtocolLayer
cdinterop_cdjava.log Used by the Sterling Connect:DirectServer adapter.
Sterling Connect:DirectServer and RequesterAdapter and Services
cdinterop.log Used by the Sterling Connect:DirectServer and Requester Adapter andrelated services
IBM SterlingConnect:Enterprise®
Server Adapter andServices
ceuinterop.log Used by the SterlingConnect:Enterprise Server adapter.
Crypto crypto.log
CSP2 FTP Adapter cspftp.log
CSP2 Http Adapter csphttp.log
Dashboard mgmtdash.log Used by the Dashboard component.
Delete Resources delete.log Logs information about resources thathave been deleted from Sterling B2BIntegrator.
Document Tracking tracking.log Logs document tracking activities.
ebXML Business ProcessExecution
ebXML.log Logs ebXML business processexecution activities.
EDI Log edi.log
EDIINT
AS1 and AS2
EDIINT.log Used by the EDIINT components.
Embedded Engine embeddedEngine.log
90 Sterling B2B Integrator: Performance Management
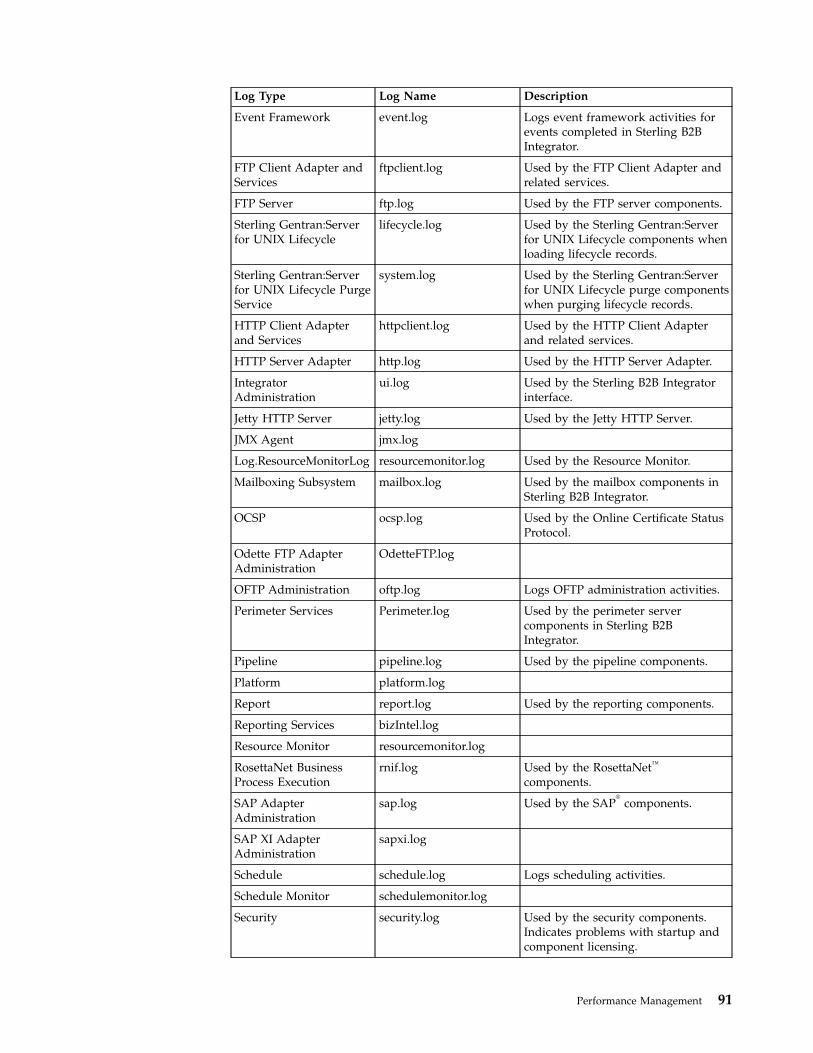
Log Type Log Name Description
Event Framework event.log Logs event framework activities forevents completed in Sterling B2BIntegrator.
FTP Client Adapter andServices
ftpclient.log Used by the FTP Client Adapter andrelated services.
FTP Server ftp.log Used by the FTP server components.
Sterling Gentran:Serverfor UNIX Lifecycle
lifecycle.log Used by the Sterling Gentran:Serverfor UNIX Lifecycle components whenloading lifecycle records.
Sterling Gentran:Serverfor UNIX Lifecycle PurgeService
system.log Used by the Sterling Gentran:Serverfor UNIX Lifecycle purge componentswhen purging lifecycle records.
HTTP Client Adapterand Services
httpclient.log Used by the HTTP Client Adapterand related services.
HTTP Server Adapter http.log Used by the HTTP Server Adapter.
IntegratorAdministration
ui.log Used by the Sterling B2B Integratorinterface.
Jetty HTTP Server jetty.log Used by the Jetty HTTP Server.
JMX Agent jmx.log
Log.ResourceMonitorLog resourcemonitor.log Used by the Resource Monitor.
Mailboxing Subsystem mailbox.log Used by the mailbox components inSterling B2B Integrator.
OCSP ocsp.log Used by the Online Certificate StatusProtocol.
Odette FTP AdapterAdministration
OdetteFTP.log
OFTP Administration oftp.log Logs OFTP administration activities.
Perimeter Services Perimeter.log Used by the perimeter servercomponents in Sterling B2BIntegrator.
Pipeline pipeline.log Used by the pipeline components.
Platform platform.log
Report report.log Used by the reporting components.
Reporting Services bizIntel.log
Resource Monitor resourcemonitor.log
RosettaNet BusinessProcess Execution
rnif.log Used by the RosettaNet™
components.
SAP AdapterAdministration
sap.log Used by the SAP®
components.
SAP XI AdapterAdministration
sapxi.log
Schedule schedule.log Logs scheduling activities.
Schedule Monitor schedulemonitor.log
Security security.log Used by the security components.Indicates problems with startup andcomponent licensing.
Performance Management 91

Log Type Log Name Description
SFTP Client Adapter andServices
sftpclient.log Used by the SFTP Client adapter andrelated services.
SFTP Common Log common3splogger.log Logs SFTP security errors.
SFTP Server Adapter sftpserver.log Used by the SFTP Server adapter.
SQL Manager sql.log Logs queries sent to the database bythe SQL Query service.
IBM Sterling SecureProxy
secureproxy.log
System system.log Used as a general logging service,typically the default system log.
noapp.log Used on an applicationserver-independent system as ageneral activity log.
System Output/ErrorRedirect
noapp.log Used to provide additional systemlog information.
Translation Log tx.log
Translation Trace Output txtrace.log Used as a logging service that helpswith map debugging. This logcontains debugging messages thatshow how the translator traversedthe maps definition and matchedeach block of data against the map.
User Authentication Authentication.log Logs user authentication attemptsand activities.
Visibility visibility.log
Web Extension webx.log Used by the Web Extensionscomponents in Sterling B2BIntegrator.
Web Services Security wssec.log
WebDAV Server webdav.log
WebSphereMQ Suite WebSphereMQSuite.log Used by the WebSphereMQ SuiteAsync Receiver adapter and relatedservices.
Windows Service GI si_exe.log Log file created by the Sterling B2BIntegrator Windows service.
Windows Service Opslog
ops_exe.log Log file created by the OpserverWindows service.
WorkFlow Deadline bpdeadline.log
WS-Reliability Routing wsrm.log
The following table describes the log files pertaining to the Sterling B2B IntegratorWindows service:
Log Name Description
ScheduleBackup.log Temporary file that is created when SterlingB2B Integrator Windows service stops.
Backuplogs.log Temporary file that is created when SterlingB2B Integrator Windows service stops.
92 Sterling B2B Integrator: Performance Management

Log Name Description
ScheduleStopOps.log Temporary log file that can be ignored.
The following table describes the log files pertaining to the DMZ perimeter server:
Log Name Description
PSLogger.Dyyyymmdd.Thhmmss Logs perimeter server information for theDMZ perimeter server.
StartupPS.log Logs startup activities for the DMZperimeter server.
AuditingIn Sterling B2B Integrator, you can find information about the creation,modification, and deletion of a Sterling B2B Integrator resource, using theAUDIT_ADMIN table. Resources include business processes, certificates (CA,trusted, system), maps, and schemas. You can access the AUDIT_ADMIN tablethrough a simple database query.
The AUDIT_ADMIN table contains the following information:v The date and time of a resource operation.v The resource that was created, modified, or deleted.v The resource operation (creation, modification, or deletion).v The User ID of the user who performed the operation.
The AUDIT_ADMIN table also contains information about when a user obtains orreleases a lock on a resource using the Lock Manager, if the type of modificationcannot be determined in the Lock Manager.
You can generate reports (by Resource Type or User ID) from the AUDIT_ADMINtable. Use the following procedure to generate an Admin-Audit Report:1. In the Administration Menu, select Operations > Reports.2. In the Search section of the screen that is displayed, select the Admin Audit
type.3. Click source manager icon adjacent to the report you want to generate:v AdminAuditByObjectType (by Resource Type)v AdminAuditByPrincipal (by User ID)
4. In the Report Source Manager page that is displayed, click the execute icon.The Admin-Audit Report is displayed.
The Admin-Audit Report (whether by Report Type or User ID), includes thefollowing columns. The AUDIT_ADMIN table field name is displayed withinparentheses after the column name.v Action Type (ACTION_TYPE)
Example: Modifiedv Action Value (ACTION_VALUE)
Example: Message Purgev Principal (PRINCIPAL)
Example: UserID
Performance Management 93

v Resource Name (OBJECT_NAME)Example: Message Maintenance
v Resource Type (OBJECT_TYPE)Example: User News
v Time (TIME)Example: 07/15/2008 12:48:54 PM
The AUDIT_ADMIN table also includes the ARCHIVE_DATE field, which is theearliest date on which the data can be purged.
The audit process tracks the following resources:v Accountsv Application Configurationsv Business Processesv Digital Certificatesv Communitiesv ebXML Specificationsv Extended Rule Librariesv Mapsv Mail Boxesv PGP Profilesv Proxy policiesv Proxy Setmapsv Perimeter Serversv Report Configurationsv Schedulesv XML Schemasv Security Tokensv Service Configurationsv SSH Resourcesv SWIFTNet Routing Rulesv Trading Partner Datav Web Resourcesv Web Servicesv WSDLv Web Templatesv XSLTs
Monitoring a Business Process ThreadA thread is a basic unit of program execution. Threads perform the actual work ina process. A process can have several threads working concurrently, for example,transferring a file to one node using FTP, and to another node using HTTP. TheActivity Engine is that part of a business process workflow engine (WFE) that callsthe business process service, takes the results from the service, and immediatelystarts the next business process service cycle.
You can monitor the threads related to business processes in Sterling B2BIntegrator using the Thread Monitor. The Thread Monitor lists all the threads that
94 Sterling B2B Integrator: Performance Management
are currently running in the Activity Engine. This information is useful fortroubleshooting business processes that have either stopped or are hanging. Youcan also stop a thread from the Thread Monitor.
Note: Whenever possible, stop business processes using the options provided inthe Business Process Monitor. These options allow you to maintain the state andthe status information.
Monitoring a Thread
To monitor threads, from the Administration menu, select Operations > ThreadMonitor. Sterling B2B Integrator displays the following information for eachthread:v The state of the thread.v The ID of the thread. (Click the ID number for more information about the
thread.)v The type of the thread:
– Business Process – Click the ID number in the ID column to display theBusiness Process Detail page.
– RMI (Remote Management Interface) – Click the ID number in the ID columnto display the Business Process Detail page.
– Harness – Click the ID number in the ID column to display the BusinessProcess Detail page.
– Schedule – Click the ID number in the ID column to display the Schedulesettings.
v The processing priority assigned to the threadv The date and time at which the thread was registered
Note: You can also view thread details from the System Troubleshooting screen(Operations > System > Troubleshooter).
Interrupting a Thread
Important: Before using the Thread Monitor to interrupt a thread, contact IBMCustomer Support for assistance. Else, unexpected processing results may occur,which may in turn affect other processes. It is recommended that you interrupt thebusiness processes from the Business Process Monitor.
To interrupt a thread, click the Interrupt icon adjacent that thread. This instructsthe thread to immediately interrupt processing without waiting for any steps tocomplete or exit with an error. In most cases, the thread will be interruptedimmediately, but the display in the Thread Monitor will not be changedimmediately. The thread will be marked as interrupted later.
Note: In some situations, it may not be possible to interrupt a thread, and yourattempt may not succeed. Interrupting a thread does not stop the service thethread is using. The service is still available for Sterling B2B Integrator to use inother business processes.
Stopping a Thread
Important: Before using the Thread Monitor to interrupt a thread, contact IBMCustomer Support for assistance. Else, unexpected processing results may occur,
Performance Management 95

which may in turn affect other processes. It is recommended that you interrupt thebusiness processes from the Business Process Monitor.
To stop a thread, click Stop icon adjacent to the thread that is to be stopped. Thisinstructs the thread to immediately stop processing without waiting for any stepsto complete or exit with an error. In most cases, the thread will stop immediately.However, this will not immediately change the display in the Thread Monitor. Thethread will eventually be marked as interrupted.
Note: In some cases, it is not possible to stop a thread, and your attempt will beunsuccessful. Stopping a thread does not stop the service that is performing thatthread. The service is still available for Sterling B2B Integrator to use in otherbusiness processes.
Setting the Refresh Option for the Thread Monitor
By default, the Thread Monitor is set to automatically refresh every 15 seconds. Toturn this option off, clear the Automatically refresh every 15 seconds check box.
Monitoring MessagesIn Sterling B2B Integrator, business processes use messages to communicate witheach other. Certain business processes create Produce and Consume messages.While the Produce business processes produce messages that are to be consumed,the Consume business processes wait for messages from the Produce businessprocesses.
Sometimes the handoff from the Produce business processes to the Consumebusiness processes does not occur. Either the produced message has no waitingConsume process, or the waiting Consume process waits without success for theProduce message. Use the Message Monitor to track unsuccessful messagehandoffs within Sterling B2B Integrator.
It is recommended that you keep the following considerations in mind whenmonitoring messages within Sterling B2B Integrator:v The Message Monitor pages of the Sterling B2B Integrator interface display only
those messages associated with a failed Produce or Consume activity. Messagesthat are successfully produced or consumed are not monitored.
v Messages are tied closely to business processes. You can search for messages bybusiness process name, type of business process (Produce or Consume), and dateand time on which the associated business process step invokes the Produce orConsume activity. However, messages also have identities that are separate frombusiness processes. Messages have names, and their names can be used assearch input.
v Sometimes Produce and Consume business processes have to choose betweenmessages having the same name. Let us for example consider that two Produceprocesses run at different times; both produce a message named OutMsg1. Thus,there are two messages named OutMsg1 in Sterling B2B Integrator, but withdifferent start date/times. When a Consume process detects the two messages, itconsumes the OutMsg1 with the later start date/time. The situation also worksin reverse. Two Consume processes request an identically named message(InMsg1). When a Produce process produces InMsg1, it produces InMsg1 for theConsume process with the earlier start date/time.
96 Sterling B2B Integrator: Performance Management

v Unsuccessful messages remain in Sterling B2B Integrator until an appropriateProduce or Consume business process step completes the message handoff anduses the message.
Note: Unsuccessful messages never expire or time out.
Searching for a Message
To search for a message in Sterling B2B Integrator:1. From the Administration menu, select Operations > Message Monitor.2. In the Message Monitor screen that is displayed, select one of the following
search criteria and click Go!
v Message Name – Displays messages whose names contain the specifiedcharacter or string.
v Start Date: and End Date: – Displays messages for which the relatedbusiness process step invokes either the Produce or Consume activity at thespecified start date and time. The start date and time that are displayed bydefault depends on whether Sterling B2B Integrator has outstandingunsuccessful messages.– If there are no unsuccessful messages in Sterling B2B Integrator, the Start
Date: field displays the current system date and time minus one minute,and the End Date: field displays the current system date and time plusone minute.
– If there are unsuccessful messages in Sterling B2B Integrator, the StartDate: field displays the date and time of the unsuccessful message withthe earliest start date and time, minus one minute, and the End Date: fielddisplays the date and time of the unsuccessful message with the lateststart date and time, plus one minute.
v Alphabetically or by message type (ALL, Producer, or Consumer) – Displaysthose messages initiated by business processes that:– Have names starting with a particular letter or number selected from the
Alphabetically list. Default is ALL (all business processes).– Are either Produce or Consume processes, or both (ALL).
3. Review the information pertaining to the listed messages. This information isdisplayed in the following columns:v Type – Type of business process associated with the message, either Produce
or Consume.v ID – ID of the business process associated with the message. Click an ID in
this column to display the Business Process Details page of the businessprocess.
v Process Name – Name of the associated Produce business process orConsume business process. Click a process name in this column to displaythe BPML of the business process.
v Message Name – Name of the unconsumed message.v Start Time – Start date and time of the associated step within the business
process.
Reviewing System InformationUse the System Troubleshooting page (Operations > System > Troubleshooter) toreview system information and troubleshoot system issues in Sterling B2BIntegrator.
Performance Management 97
From the System Troubleshooting page, you can perform the following tasks:v View system information on different nodes from any node in a clustered
environment.v Refresh system status.v Stop Sterling B2B Integrator.v View database usage statistics.
Note: If IBM DB2 is your database, the database usage statistics are alwaysdisplayed as unavailable in the System Troubleshooting page.
v View business process queue and usage statistics.v Terminate a business process.v View system classpath information.v View system JNDI tree information.v View environment statistics, including cache and memory used.v View adapter information.v View perimeter server information.v View when the archive, index, and purge tasks were completed.
The System Troubleshooting page provides quick access to system information. Itprovides links to key areas of system information instead of loading all of thesystem information at once. The system information for each area will be displayedin a pop-up window, which reduces the loading time of the SystemTroubleshooting page.
The following table provides a general description of each area. The subsequentsections provide further details about each area.
Area Information
Stop the System Stops the whole Sterling B2B Integrator cluster using the softstopscript. After that, you still need to call the hardstop script to stopthe whole system. Compare with the Soft Stop command.
Select Node The Select Node list is displayed only if you are working in aclustered environment. Your selection determines which node'sinformation is displayed in the rest of the System Troubleshootingpage.
The select node list enables you to select a node in a clusteredenvironment, which in turn decides the node whose information isto be displayed in the System Troubleshooting page.
For example, if you have two nodes in a cluster (Node 1 and Node2) and you want to view the System Troubleshooting page forNode 2, select Node 2 from the list and the SystemTroubleshooting page for Node 2 displays. If you want to viewNode 1 information, select Node 1 from the list and the SystemTroubleshooting information for Node 1 displays.
98 Sterling B2B Integrator: Performance Management

Area Information
Host Information The Host Information displays the following information:
v Start time
v Uptime
v Host
v Location
v State
v Memory available
v Active threads
SterlingGentran:Server
This area is displayed only if you have configured your system forSterling Gentran:Server Data Manager support.
The Sterling Gentran:Server area displays the followinginformation:
v Host
v Location
v State
v Controllers
v Adapters
Classpath Displays the Sterling B2B Integrator classpath.
JNDI Tree Displays the JNDI tree in Sterling B2B Integrator.
Soft StopStops a node of Sterling B2B Integrator using the softstop scriptinteractively through the UI. Compare with the Stop the Systemcommand.
Database Usage Displays the database space usage, database services (businessprocess eligibility for archive, index, and purge), and environmentpool usage.Note: For Oracle, the database usage indicator calculates free spaceused based on Oracle extents. The name of this area changes alongwith the database that you are running. For example, oraclePool isfor an Oracle database.
Business ProcessQueue Usage
Displays business process queue usage statistics such as cache diskusage, cache memory usage, queue statistics, and cache statistics.
Business ProcessUsage
Displays count of business processes by its state.
Cache Usage Displays size and hit rate for object caches.
Threads Displays active processes at a thread level.
Clean-Up ProcessesMonitor
Displays the time since the archive, index, purge, and recoverytasks were completed.
Controllers The state and name of each controller or server in the Sterling B2BIntegrator installation.
Performance Management 99

Area Information
Adapters Displays list of all the adapters in the system and their status.Note: Click an adapter name to view details about its status in theService Settings page.
Perimeter ServerStatus
The information in this area is displayed only after you haveadded a perimeter server to Sterling B2B Integrator.
The Perimeter Servers area displays the following information:
v Cluster node name (in a clustered environment only)
v Whether the perimeter server is on or off
v State, either enabled or disabled
v Name of the perimeter server
v Last activity
Stopping Sterling B2B Integrator from the SystemTroubleshooting Page
You can stop Sterling B2B Integrator using the System Troubleshooting page, usingeither a soft stop (which allows all the business processes to complete) or a hardstop (which stops the system and all the processing immediately). After a soft stop,you must still perform a hard stop to stop the system. For more information aboutthe soft stop process, refer to “Soft Stop of Sterling B2B Integrator” on page 110.
Important: Using the Soft Stop option stops only the Sterling B2B Integratorinterface immediately, while all the business processes that are in progress rununtil complete. After all the current business processes are completed, you willneed to perform a hard stop to fully stop Sterling B2B Integrator. To stop thesystem and all the processing immediately, use the Stop the System option. Allprocesses that have not been completed will stop and have to be restarted.
To stop Sterling B2B Integrator using the System Troubleshooting page:1. From the Administration menu, select Operations > System > Troubleshooter.2. In the System Troubleshooting page, in the System Status area, click Soft Stop
(for an interactive soft stop) or Stop the System (for an immediate soft stop).
Important: A soft stop does not stop all JVMs and system processing. To fullystop the system, you must perform a hard stop after the soft stop is complete. Forinstructions, see “Hard Stop of Sterling B2B Integrator” on page 120.
Viewing the Host Information
Host Information displays the current operational status of the processingenvironment for your installation of Sterling B2B Integrator. The SystemTroubleshooting page displays separate information for each installation.
Note: If you are working in a clustered installation of Sterling B2B Integrator, theinformation that displays is determined by the node you select from the SelectNode list.
To view Host Information:1. From the Administration menu, select Operations > System > Troubleshooter.
100 Sterling B2B Integrator: Performance Management
2. In the System Troubleshooting page, click Host Information.
The following information is provided for each installation:v The cluster node name, if you are working in a clustered installation of Sterling
B2B Integrator.
Note: The cluster node list displays only if you are working in a cluster. Afteryou set up your cluster, the select cluster node list displays.
v Host - The name of the host on which a specific installation resides.v Location - The location or path of the installation.v State - The running state of the installation, either Active (available for
processing) or Inactive.v Memory in use - The amount of memory used by Sterling B2B Integrator.v Active threads - The number of concurrent threads that are active.
Viewing the System Classpath
You can view the system classpath for debugging purposes and to verify whetherthird-party libraries are available in the classpath.
To view the system classpath:1. From the Administration menu, select Operations > System > Troubleshooter.2. In the System Troubleshooting page, in the System Status area, click Classpath.
Information about the System Class Path and the Dynamic Class Loader isdisplayed.
Viewing the System JNDI Tree
You can view the system JNDI tree for debugging purposes and to verify whetherthe expected resources, for example, adapters or pool names, are in the JNDI tree.
To view the system JNDI tree:1. From the Administration menu, select Operations > System > Troubleshooter.2. In the System Troubleshooting page, in the System Status area, click JNDI Tree.
The system JNDI tree displays the JNDI name and class name pairs.
Viewing a Node JNDI Tree in a Clustered Environment
You can view a specific node's JNDI tree for debugging purposes and to verifywhether the expected resources, for example, adapters or pool names, are in theJNDI tree. This option is available only in a clustered environment.
To view a node's JNDI tree in a clustered environment:1. From the Administration menu, select Operations > System > Troubleshooter.2. In the System Troubleshooting page, in the System Status area, click node#,
where # is the number of the node you want to view information about.The node's JNDI tree displays JNDI name, class name pairs, and the nodename.
Performance Management 101
Viewing the Database Usage Statistics
Database usage statistics show how your database is performing, includingdatabase insert information, database capacity, and environment pool usage.Sterling B2B Integrator uses pools to store database connections. To change poolsettings, you must manually edit the configuration files and restart the system.
Note: Database usage statistics are not available for DB2.
To view database usage statistics:1. From the Administration menu, select Operations > System > Troubleshooter.2. In the System Troubleshooting page, in the System Status area, click Database
Usage.
Note: If you have the displayGraphics property, which is located in theinstall_dir/properties/ui.properties file, set to true, the Database Usage page isdisplayed in graphic format. Otherwise, the Database Usage page is displayedin text format. The default is true for Linux®, Sun™, HP, and MicrosoftWindows® operating systems. The default is false for IBM AIX® and IBMiSeries® operating systems.The Database Usage report is displayed with the following information for eachunit test of the database:v Average time taken to perform a given number of database inserts in a unit
testv Number of inserts performed to the database in a unit test
Note: You can change the value of the dbAccessLoopCnt property in theinstall_dir/properties/ui.properties.in file. After making the changes, in theinstall_dir/bin directory, run the setupfiles script.
v Size of the inserts performed to the database in the unit test.
Note: You can change the value of the dbAccessDataSize property in theinstall_dir/properties/ui.properties.in file. After making the changes, in theinstall_dir/bin directory, run the setupfiles script.
v Size of the database and the amount of the database used (in megabytes):– Green – Normal range– Yellow – Warning range– Red – Critical range
v Number of business processes that are waiting to be archived, indexed, orpurged
v Size (in megabytes) of the following pools and the number of requests thathad to wait for the following pools:– gentranTPPool– databaseArchivePool– databasePool– databasePool_local– databasePool_NoTrans– databasePool_Select– databaseUIPool
102 Sterling B2B Integrator: Performance Management

Note: The database part of the pool names changes depending on thedatabase you are using, for example, if the database is Oracle, you will seeoraclePool.
Viewing the Business Process Queue Usage
The Business Process Queue Usage page enables you to diagnose problems withyour business process queues.
To view Business Process Queue Usage:1. From the Administration menu, select Operations > System > Troubleshooter.2.
In the System Troubleshooting page, click Business Process Usage.The page provides the following queue information:v The amount of memory available for cache and the amount consumed.v The amount of disk space available for cache and the amount consumed.v The average wait time based on priority.v The average business process execution cycle time based on priority. The
average business process execution cycle time may include the executiontimes of several steps. It captures the average time that business processesare active on threads before being rescheduled.
v The number of business processes in priority queues.v The number of business processes that ran without being cached and the
number that are currently in cache. Cache location is also specified so thatyou can determine the number of business processes that were found in thesoft reference cache, in the disk cache, and in the memory cache.
v Number of business processes within the data size ranges that have beenprocessed.
Viewing the Business Process Usage
The Business Process Usage page enables you to review the state of a businessprocess and the process count. If a link is enabled in the Process Count area, youcan select it to view affected business processes and manage them.
To view Business Process Usage:1. From the Administration menu, select Operations > System > Troubleshooter.2.
In the System Troubleshooting page, click Business Process Usage.The page provides the information about the following business process statesand the process count:v ASYNC_QUEUEDv Activev Haltedv Haltingv Waitingv Waiting_On_IOv Interrupted_Manv Interrupted_Auto
Performance Management 103

Viewing Cache Usage Information
Sterling B2B Integrator uses caches to hold information that is frequently requestedby the system. For each cache, the Cache Usage report displays statistics pertainingto the count, number of requests, and number of successful hits. To change cachesettings, refer to the information provided in “Performance Tuning Utility” on page120. You can view the cache usage information to monitor the use of various cachetypes.
To view cache usage:1. From the Administration menu, select Operations > System > Troubleshooter.2. In the Application Status area of the System Troubleshooting page, click Cache
Usage.The Cache Usage report displays the following information for each cache type:v Cache name – Name of the cachev Count – Number of objects in the cachev Requests – Number of times an object was requested from the cache,
irrespective of whether it was found or not.v Hits – Number of times an object was requested from the cache, and was
found successfully.
Viewing Threads
The Threads pop-up window displays active processes at a thread level.
To view threads in Sterling B2B Integrator:1. From the Administration menu, select Operations > System > Troubleshooter.2. In the Application Status area of the System Troubleshooting page, click
Threads.The Threads report is displayed.
Viewing the Clean-Up Processes Monitor Details
You can view details about the time that has lapsed since the completion ofdifferent cleanup processes, including archiving, purging, and indexing. This helpsyou view, at a single location, information about whether these processes arerunning and completing.
To view the Clean-Up Process Monitor details:1. From the Administration menu, select Operations > System > Troubleshooter.2. In the System Troubleshooting page, in the System Status area, click Clean-Up
Processes Monitor.The Clean-Up Processes Monitor Details window displays the status, workflow(or cleanup process) name, the date and time at which the workflow was lastrun, and the workflow ID.The Status column has the following values:v Red – More than four times the scheduled interval has elapsed without a
successful launch by the scheduler.v Yellow – More than three times the scheduled interval has elapsed without a
successful launch by the scheduler.v Green – Less than three times the scheduled interval has elapsed since a
successful launch by the scheduler.
104 Sterling B2B Integrator: Performance Management

v Gray – Either the process has never completed any scheduled instance or hasnever been scheduled.
Note: Red or Yellow status may mean that the process is not able to completethe data cleanup tasks. If this condition continues even after you have takensteps to resolve the errors, contact IBM Customer Support.
Refreshing a Controller
You can refresh the controllers that are running in your environment using theSystem Troubleshooting page.
To refresh a controller:1. From the Administration menu, select Operations > System > Troubleshooter.2. In the System Troubleshooting page, click Controllers. The Controllers pop-up
windows appears and displays the state of the controller and name of thecontroller.
3.
Click Refresh icons (arrows) next to the Controller you want to refresh.The controller is refreshed.
Viewing Adapter Information
You can view the adapters by its state that are currently active or stopped, toverify accuracy or to plan changes as needed.
To view adapter settings:1. From the Administration menu, select Operations > System > Troubleshooter.2. In the Troubleshooting page, click Adapters.3. In the Adapters page, click the name of the adapter that you want to view.
Enabling an Adapter
You can enable a disabled adapter using the System Troubleshooting page.
To enable an adapter:1. From the Administration menu, select Operations > System > Troubleshooter.2. In the Troubleshooting page, click Adapters.3. In the Adapters page, next to the adapter that you want to enable, in the
On/Off column, select the check box.
Disabling an Adapter
You can disable an enabled adapter using the System Troubleshooting page.
To disable an adapter:1. From the Administration menu, select Operations > System > Troubleshooter.2. In the Troubleshooting page, click Adapters.3. In the Adapters page, next to the adapter that you want to disable, in the
On/Off column, select the check box.
Performance Management 105
Viewing the Perimeter Server Status
The Perimeter Servers area of the System Troubleshooting page displays thefollowing information about each of your perimeter servers:v Name of the cluster node with which the perimeter server is associatedv State of the perimeter server, Enabled or Disabledv Name of the perimeter serverv Date and time of the last activity the perimeter server performed
Notes:
v If you are working in a clustered environment, the information that is displayedis determined by the node you select from the Select Node list.
v If you are not using a perimeter server, the perimeter server name is displayedas local, and the server state is Enabled.
Enabling a Perimeter Server
You can enable a disabled perimeter server using the System Troubleshooting page.
To enable a perimeter server:1. From the Administration menu, select Operations > System > Troubleshooter.2. In the Perimeter Servers area of the System Troubleshooting page, under the
On/Off column, select the check box adjacent to the perimeter server you wanto enable.
Disabling a Perimeter Server
You can disable an enabled perimeter server using the System Troubleshootingpage.
To disable a perimeter server:1. From the Administration menu, select Operations > System > Troubleshooter.2. In the Perimeter Servers area of the System Troubleshooting page, under the
On/Off column, select the check box adjacent to the perimeter server you wantto disable.
Monitoring Node StatusIf you are working in a clustered environment, information is available about allthe nodes in the cluster.
To view node status information:1. From the Administration menu, select Operations > System > Cluster > Node
Status. The Node Status page displays the information described in thefollowing table:
Heading Description
Name Displays the names of the nodes.
URL Displays the uniform resource locator of node.
Troubleshooter Provides a link to the System Troubleshooter.
106 Sterling B2B Integrator: Performance Management

Heading Description
Token Node Indicates whether this is a token node.
v True – Indicates that this is the token node.
v False – Indicates that this is not the token node.
Creation Time Displays the date and time on which a node was created.
Status Displays the status of a node.
v Active – Indicates that a node is working and is available forprocessing.
v Node went down – Indicates that a node is not working and isnot available for processing.
v Node completely down – Indicates that all the services of a nodehave been stopped completely.
v Starting Ops – Indicates that a node is starting up, but is notavailable for processing.
Notes:
v If it is indicated that a node has gone down, in theinstall_dir/bin directory of the node, run the hardstop.sh (forUNIX) or the hardstop.cmd (for Windows) script, and then runthe run.sh (for UNIX) or the startWindowsService.cmd (forWindows) script. This stops all processing, and restarts the node.
v Rerun the script of a node when its status is Node completelydown. You can monitor the status of the restarted node in theother nodes of the cluster too.
2. To view more details about a node, click the name of the node in the NodeStatus page. This displays a details page containing the information describedin the following table:
Heading Description
Node Name Displays the name of the node.
URL Displays the uniform resource locator of node.
Token Indicates whether this is a token node.
v True – Indicates that this is the token node.
v False – Indicates that this is not the token node.
Creation Time Displays the date and time on which a node was created.
Performance Management 107

Heading Description
Status Displays the status of a node.
v Active – Indicates that a node is working and is available forprocessing.
v Node went down – Indicates that a node is not working and isnot available for processing.
v Node completely down – Indicates that all the services of a nodehave been stopped completely.
v Starting Ops – Indicates that a node is starting up, but is notavailable for processing.
Notes:
v If it is indicated that a node has gone down, in theinstall_dir/bin directory of the node, run the hardstop.sh (forUNIX) or the hardstop.cmd (for Windows) script, and then runthe run.sh (for UNIX) or the startWindowsService.cmd (forWindows) script. This stops all processing, and restarts the node.
v Rerun the script of a node when its status is Node completelydown. You can monitor the status of the restarted node in theother nodes of the cluster too.
Location Displays the directory path on which the node is installed.
Role States the role of the node.
Operation ControllerHost
Displays the name of the server acting as the Operation ControllerHost.
Operation ControllerPort
Displays the port number of the Operation Controller.
Sterling B2BIntegrator Version
Displays the version of Sterling B2B Integrator that is installed inthe node.
JVM Version Displays the version number for the Java Virtual Machine (JVM™).
JVM Vendor Shows the vendor who provided the JVM™.
The information described in the following rows is displayed only if queueWatcher=true inthe install_dir/properties/noapp.properties_platform_ifcresources_ext file.
Multicast Info Provides information about the communication mechanism acrossnodes. This is used to provide load factor and status informationabout a node to all the other nodes in a cluster.
Clustering uses the JGroups communication toolkit, whichsupports the following communication protocols, which can beconfigured during deployment:
v UDP (User Datagram Protocol) (IP multicast)
v TCP
Engine QueueContent
Provides a link to the Engine Queue Content page for the nodeand queue. This page contains details about active threads, and theitems in the queue that are waiting for a thread.
Use the drop-down menu to select the queue you want to review
Distribution Size Provides a link to the Distribution Size page. This page containsthe following information:
v Scheduling policy details
v Soft reference cache details
v Queue details (for each queue)
108 Sterling B2B Integrator: Performance Management

Monitoring Deprecated ResourcesSterling B2B Integrator includes a tool that helps you monitor resources that willbe deprecated in future releases. The deprecated resources include services,adaptors, business processes, and maps. Following are the reasons for thedeprecation:v An existing resource has been replaced by an improved version of the same
resource.v An existing resource has become obsolete because of changes in the behavior of
Sterling B2B Integrator.
Note: Resources that have been identified for deprecation will continue to besupported by Sterling B2B Integrator.
Manage the deprecated resources as follows:1. Identify the deprecated resources using the Sterling B2B Integrator Resource
Deprecation Report.2. Remove and replace the deprecated resources.
Identifying Deprecated Resources
To identify the deprecated resources, perform the following tasks:1. From the Administration menu, select Operations > Reports.2. In the Reports screen, under the Lists section, select the alphabet D.3. Click Go!. The Reports page displays all the reports starting with the alphabet
D.4. For the Deprecation Report, click the source manager icon.5. Select the format in which you want the report output, for example, PDF,
HTML, or XLS.6. Click the execute icon.
The Sterling B2B Integrator Resource Deprecation Report is displayed,containing the columns described in the following table:
Column Heading Description
Resource Name The name of the resource that will be deprecated.
Examples:
v B2B_FTP_CLIENT_ADAPTER
v DeenvelopeGSType
v Reconcile997Type
Resource Type The type of resource that will be deprecated.
Example: service_instance
Date Deprecated The date on which the resource will be deprecated.
Example: 2/20/13 8:00 AM
Notes Information about how the deprecated resource will be replaced.
Examples:
v Replaced by FTP Client Adapter
v Use the DeenvelopeEDIFACT service
v Use the DeenvelopeX12 service
Performance Management 109
Note: Simply viewing a business process is not sufficient to identify the resourcesthat are being used in deprecated business resources. Some predefined businessprocesses determine the resources to be used, only at runtime. For example, someEDI enveloping and deenveloping business processes determine which map to useat runtime based on header information.
Soft Stop of Sterling B2B IntegratorA soft stop of Sterling B2B Integrator allows existing processes the opportunity tocomplete or be saved for resumption after restart.
This can save you time by eliminating the need to manually resume processes aftera restart. You can run a soft stop from either the UI or from the command line.
A soft stop provides the ability to interactively step through the shutdown process.It allows the following to happen during a shutdown:v The transfer of running business processes to other cluster nodes or to the
database for recovery.v The ability to control the completion of queued business processes.v The ability to show the status of adapter activity and open sessions.
The individual steps of a shutdown are as follows. The soft stop allows you tocontrol the execution of the individual steps required for graceful shutdown.1. A node is marked unavailable so that it does not accept jobs from other nodes.2. The unavailable node information is broadcast to other cluster nodes so that
each node knows which nodes are in the process of shutting down.3. Adapters are signaled information about the shutdown so that they can stop
accepting new requests.4. The resource monitor is shut down.5. The scheduler is shut down. For clustered installations, schedules are moved
to another live cluster node.6. All new live business processes are blocked from their queues and are
re-directed to other live cluster nodes or are saved to the database with astatus of HALTED_SOFTSTOP for autorecovery.
7. The business process drain policy and completion policy are used toredistribute business processes to other live cluster nodes or save them to thedatabase with a status of HALTED_SOFTSTOP for autorecovery if there is noother live node or if it is a standalone installation.v The completion policy determines if you finish the whole business process;
the execution cycle of the business process; or the step of the businessprocess.
v The drain policy determines what you need to do with the businessprocesses in the business process queue (drain all business processes; drainnot started business processes; drain not started business processes thathave no open servers session against adapters; or drain no businessprocesses).
8. The business processes remaining on the queue are allowed to complete.9. The system waits for all business processes to be completed.
10. The user can watch the adapter activity/sessions and manually control whento shut down adapters. Some adapters will not stop immediately. Theseadapters will defer shutdown to allow existing transfers to complete. Thestatus of these adapters can be seen via the ! icon in the adapter list.
110 Sterling B2B Integrator: Performance Management

Note: You can also shut down adapters using the graceful adapter shutdowntool. For more information, see Graceful Adapter Shutdown.
11. The JVM is exited.
Note: When you run the interactive soft stop process, it should continue untilthe JVM is exited. You should not try to undo any of the soft stop actions tobring back the system.
Important: The soft stop only stops the noapp and ops JVMs. To stop theremaining Sterling B2B Integrator JVMs and stop the system processing, youmust manually run a hard stop after the soft stop is complete.
12. After a cluster node restarts, processes that are saved in the database asHALTED_SOFTSTOP are started/resumed automatically.
Completing a Soft Stop of Sterling B2B Integrator from theSystem TroubleshooterYou can perform a soft stop from the system troubleshooter in the UI.
About this task
To perform this procedure from the command line, see “Completing a Soft Stop ofSterling B2B Integrator from the Command Line” on page 115.
Important: A soft stop of Sterling B2B Integrator using the system troubleshooteris not subject to timeout values and the soft stop will run as long as necessary forall current process to finish processing.
To complete a soft stop of Sterling B2B Integrator from the system troubleshooter:
Procedure1. Log in to the system troubleshooter (Operations > System > Troubleshooter).2. If running a cluster, select a node to shut down at the Select Node field. If you
need to shut down the container node along with the ASI node, you must firstshut down the container node and then the ASI node, because shutting downthe ASI node first will disable the soft stop UI for the container node.In a clustered installation, you also can soft stop the container node by going tothe Troubleshooter UI of the other live ASI node in the cluster and softstopping the container node from there.
3. Click Soft Stop.The soft stop page opens in a new popup window.
Performance Management 111
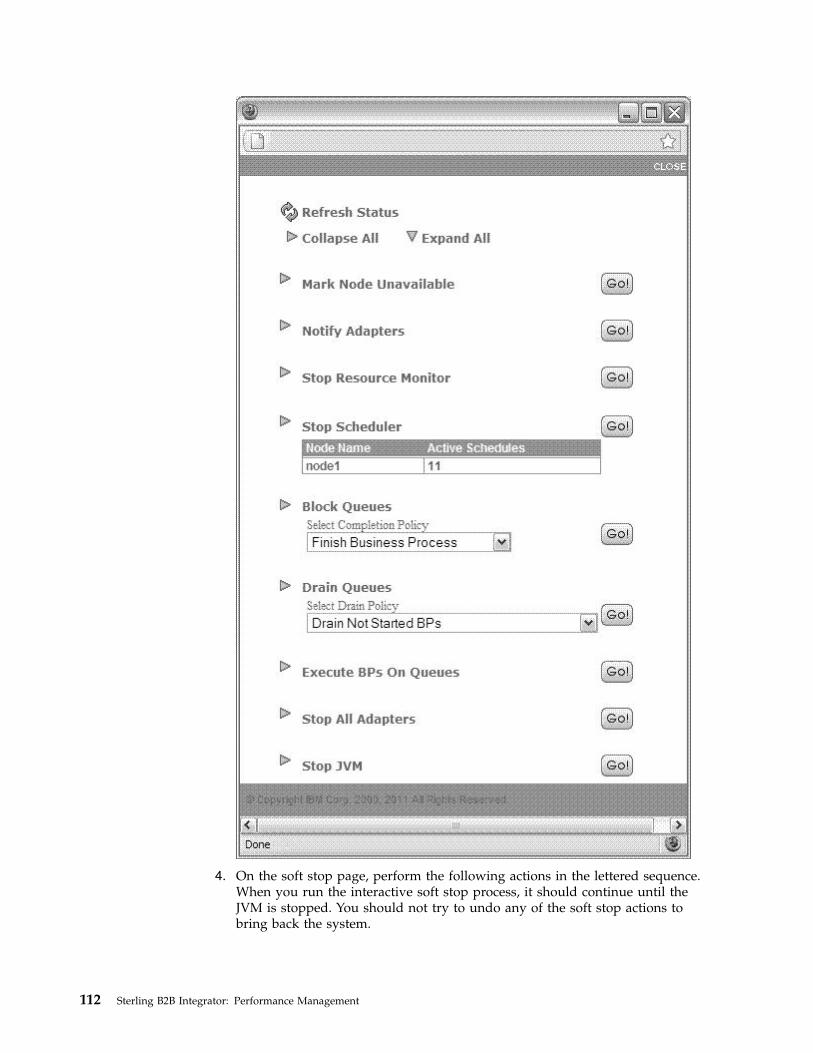
4. On the soft stop page, perform the following actions in the lettered sequence.When you run the interactive soft stop process, it should continue until theJVM is stopped. You should not try to undo any of the soft stop actions tobring back the system.
112 Sterling B2B Integrator: Performance Management
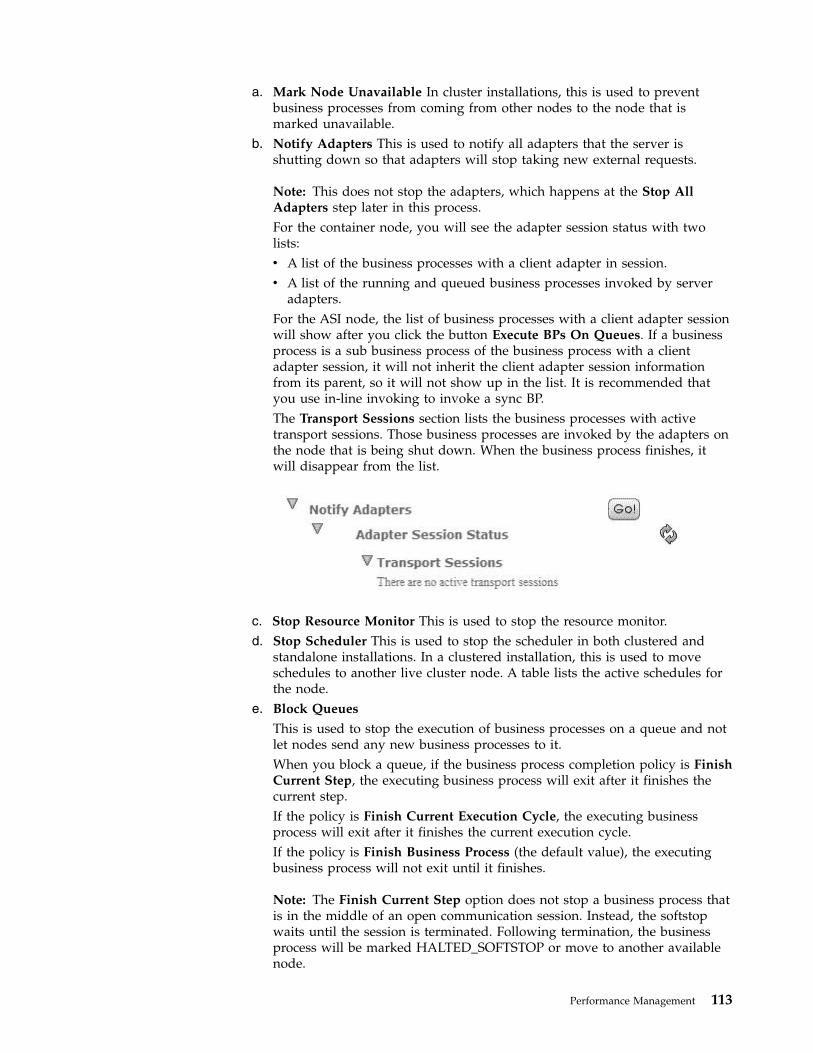
a. Mark Node Unavailable In cluster installations, this is used to preventbusiness processes from coming from other nodes to the node that ismarked unavailable.
b. Notify Adapters This is used to notify all adapters that the server isshutting down so that adapters will stop taking new external requests.
Note: This does not stop the adapters, which happens at the Stop AllAdapters step later in this process.For the container node, you will see the adapter session status with twolists:v A list of the business processes with a client adapter in session.v A list of the running and queued business processes invoked by server
adapters.For the ASI node, the list of business processes with a client adapter sessionwill show after you click the button Execute BPs On Queues. If a businessprocess is a sub business process of the business process with a clientadapter session, it will not inherit the client adapter session informationfrom its parent, so it will not show up in the list. It is recommended thatyou use in-line invoking to invoke a sync BP.The Transport Sessions section lists the business processes with activetransport sessions. Those business processes are invoked by the adapters onthe node that is being shut down. When the business process finishes, itwill disappear from the list.
c. Stop Resource Monitor This is used to stop the resource monitor.d. Stop Scheduler This is used to stop the scheduler in both clustered and
standalone installations. In a clustered installation, this is used to moveschedules to another live cluster node. A table lists the active schedules forthe node.
e. Block Queues
This is used to stop the execution of business processes on a queue and notlet nodes send any new business processes to it.When you block a queue, if the business process completion policy is FinishCurrent Step, the executing business process will exit after it finishes thecurrent step.If the policy is Finish Current Execution Cycle, the executing businessprocess will exit after it finishes the current execution cycle.If the policy is Finish Business Process (the default value), the executingbusiness process will not exit until it finishes.
Note: The Finish Current Step option does not stop a business process thatis in the middle of an open communication session. Instead, the softstopwaits until the session is terminated. Following termination, the businessprocess will be marked HALTED_SOFTSTOP or move to another availablenode.
Performance Management 113

For example, a business process starts a Sterling Connect:Direct BeginSession service, and then a sleep service is active for 5 minutes. During thattime, a softstop is triggered with the Finish Current Step completion policy.The BP will not be marked HALTED_SOFTSTOP or move to another nodeuntil the Sterling Connect:Direct End Session service is executed. Thisallows BP sessions to complete successfully without interruption.
f. Drain Queues
This is used to distribute the business processes in the queue to other livenodes (cluster installations only) or save them to the database for recovery(cluster and noncluster installations).If the drain policy is Drain ALL BPs, then both started and unstartedbusiness processes are distributed or saved. If it is Drain Not Started BPs(the default value), then just unstarted business processes are distributed orsaved. If it is Drain No BPs, then no business processes are distributed orsaved. If it is Drain Not Started BPs and No Open Session BPs, then thebusiness processes that are unstarted and with no open server session aredistributed or saved. Processes that are distributed to other queues use thesame queue number.
Note: If the business process completion policy in the Block Queues step isFinish Business Process (the default value), then the specified drain policywill be honored. If the business process completion policy is Finish CurrentStep or Finish Current Execution Cycle, then the drain policy will be DrainALL BPs.The following graphic shows an example of the results of selecting theDrain Not Started BPs option.
g. Execute BPs On Queues This is used to allow the business processes on thequeue to complete. The following graphic shows an example of this action.v The BPs Execution Summary section shows the business process activity
for all queues.v In the BPs In Execution section, you can do the following:
– Click Show Service/Adapter Activity Status to show allservice/adapter activity information. You can access the sameinformation from the Administration UI by clicking Business Process> Monitor > Current Activities.
– Click Show business process Execution Thread Status to show allthreads executing business processes. You can access the sameinformation from the Administration UI by clicking Operations >Thread Monitor.If there are business processes executing that you no longer want towait for, they can be terminated via the Show business processExecution Thread Status link, using the Stop or Interrupt buttons.
114 Sterling B2B Integrator: Performance Management

v The BPs In Queue section gives detailed information about businessprocess activity. If there are business processes remaining in the queuethat you no longer want to wait for, they can be drained by clicking theForce Drain BPs link that appears in the BPs In Queue section whenbusiness processes are in the queue.
v The Client Sessions section lists business processes that have an openclient session with adapters. You need to wait for those businessprocesses to complete before you proceed to the next step to stop alladapters.
h. Stop All Adapters
This is used to shut down all adapters until you reach a timeout (inseconds) that is specified in the shutdown.timeout_for_adapters property inthe noapp.properties_platform_ifcresources_ext.in property file. If thetimeout value is zero, the adapters will not shut down gracefully.
Note: You can also shut down adapters using the graceful adaptershutdown tool. For more information, see Graceful Adapter Shutdown.
i. Stop JVM This is used to stop the Java Virtual Machine of a node in bothclustered and standalone installations.
Important: The soft stop only stops the noapp and ops JVMs. To stop theremaining Sterling B2B Integrator JVMs and stop the system processing, youmust manually run a hard stop after the soft stop is complete.
What to do next
Important: A soft stop does not stop all JVMs and system processing. To fullystop the system, you must perform a hard stop after the soft stop is complete. Forinstructions, see “Hard Stop of Sterling B2B Integrator” on page 120.
Completing a Soft Stop of Sterling B2B Integrator from theCommand LineUse the softstop command to stop Sterling B2B Integrator gracefully. Unfinishedjobs will be distributed to other nodes or saved to the database to automaticallyresume after startup.
Performance Management 115

About this task
For individual steps of the graceful soft stop, refer to the documentation on theopscmd command.
Important: The individual steps of a soft stop of Sterling B2B Integrator from thecommand line are subject to timeout values, stored in the shutdown.* properties ofthe noapp.properties_platform_ifcresources_ext.in property file.
Procedure1. In the installation directory of Sterling B2B Integrator, navigate to the bin
subdirectory.2. Run the softstop.sh (UNIX) or softstop.cmd (Windows) command with the
following options:
Note: The default values for many of these options are stored in theshutdown.* properties of the noapp.properties_platform_ifcresources_ext.inproperty file.v node_name
The cluster node name, like node1 or node2.v all
Shuts down the whole cluster.v allLocalNodes
Shuts down all of the local nodes of an application instance, includingcontainer nodes.
Note: If you shut down all of the nodes and the ActiveMQ process is stillrunning, you need to run hardstop.sh to kill it. This applies to shuttingdown the whole cluster.
v [-tq timeout_for_queues]Timeout value in seconds for all business processes on the queue to finish.
v [-ta timeout_for_adapters]Timeout value for stopping all adapters.
Note: You can also shut down adapters using the graceful adapter shutdowntool. For more information, see Graceful Adapter Shutdown.
v [-dp bp_drain_policy]– 1 - Distribute all business processes on the queue to other nodes or save
them to the database.– 2 - Distribute all not-started business processes on the queue to other
nodes or save them to the database.– 3 - Let all the business processes on the queue be processed until a
timeout for the shutdown.– 4 - Distribute all business processes on the queue, that have not started
and have no open sessions against adapters, to other nodes or save themto the database.
v [-cp bp_completion_policy]If bp_completion_policy is 1 or 2, then bp_drain_policy is set to 1.– 1 - Complete the current business process step.– 2 - Complete the current business process execution cycle.
116 Sterling B2B Integrator: Performance Management
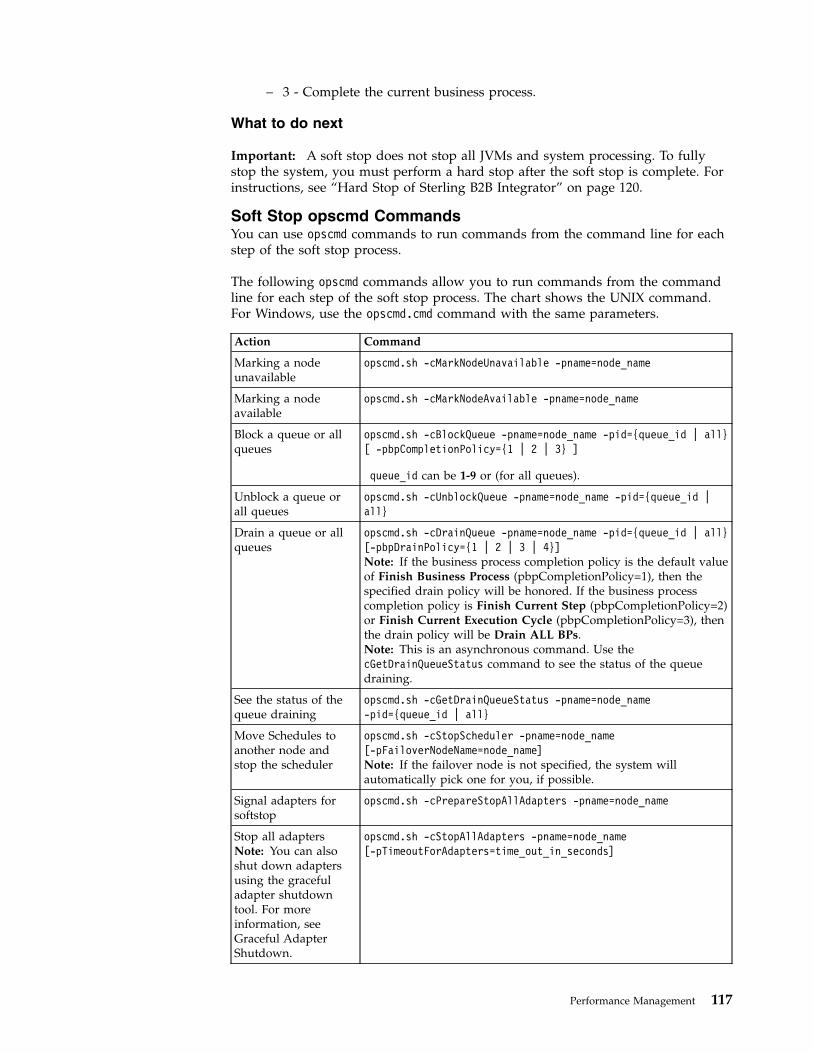
– 3 - Complete the current business process.
What to do next
Important: A soft stop does not stop all JVMs and system processing. To fullystop the system, you must perform a hard stop after the soft stop is complete. Forinstructions, see “Hard Stop of Sterling B2B Integrator” on page 120.
Soft Stop opscmd CommandsYou can use opscmd commands to run commands from the command line for eachstep of the soft stop process.
The following opscmd commands allow you to run commands from the commandline for each step of the soft stop process. The chart shows the UNIX command.For Windows, use the opscmd.cmd command with the same parameters.
Action Command
Marking a nodeunavailable
opscmd.sh -cMarkNodeUnavailable -pname=node_name
Marking a nodeavailable
opscmd.sh -cMarkNodeAvailable -pname=node_name
Block a queue or allqueues
opscmd.sh -cBlockQueue -pname=node_name -pid={queue_id | all}[ -pbpCompletionPolicy={1 | 2 | 3} ]
queue_id can be 1-9 or (for all queues).
Unblock a queue orall queues
opscmd.sh -cUnblockQueue -pname=node_name -pid={queue_id |all}
Drain a queue or allqueues
opscmd.sh -cDrainQueue -pname=node_name -pid={queue_id | all}[-pbpDrainPolicy={1 | 2 | 3 | 4}]Note: If the business process completion policy is the default valueof Finish Business Process (pbpCompletionPolicy=1), then thespecified drain policy will be honored. If the business processcompletion policy is Finish Current Step (pbpCompletionPolicy=2)or Finish Current Execution Cycle (pbpCompletionPolicy=3), thenthe drain policy will be Drain ALL BPs.Note: This is an asynchronous command. Use thecGetDrainQueueStatus command to see the status of the queuedraining.
See the status of thequeue draining
opscmd.sh -cGetDrainQueueStatus -pname=node_name-pid={queue_id | all}
Move Schedules toanother node andstop the scheduler
opscmd.sh -cStopScheduler -pname=node_name[-pFailoverNodeName=node_name]Note: If the failover node is not specified, the system willautomatically pick one for you, if possible.
Signal adapters forsoftstop
opscmd.sh -cPrepareStopAllAdapters -pname=node_name
Stop all adaptersNote: You can alsoshut down adaptersusing the gracefuladapter shutdowntool. For moreinformation, seeGraceful AdapterShutdown.
opscmd.sh -cStopAllAdapters -pname=node_name[-pTimeoutForAdapters=time_out_in_seconds]
Performance Management 117
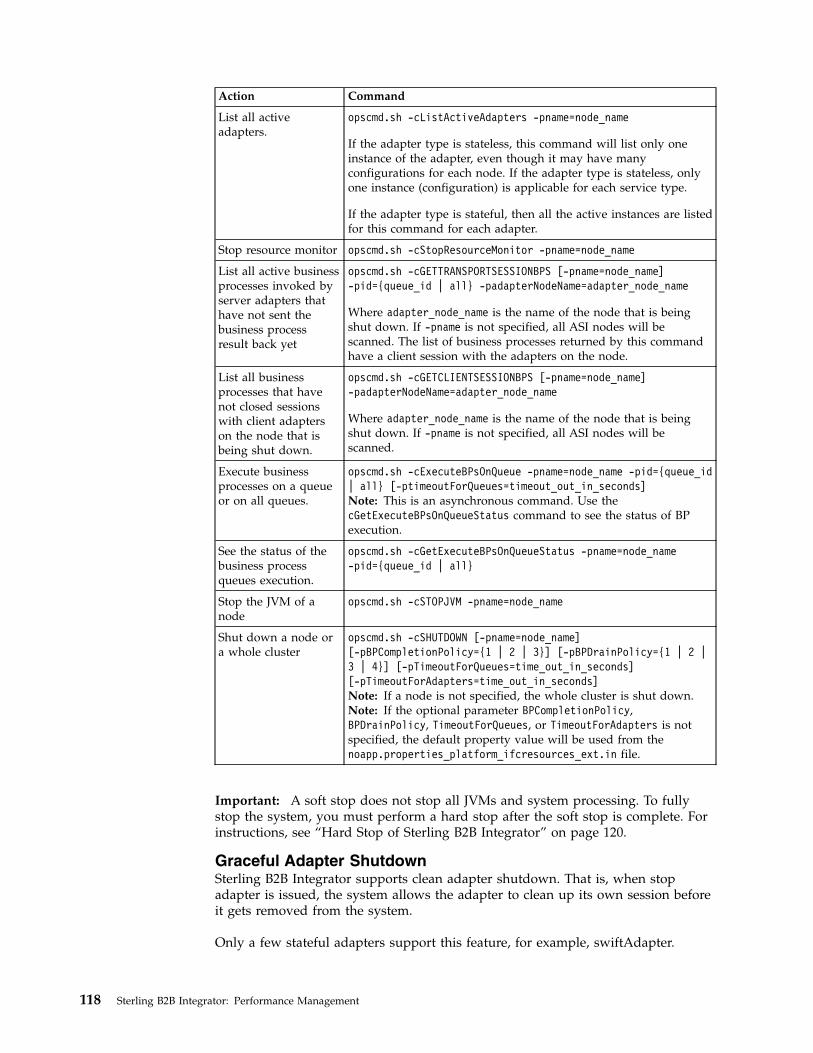
Action Command
List all activeadapters.
opscmd.sh -cListActiveAdapters -pname=node_name
If the adapter type is stateless, this command will list only oneinstance of the adapter, even though it may have manyconfigurations for each node. If the adapter type is stateless, onlyone instance (configuration) is applicable for each service type.
If the adapter type is stateful, then all the active instances are listedfor this command for each adapter.
Stop resource monitor opscmd.sh -cStopResourceMonitor -pname=node_name
List all active businessprocesses invoked byserver adapters thathave not sent thebusiness processresult back yet
opscmd.sh -cGETTRANSPORTSESSIONBPS [-pname=node_name]-pid={queue_id | all} -padapterNodeName=adapter_node_name
Where adapter_node_name is the name of the node that is beingshut down. If -pname is not specified, all ASI nodes will bescanned. The list of business processes returned by this commandhave a client session with the adapters on the node.
List all businessprocesses that havenot closed sessionswith client adapterson the node that isbeing shut down.
opscmd.sh -cGETCLIENTSESSIONBPS [-pname=node_name]-padapterNodeName=adapter_node_name
Where adapter_node_name is the name of the node that is beingshut down. If -pname is not specified, all ASI nodes will bescanned.
Execute businessprocesses on a queueor on all queues.
opscmd.sh -cExecuteBPsOnQueue -pname=node_name -pid={queue_id| all} [-ptimeoutForQueues=timeout_out_in_seconds]Note: This is an asynchronous command. Use thecGetExecuteBPsOnQueueStatus command to see the status of BPexecution.
See the status of thebusiness processqueues execution.
opscmd.sh -cGetExecuteBPsOnQueueStatus -pname=node_name-pid={queue_id | all}
Stop the JVM of anode
opscmd.sh -cSTOPJVM -pname=node_name
Shut down a node ora whole cluster
opscmd.sh -cSHUTDOWN [-pname=node_name][-pBPCompletionPolicy={1 | 2 | 3}] [-pBPDrainPolicy={1 | 2 |3 | 4}] [-pTimeoutForQueues=time_out_in_seconds][-pTimeoutForAdapters=time_out_in_seconds]Note: If a node is not specified, the whole cluster is shut down.Note: If the optional parameter BPCompletionPolicy,BPDrainPolicy, TimeoutForQueues, or TimeoutForAdapters is notspecified, the default property value will be used from thenoapp.properties_platform_ifcresources_ext.in file.
Important: A soft stop does not stop all JVMs and system processing. To fullystop the system, you must perform a hard stop after the soft stop is complete. Forinstructions, see “Hard Stop of Sterling B2B Integrator” on page 120.
Graceful Adapter ShutdownSterling B2B Integrator supports clean adapter shutdown. That is, when stopadapter is issued, the system allows the adapter to clean up its own session beforeit gets removed from the system.
Only a few stateful adapters support this feature, for example, swiftAdapter.
118 Sterling B2B Integrator: Performance Management

The progress of shutting down the adapter can be viewed via UI pages. Theprogress information is available in the following pages:v In the System Troubleshooting page:
– Soft Stop link > Stop All Adapters section– Adapters link– Clicking on the adapter name
v In the Services Configuration page:– List and Search results– Clicking on the adapter name
Graceful Adapter Shutdown through the User Interface
The following steps can be performed in both the service configuration andadapters pages.v To get to the adapter page, click Operations > System > Troubleshooter >
Adapters.v To get to the service configuration page, click Deployment > Services >
Configuration, and then search for the adapter.
List the running stateful adapters by clicking the Adapter link.1. Shut down an adapter by de-selecting the checkbox under the Enable column.
The following message appears in the Advanced State column:Stopping
2. Click on the icon in the Advanced State column.A popup window appears with two sections:v System Audit Information
This shows the status changes along with a timestamp of the wholeshutdown process.
v Adapter Advanced State Information
When the adapter finishes its current session, and shutdown is completed,the following message appears:Adapter adapter_name is currently unavailable
Graceful Adapter Shutdown through the Command Line1. Navigate to the bin subdirectory of your installation directory.2. Shut down the adapter by running the command:
opscmd.sh -cSTOPADAPTER -nnode1 -pid=adapter_name
3. Check on the status of the shutdown by running the command:opscmd.sh -cGETADAPTERADVSTATE -nnode1 -pid=adapter_name Run thiscommand until the status message changes from Adapter is preparing toshutdown to Adapter adapter_name is currently unavailable.
4. Confirm that the adapter has been shut down by running the command:opscmd.sh -cGETADAPTERADVSTATE -nnode1 -pid=adapter_name
The following message should appear:Adapter adapter_name is currently unavailable
The adapter session is finished and shutdown is complete.
Performance Management 119

Hard Stop of Sterling B2B IntegratorA hard stop of Sterling B2B Integrator immediately stops the system withoutwaiting for business processes to finish.
About this task
Hard stops may result in loss of data in unfinished processes.
To perform a hard stop:
Procedure1. Navigate to /install_dir/install/bin.2. Enter ./hardstop.sh (UNIX) or hardstop.cmd (Windows).3. Enter your passphrase.
Performance TuningSterling B2B Integrator provides a utility to help with performance tuning. You canalso perform manual performance tuning.
Performance Tuning UtilityThe performance tuning utility provided with Sterling B2B Integrator helpscalculate the tuning parameter values and configure Sterling B2B Integrator foryou.
Using the Performance Tuning utility, you can tune and configure Sterling B2BIntegrator according to your business requirements. You can change the queuesettings, memory allocations, JVM settings, and pool settings. However, note thatyou cannot use the utility to tune your business processes. For more informationabout tuning business processes, refer to the Business Process Modeling Guide.
In the future, if you apply patches to Sterling B2B Integrator, it will not overwritethe performance tuning changes made by the Performance Tuning utility.
Note: The suggested performance configuration settings are based on standardcalculations. You should test the performance configuration settings in a testenvironment with appropriate load and then apply the settings in the productionenvironment.
There are performance trade-offs that may occur based on your performanceconfiguration settings. However, you can decide to increase or decrease the valuesbased on your specific requirements. Following is a list of such scenarios that mayoccur, but not limited to:v If you increase memory for server nodes and container nodes, the system will
allocate maximum memory for the JVMs thereby reducing the amount ofmemory allocated to other applications. It may even lead to JVMs holding excessamount of memory, which could have been used by other applications.
v If you increase cache settings, it may increase the speed of disk read operations,but might affect other resources waiting for memory.
v If you increase the values in queue settings, business processes may be executedswiftly, but it might affect the read or write operations to the database
120 Sterling B2B Integrator: Performance Management

v If you increase the threads, the number of business processes that can runconcurrently may increase, but it might lead to performance degradation as itmight consume excess memory.
This section provides information about viewing, restoring, and editingperformance configuration settings through performance tuning utility.
View and Restore Performance Configuration SettingsYou can view current performance configuration settings to verify if a particularperformance configuration setting is correct and restore previous performanceconfiguration settings.
View Performance Configuration Settings
You can view the current performance configuration settings to verify if they arecorrect. The Performance Tuning page displays all settings that are currently setand suggested changes. The suggested changes displayed in this page are alsodisplayed if you are tuning the performance using the performance tuning utility.For more information about using the performance tuning utility, refer to the topic“Edit Performance Configuration Settings” on page 123.
To view your performance configuration settings:1. From the Administration menu, select Operations > System > Performance >
Tuning.2. In the Performance Tuning page, under View, next to View Performance
Configuration, click Go!.3. In the Performance Settings page, review the performance configuration
settings, which include information on:v 1) Systemv 2) JVM Parameters for Serverv 3) JVM Parameters Container Nodesv 4) BP Queuev 5) Cachev 6) Purge Settingsv 7) Database Connection Poolv 8) Queue Settingsv 9) Memory
4. Click Return to return to the Performance Tuning page.
Restore Performance Configuration Settings
You can manually restore performance configuration settings to return Sterling B2BIntegrator to the previous performance state. In the Restore Tuning page, theproperties that will change if you restore the previous performance configurationsettings are displayed in blue color text and bold format.
The User ID, along with the user name, and the time when the last performanceconfiguration settings were last edited are displayed under the Restore tab inPerformance Tuning page.
Performance Management 121

You can restore your performance configuration settings only once. If you tryrestoring the performance settings more than once, there will be no changes in thesettings. You can restore the performance configuration settings under thefollowing conditions, but not limited to:v Previous performance setting was more efficient than the current setting.v When you are testing performance by setting optimum values, restoring to the
previous setting is convenient.v Testing under varying load conditions to benchmark performance configuration
settings.
To restore your performance configuration settings:1. From the Administration menu, select Operations > System > Performance >
Tuning.2. In the Performance Tuning page, under Restore, next to View/Restore Previous
Configuration, click Go!.3. On clicking Go, the Performance Tuning UI lock-enabled message is displayed:
Performance Tuning UI lock enabled. Lock will be released only byclicking on Cancel or Finish in the wizard.
Click OK. If the lock is not released or if you close the page without clickingCancel or Finish, you must use the Lock Manager function to release the lock.
4. In the Restore Tuning Configuration page that is displayed, the properties thatwill change if you restore the previous performance configuration settings aredisplayed in blue color text and bold format. Review the performanceconfiguration settings and perform one of the following tasks:v To abandon restoring the previous performance configuration settings, click
Cancel.v To restore the previous performance configuration settings, click Finish. The
Restore Tuning Properties page appears after the restoration is complete. Thefollowing message appears: The system update completed successfully.If you restore the previous configuration settings, click Return to return tothe Performance Tuning page.
5. From the Administration menu, select Operations > System > Troubleshooter.6. From the System Troubleshooting page, click Soft Stop. This runs the softstop
script, allowing all active business processes to complete on a node beforestopping the system. The script is run through a series of interactive steps inthe UI. For more information about the softstop process, refer to “Completing aSoft Stop of Sterling B2B Integrator from the System Troubleshooter” on page111.
7. From the install_dir/bin directory, run one of the following commands:v (UNIX or Linux) setupfiles.shv (Windows) setupfiles.cmdThe performance configuration changes populate the initial setup files that areused during startup.
8. From the install_dir/bin directory, start Sterling B2B Integrator by running oneof the following commands:v (UNIX or Linux) run.shv (Windows) startWindowsService.cmdSterling B2B Integrator starts and the previous performance configurationsettings are applied. The properties in the tuning.properties file will have thesame values as the corresponding properties in the
122 Sterling B2B Integrator: Performance Management
tuningPreviousSetting.properties file. In addition, thetuningPreviousSetting.properties file will have these properties:v jdbcService.[database]UIPool.buffersizev jdbcService.[database]UIPool.initsizev jdbcService.[database]UIPool.maxsizev jdbcService.[database]Pool_NoTrans.buffersizev jdbcService.[database]Pool_NoTrans.initsizev jdbcService.[database]Pool_NoTrans.maxsizev jdbcService.[database]Pool_local.buffersizev jdbcService.[database]Pool_local.initsizev jdbcService.[database]Pool_local.maxsizev jdbcService.[database]ArchivePool.buffersizev jdbcService.[database]ArchivePool.initsizev jdbcService.[database]ArchivePool.maxsizev jdbcService.[database]Pool_Select.buffersizev jdbcService.[database]Pool_Select.initsizev jdbcService.[database]Pool_Select.maxsizev jdbcService.[database]Pool.buffersizev jdbcService.[database]Pool.initsizev jdbcService.[database]Pool.maxsize
Edit Performance Configuration SettingsYou can edit performance configuration settings using a tuning utility.
To reach the level of performance you require, you may have to allocate thefollowing items in higher or lower quantity to specific components of Sterling B2BIntegrator:v System memoryv JVM parameters for serverv JVM parameters for container nodesv BP Queuev Cachev Purge settingsv Database connection poolsv Queue settings
You can use the Performance Tuning Utility to edit the performance configurationusing the settings calculated by the system. Alternatively, if you have specificrequirements, you can edit the existing performance configuration without usingthe settings calculated by the system.
The settings modified using the performance tuning utility are stored in thetuning.properties file, which updates other properties files with the modifiedvalues. However, if you change the settings in other properties files, they are notupdated in the tuning.properties file. If you are manually changing theperformance configuration settings, ensure that you make the changes only in thetuning.properties file.
Performance Management 123

If you are running in a cluster environment, you should apply performanceconfiguration settings for each node separately by running the performance tuningutility in all the nodes.
After editing the tuning.properties file, you need to do the following to pick upthe new property values:1. In the tuningFormulas.properties file, change the TUNING_PROPS_UPDATED
property to TRUE.2. Run the setupfiles.sh or setupfiles.cmd command.3. Run the run.sh or startWindowsService.cmd command.
To edit your performance configuration:1. From the Administration menu, select Operations > System > Performance >
Tuning.2. In the Performance Tuning page, under Edit, next to Edit Performance
Configuration, click Go!.3. On clicking Go!, the Performance Tuning UI lock-enabled message is
displayed:Performance Tuning UI lock enabled. Lock will be released only byclicking on Cancel or Finish in the wizard.
4. Click OK. If the lock is not released or if you close the page without clickingCancel or Finish, you must use the Lock Manager function to release the lock.
5. In the System page that is displayed, decide whether you want to use thecurrent settings.v If yes, click Next.v If no, enter information in the following fields and click Next.
Field / Description
Tuning Formula or DefaultValue
(Default value is provided ifthere is no tuning formula)
Physical memory (MB) allocated to Platform
Amount of memory allocated for use in processingoperations.
It is recommended that you use a minimum value of512-1024 MB for this field, based on your system. Althoughthere is no minimum value for this field, a value lowerthan the recommended setting could harm performance.
tuning.properties Property:
MEMORY
Not applicable
124 Sterling B2B Integrator: Performance Management

Field / Description
Tuning Formula or DefaultValue
(Default value is provided ifthere is no tuning formula)
Number of Server Nodes
The number of server nodes installed.
CAUTION:This cannot be changed from the default value of 1,regardless of the number of nodes in the installation.Note: The Number of Server Nodes field is not displayedin iSeries environment.
tuning.properties Property:
NUM_ASI_NODES
Not applicable
Number of Container Nodes
The number of container nodes installed.
Ensure that you enter the correct number of containernodes installed. If you change the number of containernodes, the performance tuning utility will not installadditional container nodes. The performance tuning utilitywill suggest changes to the number of nodes entered in thisfield instead of the actual number of nodes installed, whichif accepted will lead to unnecessary resource allocation.
If you add a container to the system after the initialinstallation, you will have to ensure that the proper amountof memory has been allocated to the container nodes, usingthe Physical Memory Allocated to Container (MB) field onthe JVM Parameters for Container Nodes page.Note: Number of Container Nodes field is not displayed iniSeries environment.
tuning.properties Property:
NUM_CONTAINER_NODE
Not applicable
Allocate memory for BI Listeners
Select True from the drop-down list if you want to allocatememory for BI listeners from the physical memoryallocated to Sterling B2B Integrator.
By default, 256 MB memory is allocated for BI listeners.
If you select False from the drop-down list, the memory forBI listeners will not be allocated from the physical memoryallocated to Sterling B2B Integrator which may lead toimproper memory management.
tuning.properties Property:
IS_DEDUCT_MEM_BI
Default value: False
Performance Management 125

Field / Description
Tuning Formula or DefaultValue
(Default value is provided ifthere is no tuning formula)
Allocate memory for Active MQ
Select True from the drop-down list if you want to allocatememory for Active MQ messaging service from thephysical memory allocated to Sterling B2B Integrator.
By default, 512 MB memory is allocated for the Active MQmessaging service.
If you select False from the drop-down list, the memory forActive MQ messaging service will not be allocated from thephysical memory allocated to Sterling B2B Integrator, whichmay lead to improper memory management.
tuning.properties Property:
IS_DEDUCT_MEM_ACTIVEMQ
Default value: False
Allocate memory for SAP Adapter
Select True from the drop-down list if you want to allocatememory for the SAP Adapter from the physical memoryallocated to Sterling B2B Integrator.
By default, 256 MB memory is allocated for the SAPAdapter.
If you select False from the drop-down list, memory for theSAP Adapter will not be allocated from the physicalmemory allocated to Sterling B2B Integrator, which maylead to improper memory management.
tuning.properties Property:
IS_DEDUCT_MEM_SAPADAPTER
Default value: False
Allocate memory for Command Line Adapter
Select True from the drop-down list if you want to allocatememory for Command Line Adapter from the physicalmemory allocated to Sterling B2B Integrator.
By default, 128 MB memory is allocated for the CommandLine Adapter.
If you select False from the drop-down list, the memory forCommand Line Adapter will not be allocated from thephysical memory allocated to Sterling B2B Integrator, whichmay lead to improper memory management.
tuning.properties Property:
IS_DEDUCT_MEM_CLADAPTER
Default value: False
126 Sterling B2B Integrator: Performance Management
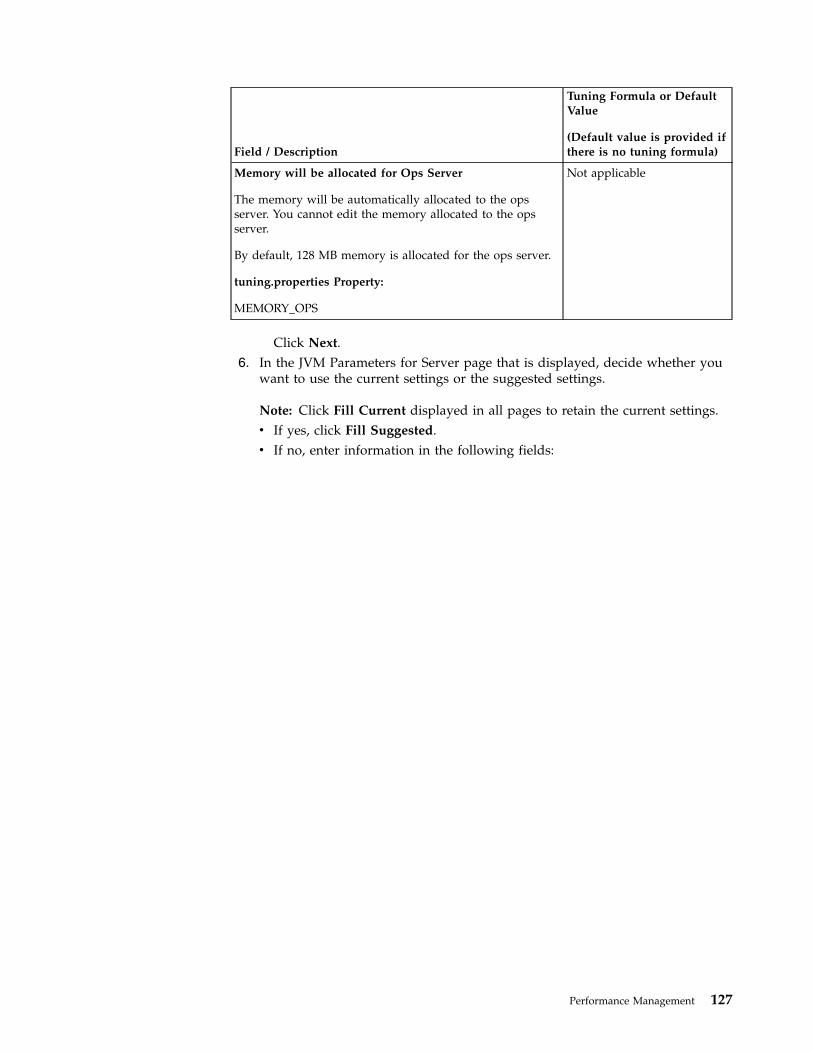
Field / Description
Tuning Formula or DefaultValue
(Default value is provided ifthere is no tuning formula)
Memory will be allocated for Ops Server
The memory will be automatically allocated to the opsserver. You cannot edit the memory allocated to the opsserver.
By default, 128 MB memory is allocated for the ops server.
tuning.properties Property:
MEMORY_OPS
Not applicable
Click Next.6. In the JVM Parameters for Server page that is displayed, decide whether you
want to use the current settings or the suggested settings.
Note: Click Fill Current displayed in all pages to retain the current settings.v If yes, click Fill Suggested.v If no, enter information in the following fields:
Performance Management 127
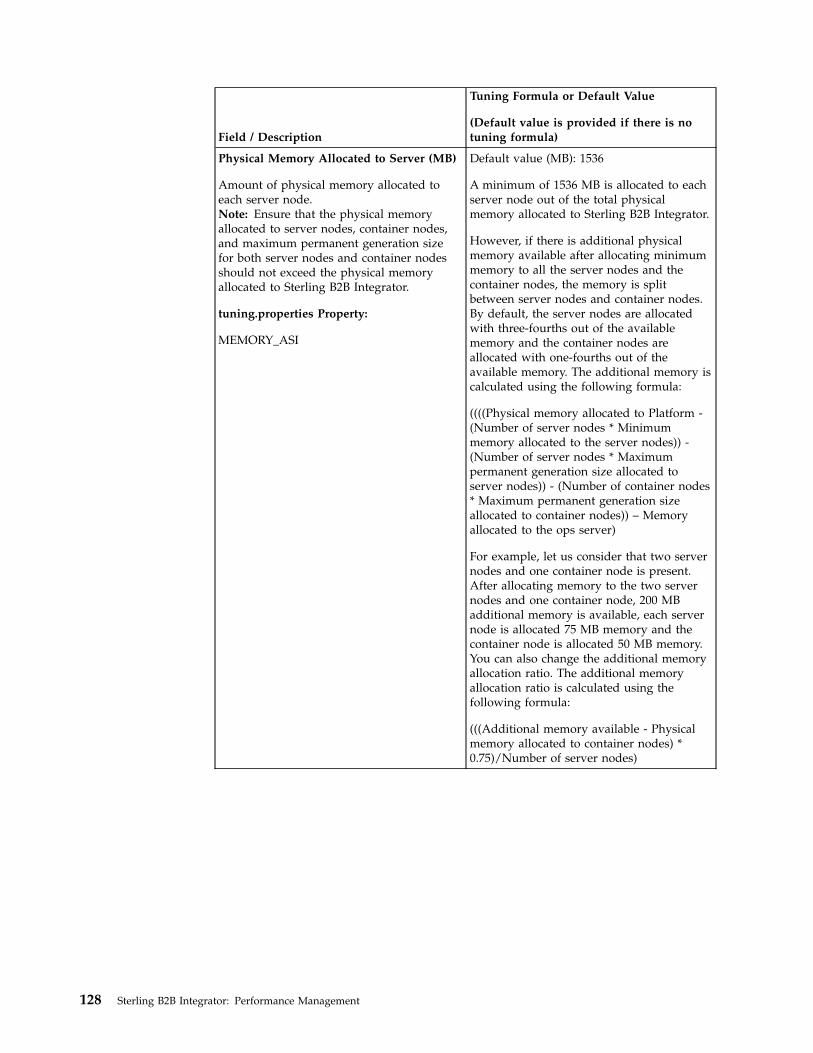
Field / Description
Tuning Formula or Default Value
(Default value is provided if there is notuning formula)
Physical Memory Allocated to Server (MB)
Amount of physical memory allocated toeach server node.Note: Ensure that the physical memoryallocated to server nodes, container nodes,and maximum permanent generation sizefor both server nodes and container nodesshould not exceed the physical memoryallocated to Sterling B2B Integrator.
tuning.properties Property:
MEMORY_ASI
Default value (MB): 1536
A minimum of 1536 MB is allocated to eachserver node out of the total physicalmemory allocated to Sterling B2B Integrator.
However, if there is additional physicalmemory available after allocating minimummemory to all the server nodes and thecontainer nodes, the memory is splitbetween server nodes and container nodes.By default, the server nodes are allocatedwith three-fourths out of the availablememory and the container nodes areallocated with one-fourths out of theavailable memory. The additional memory iscalculated using the following formula:
((((Physical memory allocated to Platform -(Number of server nodes * Minimummemory allocated to the server nodes)) -(Number of server nodes * Maximumpermanent generation size allocated toserver nodes)) - (Number of container nodes* Maximum permanent generation sizeallocated to container nodes)) – Memoryallocated to the ops server)
For example, let us consider that two servernodes and one container node is present.After allocating memory to the two servernodes and one container node, 200 MBadditional memory is available, each servernode is allocated 75 MB memory and thecontainer node is allocated 50 MB memory.You can also change the additional memoryallocation ratio. The additional memoryallocation ratio is calculated using thefollowing formula:
(((Additional memory available - Physicalmemory allocated to container nodes) *0.75)/Number of server nodes)
128 Sterling B2B Integrator: Performance Management
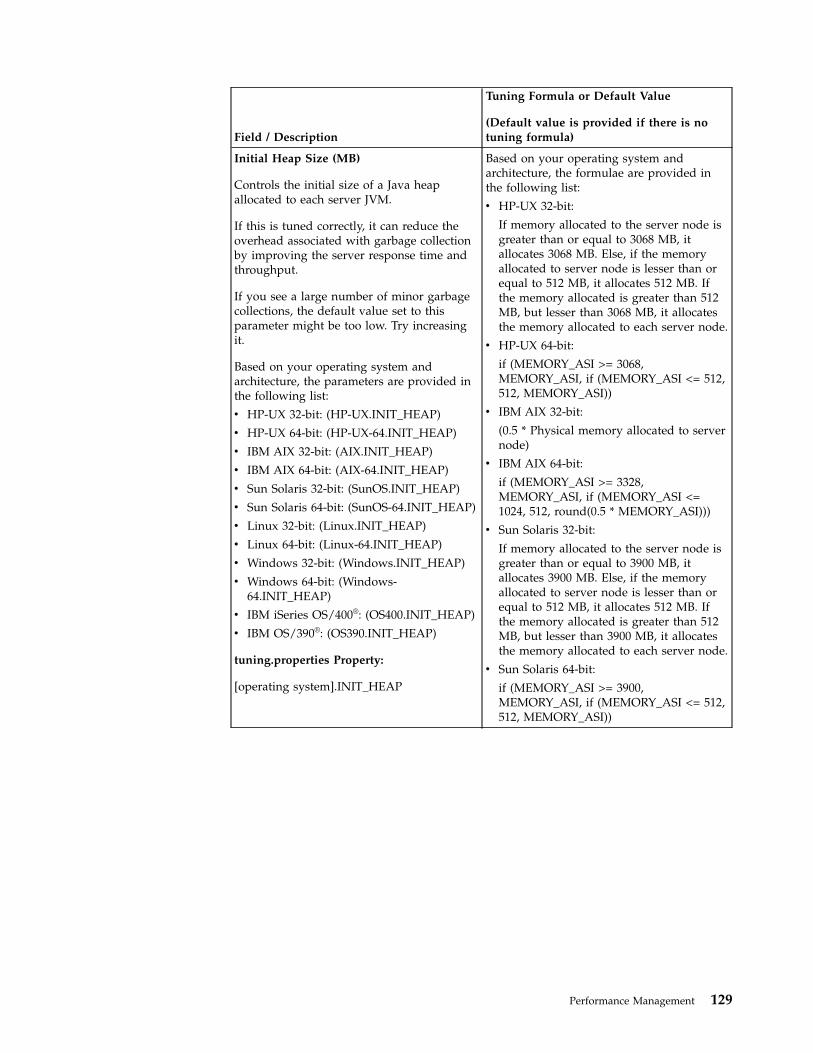
Field / Description
Tuning Formula or Default Value
(Default value is provided if there is notuning formula)
Initial Heap Size (MB)
Controls the initial size of a Java heapallocated to each server JVM.
If this is tuned correctly, it can reduce theoverhead associated with garbage collectionby improving the server response time andthroughput.
If you see a large number of minor garbagecollections, the default value set to thisparameter might be too low. Try increasingit.
Based on your operating system andarchitecture, the parameters are provided inthe following list:
v HP-UX 32-bit: (HP-UX.INIT_HEAP)
v HP-UX 64-bit: (HP-UX-64.INIT_HEAP)
v IBM AIX 32-bit: (AIX.INIT_HEAP)
v IBM AIX 64-bit: (AIX-64.INIT_HEAP)
v Sun Solaris 32-bit: (SunOS.INIT_HEAP)
v Sun Solaris 64-bit: (SunOS-64.INIT_HEAP)
v Linux 32-bit: (Linux.INIT_HEAP)
v Linux 64-bit: (Linux-64.INIT_HEAP)
v Windows 32-bit: (Windows.INIT_HEAP)
v Windows 64-bit: (Windows-64.INIT_HEAP)
v IBM iSeries OS/400®: (OS400.INIT_HEAP)
v IBM OS/390®: (OS390.INIT_HEAP)
tuning.properties Property:
[operating system].INIT_HEAP
Based on your operating system andarchitecture, the formulae are provided inthe following list:
v HP-UX 32-bit:
If memory allocated to the server node isgreater than or equal to 3068 MB, itallocates 3068 MB. Else, if the memoryallocated to server node is lesser than orequal to 512 MB, it allocates 512 MB. Ifthe memory allocated is greater than 512MB, but lesser than 3068 MB, it allocatesthe memory allocated to each server node.
v HP-UX 64-bit:
if (MEMORY_ASI >= 3068,MEMORY_ASI, if (MEMORY_ASI <= 512,512, MEMORY_ASI))
v IBM AIX 32-bit:
(0.5 * Physical memory allocated to servernode)
v IBM AIX 64-bit:
if (MEMORY_ASI >= 3328,MEMORY_ASI, if (MEMORY_ASI <=1024, 512, round(0.5 * MEMORY_ASI)))
v Sun Solaris 32-bit:
If memory allocated to the server node isgreater than or equal to 3900 MB, itallocates 3900 MB. Else, if the memoryallocated to server node is lesser than orequal to 512 MB, it allocates 512 MB. Ifthe memory allocated is greater than 512MB, but lesser than 3900 MB, it allocatesthe memory allocated to each server node.
v Sun Solaris 64-bit:
if (MEMORY_ASI >= 3900,MEMORY_ASI, if (MEMORY_ASI <= 512,512, MEMORY_ASI))
Performance Management 129

Field / Description
Tuning Formula or Default Value
(Default value is provided if there is notuning formula)
v Linux 32-bi:
(0.5 * Physical memory allocated to servernode)
v Linux 64-bit:
=if (MEMORY_ASI >= 2036,MEMORY_ASI, if (MEMORY_ASI <=1024, 512, round(0.5 * MEMORY_ASI)))
v Windows 32-bit:
if (MEMORY_ASI >= 1536, 768, if(MEMORY_ASI <= 1024, 512, round(0.5 *MEMORY_ASI)))
v Windows 64-bit:
if (MEMORY_ASI >= 1536,MEMORY_ASI, if (MEMORY_ASI <=1024, 512, round(0.5 * MEMORY_ASI)))
v IBM iSeries OS/400:
If memory allocated to the server node isgreater than or equal to 2048 MB, itallocates 2048 MB. Else, if the memoryallocated to server node is lesser than orequal to 512 MB, it allocates 512 MB. Ifthe memory allocated is greater than 512MB, but lesser than 2048 MB, it allocatesthe memory allocated to each server node.
v IBM OS/390:
If memory allocated to the server node isgreater than or equal to 2048 MB, itallocates 2048 MB. Else, if the memoryallocated to server node is lesser than orequal to 512 MB, it allocates 512 MB. Ifthe memory allocated is greater than 512MB, but lesser than 2048 MB, it allocatesthe memory allocated to each server node.
130 Sterling B2B Integrator: Performance Management

Field / Description
Tuning Formula or Default Value
(Default value is provided if there is notuning formula)
Maximum Heap Size (MB)
Controls the maximum size of a Java heapallocated to each server JVM.
If this parameter is tuned correctly, it can:
v Reduce the overhead associated with thegarbage collection and the risk ofencountering an Out-Of-Memory (OOM)condition
v Improve the server response time andthroughput
If you see a large number of garbagecollections, try increasing the value. Basedon the Operation System (OS), and whetherit is a 32-bit JVM or 64-bit JVM, and theavailable memory, the maximum value thatyou can go up to will change.
Based on your operating system andarchitecture, the parameters are provided inthe following list:
v HP-UX 32-bit: (HP-UX.MAX_HEAP)
v HP-UX 64-bit: (HP-UX-64.MAX_HEAP)
v IBM AIX 32-bit: (AIX.MAX_HEAP)
v IBM AIX 64-bit: (AIX-64.MAX_HEAP)
v Sun Solaris 32-bit: (SunOS.MAX_HEAP)
v Sun Solaris 64-bit: (SunOS-64.MAX_HEAP)
v Linux 32-bit: (Linux.MAX_HEAP)
v Linux 64-bit: (Linux-64.MAX_HEAP)
v Windows 32-bit: (Windows.MAX_HEAP)
v Windows 64-bit: (Windows-64.MAX_HEAP)
v IBM iSeries OS/400: (OS400.MAX_HEAP)
v IBM OS/390: (OS390.MAX_HEAP)
tuning.properties Property:
[operating system].MAX_HEAP
Based on your operating system andarchitecture, the formulae are provided inthe following list:
v HP-UX 32-bit:
If memory allocated to the server node isgreater than or equal to 3068 MB, itallocates 3068 MB. Else, if the memoryallocated to server node is lesser than orequal to 512 MB, it allocates 512 MB. Ifthe memory allocated is greater than 512MB, but lesser than 3068 MB, it allocatesthe memory allocated to each server node.
v HP-UX 64-bit:
if (MEMORY_ASI >= 3068,MEMORY_ASI, if (MEMORY_ASI <= 512,512, MEMORY_ASI))
v IBM AIX 32-bit:
If memory allocated to the server node isgreater than or equal to 3328 MB, itallocates 3328 MB. Else, if the memoryallocated to server node is lesser than orequal to 512 MB, it allocates 512 MB. Ifthe memory allocated is greater than 512MB, but lesser than 3328 MB, it allocatesthe memory allocated to each server node.
v IBM AIX 64-bit:
if (MEMORY_ASI >= 3328,MEMORY_ASI, if (MEMORY_ASI <= 512,512, MEMORY_ASI))
Performance Management 131

Field / Description
Tuning Formula or Default Value
(Default value is provided if there is notuning formula)
v Sun Solaris 32-bit:
If memory allocated to the server node isgreater than or equal to 3900 MB, itallocates 3900 MB. Else, if the memoryallocated to server node is lesser than orequal to 512 MB, it allocates 512 MB.
v Sun Solaris 64-bit:
if (MEMORY_ASI >= 3900,MEMORY_ASI, if (MEMORY_ASI <= 512,512, can set a maximum heap limit of 4GB for MEMORY_ASI))
v Linux 32-bit:
If memory allocated to the server node isgreater than or equal to 2036 MB, itallocates 2036 MB. Else, if the memoryallocated to server node is lesser than orequal to 512 MB, it allocates 512 MB. Ifthe memory allocated is greater than 512MB, but lesser than 2036 MB, it allocatesthe memory allocated to each server node.
v Linux 64-bit:
if (MEMORY_ASI >= 2036,MEMORY_ASI, if (MEMORY_ASI <= 512,512, MEMORY_ASI))
v Windows 32-bit:
if (MEMORY_ASI >= 1280, 1280, if(MEMORY_ASI <= 512, 512,MEMORY_ASI))
v Windows 64-bit:
if (MEMORY_ASI >= 1536,MEMORY_ASI, if (MEMORY_ASI <= 512,512, MEMORY_ASI))
v IBM iSeries OS/400:
If memory allocated to the server node isgreater than or equal to 2048 MB, itallocates 2048 MB. Else, if the memoryallocated to server node is lesser than orequal to 512 MB, it allocates 512 MB. Ifthe memory allocated is greater than 512MB, but lesser than 2048 MB, it allocatesthe memory allocated to each server node.
v IBM OS/390:
If memory allocated to the server node isgreater than or equal to 2048 MB, itallocates 2048 MB. Else, if the memoryallocated to server node is lesser than orequal to 512 MB, it allocates 512 MB. Ifthe memory allocated is greater than 512MB, but lesser than 2048 MB, it allocatesthe memory allocated to each server node.
132 Sterling B2B Integrator: Performance Management

Field / Description
Tuning Formula or Default Value
(Default value is provided if there is notuning formula)
Initial Size of New (Nursery) Heap (MB)
Controls the initial size of the new heap areaallocated to each server JVM.
It is used with the throughput/parallelcollector instead of the JVM built-in tuningthe parameter provides.
Based on your operating system andarchitecture, the parameters are provided inthe following list:
v HP-UX 32-bit: (HP-UX.INIT_AGE)
v HP-UX 64-bit: (HP-UX-64.INIT_AGE)
v IBM AIX 32-bit: (AIX.INIT_AGE)
v IBM AIX 64-bit: (AIX-64.INIT_AGE)
v Sun Solaris 32-bit: (SunOS.INIT_AGE)
v Sun Solaris 64-bit: (SunOS-64.INIT_AGE)
v Linux 32-bit: (Linux.INIT_AGE)
v Linux 64-bit: (Linux-64.INIT_AGE)
v Windows 32-bit: (Windows.INIT_AGE)
v Windows 64-bit: (Windows-64.INIT_AGE)
v IBM iSeries OS/400: (OS400.INIT_AGE)
v IBM OS/390: (OS390.INIT_AGE)
tuning.properties Property:
[operating system].INIT_AGE
(0.33333 * Initial size of heap memoryallocated to the server node)
AIX 64-bit: AIX-64.INIT_AGE=256
Linux 64-bit: Linux-64.INIT_AGE=256
Windows 32-bit:Windows.INIT_AGE=round(0.33333 *Windows.INIT_HEAP)
HP 64-bit: HP-UX-64.INIT_AGE=round(0.33333 *HP-UX-64.INIT_HEAP)
Sun 64--bit: SunOS-64.INIT_AGE=round(0.33333 *SunOS-64.INIT_HEAP)
Windows 64-bit: Windows-64.INIT_AGE=round(0.33333 *Windows-64.INIT_HEAP)
Performance Management 133
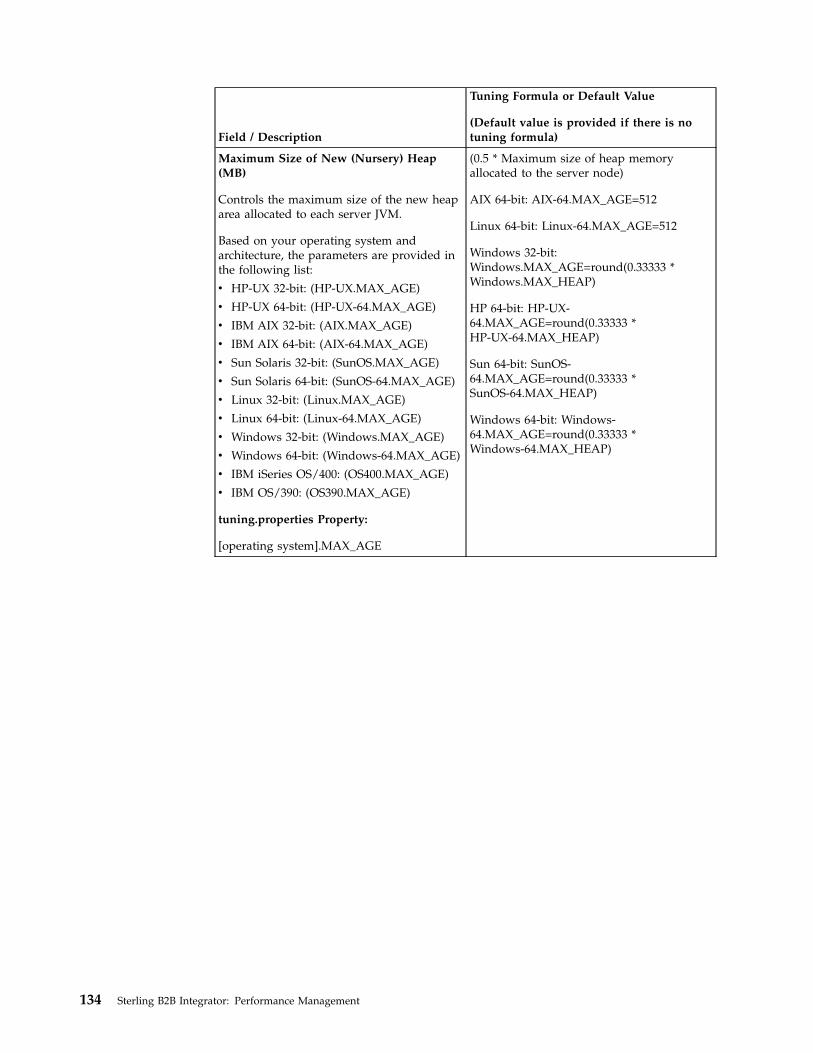
Field / Description
Tuning Formula or Default Value
(Default value is provided if there is notuning formula)
Maximum Size of New (Nursery) Heap(MB)
Controls the maximum size of the new heaparea allocated to each server JVM.
Based on your operating system andarchitecture, the parameters are provided inthe following list:
v HP-UX 32-bit: (HP-UX.MAX_AGE)
v HP-UX 64-bit: (HP-UX-64.MAX_AGE)
v IBM AIX 32-bit: (AIX.MAX_AGE)
v IBM AIX 64-bit: (AIX-64.MAX_AGE)
v Sun Solaris 32-bit: (SunOS.MAX_AGE)
v Sun Solaris 64-bit: (SunOS-64.MAX_AGE)
v Linux 32-bit: (Linux.MAX_AGE)
v Linux 64-bit: (Linux-64.MAX_AGE)
v Windows 32-bit: (Windows.MAX_AGE)
v Windows 64-bit: (Windows-64.MAX_AGE)
v IBM iSeries OS/400: (OS400.MAX_AGE)
v IBM OS/390: (OS390.MAX_AGE)
tuning.properties Property:
[operating system].MAX_AGE
(0.5 * Maximum size of heap memoryallocated to the server node)
AIX 64-bit: AIX-64.MAX_AGE=512
Linux 64-bit: Linux-64.MAX_AGE=512
Windows 32-bit:Windows.MAX_AGE=round(0.33333 *Windows.MAX_HEAP)
HP 64-bit: HP-UX-64.MAX_AGE=round(0.33333 *HP-UX-64.MAX_HEAP)
Sun 64-bit: SunOS-64.MAX_AGE=round(0.33333 *SunOS-64.MAX_HEAP)
Windows 64-bit: Windows-64.MAX_AGE=round(0.33333 *Windows-64.MAX_HEAP)
134 Sterling B2B Integrator: Performance Management

Field / Description
Tuning Formula or Default Value
(Default value is provided if there is notuning formula)
Maximum Permanent Generation Size(MB)
Controls the maximum size of thepermanent generation heap allocated to theserver JVM. It stores all the class code andclass-like data.
The value of the parameter should be largeenough to fit all the classes that areconcurrently loaded. Sometimes, it isdifficult to determine the actual value of thisparameter because generally, this region issmaller and expands slowly, and theutilization is commonly observed at 99-100percent of its current capacity. If you havenot configured this region correctly, the JVMmight fail with the error.
Based on your operating system andarchitecture, the parameters are provided inthe following list:
v HP-UX 32-bit: (HP-UX.MAX_PERM_SIZE)
v HP-UX 64-bit: (HP-UX-64.MAX_PERM_SIZE)
v IBM AIX 32-bit: (AIX.MAX_PERM_SIZE)
v IBM AIX 64-bit: (AIX-64.MAX_PERM_SIZE)
v Sun Solaris 32-bit:(SunOS.MAX_PERM_SIZE)
v Sun Solaris 64-bit: (SunOS-64.MAX_PERM_SIZE)
v Linux 32-bit: (Linux.MAX_PERM_SIZE)
v Linux 64-bit: (Linux-64.MAX_PERM_SIZE)
v Windows 32-bit:(Windows.MAX_PERM_SIZE)
v Windows 64-bit: (Windows-64.MAX_PERM_SIZE)
v IBM iSeries OS/400:(OS400.MAX_PERM_SIZE)
v IBM OS/390: (OS390.MAX_PERM_SIZE)
tuning.properties Property:
[operating system].MAX_PERM_SIZE
Based on your operating system andarchitecture, Sterling B2B Integrator allocatesthe following values (in MB):
v HP-UX (32-bit and 64-bit): 512
v IBM AIX (32-bit and 64-bit): 384
v Sun Solaris (32-bit and 64-bit): 384
v Linux (32-bit and 64-bit): 384
v Windows 32-bit: 256
v Windows 64-bit: 384
v IBM iSeries OS/400: 384
v IBM OS/390: 384
Performance Management 135

Field / Description
Tuning Formula or Default Value
(Default value is provided if there is notuning formula)
Thread Stack Size (KB)
Controls the maximum Java stack size forany thread.
tuning.properties Property:
[operating system].STATIC_STACK
Based on your operating system andarchitecture (in KB):
v HP-UX 32-bit: 384
v HP-UX 64-bit: 512
v IBM AIX (32-bit and 64-bit): 256
v Sun Solaris (32-bit and 64-bit): 256
v Linux (32-bit and 64-bit): 256
v IBM iSeries OS/400 (32-bit and 64-bit): 256
v IBM OS/390 (32-bit and 64-bit): 256
v Windows (32-bit and 64-bit): 256
Enable Heap Dump on Out of Memory
Select True from the drop-down list if youwant to generate a heapdump when theserver JVM encounters an out of memoryerror.
Heapdumps are useful for troubleshootingmemory-related issues since they contain allthe live objects used by the Java application.With this information, the objects that areusing large amounts of memory can beidentified. The contents of a heapdump canalso help a user understand why objectscannot be freed by the Garbage Collector.
By default, the dump file is generated fromwhere the JVM was started (theinstall_dir/bin directory).
If you select False from the drop-down list,heapdumps are not generated when theserver JVM encounters an out of memoryerror.
tuning.properties Property:
ENABLE_HEAP_DUMP_OOB
Default value: True
136 Sterling B2B Integrator: Performance Management

Field / Description
Tuning Formula or Default Value
(Default value is provided if there is notuning formula)
Enable Heap Dump on Sigquit/Ctrl-break
Note: This field is not supported in the 1.6version of the Sun JDK. It will display if youare using the IBM JDK.Select True from thedrop-down list if you want to request aheapdump for the server JVM using Sigquitcommand or pressing Ctrl+Break for serverJVM.
By default, the dump file is generated fromwhere the JVM was started (theinstall_dir/bin directory).
If you select False from the drop-down list,heapdumps are not generated if you runSigquit command or press Ctrl+Break.
tuning.properties Property:
ENABLE_HEAP_DUMP_SGTQCRTLBRK
Default value: True
Enable VerboseGC
Select True from the drop-down list if youwant to generate verbose garbage collectiondata for server JVM.
JVM Verbose garbage collection (GC)statistics are critical. It is recommended toenable verbose garbage collection when youare debugging your instance. These statisticscan be used to understand the behavior ofthe JVM heap management and theefficiency of the JVM.
If you select False from the drop-down list,verbose garbage collection will be disabled.
tuning.properties Property:
ENABLE_VERBOSE_GC
Default value: False
JVM Arguments Prefix
Determines the arguments set as JVMparameters before other JVM flags are set forserver JVM.
Ensure that you enter correct values in thisfield. Else, the server JVM might fail to start.
For example, -XX:SurvivorRatio parameteroptimizes the object creation and objectpreservation ratio.
tuning.properties Property:
JVM_ARGS_PREFIX
Default value: BLANK
Performance Management 137
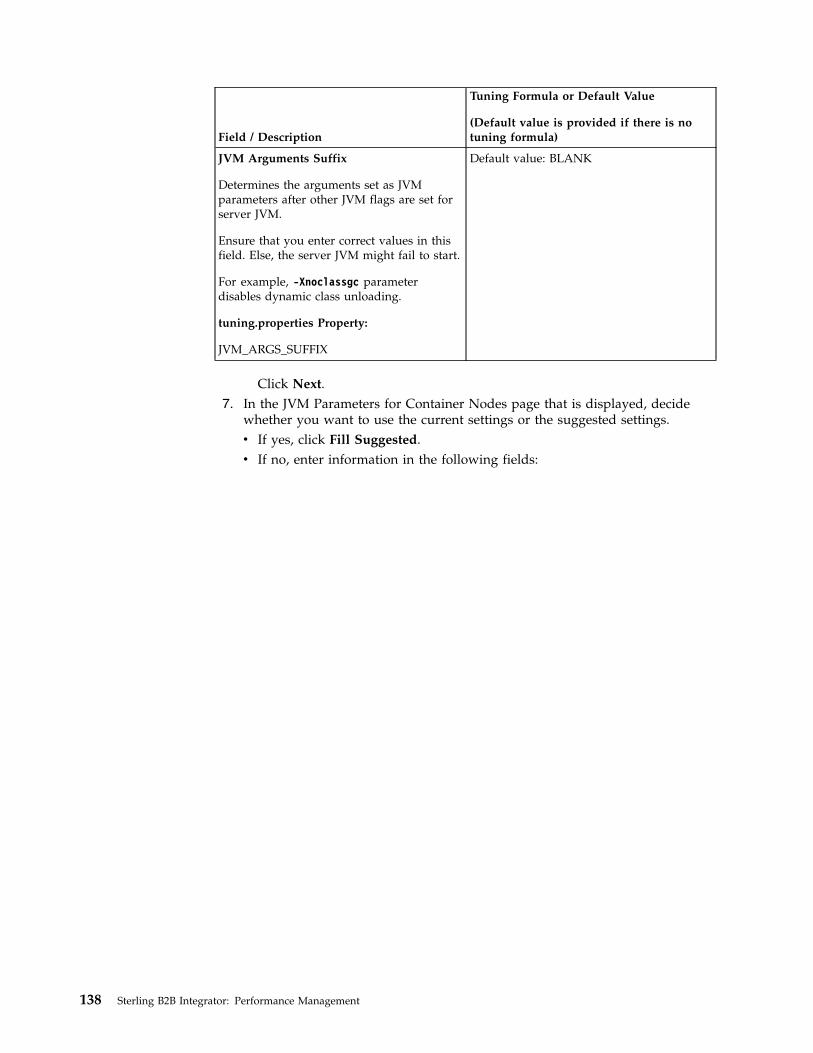
Field / Description
Tuning Formula or Default Value
(Default value is provided if there is notuning formula)
JVM Arguments Suffix
Determines the arguments set as JVMparameters after other JVM flags are set forserver JVM.
Ensure that you enter correct values in thisfield. Else, the server JVM might fail to start.
For example, -Xnoclassgc parameterdisables dynamic class unloading.
tuning.properties Property:
JVM_ARGS_SUFFIX
Default value: BLANK
Click Next.7. In the JVM Parameters for Container Nodes page that is displayed, decide
whether you want to use the current settings or the suggested settings.v If yes, click Fill Suggested.v If no, enter information in the following fields:
138 Sterling B2B Integrator: Performance Management

Field / Description
Tuning Formula or Default Value
(Default value is provided if there is notuning formula)
Physical Memory Allocated to Container(MB)
Amount of physical memory allocated toeach container node.
Ensure that the physical memory allocatedto server nodes, container nodes, andmaximum permanent generation size forboth server nodes and container nodesshould not exceed the physical memoryallocated to Sterling B2B Integrator.
If you add a container to the system afterthe initial installation, you will have toensure that the proper amount of memoryhas been allocated to the container nodes,using this field.
tuning.properties Property:
MEMORY_CONTAINER
Default value (MB): 512
A minimum of 512 MB is allocated to eachcontainer node out of the total physicalmemory allocated to Sterling B2B Integrator.
However, if there is additional physicalmemory available after allocating minimummemory to all the server nodes and thecontainer nodes, the memory is splitbetween server nodes and container nodes.By default, the server nodes are allocatedwith three-fourths out of the availablememory and the container nodes areallocated with one-fourths out of theavailable memory. The additional memory iscalculated using the following formula:
((((Physical memory allocated to Platform -(Number of server nodes * Minimummemory allocated to the server nodes)) -(Number of server nodes * Maximumpermanent generation size allocated toserver nodes)) - (Number of container nodes* Maximum permanent generation sizeallocated to container nodes)) – Memoryallocated to the ops server)
For example, let us consider that two servernodes and one container node is present.After allocating memory to the two servernodes and one container node, 200 MBadditional memory is available, each servernode is allocated 75 MB memory and thecontainer node is allocated 50 MB memory.You can also change the additional memoryallocation ratio. The additional memoryallocation ratio is calculated using thefollowing formula:
(((Additional memory available - Physicalmemory allocated to container nodes) *0.25)/Number of container nodes)
Performance Management 139
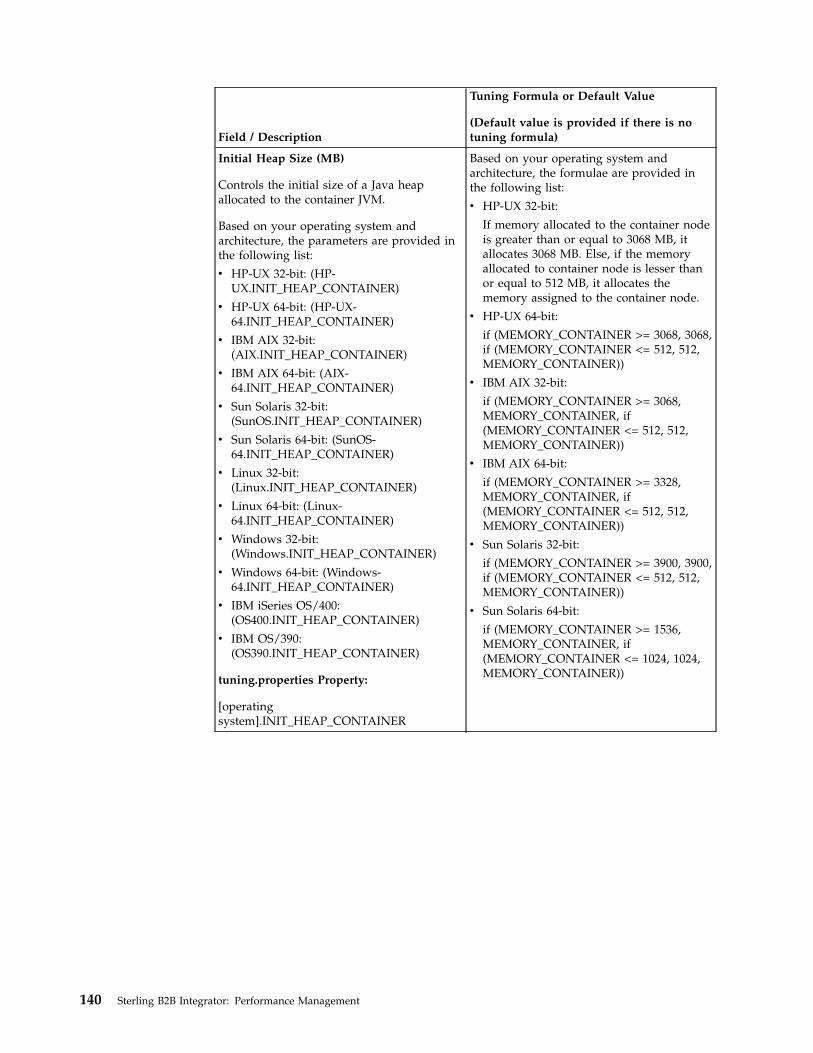
Field / Description
Tuning Formula or Default Value
(Default value is provided if there is notuning formula)
Initial Heap Size (MB)
Controls the initial size of a Java heapallocated to the container JVM.
Based on your operating system andarchitecture, the parameters are provided inthe following list:
v HP-UX 32-bit: (HP-UX.INIT_HEAP_CONTAINER)
v HP-UX 64-bit: (HP-UX-64.INIT_HEAP_CONTAINER)
v IBM AIX 32-bit:(AIX.INIT_HEAP_CONTAINER)
v IBM AIX 64-bit: (AIX-64.INIT_HEAP_CONTAINER)
v Sun Solaris 32-bit:(SunOS.INIT_HEAP_CONTAINER)
v Sun Solaris 64-bit: (SunOS-64.INIT_HEAP_CONTAINER)
v Linux 32-bit:(Linux.INIT_HEAP_CONTAINER)
v Linux 64-bit: (Linux-64.INIT_HEAP_CONTAINER)
v Windows 32-bit:(Windows.INIT_HEAP_CONTAINER)
v Windows 64-bit: (Windows-64.INIT_HEAP_CONTAINER)
v IBM iSeries OS/400:(OS400.INIT_HEAP_CONTAINER)
v IBM OS/390:(OS390.INIT_HEAP_CONTAINER)
tuning.properties Property:
[operatingsystem].INIT_HEAP_CONTAINER
Based on your operating system andarchitecture, the formulae are provided inthe following list:
v HP-UX 32-bit:
If memory allocated to the container nodeis greater than or equal to 3068 MB, itallocates 3068 MB. Else, if the memoryallocated to container node is lesser thanor equal to 512 MB, it allocates thememory assigned to the container node.
v HP-UX 64-bit:
if (MEMORY_CONTAINER >= 3068, 3068,if (MEMORY_CONTAINER <= 512, 512,MEMORY_CONTAINER))
v IBM AIX 32-bit:
if (MEMORY_CONTAINER >= 3068,MEMORY_CONTAINER, if(MEMORY_CONTAINER <= 512, 512,MEMORY_CONTAINER))
v IBM AIX 64-bit:
if (MEMORY_CONTAINER >= 3328,MEMORY_CONTAINER, if(MEMORY_CONTAINER <= 512, 512,MEMORY_CONTAINER))
v Sun Solaris 32-bit:
if (MEMORY_CONTAINER >= 3900, 3900,if (MEMORY_CONTAINER <= 512, 512,MEMORY_CONTAINER))
v Sun Solaris 64-bit:
if (MEMORY_CONTAINER >= 1536,MEMORY_CONTAINER, if(MEMORY_CONTAINER <= 1024, 1024,MEMORY_CONTAINER))
140 Sterling B2B Integrator: Performance Management

Field / Description
Tuning Formula or Default Value
(Default value is provided if there is notuning formula)
v Linux 32-bit:
(0.5 * Physical memory allocated tocontainer node)
v Linux 64-bit:
if (MEMORY_CONTAINER >= 2036,MEMORY_CONTAINER, if(MEMORY_CONTAINER <= 512, 512,MEMORY_CONTAINER))
v Windows 32-bit:
(0.5 * Physical memory allocated tocontainer node)
v Windows 64-bit:
if (MEMORY_CONTAINER >= 1536, 768,if (MEMORY_CONTAINER <= 512,MEMORY_CONTAINER, round(0.5 *MEMORY_CONTAINER)))
v IBM iSeries OS/400:
If memory allocated to the container nodeis greater than or equal to 2048 MB, itallocates 2048 MB. Else, if the memoryallocated to container node is lesser thanor equal to 512 MB, it allocates thememory assigned to the container node.
v IBM OS/390:
If memory allocated to the container nodeis greater than or equal to 2048 MB, itallocates 2048 MB. Else, if the memoryallocated to container node is lesser thanor equal to 512 MB, it allocates thememory assigned to the container node.
Performance Management 141

Field / Description
Tuning Formula or Default Value
(Default value is provided if there is notuning formula)
Maximum Heap Size (MB)
Controls the maximum size of a Java heapallocated to the container JVM.
Based on your operating system andarchitecture, the parameters are provided inthe following list:
v HP-UX 32-bit: (HP-UX.MAX_HEAP_CONTAINER)
v HP-UX 64-bit: (HP-UX-64.MAX_HEAP_CONTAINER)
v IBM AIX 32-bit:(AIX.MAX_HEAP_CONTAINER)
v IBM AIX 64-bit: (AIX-64.MAX_HEAP_CONTAINER)
v Sun Solaris 32-bit:(SunOS.MAX_HEAP_CONTAINER)
v Sun Solaris 64-bit: (SunOS-64.MAX_HEAP_CONTAINER)
v Linux 32-bit:(Linux.MAX_HEAP_CONTAINER)
v Linux 64-bit: (Linux-64.MAX_HEAP_CONTAINER)
v Windows 32-bit:(Windows.MAX_HEAP_CONTAINER)
v Windows 64-bit: (Windows-64.MAX_HEAP_CONTAINER)
v IBM iSeries OS/400:(OS400.MAX_HEAP_CONTAINER)
v IBM OS/390:(OS390.MAX_HEAP_CONTAINER)
tuning.properties Property:
[operatingsystem].MAX_HEAP_CONTAINER
Based on your operating system andarchitecture, the formulae are provided inthe following list:
v HP-UX 32-bit:
If memory allocated to the container nodeis greater than or equal to 3068 MB, itallocates 3068 MB. Else, if the memoryallocated to container node is lesser thanor equal to 512 MB, it allocates thememory assigned to the container node.
v HP-UX 64-bit:
if (MEMORY_CONTAINER >= 3068,MEMORY_CONTAINER, if(MEMORY_CONTAINER <= 512, 512,MEMORY_CONTAINER))
v IBM AIX 32-bit:
If memory allocated to the container nodeis greater than or equal to 3328 MB, itallocates 3328 MB. Else, if the memoryallocated to server node is lesser than orequal to 512 MB, it allocates the memoryassigned to the container node.
v IBM AIX 64-bit:
if (MEMORY_CONTAINER >= 3328,MEMORY_CONTAINER, if(MEMORY_CONTAINER <= 512, 512,MEMORY_CONTAINER))
v Sun Solaris 32-bit:
If memory allocated to the container nodeis greater than or equal to 3900 MB, itallocates 3900 MB. Else, if the memoryallocated to container node is lesser thanor equal to 512 MB, it allocates thememory assigned to the container node.
v Sun Solaris 64-bit:
if (MEMORY_CONTAINER >= 3900,MEMORY_CONTAINER, if(MEMORY_CONTAINER <= 512, 512,MEMORY_CONTAINER))
142 Sterling B2B Integrator: Performance Management

Field / Description
Tuning Formula or Default Value
(Default value is provided if there is notuning formula)
v Linux 32-bit:
If memory allocated to the container nodeis greater than or equal to 2036 MB, itallocates 2036 MB. Else, if the memoryallocated to container node is lesser thanor equal to 512 MB, it allocates thememory assigned to the container node.
v Linux 64-bit:
if (MEMORY_CONTAINER >= 2036,MEMORY_CONTAINER, if(MEMORY_CONTAINER <= 512, 512,MEMORY_CONTAINER))
v Windows 32-bit:
If memory allocated to the container nodeis greater than or equal to 1536 MB, itallocates 1536 MB. Else, if the memoryallocated to container node is lesser thanor equal to 512 MB, it allocates thememory assigned to the container node.
v Windows 64-bit:
if (MEMORY_CONTAINER >= 1536,MEMORY_CONTAINER, if(MEMORY_CONTAINER <= 512, 512,MEMORY_CONTAINER))
v IBM iSeries OS/400:
If memory allocated to the container nodeis greater than or equal to 2048 MB, itallocates 2048 MB. Else, if the memoryallocated to container node is lesser thanor equal to 512 MB, it allocates thememory assigned to the container node.
v IBM OS/390:
If memory allocated to the container nodeis greater than or equal to 2048 MB, itallocates 2048 MB. Else, if the memoryallocated to container node is lesser thanor equal to 512 MB, it allocates thememory assigned to the container node.
Performance Management 143

Field / Description
Tuning Formula or Default Value
(Default value is provided if there is notuning formula)
Initial Size of New (Nursery) Heap (MB)
Controls the initial size of the new heap areaallocated to the container JVM.
Based on your operating system andarchitecture, the parameters are provided inthe following list:
v HP-UX 32-bit: (HP-UX.INIT_AGE_CONTAINER)
v HP-UX64-bit: (HP-UX-64.INIT_AGE_CONTAINER)
v IBM AIX 32-bit:(AIX.INIT_AGE_CONTAINER)
v IBM AIX 64-bit: (AIX-64.INIT_AGE_CONTAINER)
v Sun Solaris 32-bit:(SunOS.INIT_AGE_CONTAINER)
v Sun Solaris 64-bit: (SunOS-64.INIT_AGE_CONTAINER)
v Linux 32-bit:(Linux.INIT_AGE_CONTAINER)
v Linux 64-bit: (Linux-64.INIT_AGE_CONTAINER)
v Windows 32-bit: (Windows.INIT_AGE_CONTAINER)
v Windows 64-bit: (Windows-64.INIT_AGE_CONTAINER)
v IBM iSeries OS/400:(OS400.INIT_AGE_CONTAINER)
v IBM OS/390(OS390.INIT_AGE_CONTAINER)
tuning.properties Property:
[operating system].INIT_AGE_CONTAINER
(0.33333 * Initial size of heap memoryallocated to the container node)
v HP 32-bit: HP-UX.INIT_AGE_CONTAINER=round(0.33333 * HP-UX.INIT_HEAP_CONTAINER)
v HP 64-bit: HP-UX-64.INIT_AGE_CONTAINER=round(0.33333 * HP-UX-64.INIT_HEAP_CONTAINER)
v AIX 32-bit: AIX.INIT_AGE_CONTAINER=round(0.33333 *AIX.INIT_HEAP_CONTAINER)
v AIX 64-bit: AIX-64.INIT_AGE_CONTAINER=round(0.33333 * AIX-64.INIT_HEAP_CONTAINER)
v Sun 32-bit:SunOS.INIT_AGE_CONTAINER=round(0.33333 *SunOS.INIT_HEAP_CONTAINER)
v Sun 64-bit: SunOS-64.INIT_AGE_CONTAINER=round(0.33333 * SunOS-64.INIT_HEAP_CONTAINER)
v Linux 32-bit:Linux.INIT_AGE_CONTAINER=round(0.33333 *Linux.INIT_HEAP_CONTAINER)
v Linux 64-bit: Linux-64.INIT_AGE_CONTAINER=round(0.33333 * Linux-64.INIT_HEAP_CONTAINER)
v Windows 32-bit:Windows.INIT_AGE_CONTAINER=round(0.33333 *Windows.INIT_HEAP_CONTAINER)
v Windows 64-bit: Windows-64.INIT_AGE_CONTAINER=round(0.33333 * Windows-64.INIT_HEAP_CONTAINER)
144 Sterling B2B Integrator: Performance Management

Field / Description
Tuning Formula or Default Value
(Default value is provided if there is notuning formula)
Maximum Size of New (Nursery) Heap(MB)
Controls the maximum size of the new heaparea allocated to the container JVM.
Based on your operating system andarchitecture the parameters are provided inthe following list:
v HP-UX 32-bit: (HP-UX.MAX_AGE_CONTAINER)
v HP-UX 64-bit: (HP-UX-64.MAX_AGE_CONTAINER)
v IBM AIX 32-bit:(AIX.MAX_AGE_CONTAINER)
v IBM AIX 64-bit: (AIX-64.MAX_AGE_CONTAINER)
v Sun Solaris 32-bit:(SunOS.MAX_AGE_CONTAINER)
v Sun Solaris 64-bit: (SunOS-64.MAX_AGE_CONTAINER)
v Linux 32-bit:(Linux.MAX_AGE_CONTAINER)
v Linux 64-bit: (Linux-64.MAX_AGE_CONTAINER)
v Windows 32-bit:(Windows.MAX_AGE_CONTAINER)
v Windows 64-bit: (Windows-64.MAX_AGE_CONTAINER)
v IBM iSeries OS/400:(OS400.MAX_AGE_CONTAINER)
v IBM OS/390:(OS390.MAX_AGE_CONTAINER)
tuning.properties Property:
[operating system].MAX_AGE_CONTAINER
(0.5 * Maximum size of heap memoryallocated to the container node)
v HP 32-bit: HP-UX.MAX_AGE_CONTAINER=round(0.33333 * HP-UX.MAX_HEAP_CONTAINER)
v HP 64-bit: HP-UX-64.MAX_AGE_CONTAINER=round(0.33333 * HP-UX-64.MAX_HEAP_CONTAINER)
v AIX 32-bit:AIX.MAX_AGE_CONTAINER=round(0.33333*AIX.MAX_HEAP_CONTAINER)
v AIX 64-bit: AIX-64.MAX_AGE_CONTAINER=round(0.33333* AIX-64.MAX_HEAP_CONTAINER)
v Sun 32-bit:SunOS.MAX_AGE_CONTAINER=round(0.33333 *SunOS.MAX_HEAP_CONTAINER)
v Sun 64-bit: SunOS-64.MAX_AGE_CONTAINER=round(0.33333 * SunOS-64.MAX_HEAP_CONTAINER)
v Linux 32-bit:Linux.MAX_AGE_CONTAINER=round(0.33333 *Linux.MAX_HEAP_CONTAINER)
v Linux 64-bit: Linux-64.MAX_AGE_CONTAINER=round(0.33333 * Linux-64.MAX_HEAP_CONTAINER)
v Windows 32-bit:Windows.MAX_AGE_CONTAINER=round(0.33333 *Windows.MAX_HEAP_CONTAINER)
v Windows 64-bit: Windows-64.MAX_AGE_CONTAINER=round(0.33333 * Windows-64.MAX_HEAP_CONTAINER)
Performance Management 145

Field / Description
Tuning Formula or Default Value
(Default value is provided if there is notuning formula)
Maximum Permanent Generation Size(MB)
Controls the maximum size of thepermanent generation heap (stores all theclass code and class-like data) allocated tothe container JVM.
Based on your operating system andarchitecture, the parameters are provided inthe following list:
v HP-UX 32-bit: (HP-UX.MAX_PERM_SIZE_CONTAINER)
v HP-UX 64-bit: (HP-UX-64.MAX_PERM_SIZE_CONTAINER)
v IBM AIX 32-bit:(AIX.MAX_PERM_SIZE_CONTAINER)
v IBM AIX 64-bit: (AIX-64.MAX_PERM_SIZE_CONTAINER)
v Sun Solaris 32-bit:(SunOS.MAX_PERM_SIZE_CONTAINER)
v Sun Solaris 64-bit: (SunOS-64.MAX_PERM_SIZE_CONTAINER)
v Linux 32-bit:(Linux.MAX_PERM_SIZE_CONTAINER)
v Linux 64-bit: (Linux-64.MAX_PERM_SIZE_CONTAINER)
v Windows 32-bit:(Windows.MAX_PERM_SIZE_CONTAINER)
v Windows 64-bit: (Windows-64.MAX_PERM_SIZE_CONTAINER)
v IBM iSeries OS/400:(OS400.MAX_PERM_SIZE_CONTAINER)
v IBM OS/390:(OS390.MAX_PERM_SIZE_CONTAINER)
tuning.properties Property:
[operatingsystem].MAX_PERM_SIZE_CONTAINER
Based on your operating system andarchitecture, Sterling B2B Integrator allocatesthe following values (in MB):
v HP-UX (32-bit and 64-bit): 192
v IBM AIX (32-bit and 64-bit): 128
v Sun Solaris (32-bit and 64-bit): 128
v Linux (32-bit and 64-bit): 128
v Windows (32-bit and 64-bit): 128
v IBM iSeries OS/400: 128
v IBM OS/390: 128
Thread Stack Size (KB)
Controls the maximum Java stack size forany thread.
tuning.properties Property:
[operatingsystem].STATIC_STACK_CONTAINER
Based on your operating system andarchitecture (in KB):
v HP-UX (32-bit and 64-bit): 384
v IBM AIX (32-bit and 64-bit): 256
v Sun Solaris (32-bit and 64-bit): 256
v Linux (32-bit and 64-bit): 256
v IBM iSeries OS/400 (32-bit and 64-bit): 256
v IBM OS/390 (32-bit and 64-bit): 256
v Windows (32-bit and 64-bit): 256
146 Sterling B2B Integrator: Performance Management

Field / Description
Tuning Formula or Default Value
(Default value is provided if there is notuning formula)
Enable Heap Dump on Out of Memory
Select True from the drop-down list if youwant to generate a heapdump when thecontainer JVM encounters an out of memoryerror.
Heapdumps are useful for troubleshootingmemory-related issues since they contain allthe live objects used by the Java application.With this information, the objects that areusing large amounts of memory can beidentified. The contents of a heapdump canalso help a user understand why objectscannot be freed by the Garbage Collector.
By default, the dump file is generated fromwhere the JVM was started (theinstall_dir/bin directory).
If you select False from the drop-down list,heapdumps are not generated when thecontainer JVM encounters an out of memoryerror.
tuning.properties Property:
ENABLE_HEAP_DUMP_OOB_CONTAINER
Default value: True
Enable Heap Dump on Sigquit/Ctrl-break
Note: This field is not supported in the 1.6version of the Sun JDK. It will display if youare using the IBM JDK.Select True from thedrop-down list if you want to request aheapdump for the container JVM usingSigquit command or pressing Ctrl+Breakfor container JVM.
By default, the dump file is generated fromwhere the JVM was started (theinstall_dir/bin directory).
If you select False from the drop-down list,heapdumps are not generated if you runSigquit command or press Ctrl+Break .
tuning.properties Property:
ENABLE_HEAP_DUMP_SGTQCRTLBRK_CONTAINER
Default value: True
Performance Management 147

Field / Description
Tuning Formula or Default Value
(Default value is provided if there is notuning formula)
Enable VerboseGC
Select True from the drop-down list if youwant to generate verbose garbage collectiondata for container JVM.
JVM Verbose garbage collection (GC)statistics are critical. It is recommended toenable verbose garbage collection when youare debugging your instance. These statisticscan be used to understand the behavior ofthe JVM heap management and theefficiency of the JVM.
If you select False from the drop-down list,verbose garbage collection will be disabled.
tuning.properties Property:
ENABLE_VERBOSE_GC_CONTAINER
Default value: False
JVM Arguments Prefix
Determines the arguments set as JVMparameters before other JVM flags are set forcontainer JVM.
Ensure that you enter correct values in thisfield. Else, the container JVM might fail tostart.
For example, -Xalwaysclassgc parameterenables dynamic class unloading on everyinstance of garbage collection.
tuning.properties Property:
JVM_ARGS_PREFIX_CONTAINER
Default value: BLANK
JVM Arguments Suffix
Determines the arguments set as JVMparameters after other JVM flags are set forcontainer JVM.
Ensure that you enter correct values in thisfield. Else, the container JVM might fail tostart.
For example, -Xlp parameter enables largepage support.
tuning.properties Property:
JVM_ARGS_SUFFIX_CONTAINER
Default value: BLANK
Click Next.8. In the BP Queue page that is displayed, decide whether you want to use the
current settings or the suggested settings.
148 Sterling B2B Integrator: Performance Management

v If yes, click Fill Suggested.v If no, enter information in the following fields:
Field / Description
Tuning Formula or Default Value
(Default value is provided if there is notuning formula)
Number of Processor Cores
Number of processor cores in the system,where each core is an independentprocessing engine.
tuning.properties Property:
PROCESSORS
Not Applicable
Desired Global Threads
Number of active business processes thatcan run concurrently. This field changes theJMS_LISTNERS property in thetuning.properties file in theinstall_dir/properties directory.
Typically, you require higher values withmore CPUs, and lower values with fewerCPUs. Too many threads cause thrashing, inwhich the hard disk is used a lot for virtualmemory, and performance slows down.
tuning.properties Property:
JMS_LISTNERS
JMS_LISTNERS = (PROCESSORS * 4)
In memory cache size (MB) for smallcontexts
Amount of memory allocated to the businessprocess queue. After Sterling B2B Integratorreaches this limit, it writes all the messages,except active messages, to disk. This fieldchanges the JMS_PAGING_HIGH propertyin the tuning.properties file in theinstall_dir/properties directory.
Increasing this value too much reduces theamount of memory available for the othercomponents of Sterling B2B Integrator, suchas caches and general processing.
tuning.properties Property:
NOAPP.JMS_PAGING_HIGH
NOAPP.JMS_PAGING_HIGH = 100
Performance Management 149

Field / Description
Tuning Formula or Default Value
(Default value is provided if there is notuning formula)
Disk cache size (MB) Maximum
Maximum amount of disk space used tostore the business process context when it isbeing moved from memory. This limitensures that Sterling B2B Integrator does notconsume all the available disk space. Thisfield changes the JMS_PAGING_MAXproperty in the tuning.properties file in theinstall_dir/properties directory.
tuning.properties Property:
NOAPP.JMS_PAGING_MAX
NOAPP.JMS_PAGING_MAX = round(2 *Maximum Java heap size allocated to theserver JVM)
Memory Cache Threshold (MB)
Amount of threshold memory size forcaching a context in the in-memory cacheversus the disk cache.
The distribution of context sizes tends tolook vaguely like an “M” with one cluster ofsmall contexts and another cluster of largercontexts. If this value is set large, the valuefor memory cache size should also be large.A moderate multiple of the disk block sizeseems to work very well in many cases.
tuning.properties Property:
BP_SIZE
Default value: 16384
Use Shadow Cache
Select True from the drop-down list if youwant to enable shadow cache.
It is used to retain business process objectsin the memory as long as JVM permits.When the thread is available for the businessprocess to run, the object is retrieved fromthe memory instead of the disk.
Use Shadow Cache plays an important roleduring load balancing in a clusterenvironment. It uses soft reference forcaching workflow context objects.
If you select False from the drop-down list,shadow cache will be disabled and spacewill not be allocated to retain businessprocess objects in the memory.
tuning.properties Property:
USE_SHADOW_CACHE
Default value: True
150 Sterling B2B Integrator: Performance Management

Field / Description
Tuning Formula or Default Value
(Default value is provided if there is notuning formula)
Shadow Cache Size (MB) Maximum
Amount of soft reference in memory toretain business process objects in thememory as long as JVM permits. When thethread is available for the business processto run, the object is retrieved from thememory instead of the disk.
You can set maximum shadow cache size,but it is used only if you enable shadowcache.
tuning.properties Property:
MAX_SHADOW_CACHE_SIZE
Default value: 1
Distribution Cache Maximum
Determines the maximum number ofbusiness processes in queue on node2. If thenumber of business processes on node2queue exceeds this number, node1 will nottransfer any more business processes tonode2.
tuning.properties Property:
DISTRIBUTION_CACHE_MAX
Default value: 5000
Distribution Cache Minimum
Determines the number of businessprocesses that must be in queue before thisnode will make any processes eligible fordistribution.
tuning.properties Property:
DISTRIBUTION_CACHE_MIN
DISTRIBUTION_CACHE_MIN =(PROCESSORS * 4)
Performance Management 151

Field / Description
Tuning Formula or Default Value
(Default value is provided if there is notuning formula)
Broadcast Interval (ms)
Determines how often (in milleseconds) amulticast message is sent out by a nodeabout the current state of the node.
The multicast message provides load factorand current status information about a nodeto all other nodes in the cluster.
Clustering uses the JGroups communicationtoolkit, which supports the followingcommunication protocols, which can beconfigured during deployment:
v UDP (User Datagram Protocol) (IPmulticast)
v TCP
tuning.properties Property:
MULTICAST_INTERVAL
Default value: 6000
Switch Interval (ms)
Determines the time interval (inmilliseconds) that a business process mustbe queued after distribution to a node beforethe business process is eligible fordistribution to another node again.
This is for load balancing in a clusterenvironment.
tuning.properties Property:
SWITCH_INTERVAL
Default value: 180000
152 Sterling B2B Integrator: Performance Management
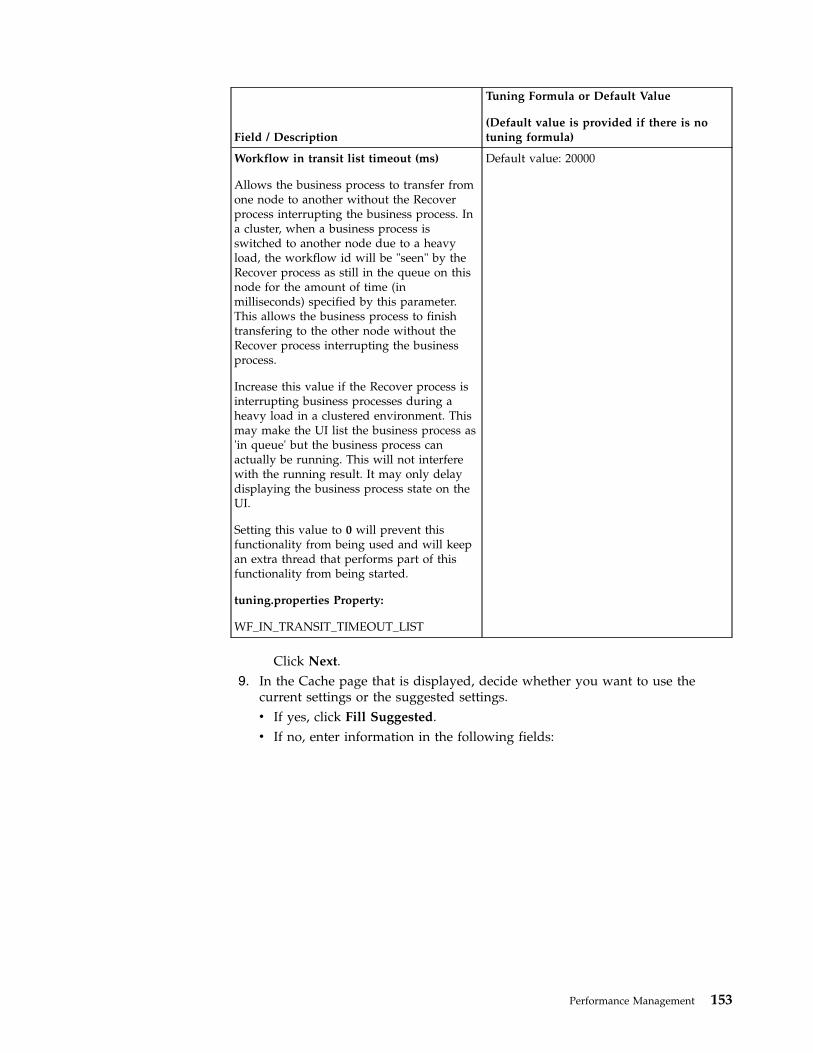
Field / Description
Tuning Formula or Default Value
(Default value is provided if there is notuning formula)
Workflow in transit list timeout (ms)
Allows the business process to transfer fromone node to another without the Recoverprocess interrupting the business process. Ina cluster, when a business process isswitched to another node due to a heavyload, the workflow id will be "seen" by theRecover process as still in the queue on thisnode for the amount of time (inmilliseconds) specified by this parameter.This allows the business process to finishtransfering to the other node without theRecover process interrupting the businessprocess.
Increase this value if the Recover process isinterrupting business processes during aheavy load in a clustered environment. Thismay make the UI list the business process as'in queue' but the business process canactually be running. This will not interferewith the running result. It may only delaydisplaying the business process state on theUI.
Setting this value to 0 will prevent thisfunctionality from being used and will keepan extra thread that performs part of thisfunctionality from being started.
tuning.properties Property:
WF_IN_TRANSIT_TIMEOUT_LIST
Default value: 20000
Click Next.9. In the Cache page that is displayed, decide whether you want to use the
current settings or the suggested settings.v If yes, click Fill Suggested.v If no, enter information in the following fields:
Performance Management 153

Field / Description
Tuning Formula or Default Value
(Default value is provided if there is notuning formula)
Translation Maps
The number of translation maps that canexist in the cache. This field changes theMAP_CACHE property in thetuning.properties file in theinstall_dir/properties directory.Note: Increasing the cache size for itemsthat are not used frequently may degradeperformance. Increase the cache size foritems that are used frequently to improveperformance.
tuning.properties Property:
MAP_CACHE
If memory allocated to the server node islesser than or equal to 768 MB, 10translation maps can exist in the cache. Else,if the memory allocated to server node islesser than or equal to 1024 MB but greaterthan 768 MB, 50 translation maps can existin the cache. If the memory allocated to theserver node is greater than 1024 MB, then100 translation maps can exist in the cache.
Envelopes
The number of envelopes that can exist inthe cache. This field changes theENVELOPE_CACHE property in thetuning.properties file in theinstall_dir/properties directory.Note: Increasing the cache size for itemsthat are not used frequently may degradeperformance. Increase the cache sizes foritems that are used frequently in order toimprove performance.
tuning.properties Property:
ENVELOPE_CACHE
If memory allocated to the server node islesser than or equal to 768 MB, 50 envelopescan exist in the cache. Else, if the memoryallocated to server node is lesser than orequal to 1024 MB but greater than 768 MB,250 envelopes can exist in the cache. If thememory allocated to the server node isgreater than 1024 MB, then 500 envelopescan exist in the cache.
Other EDI
The number of EDI objects that can exist inthe cache. This field changes theEDI_CACHE property in thetuning.properties file in theinstall_dir/properties directory.Note: Increasing the cache size for itemsthat are not used frequently may degradeperformance. Increase the cache sizes foritems that are used frequently to improveperformance.
tuning.properties Property:
EDI_CACHE
If memory allocated to the server node islesser than or equal to 768 MB, 25 EDIobjects can exist in the cache. Else, if thememory allocated to server node is lesserthan or equal to 1024 MB but greater than768 MB, 50 EDI objects can exist in thecache. If the memory allocated to the servernode is greater than 1024 MB, then 100 EDIobjects can exist in the cache.
154 Sterling B2B Integrator: Performance Management
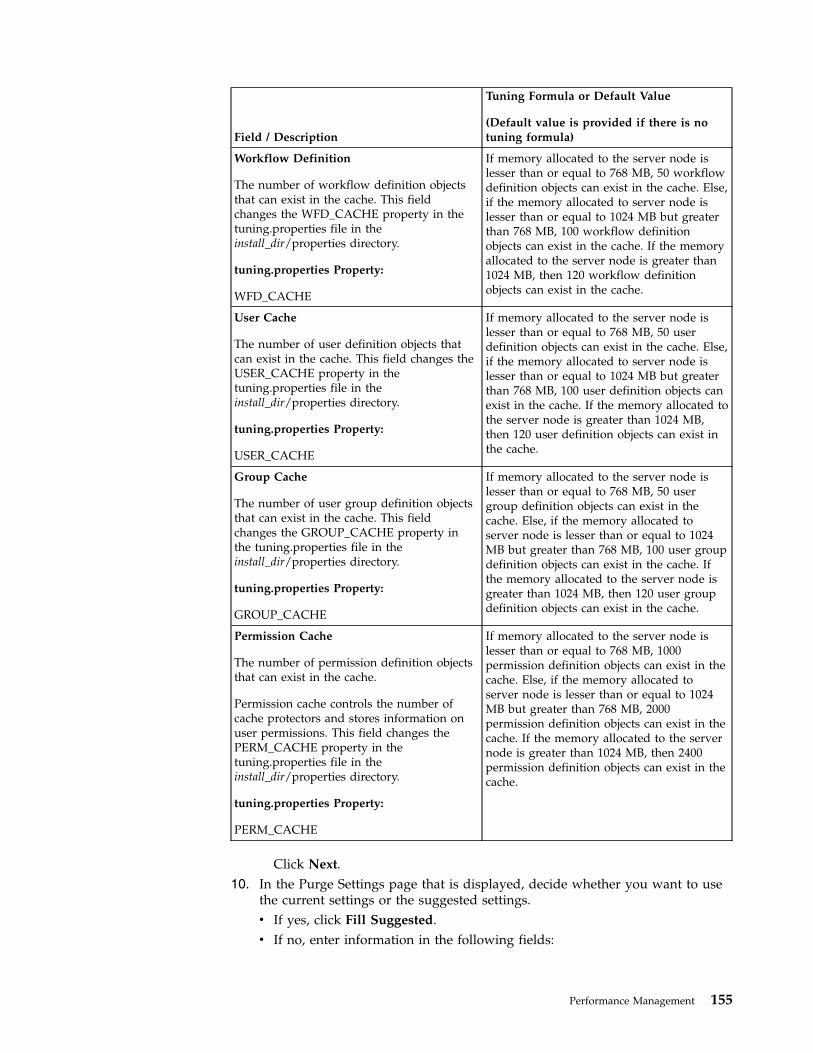
Field / Description
Tuning Formula or Default Value
(Default value is provided if there is notuning formula)
Workflow Definition
The number of workflow definition objectsthat can exist in the cache. This fieldchanges the WFD_CACHE property in thetuning.properties file in theinstall_dir/properties directory.
tuning.properties Property:
WFD_CACHE
If memory allocated to the server node islesser than or equal to 768 MB, 50 workflowdefinition objects can exist in the cache. Else,if the memory allocated to server node islesser than or equal to 1024 MB but greaterthan 768 MB, 100 workflow definitionobjects can exist in the cache. If the memoryallocated to the server node is greater than1024 MB, then 120 workflow definitionobjects can exist in the cache.
User Cache
The number of user definition objects thatcan exist in the cache. This field changes theUSER_CACHE property in thetuning.properties file in theinstall_dir/properties directory.
tuning.properties Property:
USER_CACHE
If memory allocated to the server node islesser than or equal to 768 MB, 50 userdefinition objects can exist in the cache. Else,if the memory allocated to server node islesser than or equal to 1024 MB but greaterthan 768 MB, 100 user definition objects canexist in the cache. If the memory allocated tothe server node is greater than 1024 MB,then 120 user definition objects can exist inthe cache.
Group Cache
The number of user group definition objectsthat can exist in the cache. This fieldchanges the GROUP_CACHE property inthe tuning.properties file in theinstall_dir/properties directory.
tuning.properties Property:
GROUP_CACHE
If memory allocated to the server node islesser than or equal to 768 MB, 50 usergroup definition objects can exist in thecache. Else, if the memory allocated toserver node is lesser than or equal to 1024MB but greater than 768 MB, 100 user groupdefinition objects can exist in the cache. Ifthe memory allocated to the server node isgreater than 1024 MB, then 120 user groupdefinition objects can exist in the cache.
Permission Cache
The number of permission definition objectsthat can exist in the cache.
Permission cache controls the number ofcache protectors and stores information onuser permissions. This field changes thePERM_CACHE property in thetuning.properties file in theinstall_dir/properties directory.
tuning.properties Property:
PERM_CACHE
If memory allocated to the server node islesser than or equal to 768 MB, 1000permission definition objects can exist in thecache. Else, if the memory allocated toserver node is lesser than or equal to 1024MB but greater than 768 MB, 2000permission definition objects can exist in thecache. If the memory allocated to the servernode is greater than 1024 MB, then 2400permission definition objects can exist in thecache.
Click Next.10. In the Purge Settings page that is displayed, decide whether you want to use
the current settings or the suggested settings.v If yes, click Fill Suggested.v If no, enter information in the following fields:
Performance Management 155

Field / Description
Tuning Formula or Default Value
(Default value is provided if there is notuning formula)
Number Of Purge Deadlock Retries
Controls the number of repeated attempts tostart the purge process before aborting.
tuning.properties Property:
PURGE.DEADLOCK_RETRIES
Default value: 30
Maximum Purge Threads
Controls the maximum number of threadsthat can be allocated to the purge process.
tuning.properties Property:
PURGE.MAX_PURGE_THREADS
Default value: 1
Purge Documents on Disk
Select True from the drop-down list to purgethe documents on file system disk space,along with database disk space.
It is recommended to purge documents onthe disk, else the disk space may get filledup.
For more information about purging, refer toPurge Service documentation.
If you select False from the drop-down list,the documents are purged only in thedatabase disk space.
tuning.properties Property:
PURGE.PURGE_DOCS_ON_DISK
Default value: True
Click Next.11.
In the Database Connection Pool page that is displayed, decide whether youwant to use the current settings or the suggested settings.
Note: Sterling B2B Integrator restart is not required if you modify settings inthis page.v If yes, click Fill Suggested.v If no, enter information in the following fields and click Next.
Transactional pool connections are used by the workflow engine to managedatabase operations during a workflow step. Commands issued to atransactional connection are not committed to the database until the end ofthe workflow step, allowing rollback if the workflow step fails.Non-transactional pool connections are used when rollback is not required.
156 Sterling B2B Integrator: Performance Management
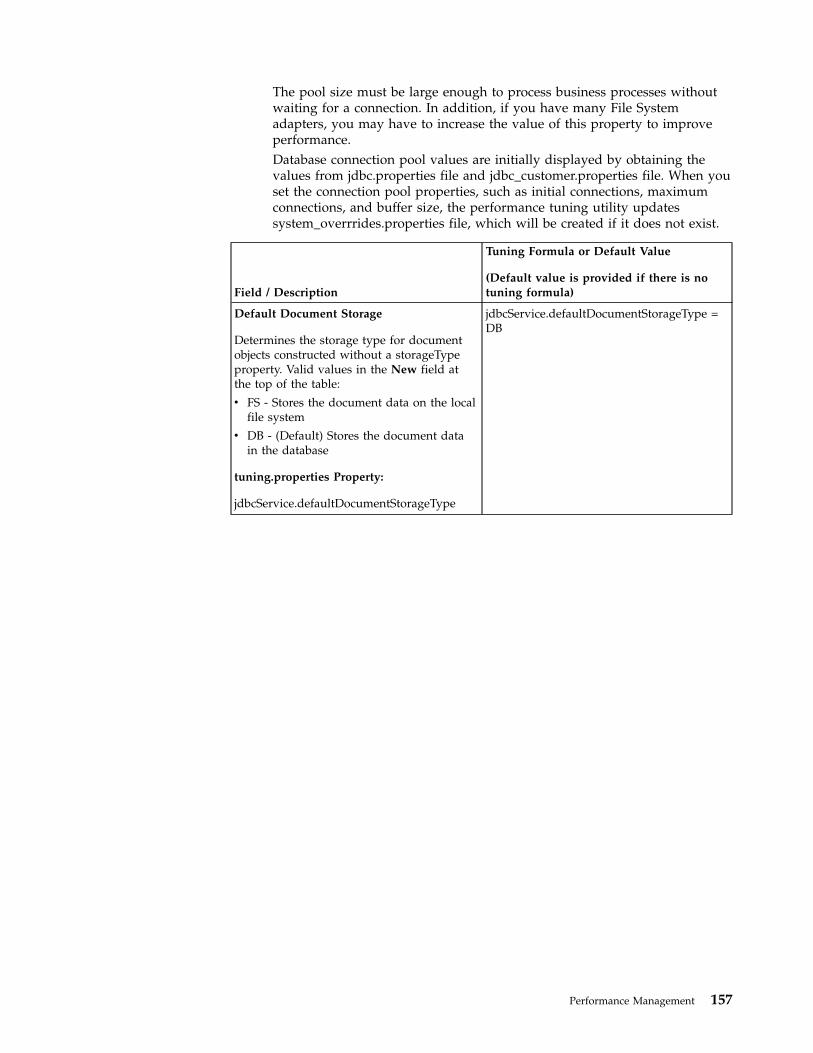
The pool size must be large enough to process business processes withoutwaiting for a connection. In addition, if you have many File Systemadapters, you may have to increase the value of this property to improveperformance.Database connection pool values are initially displayed by obtaining thevalues from jdbc.properties file and jdbc_customer.properties file. When youset the connection pool properties, such as initial connections, maximumconnections, and buffer size, the performance tuning utility updatessystem_overrrides.properties file, which will be created if it does not exist.
Field / Description
Tuning Formula or Default Value
(Default value is provided if there is notuning formula)
Default Document Storage
Determines the storage type for documentobjects constructed without a storageTypeproperty. Valid values in the New field atthe top of the table:
v FS - Stores the document data on the localfile system
v DB - (Default) Stores the document datain the database
tuning.properties Property:
jdbcService.defaultDocumentStorageType
jdbcService.defaultDocumentStorageType =DB
Performance Management 157

Field / Description
Tuning Formula or Default Value
(Default value is provided if there is notuning formula)
Connection Pool Name
Determines the database connection poolname. A database connection pool is createdto manage multiple connections where eachconnection connects to the same database.
You can create custom connection poolsapart from those present in Sterling B2BIntegrator. If you create your own customconnection pools, you should add theconnection pool name in language propertiesfile.
The following connection pool types can becreated:
v UI
v Archive
v Default
v Select
v Non-transactional - Number ofconnections that are reserved andavailable for general data requests (forexample, retrieving data) when SterlingB2B Integrator starts. If Sterling B2BIntegrator uses all the connectionsconcurrently, it creates a new connectionuntil it reaches the maximum number ofconnections. When Sterling B2B Integratorreaches the value specified in this field, itmust wait for a connection to be returnedto the pool before processing the datarequest.
When a connection is no longer in use,the connection is returned to the availableconnection pool and can be reused.
v Local
Not applicable
158 Sterling B2B Integrator: Performance Management

Field / Description
Tuning Formula or Default Value
(Default value is provided if there is notuning formula)
Initial Connections
Determines the initial number of connectionsto be reserved in the database connectionpool.
Based on the connection pool, theparameters are provided in the followinglist:
v Local: (jdbcService.dbPool_local.initsize)
v Select: (jdbcService.dbPool_Select.initsize)
v Non-transactional:(jdbcService.dbPool_NoTrans.initsize)
v Default: (jdbcService.dbPool.initsize)
v Archive:jdbcService.dbArchivePool.initsize)
v UI: (jdbcService.dbUIPool.initsize)
Depending on the database, replace the dbwith the database name. For example, if youare using Oracle as your database, enteroracle. Default values are provided in thefollowing list:
v Local: jdbcService.dbPool_local.initsize = 1
v Select: jdbcService.dbPool_Select.initsize =0
v Non-transactional:jdbcService.dbPool_NoTrans.initsize = 1
v Default: jdbcService.dbPool.initsize = 1
v Archive: jdbcService.dbArchivePool.initsize= 1
v UI: jdbcService.dbUIPool.initsize = 4
Maximum Connections
Determines the maximum number ofconnections to be reserved in the databaseconnection pool.
Based on the connection pool, theparameters are provided in the followinglist:
v Local: (jdbcService.dbPool_local.maxsize)
v Select: (jdbcService.dbPool_Select.maxsize)
v Non-transactional:(jdbcService.dbPool_NoTrans.maxsize)
v Default: (jdbcService.dbPool.maxsize)
v Archive:(jdbcService.dbArchivePool.maxsize)
v UI: (jdbcService.dbUIPool.maxsize)
Depending on the database, replace the dbwith the database name. For example, if youare using Oracle as your database, enteroracle. Default values are provided in thefollowing list:
v Local: jdbcService.dbPool_local.maxsize =30
v Select: jdbcService.dbPool_Select.maxsize =20
v Non-transactional:jdbcService.dbPool_NoTrans.maxsize = 30
v Default: jdbcService.dbPool.maxsize = 30
v Archive:jdbcService.dbArchivePool.maxsize = 20
v UI: jdbcService.dbUIPool.maxsize = 20
Performance Management 159
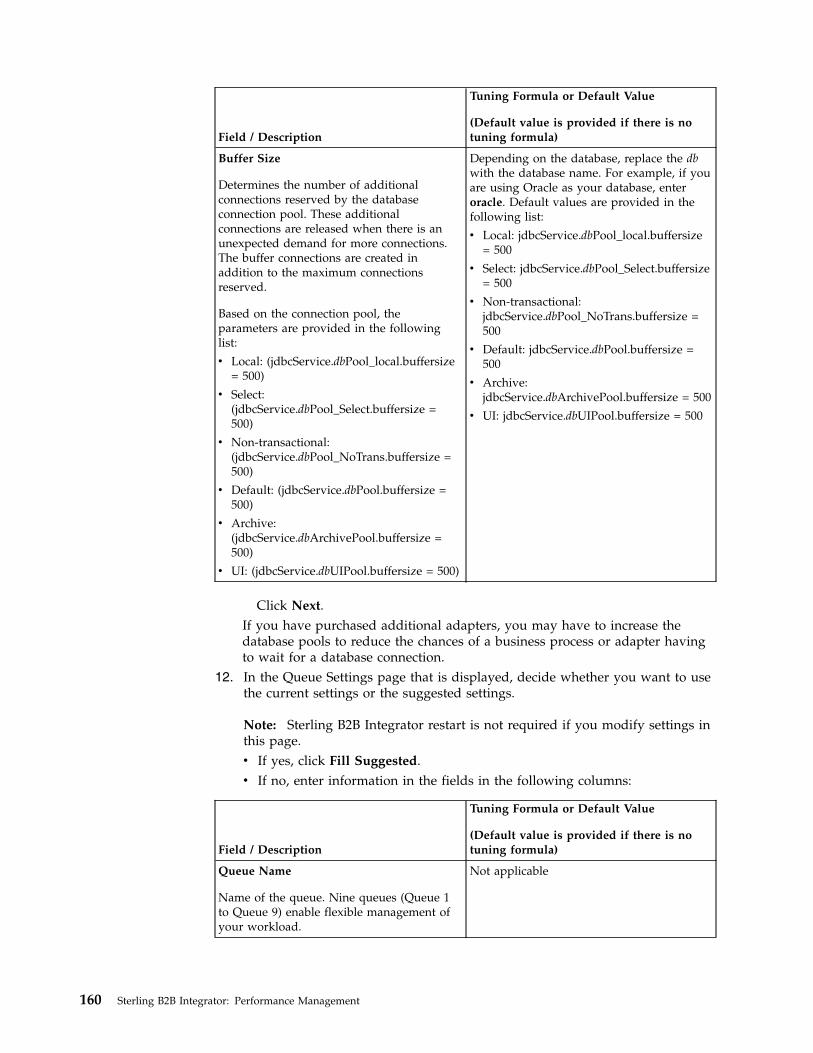
Field / Description
Tuning Formula or Default Value
(Default value is provided if there is notuning formula)
Buffer Size
Determines the number of additionalconnections reserved by the databaseconnection pool. These additionalconnections are released when there is anunexpected demand for more connections.The buffer connections are created inaddition to the maximum connectionsreserved.
Based on the connection pool, theparameters are provided in the followinglist:
v Local: (jdbcService.dbPool_local.buffersize= 500)
v Select:(jdbcService.dbPool_Select.buffersize =500)
v Non-transactional:(jdbcService.dbPool_NoTrans.buffersize =500)
v Default: (jdbcService.dbPool.buffersize =500)
v Archive:(jdbcService.dbArchivePool.buffersize =500)
v UI: (jdbcService.dbUIPool.buffersize = 500)
Depending on the database, replace the dbwith the database name. For example, if youare using Oracle as your database, enteroracle. Default values are provided in thefollowing list:
v Local: jdbcService.dbPool_local.buffersize= 500
v Select: jdbcService.dbPool_Select.buffersize= 500
v Non-transactional:jdbcService.dbPool_NoTrans.buffersize =500
v Default: jdbcService.dbPool.buffersize =500
v Archive:jdbcService.dbArchivePool.buffersize = 500
v UI: jdbcService.dbUIPool.buffersize = 500
Click Next.If you have purchased additional adapters, you may have to increase thedatabase pools to reduce the chances of a business process or adapter havingto wait for a database connection.
12. In the Queue Settings page that is displayed, decide whether you want to usethe current settings or the suggested settings.
Note: Sterling B2B Integrator restart is not required if you modify settings inthis page.v If yes, click Fill Suggested.v If no, enter information in the fields in the following columns:
Field / Description
Tuning Formula or Default Value
(Default value is provided if there is notuning formula)
Queue Name
Name of the queue. Nine queues (Queue 1to Queue 9) enable flexible management ofyour workload.
Not applicable
160 Sterling B2B Integrator: Performance Management
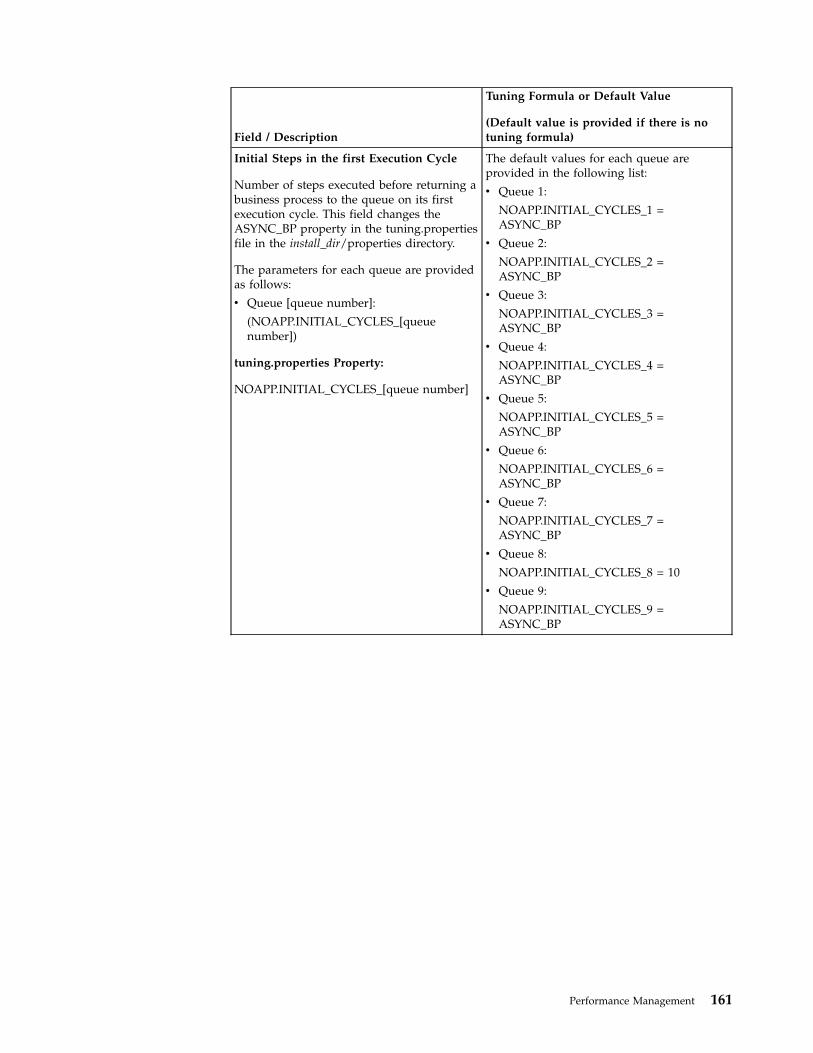
Field / Description
Tuning Formula or Default Value
(Default value is provided if there is notuning formula)
Initial Steps in the first Execution Cycle
Number of steps executed before returning abusiness process to the queue on its firstexecution cycle. This field changes theASYNC_BP property in the tuning.propertiesfile in the install_dir/properties directory.
The parameters for each queue are providedas follows:
v Queue [queue number]:
(NOAPP.INITIAL_CYCLES_[queuenumber])
tuning.properties Property:
NOAPP.INITIAL_CYCLES_[queue number]
The default values for each queue areprovided in the following list:
v Queue 1:
NOAPP.INITIAL_CYCLES_1 =ASYNC_BP
v Queue 2:
NOAPP.INITIAL_CYCLES_2 =ASYNC_BP
v Queue 3:
NOAPP.INITIAL_CYCLES_3 =ASYNC_BP
v Queue 4:
NOAPP.INITIAL_CYCLES_4 =ASYNC_BP
v Queue 5:
NOAPP.INITIAL_CYCLES_5 =ASYNC_BP
v Queue 6:
NOAPP.INITIAL_CYCLES_6 =ASYNC_BP
v Queue 7:
NOAPP.INITIAL_CYCLES_7 =ASYNC_BP
v Queue 8:
NOAPP.INITIAL_CYCLES_8 = 10
v Queue 9:
NOAPP.INITIAL_CYCLES_9 =ASYNC_BP
Performance Management 161

Field / Description
Tuning Formula or Default Value
(Default value is provided if there is notuning formula)
Number of Steps in the Execution Cycle
Number of business process steps that arerun before returning to the queue. This fieldchanges the BP_STEPS property in thetuning.properties file in theinstall_dir/properties directory.
If your business processes contain loops, youmay have to increase this property toimprove performance. If you find that youhave to increase this number, you muststreamline your business processes toremove unnecessary loops.
If you set this value too low, your businessprocesses may not be able to completeprocessing before they are returned to thequeue, allowing another business process tocomplete some or all of its processing. Thisslows processing time and causesbottlenecks in Sterling B2B Integrator.
The parameters for each queue are providedas follows:
v Queue [queue number]:
(NOAPP.EXEC_CYCLE_[queue number])
tuning.properties Property:
NOAPP.EXEC_CYCLE_[queue number]
The default values for each queue areprovided in the following list:
v Queue 1:
NOAPP.EXEC_CYCLE_1 = 1000
v Queue 2:
NOAPP.EXEC_CYCLE_2 = 100
v Queue 3:
NOAPP.EXEC_CYCLE_3 = 100
v Queue 4:
NOAPP.EXEC_CYCLE_4 = BP_STEPS
v Queue 5:
NOAPP.EXEC_CYCLE_5 = BP_STEPS
v Queue 6:
NOAPP.EXEC_CYCLE_6 = 10
v Queue 7:
NOAPP.EXEC_CYCLE_7 = 5
v Queue 8:
NOAPP.EXEC_CYCLE_8 = 2
v Queue 9:
NOAPP.EXEC_CYCLE_9 = 50
162 Sterling B2B Integrator: Performance Management
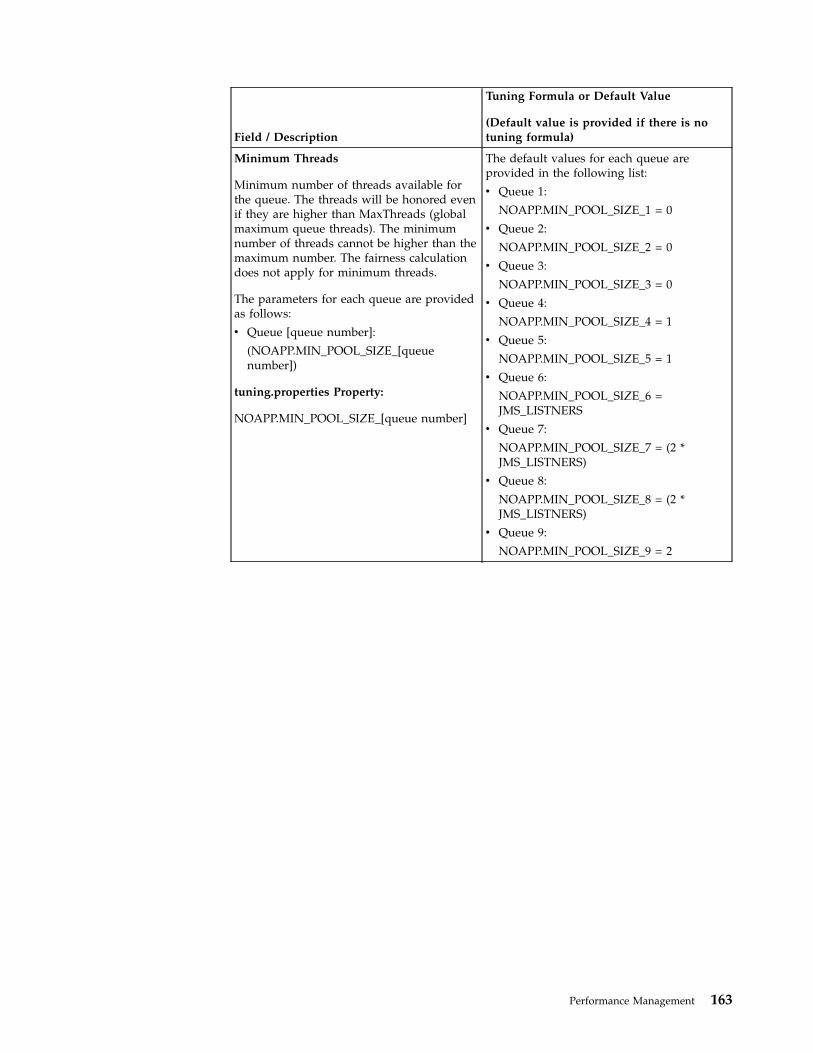
Field / Description
Tuning Formula or Default Value
(Default value is provided if there is notuning formula)
Minimum Threads
Minimum number of threads available forthe queue. The threads will be honored evenif they are higher than MaxThreads (globalmaximum queue threads). The minimumnumber of threads cannot be higher than themaximum number. The fairness calculationdoes not apply for minimum threads.
The parameters for each queue are providedas follows:
v Queue [queue number]:
(NOAPP.MIN_POOL_SIZE_[queuenumber])
tuning.properties Property:
NOAPP.MIN_POOL_SIZE_[queue number]
The default values for each queue areprovided in the following list:
v Queue 1:
NOAPP.MIN_POOL_SIZE_1 = 0
v Queue 2:
NOAPP.MIN_POOL_SIZE_2 = 0
v Queue 3:
NOAPP.MIN_POOL_SIZE_3 = 0
v Queue 4:
NOAPP.MIN_POOL_SIZE_4 = 1
v Queue 5:
NOAPP.MIN_POOL_SIZE_5 = 1
v Queue 6:
NOAPP.MIN_POOL_SIZE_6 =JMS_LISTNERS
v Queue 7:
NOAPP.MIN_POOL_SIZE_7 = (2 *JMS_LISTNERS)
v Queue 8:
NOAPP.MIN_POOL_SIZE_8 = (2 *JMS_LISTNERS)
v Queue 9:
NOAPP.MIN_POOL_SIZE_9 = 2
Performance Management 163

Field / Description
Tuning Formula or Default Value
(Default value is provided if there is notuning formula)
Maximum Threads
Maximum number of threads available forthe queue.
The parameters for each queue are providedas follows:
v Queue [queue number]:
(NOAPP.MAX_POOL_SIZE_[queuenumber])
tuning.properties Property:
NOAPP.MAX_POOL_SIZE_[queue number]
The default values for each queue areprovided in the following list:
v Queue 1:
NOAPP.MAX_POOL_SIZE_1 = 1
v Queue 2:
NOAPP.MAX_POOL_SIZE_2 = (round(JMS_LISTNERS / 4) + 1)
v Queue 3:
NOAPP.MAX_POOL_SIZE_3 = (round(JMS_LISTNERS / 2) + 1)
v Queue 4:
NOAPP.MAX_POOL_SIZE_4 =JMS_LISTNERS
v Queue 5:
NOAPP.MAX_POOL_SIZE_5 = (2 *JMS_LISTNERS)
v Queue 6:
NOAPP.MAX_POOL_SIZE_6 =JMS_LISTNERS
v Queue 7:
NOAPP.MAX_POOL_SIZE_7 = (2 *JMS_LISTNERS)
v Queue 8:
NOAPP.MAX_POOL_SIZE_8 = (2 *JMS_LISTNERS)
v Queue 9:
NOAPP.MAX_POOL_SIZE_9 = 4
164 Sterling B2B Integrator: Performance Management

Field / Description
Tuning Formula or Default Value
(Default value is provided if there is notuning formula)
Resource Allocation
Amount of resources to allocate to a specificqueue for fair share scheduling. Forexample, if you have only two queuesconfigured, queue 1 for a few small businessprocesses, and queue 2 for many largebusiness processes, you can set the amountof resources available for each queue by apercentage. You can set queue 1 with aresource allocation of 10 and queue 2 with aresource allocation of 90. This ensures thatqueue 2 has more resources for processing,which in turn improves processing time andensures efficient use of system resources.This value can be different for each queue.Note: Set the resource allocations accordingto the percentage of use for each queue andthe importance of processing completed oneach queue. If you have higher priorityitems on one queue, increase the resourceallocation to that queue in order to increaseprocessing capability. Apply a lowerpercentage of resources to lower priorityqueues or less used queues in order to keepresources free for higher priority processing.
The parameters for each queue are providedas follows:
v Queue [queue number]:
(NOAPP.RESOURCE_ALLOCATION_[queue number])
tuning.properties Property:
NOAPP.RESOURCE_ALLOCATION_[queuenumber]
The default values for each queue areprovided in the following list:
v Queue 1:
NOAPP.RESOURCE_ALLOCATION_1 =10
v Queue 2:
NOAPP.RESOURCE_ALLOCATION_2 =20
v Queue 3:
NOAPP.RESOURCE_ALLOCATION_3 =40
v Queue 4:
NOAPP.RESOURCE_ALLOCATION_4 =50
v Queue 5:
NOAPP.RESOURCE_ALLOCATION_5 =50
v Queue 6:
NOAPP.RESOURCE_ALLOCATION_6 =60
v Queue 7:
NOAPP.RESOURCE_ALLOCATION_7 =90
v Queue 8:
N OAPP.RESOURCE_ALLOCATION_8 =120
v Queue 9:
NOAPP.RESOURCE_ALLOCATION_9 =50
Click Next.13. In the Confirm page that is displayed, click View all settings to review the
changes you made to the performance configuration. The All Settings pop-upwindow is displayed.Click Close to close the All Settings pop-up window.The Confirm page displays both the properties modified, properties thatrequire restart and properties that do not require restart.
14.
In the Confirm page, perform one of the following tasks:v To change your performance configurations, click Back.v To abandon the performance configurations you carried out, click Cancel.v To save the performance configurations you carried out, click Finish.
15. From the Administration menu, select Operations > System >Troubleshooter.
Performance Management 165

16. From the System Troubleshooting page, click Soft Stop. This runs the softstopscript, allowing all active business processes to complete on a node beforestopping the system. The script is run through a series of interactive steps inthe UI. For more information about the softstop process, refer to “Completinga Soft Stop of Sterling B2B Integrator from the System Troubleshooter” onpage 111.
17. In the tuningFormulas.properties file, change the TUNING_PROPS_UPDATEDproperty to TRUE.
18. From the install_dir/bin directory, run one of the following commands:v (UNIX or Linux) setupfiles.shv (Windows) setupfiles.cmdThe performance configuration changes populate the initial setup files that areused during startup.
19. From the install_dir/bin directory, start Sterling B2B Integrator by running oneof the following commands:v (UNIX or Linux) run.shv (Windows) startWindowsService.cmdSterling B2B Integrator starts and the updated performance configurationsettings are applied.
Manual Performance TuningYou may find that you have to tune some application server-independent (ASI)properties that are not tuned into the Performance Tuning Utility. You canmanually tune these properties in the install_dir/properties/noapp.properties fileand related extension (*.ext) files in Sterling B2B Integrator.
This topic provides information about tuning your ASI environment, schedulingpolicies, tuning queues, and changing persistence levels. It also providesinformation about concepts such as customizing property files, changing systemlogging, enabling trusted domains for schemas, managing system recovery, andoptimizing system performance for Sterling e-Invoicing.
Note: For large volume operations pertaining to FTP, Mail Box, Advanced FileTransfer, and IBM Sterling File Gateway, set the number of open file descriptors toat least 4096, using the command ulimit -n 4096.
Tuning Your ASI EnvironmentYou can tune your application server-independent (ASI) system using theproperties found in the noapp.properties_platform_ifcresources_ext file, or in thenoapp.properties_gis_ext.in file (for the persistence_level property).
Properties that you may have to tune include:
SchedulingPolicyName
Set of rules that Sterling B2B Integrator uses to make decisions about how tomanage the workload. Valid values are:v BasicSchedulingPolicyv FairShareSchedulingPolicy
Note: For more information about scheduling policy, refer to the topic“Scheduling Policy” on page 172.
166 Sterling B2B Integrator: Performance Management
MemCacheSizeSize, in megabytes, of the in-memory cache used for small objects. This cachecan speed up execution by eliminating the necessity for data to be retrievedfrom the database or disk.
DiskCacheSizeMaximum size of the disk cache, so that your cache does not increase beyondyour available disk space.
DiskCachePathDirectory to use for caching objects.
MemCacheThresholdThreshold size, in bytes, for caching a context in the in-memory cache versusthe disk cache. In general, the distribution of context sizes tends to lookvaguely like an “M”, with one cluster of small contexts and another cluster oflarger contexts. If this value is large, the value of MemCacheSize should alsobe large. A moderate multiple of the disk block size seems to work well inmany cases.
MaxThreadsTotal number of concurrent threads that Sterling B2B Integrator is allowed touse. Verify this number against the licensed number of threads.
AE_ExecuteCycle.#
Number of steps for a business process to complete prior to returning to thequeue. Higher values will accelerate individual business process execution,while lower values enable smoother multitasking. Interactive use favors alower number of steps while batch processing favors a higher number of steps.This value can be different for each queue.
.# indicates the queue number.
AE_ExecuteCycleTime.#
Maximum time period, in milliseconds, for which a business process can use athread for, before releasing it for use by another business process. This valuewill override the value set for the AE_ExecuteCycle. This is intended to ensurethat a series of unusually slow steps do not tie up a thread completely. Thisvalue can be different for each queue.
.# indicates the queue number.
QueueDepth.#
Maximum number of business processes that can be in a queue at a giventime. Generally, this value should be left at the default value of 10,000, unlessyou anticipate having more that 10,000 business processes in the queue at thesame time. This value can be different for each queue.
.# indicates the queue number.
MaxPoolSize.#
Maximum number of threads executed for a specific queue. The MaxThreadsvalue overrides this value if this value is set higher than the MaxThreadsvalue. This value can be different for each queue.
.# indicates the queue number.
Note: Setting all the queues' MaxPoolSize parameters to the maximum threadsavailable does not mean that you will have faster processing. Depending onyour system resources, setting the MaxPoolSize value too high may cause the
Performance Management 167

queues to back up and degrade performance. A good place to start is 4 timesthe number of your CPUs. Interactive use tends to favor more threads, whilebatch or document processing tends to favor fewer threads.
CacheThreshold.#
Number of business processes that must be in the queue before any businessprocess is cached. In addition, this value is the minimum number of businessprocesses in the queue before any rescheduling occurs. This value can bedifferent for each queue.
.# indicates the queue number.
In general, setting this value high improves performance by keeping morebusiness process contexts in memory when they are placed in the queue. Toestimate the amount of memory that will be consumed, multiply this value bythe average size of your business process contexts. You can obtain the averagecontext size using the Sterling B2B Integrator System Troubleshooter. For moreinformation about reviewing system, refer to the topic Reviewing SystemInformation.
There is a tradeoff between performance and memory consumption. Settingthis value too high can result in one of the following:v Leave Sterling B2B Integrator with insufficient memory in some
circumstancesv Cause some business processes to remain in the queue for too long without
being examined for rescheduling
Note that in most cases, even if this value is set low, business process contextswill usually be recovered from one of the in-memory caches and not from thedisk.
MinPoolSize.#
Minimum number of threads reserved for a specific queue. The sum total ofthe queues' MinPoolSize values must be equal to or less than the MaxThreadsvalue. This value can be different for each queue.
.# indicates the queue number.
JavaPriority.#
Java priority of the threads running business processes. This enables you to setsome queues to run more slowly to reduce the issues associated with heavilyused computers being unresponsive to the user interface. This value can bedifferent for each queue. Not all JVMs handle this the same way, with somenot respecting it at all (particularly, the IBM AIX® JVM).
.# indicates the queue number.
EnableDeadlines.#
Enables or disables deadline support for a particular queue. Having deadlinesenabled controls both notifications and the execution order in the queue. Ifenabled, business processes with deadlines are executed before those withoutdeadlines. Valid values are:v false – Disables deadline support for a queue.v true – Enables deadline support for a queue.
This value can be different for each queue.
.# indicates the queue number.
168 Sterling B2B Integrator: Performance Management

Rescheduling.#
Enables or disables rescheduling support for a queue. Valid values are:v false – Business processes are not rescheduled in a queue.v true – Business processes are rescheduled in a queue.
This value can be different for each queue.
.# indicates the queue number.
ReschedulingInterval.#
Time interval, in milliseconds, to wait before the rescheduler passes throughthe queue to reschedule business processes. This value can be different for eachqueue.
.# indicates the queue number.
MaxWaitTime.#
Maximum time, in milliseconds, for which a business process can be in thequeue without it being reviewed for rescheduling. If a business process isrescheduled, the business process is moved forward in the queue. This valuecan be different for each queue.
.# indicates the queue number.
Example: MaxWaitTime.8=60000 sets the maximum wait time for queuenumber 8 as 60 seconds.
ResourceAllocation.#
Amount of resources to allocate to a specific queue for fair share scheduling.For example, if you have only two queues configured, queue 1 for a few smallbusiness processes, and queue 2 for many large business processes, you can setthe amount of resources available for each queue by a percentage. You can setqueue 1 with a resource allocation of 10 and queue 2 with a resource allocationof 90. This ensures that queue 2 has more resources for processing, which inturn improves processing time and ensures efficient use of system resources.This value can be different for each queue.
Note: Set the resource allocations according to the percentage of use for eachqueue and the importance of processing completed on each queue. If you havehigher priority items on one queue, increase the resource allocation to thatqueue in order to increase processing capability. Apply a lower percentage ofresources to lower priority queues or less used queues in order to keepresources free for higher priority processing.
.# indicates the queue number.
InitialCycles.#
Number of cycles to be executed the first time a business process gets toexecute. Normally, this value should be 5 or less. This is intended to facilitatebusiness processes (particularly Web services) for which normal processing isquite short, but for which there is longer processing in special cases. It alsoallows a mix of short and long business processes in a queue, favoring theshorter ones. This value can be different for each queue.
.# indicates the queue number.
StealThreads.#
Enables or disables the ability to steal threads from other queues. Valid values:
Performance Management 169

v true – Enables the ability to steal threads.v false – Disables the ability to steal threads.
Queues that are configured to steal threads from other queues (StealThreadsproperty set to true) steal only from queues that have the AllowStealingproperty set to true. This value can be different for each queue.
.# indicates the queue number.
AllowStealing.#
Enables or disables the ability of other queues to steal threads from this queue.Valid values:v true – Allows other queues to steal threads.v false – Does not allow other queues to steal threads.
Queues that are configured to steal threads from other queues (StealThreadsproperty set to true) only steal from queues that have the AllowStealingproperty set to true. This value can be different for each queue.
.# indicates the queue number.
persistence_level
Persistence (storage to the database) level for Sterling B2B Integrator. Set thepersistence_level value to PERSISTENCE_NONE during day-to-day processing.
Valid values are:v PERSISTENCE_DEFAULTv PERSISTENCE_FULL – From user interface tracking, every step will be
persisted in full, which includes all the documents, status report (if any),and instance data.
v PERSISTENCE_MINIMAL/PERSISTENCE_STEP_STATUS – From userinterface tracking, every step will be persisted, but the document, statusreport (if any), and instance data will not be persisted in some of the steps(for example, assign and sleepservice). Most of the services that createdocuments will be persisted in full.
v PERSISTENCE_NONE/PERSISTENCE_BP_START_STOP – From userinterface tracking, the first step and last step will be persisted in full. Someof the services will not be persisted (for example, assign and sleepservice).Services that are defined as full will be persisted in full. Documents createdthrough a stream and stored in the file system will be persisted.
Note: If you have configured a business process with INVOKE_MODE setto SYNC, which in turn invokes business processes with INVOKE_MODEset to INLINE and the persistence_level set to BP Start Stop Engine MayOverride, the business processes may fail. To counter the business processfailure, follow one of these workarounds:– Change the INVOKE_MODE of the second business process from INLINE
to SYNC.– Add a dummy <assign> statement after the </operation> statement as
shown:<process name = "Call_BP_withError.kj"><sequence name="Sequence Start"><operation name="Invoke Sub-Process"><participant name="InvokeSubProcessService"/><outputmessage="InvokeSubProcessServiceTypeInputMessage"><assign to="INVOKE_MODE">INLINE</assign>
170 Sterling B2B Integrator: Performance Management

<assignto="WFD_NAME">Called_BP_withError.kj</assign><assign to="." from="*"></assign></output><input message="inmsg"><assign to="." from="*"></assign></input></operation><assign to="." from="*"></assign></sequence></process>
– Change the PERSISTENCE_LEVEL of the second business process fromNONE (BP Start Stop - Engine May Override) to FULL.
v PERSISTENCE_OVERRIDE_MINIMAL/PERSISTENCE_STEP_STATUS_ONLY – The first step will be persisted infull. The last step will be persisted minimally. Documents created through astream and stored in the file system will be persisted.
v PERSISTENCE_OVERRIDE_NONE – From user interface tracking, the firststep will be persisted in full and the last step will be persisted minimally.Some of the services will not be persisted (for example, assign andsleepservice). Services that are defined as full will not be persisted.Documents created through a stream and stored in the file system will bepersisted.
v PERSISTENCE_OVERRIDE_NONE_KEEP_ERRORS/PERSISTENCE_BP_START_STOP_ONLY – The first step will be persisted infull and the last step will be persisted minimally. Documents createdthrough a stream and stored in the file system will be persisted.
v PERSISTENCE_WF_NONE (can only be used with workflow definition insync mode) – From user interface tracking, nothing will be persisted. Thebusiness process runs in the caller's thread. If it is running in the SterlingB2B Integrator engine, and if the service is creating documents in thedocument stream, or if FS is document storage, the document will bepersisted. If it is running in an embedded engine, document stream and filesystem document storage is not allowed.
v PERSISTENCE_WF_ERROR_ONLY – From user interface tracking, nothingwill be persisted. Unless the service is performing document stream|FS asdocument storage, only the first step will be persisted, or, when the businessprocess generates errors, the first step (initial workflow context) and theerror step will be persisted. The error step will be persisted as minimal inorder to avoid the problem of resuming. If there is an onfault in the businessprocess and the business process generates errors, the first step (initialworkflow context), error step, and last step from the onfault will bepersisted. If the onfault block runs fine, or if the onfault block generateserrors too, the error step in onfault will be persisted minimally instead of thelast step in onfault. If a step is persisted, the first step's initial workflowcontext is always persisted in full.
Note: This property is set in the noapp.properties_gis_ext.in file. If thepersistence level property is a comment in the noapp.properties_gis_ext file(#persistence_level=value), the persistence level is the default value of full(PERSISTENCE_FULL).
Performance Management 171

Scheduling PolicyAbout this task
Sterling B2B Integrator uses scheduling policies to manage workload. A schedulingpolicy is a set of rules that Sterling B2B Integrator uses to determine how workloadis managed. Workload management decisions include, but are not limited to:v The number of threads to run at a given time.v The order in which to run the business processes.v The number of steps a business process should run before releasing the thread
for use by other business processes.v The caching requirements when a business process is returned to the queue.v The workload distribution, if you are working in a clustered environment.
Scheduling policy choices include:v Basic Scheduling Policy – Recommended for consistent workloads that do not
have data processing peaks or change in data or processing types.v Fair Share Scheduling Policy – Recommended for mixed workloads that include
both batch and online processing, and in environments that have data processingpeaks (Default). For more information about this policy, refer to the topicQueues in an Application Server Independent Environment.
Changing a Scheduling Policy
To change a scheduling policy in Sterling B2B Integrator:
Procedure1. Open the install_dir/properties/noapp.properties_platform_ifcresources_ext file
using a text editor.2. Locate the following code: # SCHEDULING POLICY CONFIGURATION3. Under # SCHEDULING POLICY CONFIGURATION, locate the following property:
SchedulingPolicyName=
4. Adjacent to the SchedulingPolicyName parameter, enter one of the followingcode samples, depending on your choice of either basic or fair-share schedulingpolicy. Next to the SchedulingPolicyName parameter, enter:v Basic scheduling policy:
com.sterlingcommerce.woodstock.workflow.queue.BasicSchedulingPolicy
v Fair-share scheduling policy:com.sterlingcommerce.woodstock.workflow.queue.FairShareSchedulingPolicy
5. Save the noapp.properties_platform_ifcresources_ext file. Changing either thename or the location of the noapp.properties_platform_ifcresources_ext file mayprevent your changes from taking effect.
Queues in an Application Server Independent EnvironmentSterling B2B Integrator uses fair-share scheduling, which is in-memory queuingand caching, to enable you to set a global thread limit and allocate resources on aqueue-by-queue basis. This enables flexible management of your workload. Theglobal thread limit is the maximum number of business processes that can runsimultaneously in Sterling B2B Integrator. You can change the thread limit andqueue the resource allocations in the install_dir/properties/noapp.properties_platform_ifcresources_ext file. The thread limit is set in theMaxThreads property. For more information about the MaxThreads property, referto “Tuning Queues” on page 173.
172 Sterling B2B Integrator: Performance Management

You can set both a maximum and minimum thread number for each queue youuse. Sterling B2B Integrator includes nine queues (Q1 to Q9). When you check in abusiness process, you must assign a queue to process the business process.
Each queue can use its minimum thread number always, but can never exceed itsmaximum thread number. The sum of the minimum numbers should be less thanthe MaxThreads limit.
The following example procedure explains the fair-share scheduling process:1. Open the install_dir/noapp.properties_platform_ifcresources_ext file using a text
editor.2. Set the global number of threads as 16 by entering 16 as the new MaxThreads
value.3. Determine that queue Q1 is for small items and set the MinPoolSize.1 value to
10 and the MaxPoolSize.1 value to 16. This means that this queue always has10 threads available for use, but if no other queues are using threads, thisqueue can use all 16 threads.
4. Determine that according to the number of small items requiring processing,queue Q1 requires a resource allocation of 70% of the total resources, and youenter 70 as the new ResourceAllocation.1 value.
5. Determine that queue Q8 is for batch processing and set the MinPoolSize.8value to 1 and the MaxPoolSize.8 value to 4.
6. Determine that according to the number of batch items requiring processing,queue Q8 requires a resource allocation of 30% of the total resources, and youenter 30 as the new ResourceAllocation.8 value.
7. During processing, different conditions arise, as shown in the followingexamples:v If there is no batch processing for queue Q8, but a lot of processing for
queue Q1, queue Q1 uses all the 16 threads to complete processing faster.v If there is some batch processing for queue Q8, but also some processing for
queue Q1, queue Q1 uses up to 12 threads to complete processing faster,while queue Q8 uses up to 4 threads to complete processing faster. Thesenumbers are according to the percentages applied to the MaxThreads valueof 16. In the case of queue Q1 with 70% of resource allocations, it is 16 *0.70= 11.2. In the case of queue Q8 with 30% of resource allocations, it is 16 *0.30 = 4.8 rounded to 5, but because MaxPoolSize.8 is set to 4, only 4 threadscan be used by queue Q8, enabling the 12th thread to be used by queue Q1.
v If there is no processing for queue Q1, but a lot of processing for queue Q8,queue Q8 uses all 4 threads to complete processing faster, because theMaxPoolSize.8 for queue Q8 is 4.
Tuning Queues:
You can tune the queues in Sterling B2B Integrator.
About this task
To tune queues in Sterling B2B Integrator:
Procedure
1. Open the install_dir/noapp.properties_platform_ifcresources_ext file using a texteditor.
Performance Management 173
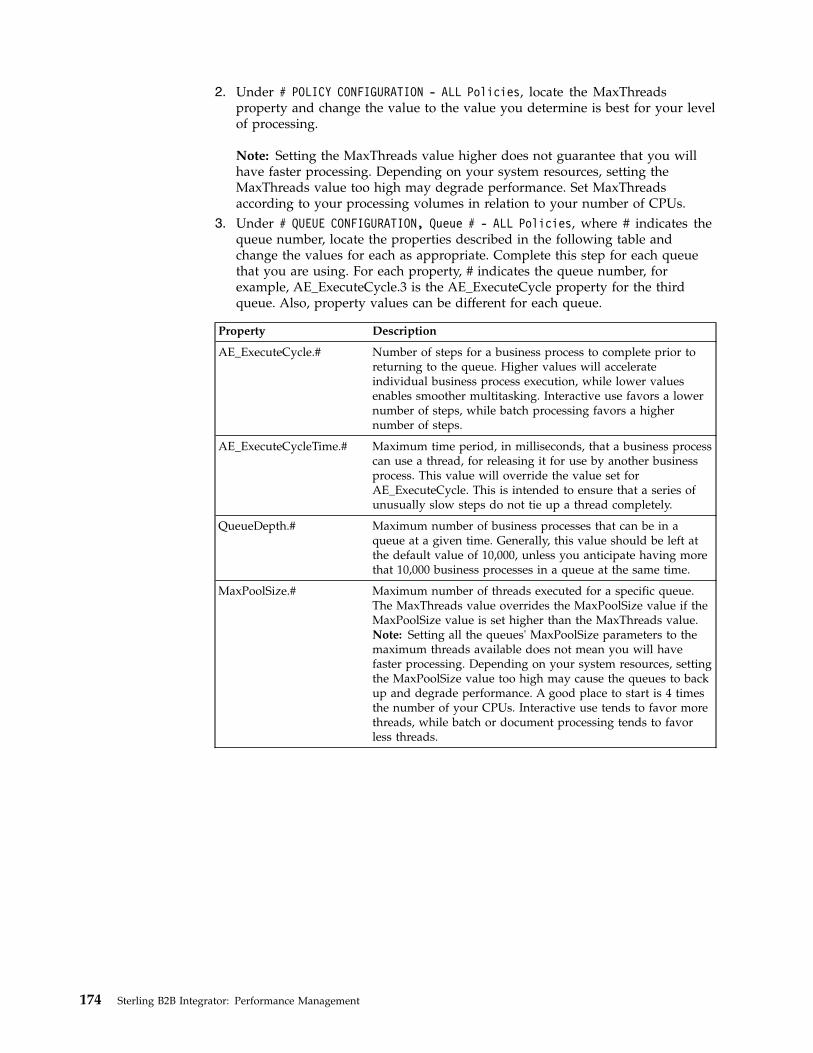
2. Under # POLICY CONFIGURATION - ALL Policies, locate the MaxThreadsproperty and change the value to the value you determine is best for your levelof processing.
Note: Setting the MaxThreads value higher does not guarantee that you willhave faster processing. Depending on your system resources, setting theMaxThreads value too high may degrade performance. Set MaxThreadsaccording to your processing volumes in relation to your number of CPUs.
3. Under # QUEUE CONFIGURATION, Queue # - ALL Policies, where # indicates thequeue number, locate the properties described in the following table andchange the values for each as appropriate. Complete this step for each queuethat you are using. For each property, # indicates the queue number, forexample, AE_ExecuteCycle.3 is the AE_ExecuteCycle property for the thirdqueue. Also, property values can be different for each queue.
Property Description
AE_ExecuteCycle.# Number of steps for a business process to complete prior toreturning to the queue. Higher values will accelerateindividual business process execution, while lower valuesenables smoother multitasking. Interactive use favors a lowernumber of steps, while batch processing favors a highernumber of steps.
AE_ExecuteCycleTime.# Maximum time period, in milliseconds, that a business processcan use a thread, for releasing it for use by another businessprocess. This value will override the value set forAE_ExecuteCycle. This is intended to ensure that a series ofunusually slow steps do not tie up a thread completely.
QueueDepth.# Maximum number of business processes that can be in aqueue at a given time. Generally, this value should be left atthe default value of 10,000, unless you anticipate having morethat 10,000 business processes in a queue at the same time.
MaxPoolSize.# Maximum number of threads executed for a specific queue.The MaxThreads value overrides the MaxPoolSize value if theMaxPoolSize value is set higher than the MaxThreads value.Note: Setting all the queues' MaxPoolSize parameters to themaximum threads available does not mean you will havefaster processing. Depending on your system resources, settingthe MaxPoolSize value too high may cause the queues to backup and degrade performance. A good place to start is 4 timesthe number of your CPUs. Interactive use tends to favor morethreads, while batch or document processing tends to favorless threads.
174 Sterling B2B Integrator: Performance Management

Property Description
CacheThreshold.# Number of business processes that must be in the queuebefore any business processes are cached. In addition, thisvalue is the minimum number of business processes in thequeue before any rescheduling occurs.
In general, setting this value high improves performance bykeeping more business process contexts in memory when theyare placed in the queue. To estimate the amount of memorythat will be consumed, multiply this value by the average sizeof your business process contexts. You can obtain the averagecontext size by using the Sterling B2B Integrator SystemTroubleshooter. For more information, refer to the topicReviewing System Information.
There is a trade-off between performance and memoryconsumption. Setting this value too high can lead to thefollowing:
v Leave Sterling B2B Integrator with insufficient memory insome circumstances
v Cause some business processes to remain in the queue fortoo long without being examined for rescheduling.
Note that in most cases, even if this value is set low, businessprocess contexts will usually be recovered from one of thein-memory caches and not from the disk. The performanceimpact is usually seen when the context is placed in thequeue.
MinPoolSize.# Minimum number of threads reserved for a specific queue.The sum total of all the queues' MinPoolSize values must beequal to or less than the MaxThreads value. The MinPoolSizevalue can be different for each queue.
.# indicates the queue number.Note: Setting the MinPoolSize parameter too low may causequeues to back up and degrade performance.
JavaPriority.# Java priority of the threads that are running businessprocesses. This enables you to set some queues to run moreslowly in order to reduce the issues associated with heavilyused computers being unresponsive to the user interface. Notall JVMs handle this the same way, with some not respecting itat all (particularly, the IBM AIX® JVM).
EnableDeadlines.# Enables or disables deadline support for a queue. Having thedeadlines enabled controls both the notifications and theexecution order in the queue. If enabled, business processeswith deadlines are executed before those without deadlines.Valid values are:
v false – Disables deadline support for a queue.
v true – Enables deadline support for a queue.
Rescheduling.# Enables or disables rescheduling support for a queue. Validvalues are:
v false – Business processes are not rescheduled in a queue.
v true – Business processes are rescheduled in a queue.
ReschedulingInterval.# Time interval, in milliseconds, to wait before the reschedulerpasses through the queue to reschedule business processes.
Performance Management 175

Property Description
MaxWaitTime.# Maximum time for which a business process can be in thequeue without being rescheduled. If a business process isrescheduled, the business process is moved forward in thequeue.
4. In the noapp.properties_platform_ifcresources_ext file, under the # QUEUECONFIGURATION, Queue # - FairShareSchedulingPolicy, where # indicates thequeue number, locate the properties described in the following table andchange the value for each as appropriate. Complete this step for each queueyou are using. For each property, # indicates the queue number, for example,ResourceAllocation.3 is the ResourceAllocation property for the third queue.Also, property values can be different for each queue.
Property Description
ResourceAllocation.# Amount of resources to be allocated to a specific queue for fairshare scheduling. This ensures that the queue has moreresources for processing, which improves processing time andensures the efficient use of system resources.Note: Set the resource allocations according to the percentageof use for each queue and the importance of processingcompleted on each queue. If you have higher priority items onone queue, increase the resource allocation to that queue inorder to increase processing capability. Apply lowerpercentages of resources to lower priority queues or less usedqueues in order to keep resources free for higher priorityprocessing.
InitialCycles.# Number of cycles to be executed the first time a businessprocess gets to execute. Normally, this value should be 5 orless. This is intended to facilitate business processes(particularly Web services) for which normal processing isquite short, but for which there is longer processing in specialcases. It also allows a mix of short and long business processesin a queue, favoring the shorter ones.
StealThreads.# Enables or disables the ability to steal threads from otherqueues. This will only steal unused threads from thatqueue.Valid values:
v true – Enables the ability to steal threads
v false – Disables the ability to steal threads
Queues that are configured to steal threads from other queues(StealThreads property set to true) steal from only queues thathave the AllowStealing property set to true.
AllowStealing.# Enables or disables the ability of other queues to steal threadsfrom this queue. Only unused allocated threads can be stolen.Valid values:
v true – Allows other queues to steal threads
v false – Does not allow other queues to steal threads
Queues that are configured to steal threads from other queues(StealThreads property set to true) steal from only queues thathave the AllowStealing property set to true.
5. Save the noapp.properties_platform_ifcresources_ext file under the same namein the install_dir/properties directory.
176 Sterling B2B Integrator: Performance Management

Important: Saving the noapp.properties_platform_ifcresources_ext file under adifferent name or in a different location will prevent the changes from beingapplied to Sterling B2B Integrator.
6. Stop Sterling B2B Integrator.7. In the install_dir/bin directory, apply these changes by running one of the
following commands:v (For UNIX or Linux) setupfiles.shv (For Windows) setupfiles.cmd
8. Start Sterling B2B Integrator. The changes are applied to Sterling B2B Integrator,and override the changes made in the install_dir/properties/tuning.propertiesfile.
Monitoring Queues using Queue WatcherQueue Watcher monitors various components in Sterling B2B Integrator as well asmanages queue configuration settings.
Accessing Queue Watcher:About this task
To access Queue Watcher, do the following:
Procedure
1. Open your web browser to http://host:port/queueWatch, where host:port is theIP address and port number where Sterling B2B Integrator resides on yoursystem. A login page appears.
Note: Any user with Administrator privileges can login to the Queue Watcherapplication, provided he has all the necessary permissions or is a part of theSterling B2B Integrator Administrator group.
2. Type your username and password. The Queue Watcher displays the followinginformation:
Performance Management 177
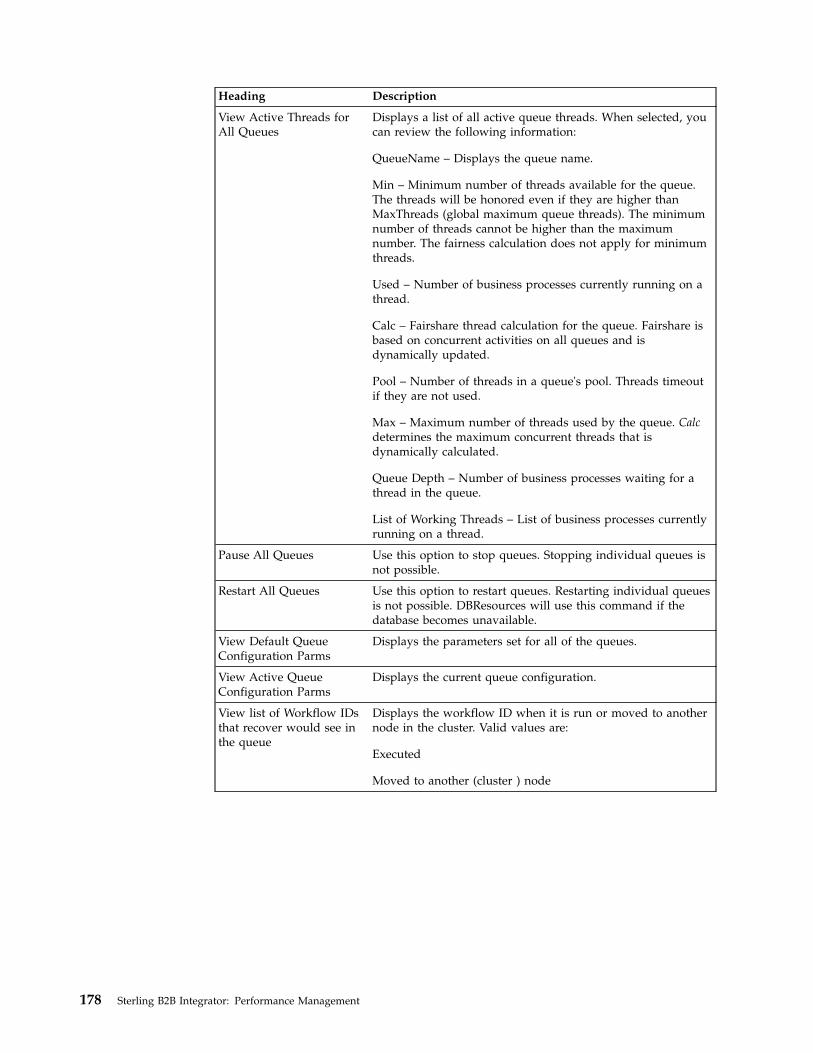
Heading Description
View Active Threads forAll Queues
Displays a list of all active queue threads. When selected, youcan review the following information:
QueueName – Displays the queue name.
Min – Minimum number of threads available for the queue.The threads will be honored even if they are higher thanMaxThreads (global maximum queue threads). The minimumnumber of threads cannot be higher than the maximumnumber. The fairness calculation does not apply for minimumthreads.
Used – Number of business processes currently running on athread.
Calc – Fairshare thread calculation for the queue. Fairshare isbased on concurrent activities on all queues and isdynamically updated.
Pool – Number of threads in a queue's pool. Threads timeoutif they are not used.
Max – Maximum number of threads used by the queue. Calcdetermines the maximum concurrent threads that isdynamically calculated.
Queue Depth – Number of business processes waiting for athread in the queue.
List of Working Threads – List of business processes currentlyrunning on a thread.
Pause All Queues Use this option to stop queues. Stopping individual queues isnot possible.
Restart All Queues Use this option to restart queues. Restarting individual queuesis not possible. DBResources will use this command if thedatabase becomes unavailable.
View Default QueueConfiguration Parms
Displays the parameters set for all of the queues.
View Active QueueConfiguration Parms
Displays the current queue configuration.
View list of Workflow IDsthat recover would see inthe queue
Displays the workflow ID when it is run or moved to anothernode in the cluster. Valid values are:
Executed
Moved to another (cluster ) node
178 Sterling B2B Integrator: Performance Management

Heading Description
View Context CacheEntries
Displays the context cache entries.Note: If entries show up as invalid they are still correct anddo not indicate an error.
Soft Reference Cache Slots in use - Workflow Context (wfc) issaved into this queue (hashtable) and can be recovered from it.This is the fastest back queue. If required, the garbagecollector can acquire more heap space from this queue. Theworkflow contexts are not serialized on this queue.
In Memory Cache Bytes in use - This memory cache holds theworkflow contexts with a size lesser than the configuredthreshold if it is has space. The workflow contexts areserialized on this queue.
Disk Cache Bytes in use - This cache holds workflow contextslarger than the defined threshold. The workflow contexts areserialized on this queue.
Wait Queue Displays the workflow IDs when the Wait Service is beingprocessed. The Wait Service will only appear if the waitinterval is less than 30.
Queue_1 – Queue_9 Displays running and waiting (for available thread) businessprocesses.
View Heap Memory Level Displays heap usage in the system. Business processes can runif heap space and CPU resources are available.
View Memory Generation Displays JVM information specific to garbage collection andmemory generation.
View System Information Displays system level information from the JVM.
View VM Status Displays Java Virtual Machine status.
View Manager Properties Displays the list of properties from thenoapp.properties_platform_ifcresources_ext file.
View Queue Threads Displays a list of all queue threads.
View All Threads Displays a list of all active threads.
View Stateful Adapters Displays a list of stateful adapters running in the system.Stateful Adapters are adapters with an adapterType ofSTATEFUL, for example, the HTTP adapter.
View Stateless Adapters Displays a list of stateless adapters running in the system.Stateless adapters are adapters with an adapterType ofSTATELESS, for example, the File System Adapter.
View Disabled Adapters Displays a list of adapters that are currently marked asdisabled (not running).
View DB Pool Information Displays usage information for the configured DB pools.
View Cluster MulticastData
Displays load data broadcast from the nodes when running ina cluster.
Config Queue Configure the queue parameters to tune performance. Theparameters are not persisted and are reset when Sterling B2BIntegrator restarts.Note: The Config Queue, Reset Queue, and Step Monitorfields can only be used one at a time. To submit the dataentered, you must click enter.
Performance Management 179

Heading Description
Reset Queue Resets the queue to default values. The parameters are notpersisted and are reset when Sterling B2B Integrator restarts.Note: The Config Queue, Reset Queue, and Step Monitorfields can only be used one at a time. To submit the dataentered, you must click enter on your keyboard.
Step Monitor Displays the list of business processes and workflow contextsin the queue.Note: The Config Queue, Reset Queue, and Step Monitorfields can only be used one at a time. To submit the dataentered, you must click enter on your keyboard.
View Properties Displays a list of all available property file names. Select aproperty from the list, then click Send.
View Common Properties Displays a list of the named common property files. Select aproperty from the list, then click Send.
Enabling Queue Watcher:About this task
Queue Watcher allows you to enable the monitoring and management functionalityfrom Sterling B2B Integrator without having to restart the system for it to takeaffect.
To enable Queue Watcher without restarting Sterling B2B Integrator:
Procedure
1. Access the Queue Watcher tool. See Accessing Queue Watcher for additionalinformation.
2. Click Enable Queue Watcher. The page refreshes and displays the QueueWatcher page.
Disabling Queue Watcher:
Queue Watcher allows you to disable the monitoring and managementfunctionality from Sterling B2B Integrator without having to restart the system forit to take affect.
About this task
To disable Queue Watcher without restarting Sterling B2B Integrator:
Procedure
1. Access the Queue Watcher tool. For more information about accessing QueueWatcher, refer to the topic “Accessing Queue Watcher” on page 177.
2. Click Disable Queue Watcher. The Queue Watcher tool is disabled.
Compress Cache ContentsAbout this task
You can compress cache contents from queues before the cache is written to disk.Compressing this information increases performance, requiring fewer bytes to bewritten to and retrieved from storage. If the cache contents are compressed whenthey are written to disk, the contents are decompressed after the information isread back from the disk.
180 Sterling B2B Integrator: Performance Management

To compress the cache contents before the cache is written to disk:
Procedure1. Open the install_dir/properties/workflows.properties file using a text editor.2. In the workflows.properties file, locate the compressObj property and change
the value to true. The default value is false.3. Save the workflows.properties file under the same name in the
install_dir/properties directory.
Important: Saving the workflows.properties file under a different name or in adifferent location will prevent the changes from being applied to Sterling B2BIntegrator.
4. Stop Sterling B2B Integrator.5. In the install_dir/bin directory, run one of the following commands:v (For UNIX or Linux) setupfiles.shv (For Windows) setupfiles.cmd
6. Start Sterling B2B Integrator. The changes are applied to Sterling B2B Integratorand the cache contents are compressed before being written to disk anddecompressed after being read from the disk.
Set the Document Body Serialization Threshold PropertyWhen the size of the documents increase, there is a significant increase in the useof resources for serialization and deserialization of the business process context.
About this task
When you install Sterling B2B Integrator, the default value isdocumentInlineSerializationThreshold = 102400 bytes.
If the business process requires the use of the document body at almost every step,the number of database reads may use more resources than serialization ordeserialization. In such a scenario, set the value higher. If, however, the documentsare large and used infrequently, set the value lower.
To increase performance, in the install_dir/properties/jdbc.properties.in file,perform the following actions:
Procedure1. In the install_dir/properties/jdbc.properties.in file, add the following line:
stream_threshold_bytes =&tune.noapp.documentInlineSerializationThreshold;
2. Set the value of the tune.noapp.documentInlineSerializationThresholdproperty in the install_dir/properties/tuning.properties file according to yourdocument size.
3. From the Administration menu, select Operations > System > Troubleshooter.4. In the System Troubleshooting page, click Soft Stop. This stops Sterling B2B
Integrator. For more information about the softstop process, refer to“Completing a Soft Stop of Sterling B2B Integrator from the SystemTroubleshooter” on page 111
5. From the install_dir/bin directory, run one of the following commands:v (For UNIX or Linux) setupfiles.shv (For Windows) setupfiles.cmd
Performance Management 181
The performance configuration changes populate the initial setup files that areused during startup.
6. From the install_dir/bin directory, start Sterling B2B Integrator by running oneof the following commands:v (UNIX or Linux) run.shv (Windows) startWindowsService.cmd
Sterling B2B Integrator starts, and the updated performance configurationsettings are applied.
Allocate JNDI ContextsAbout this task
Several components of Sterling B2B Integrator use Java Naming and DirectoryInterface (JNDI) to locate objects. You may find that you have to change theallocation of JNDI contexts in Sterling B2B Integrator to enhance performance. InSterling B2B Integrator, the default value is 50.
To change the JNDI allocation:
Procedure1. From the Administration menu, select Operations > System > Troubleshooter.2. In the System Troubleshooting page, click Soft Stop. This runs the softstop
script, allowing all active business processes to complete on a node beforestopping the system. The script is run through a series of interactive steps inthe UI. For more information about the softstop process, refer to “Completing aSoft Stop of Sterling B2B Integrator from the System Troubleshooter” on page111
3. In the install_dir/properties directory, open the tuning.properties file using atext editor.
4. Locate the tune.noapp.jdni.contextpoolsize property, and change the value tothe level you require.
5. In the install_dir/bin directory, run one of the following commands:v (For UNIX or Linux) setupfiles.shv (For Windows) setupfiles.cmd
The changes populate the initial setup files that are used during startup.6. In the install_dir/bin directory, start Sterling B2B Integrator by running one of
the following commands depending on your operating system:v (For UNIX or Linux) run.shv (For Windows) startWindowsService.cmd
Sterling B2B Integrator starts, and the updated performance configurationsettings are applied.
Changing Persistence LevelsPersistence level is the level of detail written to the database even as the businessprocess runs. Sterling B2B Integrator can persist either all the data or only a smallamount of data for each activity that is processed.
The default value for Sterling B2B Integrator is Full persistence. You may find thatyou have to change the persistence level to a lower level in order to enhanceperformance.
182 Sterling B2B Integrator: Performance Management

When you design your business processes, review your persistence requirementsand set persistence levels appropriately to reduce the chances of your databasefilling up and slowing both your processing and your system. You may have somebusiness processes for which you have to persist all the steps and data, and otherbusiness processes for which you do not have to persist any of the steps or data.
There are three levels at which you can set persistence:v Global – Change the value of the persistence_level property in the
install_dir/properties/noapp.properties_gis_ext.in file. The default value isSYSTEM DEFAULT. You cannot set the value to PERSISTENCE_WF_NONE orPERSISTENCE_ERROR_ONLY.
Note: It is more efficient to set persistence levels at either the business processlevel or the activity level.
v Business Process – Change the persistence level during the check-in process. Thebusiness process persistence level overrides the global persistence level.
v Activity Level – Change the persistence level in the service or adapter. Theactivity persistence level overrides the business process persistence level and theglobal persistence level. However, changing the persistence level at the Activitylevel is rarely necessary.
Changing Persistence at the Global Level
To edit the global persistence levels:1. Open the install_dir/properties/noapp.properties_gis_ext.in file using a text
editor.2. In the property file, locate the persistence_level property, and change the value
to the persistence level you want.
Note: If the persistence level property is a comment in thenoapp.properties_gis_ext.in file (#persistence_level=value), the persistencelevel is the default value of full (PERSISTENCE_FULL).v PERSISTENCE_FULL – Saves a complete copy the of process data along each
step of the process.v PERSISTENCE_MINIMAL – Saves all the steps in a business process and
selected copies of process data.v PERSISTENCE_NONE – Saves the first and last steps of a business process
and any steps with an override persistence level.
Note: Use PERSISTENCE_NONE for day-to-day processing.3. Stop Sterling B2B Integrator.4. In the install_dir/bin directory, run one the following commands:v (For UNIX or Linux) setupfiles.shv (For Windows) setupfiles.cmd
5. Start Sterling B2B Integrator.
Changing Persistence at the Business Process Level
To edit the persistence at the business process level:1. From the Administration menu, select Business Processes > Manager.
Performance Management 183
2. Enter either the entire business process name for which you want to edit thepersistence level or a part of the business process name in the Search box andclick Go!.
3. Click source manager adjacent to the business process you want to edit.4. Click edit adjacent to the corresponding business process in order to lock the
business process and access the Graphical Process Modeler.5. In the BPML Specification page that is displayed, enter a new description that
will help you identify this version of the business process.6. Click Next.7. In the Process Levels page, indicate the level of persistence you want to assign
for the business process:v Full - Retains all the data for this business process, including associated
documents, activities, and all the process data.
Note: This choice uses the maximum amount of system resources comparedto other persistence settings.
v Step Status (Engine May Override) - Retains the process data anddocuments for services configured to always persist data for a businessprocess. Sterling B2B Integrator may persist the additional data that isrequested by the process engine or service parameters.This setting is recommended for most processes because it helps optimizeperformance and provides a level of process recovery that is suitable formost business requirements.
v BP Start Stop (Engine May Override) - Retains additional data as requestedby the process engine or service parameters.
v System Default - Assumes that Sterling B2B Integrator is already configuredto retain data.
v Step Status Only - Every step in the business process runs with minimalpersistence, even if a service or adapter is preconfigured for full persistence.Sterling B2B Integrator does not persist additional data.Select this setting if you want to persist only the status information for eachstep, you are certain that your process will execute successfully withoutpersisted data, and your recovery requirements do not depend on the stepdata being saved.
v BP Start Stop Only - Retains only error information. Select this setting whenyou are certain that your process will execute successfully without persisteddata, and when your recovery requirements do not depend on the processstep data being saved.
v Zero - Does not retain any data.v Error Only - Retains process information only when an error occurs. If
nothing is wrong and streamed document data is not used, nothing isretained.
v BP Start Stop Only(No Errors) - Retains information only on businessprocess start and stop steps only. The first step of the business process ispersisted in full and the last step is persisted in minimal. However, whenthe business process encounters an error and stops, the error step is notpersisted and the business process stays in the ACTIVE state.
v Override None No IC - Does not retain any details while the businessprocess is running or in the current process, and will not retain any detailsafter the business process is run.
8. Click Next.
184 Sterling B2B Integrator: Performance Management
9. In the Deadline Settings page that is displayed, click Next.10. In the Life Span page that is displayed , click Next.11. In the Default Version page that is displayed , click Next.12. In the Confirm page that is displayed , click Finish.
Note: When the workflow has the storage set to file system or document trackingis enabled, regardless of the persistence level setting of the workflow, thedocuments processed by the workflow will be saved in the storage internally. Thepayload in the file system can be purged later or the document can be tracked bythe end user using the Current Documents search page. It is invisible to the enduser directly. Because the documents are saved to storage, it will have an impacton the performance.
Changing System LoggingSterling B2B Integrator writes various types of messages to the log files on disk.The default is to log only the errors. For more information about system logs, referto the topic Managing System Logs.
If your system logging level is set to ALL, you may find that you do not require allthe logging messages that are collected because of resource limitations.
If your system logging level is set to ERROR, you may find that you requireadditional messages from more detailed logging.
For information about how to change system logging levels, refer to the topicManaging System Logs.
Enable Trusted Domains for SchemasAbout this task
Sterling B2B Integrator has document type definitions (DTDs) and schemas in arepository for XML components. When a DTD or schema is required, Sterling B2BIntegrator searches the database for the appropriate file. If Sterling B2B Integratorcannot find the appropriate file, you can configure the install_dir/properties/noapp.properties_platform_ifcresources_ext file to have Sterling B2B Integrator goto trusted Web sites and download the appropriate DTD or schema.
To configure Sterling B2B Integrator to go to trusted Web sites for the DTD andschema data:
Procedure1. In the install_dir/properties directory, locate the
noapp.properties_platform_ifcresources_ext.in file.2. Locate the schemaResolver.trustedDomain.# property and type the URL for the
Web site. For example, the first trusted domain could beschemaResolver.trustedDomain.1 = http://www.gdsregistry.org. The secondtrusted domain could be schemaResolver.trustedDomain.2=URL, and so on.Sterling B2B Integrator will search through these Web sites to find theappropriate DTD or schema.
3. Save the noapp.properties_platform_ifcresources_ext.in file under the samename and in the same location.
4. Stop Sterling B2B Integrator.5. In the install_dir/bin directory, run one the following commands:v (For UNIX or Linux) setupfiles.sh
Performance Management 185

v (For Windows) setupfiles.cmd6. Start Sterling B2B Integrator. The changes are applied and you can now
download the DTD and schema data from the trusted Web sites.
Enable the Console ListenerAbout this task
You can enable the Console Listener to append the events identified in the EventsViewer to the noapp.log file, during processing. If you do not enable the ConsoleListener, the events are not appended to the noapp.log file, and consequently, arenot captured in one location for future use. You will then have to view eachcomponent log file individually to see the events that are logged.
To enable the Console Listener:
Procedure1. In the install_dir/properties directory, locate the listenerStartup.properties.in file.2. Locate the following line:
#Listener.Class.1=com.sterlingcommerce.woodstock.event.listeners.console.ConsoleListener
3. Delete the # symbol in the first line to make the line active.4. Save the listenerStartup.properties.in file under the same name and in the same
location.5. Stop Sterling B2B Integrator.6. In the install_dir/bin directory, run one the following commands:v (For UNIX or Linux) setupfiles.shv (For Windows) setupfiles.cmd
7. Start Sterling B2B Integrator. The changes are applied and you can now viewthe events as they are appended to the noapp.log file during processing.
Enabling the JMX Event ListenerYou can enable the JMX (Java Management Extensions) Event Listener to captureSterling B2B Integrator events and perform the necessary notification and handlingbased on your custom JMX event handling requirements.
About this task
You can plug in standard JMX tools to monitor Sterling B2B Integrator.
If you have an existing infrastructure for your enterprise applications to performJMX-based management and event monitoring, you can establish a uniform way tohandle event notifications from Sterling B2B Integrator, along with your otherapplications, through your JMX framework, using the JMX console and tools.
To enable the JMX Event Listener:
Procedure1. In the install_dir/properties directory, open the jmx.properties file.2. Set the jmx.start and jmx.eventListener.start properties to true.3. In the install_dir/properties directory, open the
noapp.properties_platform_ifcresources_ext file.
186 Sterling B2B Integrator: Performance Management

4. Set the startup.class.ifcresources property tocom.sterlingcommerce.woodstock.jmx.event.SPEventJMXAgentStartup byediting the existing line.If the startup.class.ifcresources property does not exist, create a new line toset the startup.class.ifcresources4 property tocom.sterlingcommerce.woodstock.jmx.event.SPEventJMXAgentStartup.
Remember: To prevent errors, do not set the startup.class.ifcresources4more then once.Setting the startup.class.ifcresources property starts the JMX Agent whenSterling B2B Integrator starts.
5. Restart Sterling B2B Integrator to pick up these changes.6. Configure a business process to send events.7. In the Sterling B2B Integrator JMX Console, you can view platform events by
using a URL of this form: service:jmx:rmi://HOST:JMXPORT/jndi/rmi://HOST:JMXRMIPORT/events. This shows the most recent event that was received.Using external JMX tools that support remote JMX connectivity, it is alsopossible to connect remotely to the Event Listener JMX agent. The JMX agentwill be started with a remote connector listening on the jmx.rmi.port asspecified in the jmx.properties file. The URL for remote connection will takethe form /jndi/rmi://[HOST]:[jmx.rmi.port]/events. Use this URL to connectto the JMX agent and receive all the system-wide events.It is possible to listen to select events, rather than all of them. By adding a(comma-separated) list of event schema IDs to the jmx.eventListener.forwardproperty, the JMX agent will restrict JMX notifications to only those eventsspecified in the list.
Enhance EDI PerformanceAbout this task
You can boost EDI performance in Sterling B2B Integrator by adjusting the trackinglevel in the enveloping.properties file. The tracking level setting affects thefollowing EDI functionalities:v EDI Correlation Searchv EDI Document Trackingv EDI Reporting
To modify the tracking level:
Procedure1. In the install_dir/properties directory, locate the enveloping.properties.in file.2. Locate the following line: TRACKING_LEVEL=setting3. Change the value of the setting to achieve the required EDI performance and
functionality, as shown in the following table:
Setting Description
none Provides the largest EDI performance boost with the leasttracking and search functionality. EDI Correlation Search, EDIDocument Tracking, and EDI Reporting are nonfunctional.
Performance Management 187

Setting Description
basic Provides an EDI performance boost while also providingsearch functionality. EDI Correlation Search is functional. EDIDocument Tracking is nonfunctional. EDI Reporting ispartially functional; you can use the EDI OutboundAcknowledgment report type.
full Default setting. Provides the lowest EDI performance with thehighest search and tracking functionality. EDI CorrelationSearch, EDI Document Tracking, and EDI Reporting are fullyfunctional.
4. Save the enveloping.properties.in file under the same name and in the samelocation.
5. Stop Sterling B2B Integrator.6. In the install_dir/bin directory, run one of the following commands:v (For UNIX or Linux) setupfiles.shv (For Windows) setupfiles.cmd
7. Start Sterling B2B Integrator. The changes are applied to theenveloping.properties file, and the new settings will determine the default EDIperformance and functionality of your business processes. The default EDIperformance settings that are set in the enveloping.properties file can beoverridden for certain EDI services by using a TRACKING_LEVEL parameter.This allows you to obtain maximum EDI performance in some businessprocesses, and maximum search and tracking functionality in others. Refer toSterling B2B Integrator Services and Adapters documentation for more informationabout EDI services.
Note: Document tracking is turned off by default in the system-defined EDIbusiness processes. If you define an EDI business process and turn DocumentTracking on, TRACKING_LEVEL settings in both the enveloping.properties fileand the EDI service parameter are overridden.
Customizing Property FilesThe property files in Sterling B2B Integrator help you set up, customize, anddiagnose problems pertaining to the installation and operation of Sterling B2BIntegrator. You can maintain your customized property file settings with acustomer override property file (customer_overrides.properties) that overrides thedefault property settings in the property files. The customer override property fileis not changed during the installation of Sterling B2B Integrator upgrades orpatches.
To prevent your customized settings from being overwritten, use the customeroverride property file whenever possible rather than directly editing the SterlingB2B Integrator property files or the associated .in files. For information about howto use the customer override property file to change property files, refer to theSterling B2B Integrator Property Files documentation.
CAUTION:Property files directly affect the operation of Sterling B2B Integrator. ContactIBM Customer Support before changing any properties.
The following tasks use the customer_overrides.properties file:v Changing Advanced File Transfer Settingsv Change the SoftStop Time Limit
188 Sterling B2B Integrator: Performance Management
Managing System RecoveryAbout this task
Sterling B2B Integrator is designed to automatically reset itself to a previous, stablestate following a system crash. After the reset is complete, the system is up andoperational.
After a system crash, restore the server on which Sterling B2B Integrator isinstalled to a stable state, and then restart Sterling B2B Integrator. After it isrestarted, the system invokes the Recovery business process to search for andrequeue any unprocessed transactions. If the database goes down, Sterling B2BIntegrator stops pulling jobs from queues. The system recovers these jobs when thedatabase becomes available.
Sterling B2B Integrator uses multithread operation to restart or resume businessprocesses following a system crash. Unfinished business processes, up to apreconfigured number, are stored in a pool. Each of the preconfigured number ofthreads receive a batch of business processes to restart or resume. The size of thebatch is also preconfigured. When a thread finishes restarting or resuming a batchof business processes, it requests another batch from the pool. This cycle continuesuntil the pool is empty.
By default, the system uses 10 threads, each of which resumes or restarts 10business processes, and then requests and processes another 10, up to a total of1000 business processes for all threads. You can configure the system settings toadjust recovery performance according to your business requirements.
To configure the system recovery process settings, perform the following actions:
Procedure1. In the install_dir/properties directory, locate (or create, if necessary) the
customer_overrides.properties file.2. Open the customer_overrides.properties file using a text editor.3. Add override statements as required, using the following format for each new
line: bprecovery.property=new_value These statements will override theproperty settings in the bprecovery.properties file. The applicable properties aredescribed in the following table:
Property Description
maxAutorecoveryCount Maximum number of business processes that will beresumed or restarted by the Recovery businessprocess each time it runs. Default is 1000.
This defines the maximum size of the pool used tohold the business processes that have to be resumedor restarted. Each time a thread requests a batch ofbusiness processes to restart or resume, the pool sizeis reduced by the size of the batch (specified by thebatchSize property).
Performance Management 189

Property Description
numberOfThreads Number of threads that will be used simultaneouslyto restart or resume business processes. Default is 10.
Each thread will start or resume a batch of businessprocesses. The size of the batch is specified by thebatchSize property. When the thread is finished withthe batch, it will request another batch from the pool.This process will continue until the pool of businessprocesses that have to be restarted or resumed isempty.
If you frequently have very large numbers ofbusiness processes running at the same time, a largernumberOfThreads value will enhance recoveryperformance.Note: Increasing the number of threads will speed upthe recovery process, but will use more systemresources. Decreasing the number of threads will freeup system resources, but will slow the recoveryprocess. Adjust this value based on your businessrequirements.
batchSize Maximum number of business processes that will beresumed or restarted by each thread before it requestsmore business processes from the pool. Default is 10.Note: Increasing the batch size will speed up therecovery process, but will use more system resources.Decreasing the batch size will free up systemresources, but will slow the recovery process. Adjustthis value based on your business requirements.
Let us for example, assume that you want to change the number of threadsfrom the default value of 10 to 20 and the batch size from 10 to 5. To do so,add the following lines to the customer_overrides.properties file:bprecovery.numberOfThreads=20
bprecovery.batchSize=5
4. Save and close the customer_overrides.properties file.5. Stop Sterling B2B Integrator and restart it to use the new values. For assistance
in determining the proper settings for your business requirements, contact IBMCustomer Support.
Changing the Soft Stop Time LimitYou can set the time limit used when completing a soft stop of Sterling B2BIntegrator from the command line.
About this task
This may be needed to give the business processes that are running adequate timeto finish.
You should perform a soft stop by doing the following:1. Click Operations > System > Troubleshooter.2. In the System Troubleshooting page, click Soft Stop.
For more information about the soft stop process, refer to “Completing a Soft Stopof Sterling B2B Integrator from the Command Line” on page 115.
190 Sterling B2B Integrator: Performance Management
To override the default soft stop time limit:
Procedure1. In the install_dir/properties directory, locate (or create, if necessary) the
customer_overrides.properties file.2. Open the customer_overrides.properties file using a text editor.3. Add the following lines:v noapp.shutdown.timeout_for_bps=new_value
v noapp.shutdown.timeout_for_adapters=new_value
Note: These lines override the shutdown.timeout_for_bps andshutdown.timeout_for_adapters properties in thenoapp.properties_platform_ifcresources_ext.in file.In these lines, new_value refers to the new time limit, in seconds, for a soft stopof Sterling B2B Integrator. For example, assume that you want to set the softstop time limit for adapters to 600 seconds (10 minutes). To do so, add thefollowing line to the customer_overrides.properties file:noapp.shutdown.timeout_for_adapters=600
4. Save and close the customer_overrides.properties file.5. Stop Sterling B2B Integrator and restart it to use the new values.
Changing Advanced File Transfer SettingsAbout this task
Advanced File Transfer (AFT) Visibility performance can be tuned by overridingthree properties in the visibility.properties file. The following settings can beadjusted:v The looping interval of the AFT Worker thread (persistent_batching_interval)
The AFT Worker thread stores the AFT events in the database. It consumes allthe current events in an input event queue, and then sleeps for the duration ofthe specified batching interval. This allows events to build up so that they canbe more efficiently batched into the database. You can improve AFT visibilityperformance by adjusting the batching interval. The batching interval controlshow much latency is programmed into the backend in order to batch up theevents.
v The capacity of the AFT database listener event queue(event_input_queue_capacity)
Note: For large volume operations of FTP, Mailbox, Advanced File Transfer, andSterling File Gateway, the number of open file descriptors should be set to atleast 4096, using the command ulimit -n 4096.You can specify the size of the event input queue. By default, the AFT backendwill store up to 2048 AFT events while waiting for the AFT Database workerthread to return and process them. If the thread does not return before SterlingB2B Integrator fills up the event queue, the event queue will block client threadsuntil space is available in the queue. The clients cannot continue with their tasks,such as copying a file, until the AFT Database worker thread empties the queue.If the AFT Database worker thread returns and the event queue is filled tocapacity, a message will be written to the visibility log file as shown in thefollowing example:
Performance Management 191

DmiVisEventWarehouse.Worker - ALERT ISSUED -AFT Warehouse input BoundedQueue has reached capacity!Client threads are now blocking!The AFT Warehouse will temporarily suspend the sleep interval andwork full time to handle this spike in event activity.
At this point, the Worker thread will suspend sleep operations and service theevent queue. The Worker thread will also monitor the number of events it isretrieving from the input queue. When the queue is no longer filled to capacity,the Worker thread will resume normal sleep intervals after the current events areprocessed and write a message into the visibility log file as shown in thefollowing example:DmiVisEventWarehouse.Worker - ALERT RESCINDED -AFT Warehouse input BoundedQueue is operatingbelow capacity!The normal batch sleep interval is now re-established.
By adjusting the size of the event queue, you can improve the AFT Visibilityperformance.
v The amount of AFT coverage to enable visibility_coverage.You can improve performance by adjusting the amount of AFT Visibilitycoverage that is enabled. You can specify settings ranging from None, whichdisables AFT Visibility, to All, which enables all the AFT Visibility components.Specifying the proper settings according to your requirements allows you todisable unnecessary components and improve performance, while preservingcore file transfer and data flow capabilities.
To specify AFT Visibility settings, perform the following steps:
Procedure1. Navigate to the install_dir/properties directory and locate (or create, if
necessary) the customer_overrides.properties file. For more information aboutcustomizing property files, refer to the topic Customizing Property Files.
2. Open the customer_overrides.properties file using a text editor.3. Add the property settings that you want to use in the following format, using
the information provided in the following table as reference:dmivisibility.PROPERTY_NAME=PROPERTY_VALUE
Here, PROPERTY_NAME is the name of the property.PROPERTY_VALUE is the value you want to assign to the property.For example, assume that you want to change the persistent batching intervalfrom the default value of 2000 to a value of 3000. To do so, add the followingline to the customer_overrides.properties file:dmivisibility.persistent_batching_interval=3000
Property Description
persistent_batching_interval Specifies the time interval, in milliseconds, betweenbatching AFT events to the database. Default is 2000milliseconds (2 seconds). Example:dmivisibility.persistent_batching_interval=2000
192 Sterling B2B Integrator: Performance Management
Property Description
event_input_queue_capacity Specifies the capacity of the bounded queue (AFTdatabase listener event queue) through which all the AFTevents must pass en route the database. Default is 2048.Example:dmivisibility.event_input_queue_capacity=2048Notes:
v If the value of this property is set too high, it maynegatively impact system performance because ofexcessive memory usage. This property should betuned with the persistent_batching_interval property foroptimum results.
v For large volume operations of FTP, Mailbox, AdvancedFile Transfer, and Sterling File Gateway, the number ofopen file descriptors should be set to at least 4096,using the command ulimit -n 4096.
visibility_coverage Specifies which AFT Visibility components are enabled.Valid values are:
v All – Enables all the AFT Visibility components. Thisincludes CommBase, Authentication, Authorization,NonFileXfer, and AdminAudit.
v CommBase – Enables the basic level of visibilitycoverage that includes Communication Sessions, FileTransfers, and Process File Events. AFT Routing eventsand records are also included in this setting.
v Authentication – Enables Authentication events andrecords.
v Authorization – Enables Authorization events andrecords.
v NonFileXfer – Enables Non File Transfer events andrecords (such as FTP CWD).
v CommAll – Enables CommBase, Authorization,Authentication, and NonFileXfer.
v AdminAudit – Enables Administrative Audit trailevents and records.
v None – Disables AFT Visibility.
Example: dmivisibility.visibility_coverage=All
Visibility coverage property settings can be also combinedusing commas as delimiters, for example:
dmivisibility.visibility_coverage=CommBase,Authentication,AdminAudit
4. Save and close the customer_overrides.properties file.5. Stop Sterling B2B Integrator and restart it to use the new values.
Optimize System Performance for Sterling e-InvoicingSterling e-Invoicing is installed on an instance of Sterling B2B Integrator, andshares many of the resources with the latter.
You should, therefore, tune your Sterling B2B Integrator installation first, and thenperform the Sterling e-Invoicing-specific tuning task. However, be aware that thechanges you make to Sterling e-Invoicing can also affect the performance ofSterling B2B Integrator.
Performance Management 193
Note: Do not edit the property files directly. Make the changes in thecustomer_overrides.properties file.
To optimize the performance of Sterling e-Invoicing:1. From the Administration menu, select Business Processes > Manager.2. Enter TrustWeaverEInvoicing in the Search box and click Go!
3. Click source manager adjacent to the business process you want to edit.4. Click edit adjacent to the corresponding business process in order to lock that
business process.5. In the BPML Specification page that is displayed, enter a new description that
will help you identify this version of the business process.6. Click Next.7. In the Process Levels page that is displayed, select a single workflow queue to
dedicate solely to the TrustWeaverEInvoicing process, for example, queue 5.8. Click Next.9. In the Deadline Settings page that is displayed, click Next.
10. In the Life Span page that is displayed, click Next.11. In the Default Version page that is displayed, select the version being edited
and click Next.12. In the Confirm page that is displayed, click Finish.13. Stop Sterling B2B Integrator.14. Modify the tuning.properties file so that the selected queue's minimum and
maximum pool sizes are equal to the number of simultaneous connectionsallowed to TrustWeaver. For example, if you are using queue 5, and are usingup to 10 simultaneous connections to TrustWeaver, you must set the followingproperties in the tuning.properties property file:v NOAPP.MAX_POOL_SIZE_5=10v NOAPP.MIN_POOL_SIZE_5=10
15. After you edit the property file, run setupfiles.sh (setupfiles.cmd forWindows).
16. Restart Sterling B2B Integrator to apply the change.
The Order of Segments in Maps and DataThe benefit of correctly constructed maps is faster processing of input data. Acorrectly constructed map contains segments on the input (left) side of the map inthe same order in which those segments occur in the input data.
In order to locate a matching segment identifier, a search is conducted in the mapfor each input record in the data stream, starting with the last segment entry plusone. The search is sequential, and wraps to the beginning of the map if the targetsegment is not found when the search reaches the end of the map. If the targetsegment identifier is not found even after the entire map has been searched, anerror is generated, and the processing continues with the next record in the datastream. You can minimize the processing time by organizing the map segments inthe same order as that of the input document segments.
The following scenario demonstrates a situation where an entire map is searched tomatch each input segment stream.
The following table lists the order of the identifiers in the map:
194 Sterling B2B Integrator: Performance Management

Segment Identifier
00001
00002
00003
00004
The following table lists the order of the input data segments in the document:
Segment Identifier
00004
00003
00002
00001
Let us assume that a translator searches three records in the map before finding thefourth map record matching the first segment in the input data stream. Similarly,to process the second segment in the input data stream, the translator begins thesearch after the fourth segment, wraps to the beginning of the file, and searchesthree more segments, before finding the correct match. The same search sequenceis followed until all the segments are processed in the input stream. If mapsegments are missing in an input document, it results in lower throughput.
Purge Performance RecommendationsThis topic provides information about purge performance recommendations. Purgeprocess removes data from the live database tables.
The following table provides information about purge performancerecommendations:
Recommendation Comments
Purge business processes The Schedule_IndexBusinessProcessService runs every 10minutes. By default, it is configured to index 5,000 businessprocesses every time it runs, which translates to 720,000business processes in a 24-hours time span.
If your system is handling a high volume of businessprocesses, you can increase the number of business processesindexed per cycle. You can modify theSchedule_IndexBusinessProcessService business process bymodifying variable as shown in the following example:
<assign to="max_business_processes">500000</assign>
Performance Management 195

Recommendation Comments
Batch purge The Schedule_PurgeService scans the ARCHIVE_INFOdatabase table to purge data in the system. By default, itpurges 2,000 rows of data in batches to limit the databasetransaction size. You can set the batch size in thejdbc_purge.propeties file that can be located ininstall_dir/install/properties (install_dir\install\properties for Windows) directory. Modify the batch size bychanging the variable as shown in the following example:
query.purge_archiveInfoRowLimit.database_name
Note: Replace the database_name with the database you areusing along with Sterling B2B Integrator, for example, mssql.
If you modify the value to increase the batch purge rate,ensure that you configure your database with sufficient logspace to handle large transactions.
Document lifespan By default, lifespan for information persisted by a businessprocess is two days. The Schedule_PurgeService purges datain competition with business activity on a system withpredictable processing periods. You can defer documentlifespan by increasing the business process lifespan. Forexample, consider that the system is processing informationfrom 8 a.m. to 5 p.m., you can increase the document lifespanby 12 hours, the purge activity will occur between 8 p.m. onthe same day and 5 a.m. on the next day.
You can modify the business process lifespan by logging in asa Sterling B2B Integrator administrator. Navigate toOperations > Archive Manager > Configure Archive Settingsand perform the changes.
Database compression The Schedule_IndexBusinessProcessService and theSchedule_PurgeService runs complex queries which results insignification disk I/O on the database server. You cancompress the database tables provided in the following list toachieve significant reduction (up to 50% in some cases) in diskusage:
v CORRELATION_SET
v WORKFLOW_CONTEXT
v TRANS_DATA
v DOCUMENT
v ARCHIVE_INFO
Optimizing and Controlling the System ThreadsThis topic provides information about optimizing and controlling the systemthreads. It also provides information about threads created, their source, andprocedures to control them.
Optimizing System Threads
Out of memory situations are very difficult to diagnose. Sterling B2B Integratorcreates around 300 threads that can be grouped under system threads, adapterthreads, common JVM threads, third party software threads, and several otherthreads that occur only once for different purposes.
196 Sterling B2B Integrator: Performance Management

The following table lists the threads created in Sterling B2B Integrator and theirsource.
Thread created by Thread name Count
ActiveMQ ActiveMQ transport 80
ActiveMQ Session Task 11
Jetty SessionScavenger 47
ConduitStreamListener 16
SocketListener 10
JGroup Various Jgroup Handlers 22
JetSpeed RunnableThread 10
Perimeter PS Dispatcher Various Adapters 13
Business process queues ReschedulingThread 10
B2B B2B http Servlet Thread 3
FIFOTaskListener 10
QueueThread:queue 11
System RMI 7
Timer 7
Others From various components 30
Total 287
Controlling the Threads: Several threads created by Sterling B2B Integrator forvarious purposes may not be required always and they can be controlled whereverrequired. This will enhance the Sterling B2B Integrator performance considerably.
Following are the concepts described in this topic:v ActiveMQ Threadsv Jetty Threadsv JGroup Threadsv JetSpeed Threadsv Adapter Threadsv Business Process Queue Threadsv FIFOTaskListener and Queue Threadsv RMI Threadsv Timer Threads
ActiveMQ Threads
ActiveMQ threads can be controlled by running ActiveMQ broker in a separateJVM. No additional setup or configuration is necessary to run ActiveMQ in aseparate JVM. The Sterling B2B Integrator build installation process configures thesystem to use it out of the box for both cluster ActiveMQ and non-clusterActiveMQ.
However, if you plan to use clustering, you may choose a different configurationby editing the activemqconfig.xml file. Before editing this file, read the
Performance Management 197

readme_cluster.txt file. It contains information about how to use the options in theactivemqconfig.xml file. Both files are located in the install_dir/install/activemq/conf folder.
Mandatory Startup for ActiveMQ
The startActivemqMandatory parameter in the install_dir/install/properties/activeMQ.properties file controls the remaining processes and starts them ifActiveMQ fails to start. The default value for this parameter is false. To changethis, you can create an extension file (for example,activeMQ.properties_clumpName_ext.in or customer_overrides.properties file) andspecify the following entry:
startActivemqMandatory=true|false
Where:
true = If activemq fails to start, the rest of processes will not be started.
false = If activemq fails to start, continue to start the rest of the processes.
Standalone ActiveMQ Commands
You can start and stop standalone ActiveMQ server by running the followingcommands.
To start the standalone ActiveMQ server, ensure that ActiveMQ dynamicconfiguration file (activemqconfig.xml.in) and ActiveMQ configuration XML file(activemqconfig.xml) are present in the install_dir/install/activemq/conf directory.Run the following command from install_dir/install/bin directory:v For UNIX, run startActiveMQ.shv For Windows, run startActiveMQWindowsService.cmd
To stop the standalone ActiveMQ server, run the following command frominstall_dir/install/bin directory:v For UNIX, run stopActiveMQ.shv For Windows, run stopActiveMQWindowsService.cmd
Note: You can also start or stop ActiveMQ service from Windows Service Manager.
Using an External ActiveMQ Environment
ActiveMQ is bundled along with Sterling B2B Integrator. However, you can use adifferent ActiveMQ environment by modifying certain files.
Note: It is recommended that users who are familiar with ActiveMQ environmentperform this task.
To use an external ActiveMQ environment in UNIX:1. Shut down Sterling B2B Integrator.2. Change ACTIVEMQ_PORT in sandbox.cfg and point to your own ActiveMQ
environment.3. Remove startActiveMQ.sh from install/bin/run.sh.in.4. Remove stopActiveMQ.sh from install/bin/hardstop.sh.in.
198 Sterling B2B Integrator: Performance Management

5. Change remote.protocol_config=client connection in theinstall/event.properties.in file to your ActiveMQ environment.
6. Run install/bin/setupfiles.sh.7. Restart Sterling B2B Integrator.
To use an external ActiveMQ environment in Windows:1. Shut down Sterling B2B Integrator.2. Change ACTIVEMQ_PORT in sandbox.cfg and point to your own ActiveMQ
environment.3. Remove "net start "%ACTIVEMQ_SERVICE_NAME%" >NUL" from
install/bin/startWindowsService.cmd.4. Remove "net stop /y "%ACTIVEMQ_SERVICE_NAME%"" from install/bin/
stopWindowsService.cmd.5. Change remote.protocol_config=client connection in the
install/event.properties.in file to your ActiveMQ environment.6. Run install/bin/setupfiles.cmd.7. Restart Sterling B2B Integrator.
Sterling B2B Integrator
Changing the Cluster Setting for Bundled ActiveMQ
The configuration file for the bundled ActiveMQ is install/activemq/conf/activemqconfig.xml. You can manually change the broker setting to fit yourbusiness requirements. You can also extend this file withactivemqconfig_clumpname_ext.xml to configure your own beans.
Sterling B2B Integrator
Note: Read install/activemq/conf/readme_cluster.txt file before making anychanges.
Jetty Threads
Sterling B2B Integrator uses Jetty version 4.2.24. Jetty version 4.2.24 whencompared to latest versions like Jetty version 6.1.8 offers limited control on thenumber of threads created. However, you can control the numbers of threadscreated by Jetty listeners. Further, the large numbers of SessionScavenger andConduitStreamListener threads are not controlled by listener thread parameters.They are created for web applications and HTTP Servlet adapters.
You can control the number of threads created by Jetty Listeners by modifying thefollowing configuration parameters in thenoapp.properties_platform_ifcresources_ext file:# specify the minimum number of threads for Socket Listeners for Jettyjetty_min_threads = 5# specify the maximum number of threads for Socket Listeners for Jettyjetty_max_threads = 100
Note: You cannot modify the jetty_min_threads value. However, you can modifythe jetty_max_threads value in the available range from 5 - 100.
Performance Management 199

JGroup Threads
JGroup is a reliable multicast communication toolkit and is used in Sterling B2BIntegrator cluster environment. You cannot control the number of threads createdby JGroup.
JetSpeed Threads
Jetspeed is the portal engine used in Sterling B2B Integrator dashboard interface.The jetspeedresources.properties file controls the number of threads created byJetSpeed.
You can control the number of threads created by JetSpeed by modifying thefollowing configuration parameters in install/noapp/deploy/dashboard/webapp/WEB-INF/conf/JetspeedResources.properties file.#Specify the initial number of threads to createservices.ThreadPool.init.count=5#Specify the maximum number of threads to createservices.ThreadPool.max.count=20#Specify the minimum number of threads to keep as spare until you hit the maximumservices.ThreadPool.minspare.count=5
Note: You cannot modify the services.ThreadPool.init.count value. However,you can modify the services.ThreadPool.max.count value in the available rangefrom 5 - 20.
After modifying, you should remove the install/noapp/deploy/dashboard/webapp/WEB-INF/conf/JetspeedResources.properties from install/noapp/deploy/dashboard.war file to make your change take effect.
Adapter Threads
Several Jetty and Timer threads are created by adapters. You can disable theadapters that are not required to run your business processes thereby controllingthe number of threads created by the adapters.
The following adapters can be disabled to reduce the number of threads created:
Note: Disabling an adapter in the following list can reduce at least one or twothreads in most cases.v FIFO Routingv FIFO Error Queue Listenerv HTTP Communications Adapterv B2B HTTP Communications Adapterv SFTP Client Adapterv FTP Client Adapterv Map Test Http Serverv ebXML Http Server Adapterv MBI Http Server Adapterv SOA Http Server Adapterv SOA SSL Http Server Adapterv RN Http Server Adapterv Http Server Adapter
200 Sterling B2B Integrator: Performance Management

v SWIFTNet Http Server Adapter
Business Process Queue Threads
Sterling B2B Integrator creates nine regular business process queues and oneinternal queue called wait queue for wait service. You cannot control the numberof threads created for business processes.
FIFOTaskListener and Queue Threads
The FIFORouting adapter creates and controls ten queues for FIFO processing.Each FIFO queue creates a FIFO task listener and every task listener creates aconsumer at startup. You can configure the number of queues to reduce thenumber of threads. Additionally, you can disable the FIFORouting adapter if youare not using it thereby turning off all the queues created by the adapter.
You can control the number of threads by modifying the following configuration.The number of queues configured depends on the system load.#In customer_overrides.properties,additional queues can be added by adding,for example:#fifo.workflow.taskqueue.11=FIFO.GIS.QUEUE.11#fifo.workflow.taskqueue.12=FIFO.GIS.QUEUE.11#Note, queues cannot be reduced in customer_overrides.propertiesbut the names can be changed and must be uniqueworkflow.taskqueue.1=FIFO.GIS.QUEUE.1workflow.taskqueue.2=FIFO.GIS.QUEUE.2workflow.taskqueue.3=FIFO.GIS.QUEUE.3workflow.taskqueue.4=FIFO.GIS.QUEUE.4workflow.taskqueue.5=FIFO.GIS.QUEUE.5workflow.taskqueue.6=FIFO.GIS.QUEUE.6workflow.taskqueue.7=FIFO.GIS.QUEUE.7workflow.taskqueue.8=FIFO.GIS.QUEUE.8workflow.taskqueue.9=FIFO.GIS.QUEUE.9workflow.taskqueue.10=FIFO.GIS.QUEUE.10
RMI Threads
The RMI threads are system generated threads for JNDI. You cannot control thenumber of RMI threads.
Timer Threads
The timer threads are created when Sterling B2B Integrator starts. It is notrecommended to control these threads as they are necessary for Sterling B2BIntegrator to run smoothly.
The following timer threads are created when Sterling B2B Integrator starts:v Check Sterling B2B Integrator component licenses and generate messages for
users when one or more licenses is about to expire.v Roll the log service files.v Gather YCP statistics used by the entity framework.v Monitor resources and detect database connections or database connection
leaks.v Schedule business processes.v JNDI service timer.v ActiveMQ timer.
Performance Management 201

WebSphere MQ ParametersYour processing volumes and the number of WebSphere MQ queue consumers andproducers that you expect to start might require you to change the channel and logparameters in the qm.ini or mqs.ini file.
Channel
Each started thread that reads from or writes to the WebSphere MQ queuesrequires a channel. If you start 20 JVMs with 5 threads each, you will need at least100 channels (the default value). You may also have to increase the number ofchannels if you have workloads that open and close the JMS/MQ connectionsrapidly.
If you experience messages indicating that the maximum number of channels hasbeen reached, do the following:v Check to see if there is a connection or channel leak. Run the following
command to see how many active channels are used. YOUR_QM_NAME should bereplaced with your real Queue Manager name.echo "dis chs(*)" | runmqsc YOUR_QM_NAME | grep RUNNING | wc -l
v You may have to run each workload at peak production loads in your testenvironment to diagnose channel leaks.
v If you suspect that channels are not getting reclaimed fast enough or if yourTCP/IP connection is not reliable, you should set the following parameters. TheKeepAlive parameter tells the queue manager to check the existence of the client.If the client is not there, the queue manager will reclaim the channel. TheMaxChannels parameter defaults to 100. In production settings, that parametercould grow to a much higher number like 300 or 500.TCP:
KeepAlive=YES
Channels:MaxChannels=300MaxActiveChannels=100
Log Files
WebSphere MQ uses log files to maintain message integrity in the event of a queuemanager restart or a media failure.
The number of log files depends on your configuration, the size of the messages,the logging type, and the message volumes. You should performance test yourapplication at or above peak production loads to see if the default WebSphere MQlog settings are sufficient. If you are using CIRCULAR logging, the following maybe reasonable starting values:Log:
LogPrimaryFiles=4LogSecondaryFiles=1LogFilePages=65536LogType=CIRCULARLogBufferPages=0
If you use LINEAR logging (for example, to survive media failure), you will haveto set LogPrimaryFiles higher.
202 Sterling B2B Integrator: Performance Management

Placement of WebSphere MQ Log and Data FilesIf your system has to be able to process a high message rate, you should considerplacing your WebSphere MQ log and data files on a fast SAN, preferablyconfigured with a large NVRAM and RAID-10. A single internal disk should havesufficient capacity to allow up to 150K to 200K messages per second. Files on aRAID-10 LUN should be able to get up to around 1.5M to 2.0M messages per hour.Beyond that message rate, you may want to consider implementing multiple queuemanagers with separate data and log files.
Performance StatisticsThe Performance Statistics Report is the key to managing your Sterling B2BIntegrator performance.
Before you can generate or view a performance statistics report, you must turn onperformance statistics. For more information about how to turn it on, refer to thetopic Turning On and Turning Off Performance Statistics. You can turn on and turnoff performance statistics as many times as you want to. When performancestatistics is turned off, the statistics are simply discarded, and when performancestatistics is turned on, the current report resumes the process of collecting statistics.If you do not generate a report before you turn on performance statistics, thedefault report is generated automatically, and collects the performance statistics.
Run the Performance Statistics Report to obtain benchmarks directly after youperform each of these tasks:v Install Sterling B2B Integrator.v Tune Sterling B2B Integrator using the information provided in the topic
“Manual Performance Tuning” on page 166.v Complete manual tuning, if any, to the install_dir/properties/
noapp.properties file and related extension files (*.ext).v Make improvements to your business processes, if necessary, including changing
the persistence levels.
After you receive your initial benchmark Performance Statistics Report, generate anew report every few weeks or at least once a month to have a snapshot of theway your Sterling B2B Integrator is performing in relation to your benchmarks.
If you note variances between your benchmarks and your current report, you canuse the information in the report to troubleshoot and resolve issues before theycause performance delays. The most current report is always at the top of the ViewReport list. After you close a report, no further data can be added to the report.Every time you generate a new report, the new report becomes the current report.
Viewing a Performance Statistics Report
To view a Performance Statistics Report:1. From the Administration menu, select Operations > System > Performance >
Statistics.2. In the Performance Statistics Report Manager page, under View Report, select a
name from the list, and click Go!.
Performance Management 203
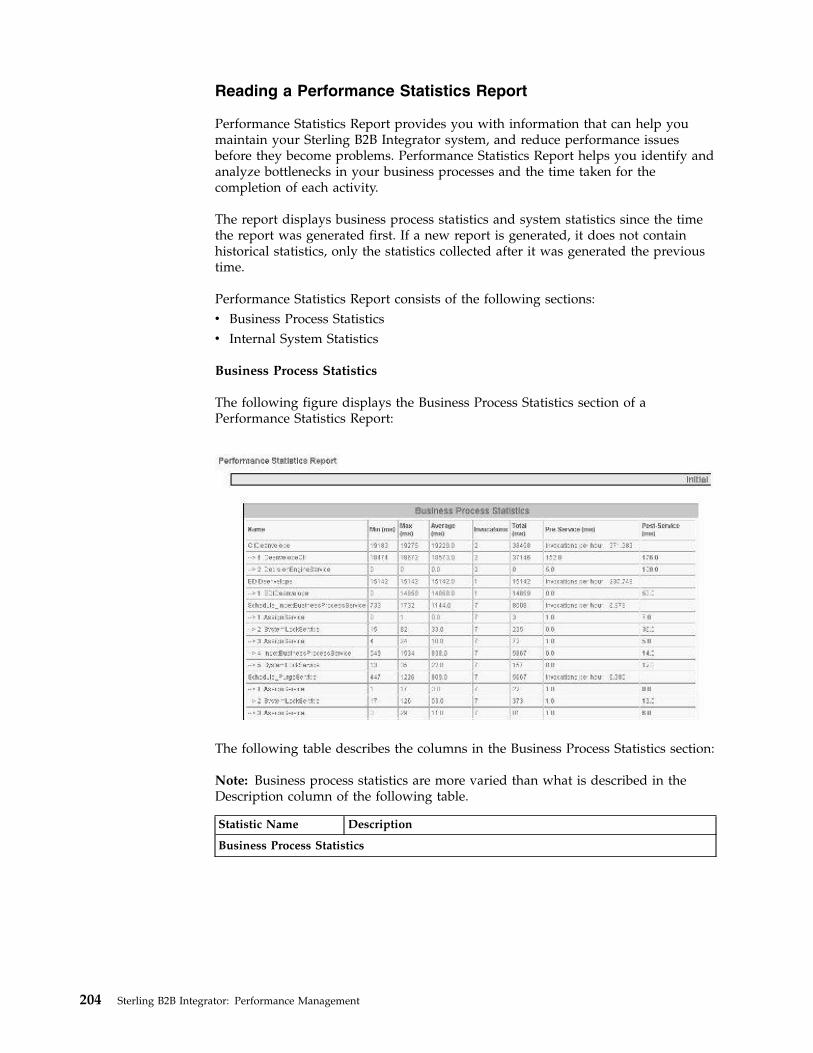
Reading a Performance Statistics Report
Performance Statistics Report provides you with information that can help youmaintain your Sterling B2B Integrator system, and reduce performance issuesbefore they become problems. Performance Statistics Report helps you identify andanalyze bottlenecks in your business processes and the time taken for thecompletion of each activity.
The report displays business process statistics and system statistics since the timethe report was generated first. If a new report is generated, it does not containhistorical statistics, only the statistics collected after it was generated the previoustime.
Performance Statistics Report consists of the following sections:v Business Process Statisticsv Internal System Statistics
Business Process Statistics
The following figure displays the Business Process Statistics section of aPerformance Statistics Report:
The following table describes the columns in the Business Process Statistics section:
Note: Business process statistics are more varied than what is described in theDescription column of the following table.
Statistic Name Description
Business Process Statistics
204 Sterling B2B Integrator: Performance Management

Statistic Name Description
Name Name of a business process, followed by numbered rowspertaining in the individual activities in the business process. Thenumber of each row indicates the corresponding step in thebusiness process.
For example, in the preceding figure, the business processCIIDeenveloper includes two activities:
v --> 1 DeenveloperCII
v --> 2 DecisionEngineService
Min (ms) Minimum time (in milliseconds) it took for a business process oractivity to complete. If there are multiple invocations, this is thelowest minimum time taken for all the invocations.
For example, in the figure preceding this table, it can be seen thatthe CIIDeenvelope business process took 19183 ms to complete,while the Deenveloping step (1 DeenveloperCII) took a minimumtime of 18474 ms. Both these are the lowest statistics; there weretwo invocations of the business process.
Use this statistic to track business processes or activities that beginto slow down. If you notice this statistic increasing over yourbenchmark value, it may be indicative of a performance issue. Ifyou see an occasional variance for a business process or activity, itdoes not necessarily indicate a performance issue. If, however, younotice a continuous variance between production statistics andyour benchmarks, you probably have a real issue that should beaddressed.
For more information about slow systems, refer to the topic A SlowSystem: Symptoms, Causes, and Resolution.
For more information about improving business process executiontime, refer to the topic Symptoms and Causes of Poor BusinessProcess Execution Time.
Max (ms) Maximum time (in milliseconds) it took for a business process oractivity took to complete. If there are multiple invocations, this isthe highest maximum time taken for all the invocations.
For example, in the figure preceding this table, it can be seen thatthe CIIDeenvelope business process took 19275 ms to complete,while the Deenveloping step (1 DeenveloperCII) took a maximumtime of 18672 ms. Both these are the highest statistics; there weretwo invocations of the business process.
Use this statistic to track business processes or activities that beginto slow down during processing. If you notice this statisticincreasing over your benchmark value, it may be indicative of aperformance issue. If you see an occasional variance for a businessor activity, it does not indicate a performance issue. If, however,you notice a continuous variance between production statistics andyour benchmarks, you must resolve the issue.
For more information about slow systems, refer to the topic A SlowSystem: Symptoms, Causes, and Resolution.
For more information about improving business process executiontime, refer to the topic Symptoms and Causes of Poor BusinessProcess Execution Time.
Performance Management 205

Statistic Name Description
Average (ms) Average processing time taken for a business process or service tobe completed.
For example, in the figure preceding this table, it can be seen thatthe CIIDeenvelope business process took an average of 19229.0 msto complete, while the Deenveloping step (1 DeenveloperCII) tookan average time of 18573.0 ms. Both these are the average statistics;there were two invocations of the business process.
Use this statistic to track the overall averages of business processesor activities that begin to slow down during processing. If younotice this statistic increasing over your benchmark value, it maybe indicative of a performance issue. If you see an occasionalvariance for a business or activity, it does not necessarily indicate aperformance issue. If, however, you notice a continuous variancebetween production statistics and your benchmarks, you probablyhave a real issue that should be addressed.
For more information about slow systems, refer to the topic A SlowSystem: Symptoms, Causes, and Resolution.
For more information about improving business process executiontime, refer to the topic Symptoms and Causes of Poor BusinessProcess Execution Time.
Invocations Number of times the business process or service was invoked sincethe report was generated first. The number of invocations shouldbe the same for both the business process and each activity in thebusiness process, unless you have a business process that loopsseveral times. In such a situation, you can set the number ofinvocations lower than the number of activities in the businessprocess.
For example, in the figure preceding this table, it can be seen thatthe CIIDeenvelope business process had two invocations, and theDeenveloping step (1 DeenveloperCII) had two invocations.
Use this statistic to determine if the number of business processesexpected are running, and if all the activities in the businessprocesses are running. If you see a variance between the businessprocess invocation number and the activity number, this mayindicate that a business process has an error, and is in a waiting,interrupted, or halted state. You can also use this statistic todetermine the processing load on your system during differentprocessing periods, such as peak and nonpeak processing hours.
206 Sterling B2B Integrator: Performance Management

Statistic Name Description
Total (ms) Total time for (in milliseconds) a business process or service hastaken to process since the time you last generated the report. Thisis the sum of total time taken for the completion of all the businessprocesses.
For example, in the figure preceding this table, it can be seen thatthe CIIDeenvelope business process took 38458 ms to process sincethe report was last generated and the Deenveloping step (1DeenveloperCII) took a total of 37146 ms.
Use this statistic to see if the total processing time for a businessprocess or activity is increasing substantially over the number ofinvocations. If this number does increase over the number ofinvocations, it indicates that the processing time is longer. If theprocessing time is longer than your benchmark, you must resolvethe issue.Note: Because statistics are accumulated from the beginning ofmonitoring until its end, you might have to turn monitoring onand off and collect the statistics at regular intervals. This allowsyou to monitor performance at certain times during processing. Achange in the total work a business process performs during theintervals might indicate a problem, but only if the demand for thatbusiness process is constant throughout the measurement period.
For more information about improving business process executiontime, refer to the topic Understanding Business Process.
Pre-Service (ms) Total time taken by the business process engine to completeactivities before a business process or service is run.
For example, in the figure preceding this table, it can be seen thatthe DeenvelopeCII activity took 37146 ms for preservice activities.Every time an activity is run, Sterling B2B Integrator mustcomplete system service invocations before running the activity.
Use this statistic to see if the system services are taking a long timeto run before a business process is run. If you see a variancebetween the report time and the benchmark time, this may indicatethat there is a database, operating system, or some other systemissue that must be resolved.
For more information about operating system issues, refer to yourvendor's documentation.
For more information about slow systems, refer to the topic A SlowSystem: Symptoms, Causes, and Resolution.
Performance Management 207
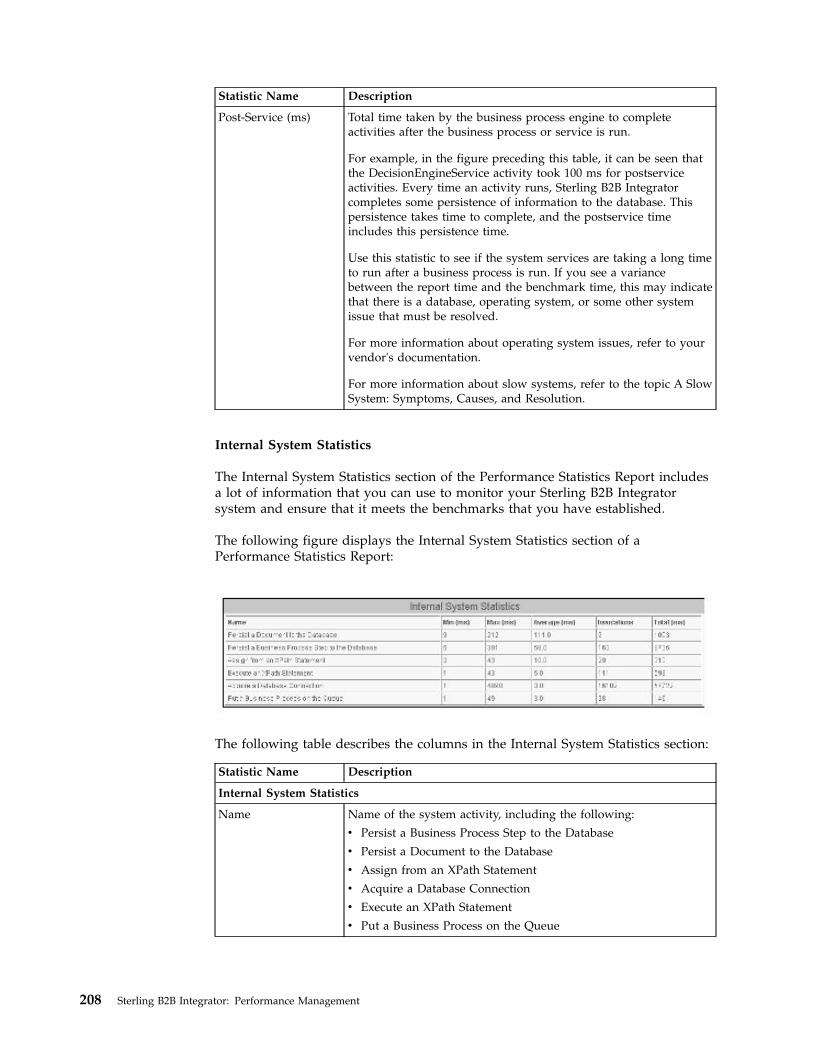
Statistic Name Description
Post-Service (ms) Total time taken by the business process engine to completeactivities after the business process or service is run.
For example, in the figure preceding this table, it can be seen thatthe DecisionEngineService activity took 100 ms for postserviceactivities. Every time an activity runs, Sterling B2B Integratorcompletes some persistence of information to the database. Thispersistence takes time to complete, and the postservice timeincludes this persistence time.
Use this statistic to see if the system services are taking a long timeto run after a business process is run. If you see a variancebetween the report time and the benchmark time, this may indicatethat there is a database, operating system, or some other systemissue that must be resolved.
For more information about operating system issues, refer to yourvendor's documentation.
For more information about slow systems, refer to the topic A SlowSystem: Symptoms, Causes, and Resolution.
Internal System Statistics
The Internal System Statistics section of the Performance Statistics Report includesa lot of information that you can use to monitor your Sterling B2B Integratorsystem and ensure that it meets the benchmarks that you have established.
The following figure displays the Internal System Statistics section of aPerformance Statistics Report:
The following table describes the columns in the Internal System Statistics section:
Statistic Name Description
Internal System Statistics
Name Name of the system activity, including the following:
v Persist a Business Process Step to the Database
v Persist a Document to the Database
v Assign from an XPath Statement
v Acquire a Database Connection
v Execute an XPath Statement
v Put a Business Process on the Queue
208 Sterling B2B Integrator: Performance Management
Statistic Name Description
Min (ms) Minimum time (in milliseconds) the system activity took tocomplete. If there are multiple invocations, this is the lowest timefor all the invocations.
For example, in the figure preceding this table, the Persist aDocument to the Database activity took 9 ms to complete. This isthe shortest time of the nine invocations of the activity.
Max (ms) Maximum time (in milliseconds) the system activity took tocomplete. If there are multiple invocations, this is the highest timefor all the invocations.
For example, in the figure preceding this table, the Persist aDocument to the Database activity took 212 ms to complete. This isthe longest time of the nine invocations of the activity.
Average (ms) Average processing time taken for the system activity to complete.This is the average time for all invocations.
For example, in the figure preceding this table, the Persist aDocument to the Database activity took an average of 111 ms tocomplete. This is the average processing time taken by the nineinvocations of the activity.
Invocations Number of times the system activity was invoked since you lastgenerated the report.
For example, in the figure preceding this table, the Persist aDocument to the Database activity was invoked nine times.
Total (ms) Total time (in milliseconds) the system activity has taken to processsince the report generation began. This is the sum total time of allthe system activity completion times.
For example, in the figure preceding this table, the Persist aDocument to the Database activity took a total of 1003 ms tocomplete.
The following table describes each internal system activity, and how to use thestatistics to reduce the chances of a performance issue occurring:
Performance Management 209
Statistic Name Description
Persist a Document tothe Database
The length of time and the number of times a document waspersisted to the database.
For more information about persistence, refer to the topicChanging Persistence Levels.
For example, in the figure preceding this table, Persist a Documentto the Database had the following statistics:
v Min (ms) – 9
v Max (ms) – 212
v Average (ms) – 111.0
v Invocations – 9
v Total (ms) – 1003
The Persist a Document to the Database statistic is helpful indetermining database issues and slow processing issues. When youcompare this information with your benchmarks, verify if younotice the following:
v The Min (ms), Max (ms), and Average (ms) times are increasing.This indicates that the database is becoming full, or that youhave a connection leak.
v The number of invocations are increasing. This indicates thatyour persistence level is set too high.
v The number of invocations is small and the Min (ms) and Max(ms) times are increasing. This indicates that you are persistinglarge documents to the database, which can be moved to thedisk to save database space.
210 Sterling B2B Integrator: Performance Management

Statistic Name Description
Persist a BusinessProcess Step to theDatabase
The length of time and the number of times a business processstep was persisted to the database.
For more information about persistence, refer to the topicChanging Persistence Levels.
For example, in the figure preceding this table, Persist a BusinessProcess Step to the Database had the following statistics:
v Min (ms) – 5
v Max (ms) – 391
v Average (ms) – 59.0
v Invocations – 163
v Total (ms) – 9735
The Persist a Business Process Step to the Database statistic ishelpful in determining database issues and slow processing issues.When you compare this information with your benchmarks, verifyif you notice the following:
v The Min (ms), Max (ms), and Average (ms) times are increasing.This indicates that either the database is becoming full, or youhave a connection leak.
v The number of invocations are increasing. This indicates thatyour persistence level is set too high.
For more information about slow systems, refer to the topicChanging Persistence Levels.
v The number of invocations is small and the Min (ms) and Max(ms) times are increasing. This indicates that you are persistinglarge documents to the database, which can be moved to thedisk to save database space.
Assign from an XPathStatement
The length of time and the number of times an assign activity wascompleted from an XPath statement in a business process.
For example, in the figure preceding this table, Assign from anXPath Statement had the following statistics:
v Min (ms) – 2
v Max (ms) – 43
v Average (ms) – 10.0
v Invocations – 29
v Total (ms) – 310
The Assign from an XPath Statement statistic is helpful indetermining if you have well-structured XPath statements in yourbusiness processes. When you compare this information with yourbenchmarks, verify if you notice the following:
v The Min (ms), Max (ms), and Average (ms) times are increasing.This indicates that the XPath statement is not written efficiently,and may slow down your process time. Write XPath statementsusing relative paths. For example, write PurchaseOrder/textinstead of /ProcessData/PurchaseOrder/text(). In addition, donot use // at the beginning of an XPath statement, because thiscauses the entire process data to be traversed.
Performance Management 211

Statistic Name Description
Execute an XPathStatement
The length of time and the number of times an XPath statementran in a business process.
For example, in the figure preceding this table, Assign from anXPath Statement had the following statistics:
v Min (ms) – 1
v Max (ms) – 43
v Average (ms) – 5.0
v Invocations – 111
v Total (ms) – 598
This statistic is helpful in determining if you have well-structuredXPath statements in your business processes. When you comparethis information with your benchmarks, verify if you notice thefollowing:
v The Min (ms), Max (ms), and Average (ms) times are increasing.This indicates that the XPath statement is not written efficiently,and may slow down your process time. Write XPath statementsusing relative paths. For example, write PurchaseOrder/textinstead of /ProcessData/PurchaseOrder/text(). In addition, donot use // at the beginning of an XPath statement, because thiscauses the entire process data to be traversed.
Acquire a DatabaseConnection
The length of time and the number of times a database connectionwas made.
For example, in the figure preceding this table, Acquire a DatabaseConnection had the following statistics:
v Min (ms) – 1
v Max (ms) – 4990
v Average (ms) – 3.0
v Invocations – 16102
v Total (ms) – 57722
The Acquire a Database Connection statistic is helpful indetermining whether you have database issues, resource leaks, orwhether you have to increase the number of database pools. Whenyou compare this information with your benchmarks, verify if younotice the following:
v The Min (ms), Max (ms), and Average (ms) times are increasing.This indicates that the database is quite active if it is used byother applications outside of Sterling B2B Integrator.
v The number of invocations are increasing. This indicates thatyour persistence level is set too high, causing too much data tobe stored in the database, or your cache levels are not tunedcorrectly, causing the data to be stored and retrieved from thedatabase instead of from the cache.
v The number of invocations are low and not increasing. Thisindicates that either you have a resource leak that is notreleasing previously used database connections to be used byother threads, or you do not have enough database pools set inthe Performance Tuning Utility.
212 Sterling B2B Integrator: Performance Management
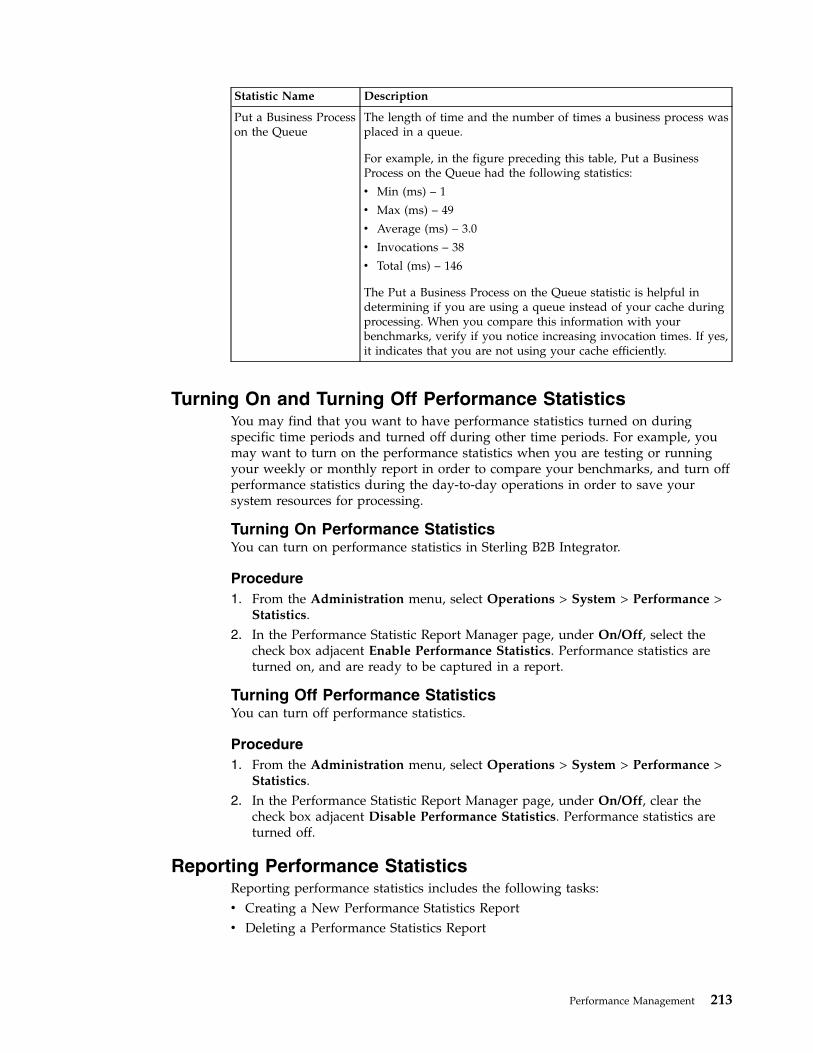
Statistic Name Description
Put a Business Processon the Queue
The length of time and the number of times a business process wasplaced in a queue.
For example, in the figure preceding this table, Put a BusinessProcess on the Queue had the following statistics:
v Min (ms) – 1
v Max (ms) – 49
v Average (ms) – 3.0
v Invocations – 38
v Total (ms) – 146
The Put a Business Process on the Queue statistic is helpful indetermining if you are using a queue instead of your cache duringprocessing. When you compare this information with yourbenchmarks, verify if you notice increasing invocation times. If yes,it indicates that you are not using your cache efficiently.
Turning On and Turning Off Performance StatisticsYou may find that you want to have performance statistics turned on duringspecific time periods and turned off during other time periods. For example, youmay want to turn on the performance statistics when you are testing or runningyour weekly or monthly report in order to compare your benchmarks, and turn offperformance statistics during the day-to-day operations in order to save yoursystem resources for processing.
Turning On Performance StatisticsYou can turn on performance statistics in Sterling B2B Integrator.
Procedure1. From the Administration menu, select Operations > System > Performance >
Statistics.2. In the Performance Statistic Report Manager page, under On/Off, select the
check box adjacent Enable Performance Statistics. Performance statistics areturned on, and are ready to be captured in a report.
Turning Off Performance StatisticsYou can turn off performance statistics.
Procedure1. From the Administration menu, select Operations > System > Performance >
Statistics.2. In the Performance Statistic Report Manager page, under On/Off, clear the
check box adjacent Disable Performance Statistics. Performance statistics areturned off.
Reporting Performance StatisticsReporting performance statistics includes the following tasks:v Creating a New Performance Statistics Reportv Deleting a Performance Statistics Report
Performance Management 213

Creating Performance StatisticsAfter enabling performance statistics, create a Performance Statistics report to viewthe statistics.
About this task
To create a Performance Statistics report:1. From the Administration menu, select Operations > System > Performance >
Statistics.2. In the Performance Statistic Report Manager page, under Create New Report,
enter a name for the new report in the Name box, and click Go!.The new report is created and the name is displayed in the list under ViewReport. This displays the latest report at the top and the oldest report at thebottom.
Deleting a Performance Statistics ReportYou may have to delete a Performance Statistics Reports to free up storage or tosimply remove old reports from Sterling B2B Integrator.
About this task
Procedure1. From the Administration menu, select Operations > System > Performance >
Statistics.2. In the Performance Statistic Report Manager page, under Delete Reports, next
to Delete All Inactive Reports, click Go!. All the reports, except the latestreport, are deleted.
TroubleshootingTools, tips and guidance are provided to help you troubleshoot problems inSterling B2B Integrator.
Database Maintenance CheckSterling B2B Integrator performs a scheduled maintenance check on the databaseevery Monday at 4:00 a.m. This is the default setting and is configurable. Thismaintenance check is performed by the DB Monitor service and its associatedSchedule_DBMonitorService business process. The system verifies if any of thefollowing conditions have occurred:v Database is more than 80 percent full.v Database has grown more than 30 percent since the last maintenance check.v Database has to be indexed.
If any of these conditions are found, the system sends an event notification. Bydefault, it sends an e-mail to the system administrator.
If you are notified that the database has to be indexed, contact your databaseadministrator or use the db_optimization_tool script to rebuild the indexes andoptimize the database.
214 Sterling B2B Integrator: Performance Management

Important: The reports and tools described in this section are not a replacementfor standard database tools and maintenance scripts, and should be used only ifyour DBA is not involved with regular maintenance on the Sterling B2B Integratordatabase.
View the Database Statistics Report
To view information about business processes in the database:1. From the Administration menu, select Operations > Reports.2. In the Reports page, under Search, enter DBStats in the Name box and click
Go!.
Note: The DBStats report can also be found under List. However, it cannot befound using the Type "list" under Search.
3. Click source manager.4. Select the appropriate report format from the drop-down list and click execute.
Database Statistics Report
The Database Statistics Report provides statistical information about businessprocesses in the database. You should review the Database Statistics Report if youexperience full database or failed database connection problems, or if you receiveautomated notification that the database's health needs to be checked.
The Database Statistics Report is divided into the following sections:
Report Section Description and Fields
Business Process Runs inActive System
Lists all the business process definitions that have had atleast one instance executed. Fields are:
v Business Process Name – Name of the business processinstance.
v Number of Runs – Number of times the instance hasrun.
v Number of Persisted Steps – Number of steps persistedper business process definition.
v Average Number of Persisted Steps – Average numberof steps persisted.
Business Process Runs inActive System - Last 24 Hours
Lists all the business process definitions that have had atleast one instance executed in the last 24 hours.
Business Process Runs inActive System - Interval ofLast 48 to 24 Hours
Lists all the business process definitions that have had atleast one instance executed during the previous day (24-48hours before the current time).
Performance Management 215

Report Section Description and Fields
Number of BPs by RemovalMethod
Shows the number of business processes flagged to bearchived, purged, or indexed. It contains the followingfields:
v Archive Flag – Shows the number of business processesin each category:
– To Be Archived – Business processes flagged to bearchived
– To Be Purged – Business processes flagged to bepurged
– Archived, to be Purged – Business processes thathave been archived and are flagged to be purged
– To Be Indexed – Business processes flagged to beindexed
v Count - Total number of business processes with thestated Archive flag
Number of Eligible BPs byRemoval Method
Number of eligible business processes that are flagged tobe archived, purged, or indexed.
The Number of BPs by Removal Method To Be Indexedcount minus the Number of Eligible BPs by RemovalMethod To Be Indexed count provides the number ofbusiness processes that, for whatever reason, are noteligible for indexing. These business processes will not bepurged until they become eligible for indexing.
Archive Dates by RemovalMethod
Shows the date range of business processes that areflagged to be archived, purged, or indexed. Fields are:
v Archive Flag – Shows one of the following conditions:
– To Be Archived – Business processes flagged to bearchived
– To Be Purged – Business processes flagged to bepurged
– Archived, to be Purged – Business processes thathave been archived, and are flagged to be purged
v Min – Date and time of the first expired businessprocess
v Max – Date and time of the last expired businessprocess
Table Row Counts Shows the number of rows for each table in the activesystem. Fields are:
v Table Name – Name of the table
v Count – Number of rows in the table
Table Row Counts - Last 24Hours
Shows the number of rows for each table in the activesystem during the last 24 hours.
Table Row Counts - Interval ofLast 48 to 24 Hours
Shows the number of rows for each table in the activesystem during the previous day (24 to 48 hours prior tothe current time).
Table Row Counts - Index Shows the number of rows that have not been indexed foreach table in the active system.
Table Row Counts - Archive The Table Row Counts - Archive section shows thenumber of rows eligible for archiving for each table in theactive system.
216 Sterling B2B Integrator: Performance Management

Report Section Description and Fields
Table Row Counts - Purge The Table Row Counts - Purge section shows the numberof rows eligible for purging for each table in the activesystem.
Number of Rows with NoMatching Records in ArchiveInfo
Shows the number of rows in a table that are orphaned(have no matching records in the archive data). It containsthe following fields:
v Table Name – Name of the table
v Orphaned Record Count – Number of orphaned rows
No Matching Workflow ID(Null)
The section shows the number of records inTRANS_DATA with NULL workflow IDs or -1 workflowIDs. It contains the following fields:
v Number of BPs with No Matching Records in DataTable, and Count – Total number of workflows with -1Workflow IDs in the data table
v No Workflow ID Assigned, and Count – Number ofbusiness processes that have a null workflow ID.
Optimize the Database with the db_optimization_tool Script
Sterling B2B Integrator provides a database optimization script that allows you tooptimize your database by performing tasks such as analyzing tables andrebuilding indexes.
Note: The db_optimization_tool script does not work for DB2.
To run the database optimization script, run the following from the command line:v For UNIX, run install_dir/bin/db_optimization_tool.sh options
v For Windows, run install_dir\bin\db_optimization_tool.cmd options
Option Description
-l View a list of all index rebuild or analyze database SQL statements.Must be used with -i or -a, or both.
Uses the current date and time as the cutoff for expired data,unless the -t option is used. Either -l or -r is required.
-r Run all index rebuild or analyze database SQL statements. Must beused with -i or -a. Uses the current date and time as the cutoff forexpired data, unless the -t option is used. Either -l or -r is required.Note: The database optimization scripts can do a lot of databaseupdates to rebuild the indexes and analyze the database tables.This could lead to deadlocks if done while Sterling B2B Integratoris running. If you want to run these scripts while Sterling B2BIntegrator is running, you should run them during non-peak times.You can also avoid deadlocks by running these scripts whileSterling B2B Integrator is not running, as long as the database isrunning.
-i Use a list of the table indexes that need to be rebuilt (optimized).Must be used with -l or -r. Either -i or -a is required.
-a Use a list of the tables to analyze. Must be used with -l or -r. Either-i or -a is required.
Performance Management 217
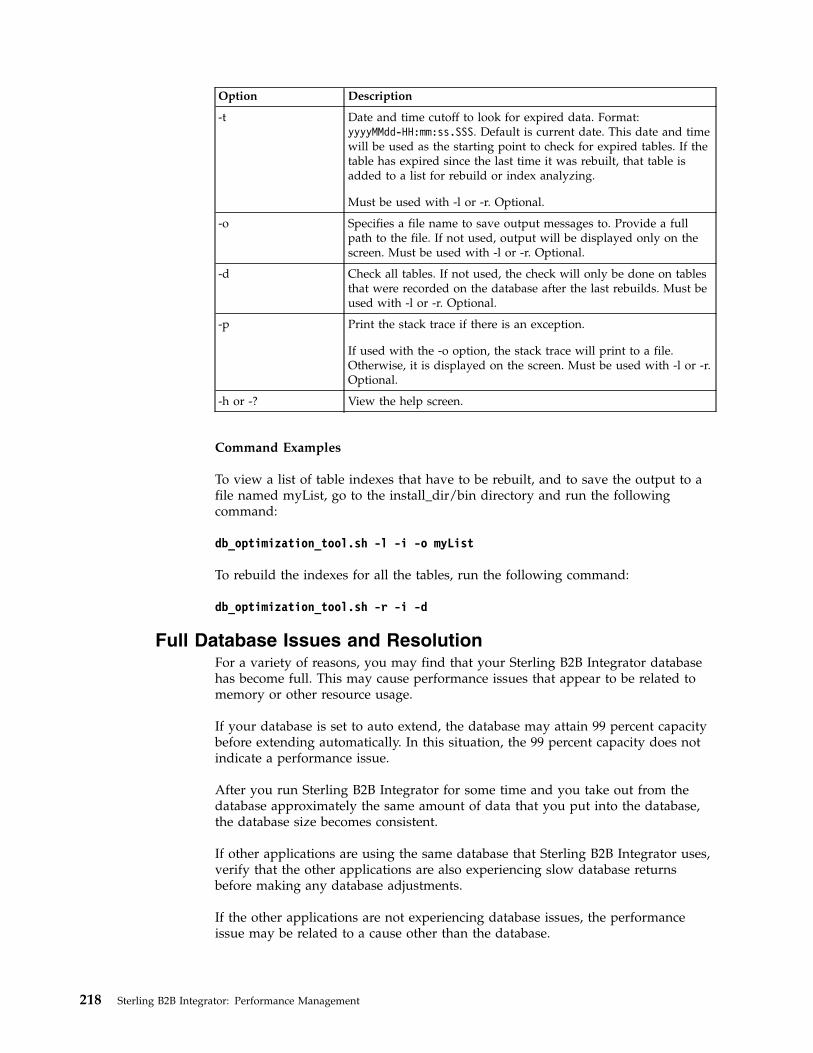
Option Description
-t Date and time cutoff to look for expired data. Format:yyyyMMdd-HH:mm:ss.SSS. Default is current date. This date and timewill be used as the starting point to check for expired tables. If thetable has expired since the last time it was rebuilt, that table isadded to a list for rebuild or index analyzing.
Must be used with -l or -r. Optional.
-o Specifies a file name to save output messages to. Provide a fullpath to the file. If not used, output will be displayed only on thescreen. Must be used with -l or -r. Optional.
-d Check all tables. If not used, the check will only be done on tablesthat were recorded on the database after the last rebuilds. Must beused with -l or -r. Optional.
-p Print the stack trace if there is an exception.
If used with the -o option, the stack trace will print to a file.Otherwise, it is displayed on the screen. Must be used with -l or -r.Optional.
-h or -? View the help screen.
Command Examples
To view a list of table indexes that have to be rebuilt, and to save the output to afile named myList, go to the install_dir/bin directory and run the followingcommand:
db_optimization_tool.sh -l -i -o myList
To rebuild the indexes for all the tables, run the following command:
db_optimization_tool.sh -r -i -d
Full Database Issues and ResolutionFor a variety of reasons, you may find that your Sterling B2B Integrator databasehas become full. This may cause performance issues that appear to be related tomemory or other resource usage.
If your database is set to auto extend, the database may attain 99 percent capacitybefore extending automatically. In this situation, the 99 percent capacity does notindicate a performance issue.
After you run Sterling B2B Integrator for some time and you take out from thedatabase approximately the same amount of data that you put into the database,the database size becomes consistent.
If other applications are using the same database that Sterling B2B Integrator uses,verify that the other applications are also experiencing slow database returnsbefore making any database adjustments.
If the other applications are not experiencing database issues, the performanceissue may be related to a cause other than the database.
218 Sterling B2B Integrator: Performance Management

Symptoms and Causes of a Full Database
The symptoms of a full database may include:v Database does not accept new data.v Database Usage Report shows that your database usage is increasing to capacity.v Sterling B2B Integrator interface is slow.v Business process execution times are slow.
Determining the cause of a full or filling database requires you to review yourbusiness processes and your archival and purging practices. Causes of a full orfilling database may include:v The database is not sized properly. Determine if the current database size
exceeds the expected size determined with your IBM Sales Representative at thetime of sales. (Customers must have this information in the form of a sizingsheet.)
v Persistence levels set to high globally in your business processes or for eachactivity in a business process, causing too much data to be persisted to thedatabase.
v Indexing business process is not working properly, causing no data to be flaggedfor archival or purging and no data being removed from the database. Theindexing business process runs every 10 minutes.
v Backup business process is not working properly, causing no data to be removedfrom the database and archived to another location. The archive business processchecks for the archive flag and then the date on which the archive is to becompleted. When the archive date is reached, the archive business processarchives the record.
v Purging business process is not working properly, causing no data to be purgedfrom the database. The purge business process checks for the purge flag andthen the date on which the purge is to be completed. When the purge date isreached, the purge business process purges the record from the database.
v Large or old files that can be archived elsewhere are being stored in thedatabase, causing the database to fill up.
v Size of the database is not optimized for your processing requirements, causingthe database to fill up prematurely.
v Data retention period is set too high, causing data to be kept in the databaselonger than necessary.
v Schedule_BPRecovery business process is either not running or failing, causingbusiness processes to remain in the database in an interrupted state.
v IndexBusinessProcess business process is either not running or failing, causingno business processes to be flagged for archival or purging.
v AssociateDocsToBP business process is either not running or failing, causingexpired documents to not be associated for being purged from the system.
To determine the cause of a full database:v Monitor the Database Usage Report in Sterling B2B Integrator to determine the
levels of database usage. If the usage level increases to the high end of itscapacity, you may need to take corrective action, unless you have your databaseset to auto extend (increase in capacity when a specified level is reached). Formore information about auto-extending your database, refer to thedocumentation pertaining to your database.
Performance Management 219

v Review the archive.log and database-specific log by navigating to Operations >System > Logs for information about archiving and purging activities anderrors.
Resolve Full Database Issues
Try the following approaches to resolve full database issues.
Approach Details
Change persistence levels For information about how to change persistence levels, referto the topic Changing Persistence Levels.
Complete indexingactivities
If your index business process is scheduled, but not running,no data is flagged for archival or purging, and your databasemay fill up. Review the index business process and verify thatthe schedule is defined and turned on in the business process,and that business processes are being indexed.
To verify that the index business process is running, reviewthe archive.log file for data that was purged or archived. Thislog file will state whether each data purge or data archive wassuccessful. If the archive.log file shows no data being archivedor purged, your index business process may not be running,causing your database to fill up.
If the index business process is running and failing, contactIBM Professional Services for assistance.
Complete archivingactivities
If your archival business process is scheduled, but is notrunning, your database can fill up because data is not beingarchived and moved off the database tables to another storagelocation. Review the archival business processes and verifythat the schedule is defined and turned on in the businessprocess, and that business processes are archived after areasonable amount of time.
To verify that the archival business process is running, reviewthe archive.log file for data that was purged or archived. Thislog file will state whether each data purge or data archive wassuccessful. If the archive.log file shows no data being archivedor purged, your archival business process may not be running,causing your database to fill up.
If the archival business process is running and failing, contactIBM Professional Services for assistance.
Complete purgingactivities
If your purging business process is scheduled, but is notrunning, your database can fill up because data is not beingremoved from the database tables. Review the purgingbusiness processes and verify that the schedule is defined andturned on in the business process, and that business processesare purged after a reasonable amount of time.
To verify that the purging business process is running, reviewthe archive.log file for data that was purged or archived. Thislog file will state whether each data purge or data archive wassuccessful. If the archive.log file shows no data being archivedor purged, your purging business process may not be running,causing your database to fill up.
If the PurgeService business process is running and failing,contact IBM Professional Services for assistance.
220 Sterling B2B Integrator: Performance Management

Approach Details
Complete Associate Docsto BP activities
If an associate document to BP business process is scheduledbut not running, your database can fill up because expireddocument data will not be associated to be removed.
Review the business processes and verify that the schedule isdefined and turned on in the business processes, and thatbusiness processes are purged after a reasonable amount oftime.
Reduce the amount oflarge or old data stored inthe database
If old data and large files are using database resources andcausing your database to fill up, archive those files to anotherfile system instead of to database tables.
Optimizing the Size ofYour Database
As your business and processing needs change, you may findthat your initial database size requirements are different fromyour requirements. If your database is filling and your volumeis increasing:
v Increase the size of your database to reflect your processingneeds.
v Compress your database, if your database has this feature,in order to save more data to the same size database.
For more information about compressing your database, referto your database documentation.
Optimizing the DataRetention Period
You may be retaining information in the database for longerperiods of time than necessary.
Set the data retention period in the database to lower levels asappropriate.
For more information about setting data retention periods inyour database, refer to your database documentation.
BPRecovery BusinessProcess is Not Running oris Failing
If your BPRecovery business process is either not running or isfailing:
1. Contact IBM Professional Services for assistance with theBPRecovery business process
2. Run the corrected BPRecovery.
3. Restart, resume, or terminate interrupted businessprocesses.
You can perform a mass termination of business processes ifmany are in an interrupted state.
Document Persistence
Sterling B2B Integrator offers two options for persisting documents: a databaseoption and a file system option. When dealing with database sizing, it is importantto understand these differences and ensure that you have chosen the correct optionfor your environment.v Database option – The payload of each document in the system is stored in the
DATA_TABLE or TRANS_DATA tables. When documents (payloads) becomelarge, it leads to inefficient use of database disk space and results in greatlyincreased network traffic.
v File system persistence option – This option was created to store the payload ofdocuments out on disk. For documents with file system persistence, theDATA_TABLE/TRANS_DATA tables are still utilized. The difference is that the
Performance Management 221

content of the BLOB data is not the payload, but a serialized Java HashMap thatcontains the file name of the payload. This is used to tie the file with thedocument.
Use of the database or the system for persisting the document payload is specifiedin the jdbc.properties file with the defaultDocumentStorageType property. Thissetting is the system default and can be inherited or overridden at the WFD(workflow definition) level. The location of document payloads is also configurablein the jdbc.properties file with the document_dir property.
Database Connection IssuesYou may find that your business process throughput slows down in Sterling B2BIntegrator during data bursts (sudden increase in data volumes) or connection orcursor leaks (unreleased database connections). These can also result in anincreased number of failed pool requests.
Symptoms and Causes of Failed Database Connection Requests
The symptoms of an increasing number of failed pool requests may include:v Slow business process throughput (volume being processed in a specific time
period).v Increasing number of failed pool requests as seen in the Database Usage Report
by navigating to Operations > System > Troubleshooter. This report shows thenumber of pool requests and failed requests.
Determining the cause of an increasing number of failed pool requests necessitatesyou to investigate many areas of the system and the way in which you areimplementing Sterling B2B Integrator. The causes of an increasing number of failedpool requests may include:v Increased data volume, causing more business processes to compete for the
connections.v Data bursts – High rates of data in short transmission periods.v Connection or cursor leaks – Database connections that are opened for a
business process and then kept open by that business process instead of beingreleased back to Sterling B2B Integrator for use by other business processes. Thisleads to fewer available connections to the database.
v Improperly tuned performance properties – Fewer database pools configuredthan is required by your processing volumes. For more information, refer to“View and Restore Performance Configuration Settings” on page 121.
To determine the cause of failed database connection requests:v Monitor the Database Usage report.v Monitor database tools specific to your database. For more information about
this, refer to your database documentation.
Monitor the Database Usage Report
This report shows the number of failed requests for each pool type. You can usethis information to determine which pool settings to change in the PerformanceTuning Utility.1. From the Administration menu, navigate to Operations > System >
Troubleshooter as shown in the following figure.
222 Sterling B2B Integrator: Performance Management

2. The System Troubleshooting page is displayed as shown in the followingfigure. Click Database Usage.
The Database Usage Report (details) is displayed, as shown in the following figure.
Performance Management 223

Resolve Database Connection Issues by Increasing the DatabasePool Size
You can change the size of the database pools to allow more connections to thedatabase and resolve the following issues:v Increased volume levelsv Data burstsv Connection or cursor leaks
To increase the size of specific database pools in Sterling B2B Integrator, navigateto Operations > System > Performance > Tuning.
For more information about increasing the database pool size, refer to“Performance Tuning Utility” on page 120.
Database Down CheckSterling B2B Integrator performs a scheduled check on the database connectionevery 120 seconds to verify that it has not gone down. These checks are performedby the DB Resource Monitor and are logged in the resource_monitor.log file.
224 Sterling B2B Integrator: Performance Management

If the check finds that the database has gone down, the system administrator issent an e-mail notification stating that the database is unreachable. The date andtime of the check is also provided as shown in the following example:Database UnreachableThe database was unreachable at 2005.07.19 14:29:36 EDT.E-mails will be sent at increasing intervals of1, 5, 15, 30, 45, and 60 minutes until Sterling B2B Integrator is shutdown or the database can be reached.Event Information:eventType: ResourceMonitor.DBResourceMonitor.ExceptionSQLException.3ExceptionLevel: Exceptionaltimestamp: 1121797776902datetime: 2005.07.19 14:29:36 EDTStatus: SQL Exceptionhost: myhostnode: node1subject: Database Server Unreachable (Node- node1 Host- myhost)
Additional e-mail notifications are sent at increasing intervals of 1, 5, 15, 30, 45,and 60 minutes unless Sterling B2B Integrator is shut down or the database can bereached. If the database can be reached, the system administrator is sent an e-mailnotification that the database connection was successful as shown in the followingexample:Database Connection SuccessfulDatabase was reachable at 2005.07.19 14:34:47 EDT.Event Information:eventType: ResourceMonitor.DBResourceMonitor.SUCCESS.1ExceptionLevel: Exceptionaltimestamp: 1121798087408datetime: 2005.07.19 14:34:47 EDTStatus: Successhost: myhostnode: node1subject: Database Connection Successful (Node- node1 Host- myhost)
Configure DB Resource Monitor
The DB Resource Monitor can be configured to perform the database down checkat intervals other than the default interval of every two minutes. To change theinterval, perform the following tasks:1. In the install_dir/properties directory, locate (or create, if necessary) the
customer_overrides.properties file.2. Open the customer_overrides.properties file using a text editor.3. Add the following override statement. This statement will set the value of the
DBResourceMonitor.delay property of the resource_monitor.properties file.resourceMonitor.DBResourceMonitor.delay=new_interval
The value for new_interval is the interval, in milliseconds, at which you wantthe database down check to run. For example, the default value of 120000 runsthe check every 120 seconds, or once every two minutes. If you want toconfigure the check to run every 10 minutes (as opposed to the default), youshould set the new_interval value to 600000 (600000 milliseconds = 600 seconds= 10 minutes). To do so, add the following line to thecustomer_overrides.properties file:resourceMonitor.DBResourceMonitor.delay=600000
4. Save and close the customer_overrides.properties file.5. Stop and restart Sterling B2B Integrator to use the new values.
Performance Management 225

For assistance in determining the proper settings to suit your business needs,contact IBM Customer Support.
Tracking JDBC ConnectionsSterling B2B Integrator provides the capability to track your JDBC connections.This is useful when troubleshooting high connection usage or running out ofconnections at the database. These problems may be caused by connection leaksthat occur when a component requests a connection from the pool and does notreturn it. When enabled, JDBC tracking will track all the active JDBC connections.
If JDBC tracking is enabled, you can view or save a JDBC report to help youtroubleshoot database connection problems. You can view the report to performtroubleshooting by yourself, or save the report and send it to IBM CustomerSupport to aid in resolving the problem. The JDBC report provides currentdatabase stack dump information at the time the JDBC report is viewed or saved.
Enable or Disable JDBC Tracking
JDBC tracking that is enabled through the JDBC Monitor will be reset to Disabledif Sterling B2B Integrator is restarted. This feature helps prevent degradedperformance if JDBC Tracking is accidentally left Enabled after you have finishedthe troubleshooting activity. You should always disable JDBC Tracking when youhave finished the troubleshooting activity.
To enable or disable JDBC tracking:1. From the Administration menu, select Operations > JDBC Monitor.2. To change the enable/disable state, select one of the following in the On/Off
box:v If JDBC tracking is disabled, click (Enable) to enable JDBC tracking.v If JDBC tracking is enabled, click (Disable) to disable JDBC tracking.
If you want to enable JDBC tracking for extended troubleshooting so that itremains enabled even if Sterling B2B Integrator is restarted, you can use theinternal use tracking parameter.
To control JDBC tracking with the use tracking parameter:1. Stop Sterling B2B Integrator.2. In the install_dir/properties directory, locate the jdbc.properties.in file.3. Open the jdbc.properties.in file using a text editor.4. In the jdbc.properties.in file, locate the use tracking parameter.v To enable JDBC tracking, set the databasePool.useTracking property to true.v To disable JDBC tracking, set the databasePool.useTracking property to false.
5. Save the jdbc.properties.in file.6. Restart Sterling B2B Integrator to apply the change.
Note: Always disable JDBC tracking when you have completed thetroubleshooting activity in order to improve performance.
View or Save a JDBC Report
To view or save a JDBC report:1. From the Administration menu, select Operations > JDBC Monitor.
226 Sterling B2B Integrator: Performance Management

2. In the View box, next to View JDBC Report, click one of the following:v To view a JDBC Tracking Report, click the View icon. Click F5 to refresh the
report, as needed.v To save a JDBC Tracking Report, click (Download).
Types of Cache MemorySterling B2B Integrator utilizes the memory cache types described in the followingtable to execute processes:
Memory Types Description
Soft reference cache When objects are removed from the memory cache in order to keepthe memory cache size constant, they are moved to a soft referencecache, which can grow or shrink based on the available memory. Ifthe JVM has to reclaim memory space, it takes it from the softreference cache.
Memory cache Uses the amount of memory necessary to hold the objects inmemory at all times. You can configure this in the noapp.propertiesfile.
Disk cache Objects can be read more quickly from the disk than from thedatabase. When objects are no longer in the soft reference cachebecause they have been garbage collected, the disk cache providesa faster access mechanism than object retrieval from the database.You can configure this in the noapp.properties file.
A soft cache is an in-memory cache. The difference between a soft cache and atraditional cache is that the memory used to cache the objects is reclaimed as soonas memory becomes constrained. When the system is low on memory, the cachedobjects are automatically removed from memory. This is possible because theobjects themselves are backed by persistent data in the database or disk and can bereread from there.
This behavior is similar to an operating system disk cache. The disk cache retainsrecently read files or sections of files in memory in order to speed up subsequentaccess to that data. However, if the system requires memory for applications torun, the cache size is reduced proportionally. You can see this in Windows bywatching the size of the disk cache fall when you open a large file.
Sterling B2B Integrator follows this practice with soft caches. Most soft caches inSterling B2B Integrator are implemented by Java Soft References.
JVM short-lived min/max memory values are used for generational garbagecollection. For more information about generational garbage collection, refer to thefollowing Web sites:v http://publib.boulder.ibm.com/infocenter/javasdk/v5r0/index.jsp?topic=/
com.ibm.java.doc.diagnostics.50/html/mm_gc_generational.htmlv http://java.sun.com/docs/hotspot/gc1.4.2/faq.html
Based on the amount of memory allocated to Sterling B2B Integrator and thenumber of CPUs, the Sterling B2B Integrator tuning wizard will allocate disk cacheand in-memory cache. In-memory cache is a combination of the soft referencecache and memory cache displayed on the cache usage screen.
Performance Management 227
Symptoms and Causes of Inefficient Cache UsageThe symptoms of inefficient use of cache include:v Slow-running business processesv Longer completion time for business processesv Reduced number of cache hits, as reported in the Cache Usage Report, with a
corresponding increase in the number of requests.
Determining the reasons behind the inefficient use of cache may require you toinvestigate many areas of your system and the way you are implementing SterlingB2B Integrator.
The reasons for inefficient use of cache may include:v Improperly tuned performance propertiesv High cache usage for less frequently used large objectsv Low cache usage for frequently used small objects
To determine the reason behind the inefficient use of cache, review the CacheUsage Report that is displayed in the System Troubleshooting (Operations >System > Troubleshooter) page for the number of counts, requests, and hits foreach cache in Sterling B2B Integrator.
An increase in the number of requests and a decrease in the number of hitsindicates that you have to increase the cache size for the affected cache. Eachrequest that is not met with a hit requires a call to the database for data, whichslows down the processing time and uses more resources, which could be used byother components of Sterling B2B Integrator.
For example, if the SchemaCache on the Cache Usage report has 5 counts, 5requests, and 0 hits, it indicates that the schema cache may be too small for thenumber of requests from the cache or too small for the size of the documents used.Zero hits means that the business processes requesting the schema from the cachedid not find the requested data and called the database to receive the schema data,which in turn slowed the processing time.
Resolving Inefficient Cache UsageFollowing are the different ways in which inefficient use of cache can be resolved,depending on the identified cause:v Improperly Tuned Cache Performance Propertiesv High Cache Allocation for Less Frequently Used Large Objectsv Low Cache Allocation for More Frequently Used Small Objects
For more information about changing the cache values in the Performance TuningUtility, refer to the topic Viewing or Editing Performance Configuration Settings.
For more information about changing the cache values manually using thenoapp.properties file, refer to the topic Manual Performance Tuning.
Improperly Tuned Cache Performance Properties
If you review the Cache Usage Report and notice that the number of requests areincreasing and the number of hits are decreasing for the same cache, increase thecache values using the Performance Tuning Utility, or manually increase the valuesin the install_dir/properties/noapp.properties file.
228 Sterling B2B Integrator: Performance Management
Following are the possible consequences of increasing the cache size:v Increasing the size too much does not make the system any more effective than
reading from the disk. Depending on your system and your configuration, youmay have to adjust the cache settings to attain peak performance without losingthe benefit of cache over disk.
v Increasing the cache sizes for items that are not used frequently may degradeperformance because more resources are allocated to the caches, but are notbeing used.
High Cache Allocation for Less Frequently Used Large Objects
If you review the Cache Usage Report and notice that the number of requests tothe cache are low, you can reduce the size of the cache values using thePerformance Tuning Utility, or manually decrease the values in theinstall_dir/properties/noapp.properties file. The low request number indicates thatthe objects in the cache are not used frequently with your business processes.Review the value for the cache property and reduce the cache size if the cache sizeis large.
Decreasing the cache size too much may cause a reduced number of hits to thecaches, which results in a call to the database for data, and increases the processingtime. Depending on your system and your configuration, you may have to adjustthe cache settings to attain peak performance without losing the benefit of cacheover disk.
Low Cache Allocation for More Frequently Used Small Objects
If you review the Cache Usage Report and notice that the number of requests tothe cache are high and the number of hits to the cache are low, you can increasethe size of the cache values using the Performance Tuning Utility, or manuallyincrease the values in the install_dir/properties/noapp.properties file. The highrequest number indicates that the objects in the cache are being used frequentlywith your business processes. Review the values for the cache properties andincrease the cache size if the cache size is small. This is especially important for thesmaller objects that are used frequently and are static in value. Cache retrieval isfaster than disk or database retrieval.
Increasing the cache sizes too much may cause a reduced number of hits to thecaches for larger objects. This results in a call to the database for data, andincreases the processing time. Depending on your system and your configuration,you may have to adjust the cache settings to attain peak performance withoutlosing the benefit of cache over disk.
Correcting Dropped Data ProblemsProper requirements planning and performance tuning usually prevent mostmemory-related issues from occurring. However, because it is not possible toanticipate every situation, you may occasionally experience a memory problem.Some of the more common issues are covered in this section. Whenever you adjustmemory allocations after initial performance tuning, you must increase thememory amount by the smallest increment to resolve the issue.
Because Sterling B2B Integrator interacts extensively with other systems,sometimes, problems with dropped data occur because of the configurationsettings of the other systems.
Performance Management 229

For example, when Sterling B2B Integrator is under sufficient load and requiresbusiness processes to be placed in queue, the HTTPSyncSend adapter attempts torespond with a Message Disposition Notification (MDN). If this is not completedin a timely manner, the client that initiated the session may release the connectionbecause of a timeout. If this occurs, the HTTPSyncSend operation appears tocomplete successfully by handing off to perimeter servers, but there is a possibilityof the data being dropped.
In this example, the timeout settings in the client can be adjusted to resolve theproblem. Alternatively, the amount of memory available to Sterling B2B Integratorcan be increased to allow the operation to be pulled from the queue and completedbefore the timeout occurs.
To increase the amount of memory available to Sterling B2B Integrator, use thePerformance Tuning wizard (Operations > System > Performance > Tuning) andchange the value in the Physical memory (MB) allocated to SI box to a highervalue. For more information about allocating physical memory to Sterling B2BIntegrator, refer to the topic Viewing or Editing Performance ConfigurationSettings.
Correcting Out-Of-Memory ErrorsOccasionally, a specific operation may require more memory than the currentconfiguration allocates to Sterling B2B Integrator. For example, with the defaultsettings, attempting to view a large code list (over 100,000 entries) may result in anOut-Of-Memory error. This type of error is typically written to the noapp.log file.
To increase the amount of memory available to Sterling B2B Integrator, use thePerformance Tuning wizard (Operations > System > Performance > Tuning) andchange the value in the Physical memory (MB) allocated to SI box to a highervalue. For more information about how to increase the memory available toSterling B2B Integrator, refer to the topic Viewing or Editing PerformanceConfiguration Settings.
Understanding Business ProcessYou may find that business process execution times are longer than expected,which might be the result of an increase in volume or improperly written businessprocesses. This indicates that either the performance does not match yourrequirements and corrective action is required, or that you have business processescontaining errors and require manual attention.
The following concepts are explained under this topic:v Symptoms and Causes of Poor Business Process Execution Timev Resolving Halted, Halting, Waiting, or Interrupted Business Processes
Symptoms and Causes of Poor Business Process ExecutionTime
There are many symptoms and causes of poor business process execution time.
Symptoms of increasing business process execution time include:v Performance Statistics Report showing the Min (ms), Max (ms), and Average
(ms) time increasing for business processes, activities, and internal systemactivities. To access this report, navigate to Operations > System > Performance> Statistics.
230 Sterling B2B Integrator: Performance Management

v Increasing business process execution time in the wf.log in the install_dir/logsdirectory.
Determining the cause of increasing business process execution time may requireyou to investigate many areas of the system and the way in which you areimplementing Sterling B2B Integrator.
Typically, the cause of increasing business process execution time is because of:v The database is full or is receiving too many requestsv Improperly designed business processes
Improperly designed business processes may involve the following issues:v Business process persistence levels are set too high, which causes too much data
to be stored to the database.For more information about persistence levels, refer to the topic ChangingPersistence Levels.
v Unnecessary service invocations, which use resources that can otherwise be usedby other Sterling B2B Integrator business processes or components.
v Improperly tuned cache properties, which cause the business process to querythe database or disk for information that can be provided in a queue.For more information about caches, refer to the topic Resolving Inefficient CacheUsage.
v A full database or database maintenance issues, which cause longer query timesand increased execution times.If you find that all your business processes are experiencing an increase inexecution time, you may also find that your database is full or is receiving manyrequests, causing the entire processing to slow down.
v Unnecessary loops, which cause the use of resources that can otherwise be usedby other Sterling B2B Integrator business processes or components.
v Improperly written XPath statements, which use resources that can otherwise beused by other Sterling B2B Integrator business processes or components.Use relative paths when writing XPath statements, for example, writePurchaseOrder/text instead of /ProcessData/PurchaseOrder/text().In addition, do not use // at the beginning of an XPath statement because thiscauses the entire process data to be searched, and slows down the search timesignificantly.
v Running services in modes other than the literal mode, which is significantlyfaster than the other modes available.
v Using older services and adapters instead of newer and more efficient ones,which may combine the functionality of more than one older service or adapterinto one service.
Note: Adapters and services that are retiring are placed on the Retiring stencilin the Graphical Process Modeler. Although adapters and services on theRetiring stencil are available for use, if you are designing new businessprocesses, use the newer adapters and services in your business processes.
Determining the Causes of Poor Business Process ExecutionTime
To determine the cause of increasing business process execution time:
Performance Management 231
v Review the wf.log file in the install_dir/logs file for time and date stampinformation showing increases in execution time, and errors in each businessprocess.
v Review the Performance Statistics Report by navigating to Operations > System> Performance > Statistics. This report shows the number of invocations andprocessing time for each business process and system activity.
v Review business processes that show increasing execution time for improperdesign, mode, or XPath statements, for example, using a Command Line adapterto retrieve data instead of a File System adapter. The Command Line adapteruses more resources than the File System adapter, which can accomplish thesame goal in some situations. Or, in some situations, you can create an XPathstatement in an Assign service, which will replace the need for both theCommand Line adapter and the File System adapter.Also, use relative paths in XPath statements. For example, writePurchaseOrder/text instead of /ProcessData/PurchaseOrder/text(). In addition,do not use // at the beginning of an XPath statement because this causes theentire process data to be traversed.
Resolving Halted, Halting, Waiting, or Interrupted BusinessProcesses
A business process in a Halting, Halted, Interrupted_Man, or Interrupted_Autostate requires immediate attention because the business process has stoppedprocessing. Business processes remain in a halted or interrupted state until someaction is taken on the business process. Business processes that fail receive a stateof Halted, which enables you to take manual corrective action without the businessprocess being archived or purged.
When you notice a halted or interrupted business process, you have two options:v Terminate the business process.v Restart the business process.
When you notice a business process in a waiting state, you have three options:v Allow the business process to remain in the waiting state if it is waiting on one
of the following:– Resources– A service or activity that is disabled, but will be enabled
v Terminate the business process.v Restart the business process.
The following sections show how to diagnose and resolve issues with halting,halted, waiting, or interrupted business processes:v Symptoms of Halting, Halted, Waiting, or Interrupted Business Processesv Causes of Halting, Halted, Waiting, or Interrupted Business Processes
Symptoms of Halting, Halted, Waiting, or Interrupted BusinessProcesses
Symptoms of an increasing number of business processes in a halting, halted,waiting, or interrupted state may include:v Slow system performance
For more information on resolving a slow system, refer to the topic “SlowSystem: Symptoms, Causes, and Resolution” on page 234.
232 Sterling B2B Integrator: Performance Management

v The database is getting full or having performance issues.For more information on resolving a database issues, refer to the topic “FullDatabase Issues and Resolution” on page 218.
v Business processes complete with errors, which places them in a halted state.v Business Process Usage report shows an increasing number of business processes
in a halted, halting, waiting, or interrupted state.
Causes of Halting, Halted, Waiting, or Interrupted BusinessProcesses
Causes of an increasing number of business processes in a halting, halted, waiting,or interrupted state may include:v System, business process, or activity schedules are disabled. For example, if a
business process requires an output from, or access to, a different service orbusiness process that is scheduled to work, but the schedule is not turned on,this places the business process in a halted or waiting state.
v System errors. For example, Java, JVM, out of memory errors, or operatingsystem errors may cause a business process to halt or be interrupted. Checkyour business process logs for causes of the halted or interrupted businessprocesses. If the logs show JVM errors, Java errors, or operating system errors,review your operating system documentation for resolutions.
v Improperly designed business processes. For example,– Using the Wait service in a business process for time periods of less than one
minute, instead of using the Sleep service. This can cause a business processto be placed into a waiting state instead of an active state, until the Waitservice completes.
– Using Produce and Consume services instead of the Invoke Subprocessservice to invoke subprocesses. Using Produce and Consume services places abusiness process into a waiting state, waiting for the Produce service to createthe document and for the Consume service to use the document.
v Sterling B2B Integrator stops running. For example, your site experiences apower outage and you must restart Sterling B2B Integrator after power isrestored. Your business processes at the time of the power outage may be inhalted, interrupted, or waiting states after the recovery operations run,depending on the activities being completed at the time of the outage.
To determine the cause of an increasing number of business processes in a halting,halted, waiting, or interrupted state:v Review the Business Process Usage report on the Operations > System >
Troubleshooting page. This report shows the number of business processes inthe different states. You can click the number next to the state to view detailedinformation about the process, which may help troubleshoot any problems.
v Review applicable system and business process schedules to verify that they areturned on. For example, if you notice many business processes are halting andeach of these business processes is dependent on the schedule of anotherbusiness process or service, this indicates that the scheduled business process orservice may not be turned on.
v Review the Performance Statistics report for information related to the businessprocess execution times. Increasing execution times for key business processes oractivities may indicate that a business process is not efficiently designed, or thata resource leak may have occurred.For more information about the Performance Statistics report, refer to thetopic“Turning On and Turning Off Performance Statistics” on page 213.
Performance Management 233

v Review appropriate log files in the Operations > System > Logs page. Thefollowing log files may provide troubleshooting information:– archive.log – Provides information about successful and unsuccessful
archiving and purging activities.– wf.log – Provides information about business process states, errors, and
processing.– Adapter and service logs – Provide information on specific adapter or service
activities and errors.– system.log – Provides information about the general system.– noapp.log – Provides information about ASI (application server-independent)
activity. Review business processes to verify that they are effectively designedto meet your business needs.
Slow System: Symptoms, Causes, and ResolutionYou may find that your Sterling B2B Integrator is working slowly because of avariety of reasons.
An increase in volume or improperly designed business process may cause slowerthan expected performance.
The symptoms of a slow system include:v Slow transaction processingv Unusually long delay in starting a business processv Unusually large number of business processes waiting in the queuesv Slow user interface log inv Slow business process searchesv Slow system services, such as indexing and purgingv Slow user interface performance
Potential Causes of a Slow System
A slow system can be caused by many areas of your system and the in which wayyou are implementing Sterling B2B Integrator.
Potential causes of a slow system include:v Improperly designed business processes.v Various system services being turned off. For more information about turning off
system services, refer to the topic "Disabled Service".v Improperly tuned performance properties. For more information about tuning
performance properties, refer to the topic "Improperly Tuned PerformanceProperties".
Determining the Cause of a Slow System
To determine the cause of a slow system, complete some, if not all, the followingtasks, depending on your situation:v Review your operating system and database performance if other applications
are using these resources. If other applications using the same resources areslow, it indicates that the performance issue is not specific to Sterling B2BIntegrator. Review your operating system or database applications forperformance issues.
234 Sterling B2B Integrator: Performance Management

v Review the log files for errors and processing information. If your system isslow, good places to start troubleshooting are the system.log and the noapp.login the install_dir/logs directory.For more information about logs and system information, refer to the topicManaging System Logs and Reviewing System Information.
v Review the Sterling B2B Integrator Internal System Statistics Report bynavigating to Operations > System > Performance > Statistics.This report shows the number of invocations and the processing time taken foreach business process and system activity. You can use this information toidentify activities that are slowing down and impacting performance.For more information, refer to the topic Manage Performance Statistics.
v Perform a thread dump to identify business process bottlenecks in Sterling B2BIntegrator.For more information about thread dumps, refer to the topic Conducting aThread Dump.
Resolving a Slow System
A system may have slowed down because of the following reasons:v Improperly Designed Business Processesv Disabled Servicev Improperly Tuned Performance Properties
Improperly Designed Business Processes
Improperly designed business processes can cause performance issues withSterling B2B Integrator. These issues can be averted or resolved by implementingwell-designed business processes.
Disabled Service
If a service that Sterling B2B Integrator uses for processing is disabled, thefollowing issues may arise:v Business processes may start to fail or wait until the service becomes available.v Indexing, archiving, or purging activities may not occur, causing the database to
fill up.
Both these issues cause your system to run slowly.
For example, if the index service is disabled, the data in the database cannot beflagged for archiving or purging. If the index service is disabled, archiving andpurging activities may run, but no data is archived or purged. This results in thedatabase storing too much information and slowing your system.
To resolve this issue, start the disabled service.
Improperly Tuned Performance Properties
Sterling B2B Integrator may run slowly if you have not tuned the systemperformance using the Performance Tuning Utility or have manually tuned thesystem performance in the install_dir/properties/noapp.properties file.
Performance Management 235
To resolve this, you may have to make changes to the appropriate performancetuning properties either manually or using the Performance Tuning Utility. Formore information about performance tuning, refer to “Performance Tuning Utility”on page 120 or Manual Performance Tuning.
Performing a Thread DumpA thread dump is a snapshot of every thread that is running in Sterling B2BIntegrator at the time the thread dump is generated. You can perform a threaddump to determine bottlenecks in Sterling B2B Integrator.
Typically, problem threads are in a state of waiting. Threads with a state ofrunnable or R indicate a healthy thread.
For information about the different states of a thread dump, refer to the topic"Reading a Thread Dump."
The subsequent sections describe command-line methods for working with threaddumps. You can also work with thread dumps from the user interface by accessingthe JVM Monitor page that is available by navigating to Operations > System >Performance > JVM Monitor.
Note: The JVM Monitor page is available only for Linux, IBM AIX, Sun Solaris,and HP-UX platforms. The heap dump option is available only on Linux and AIXplatforms.
The JVM Monitor page enables you to:v Perform a thread dump.v Download and delete the dumps that are conducted from the system.v Enable GC (garbage collector) output. Enabling causes the GC output to be
written into the noapp.log.v (Linux and AIX only) Enable or disable heap dumps. Enabling causes a heap
dump to be generated along with thread dumps.
Tip: For the Command Line Adapter 2 (Version 5.2.4.1 and interim fix 5.2.4.1_2 orlater), when you use Operations > System > JVM Monitor > Take Thread Dump,the default Command Line Adapter 2 must match the CLA2_PORT in thesandbox.cfg to take thread dumps from the User Interface. You can also use thecommand line to take a thread dump with the shell script.
Performing a Thread Dump in UNIX (HP-UX or Sun Solaris)
To perform a thread dump in UNIX (HP-UX or Sun Solaris):1. Access the computer on which Sterling B2B Integrator is installed.2. Change your working directory to install_dir.3. In the command line, enter cat noapp.pid.
This lists the parent thread process ID.4. Enter ps -ef | grep noapp.pid.
This returns all the child process IDs associated with the parent process ID.5. Enter kill -QUIT noapp.pid child.pid.
(You must include both the parent PID and the child PID.)6. The thread dump is placed in the noapp.log file in the install_dir/logs directory.
236 Sterling B2B Integrator: Performance Management

Performing a Thread Dump in UNIX (IBM AIX)
To perform a thread dump in IBM AIX:1. Access the computer on which Sterling B2B Integrator is installed.2. Change your working directory to install_dir directory.3. In the command line, enter cat noapp.pid.
This lists the parent thread process ID.4. Enter ps -ef | grep noapp.pid.
This returns all the child process IDs associated with the parent process ID.5. Enter kill -QUIT noapp.pid child.pid.
(You must include both the parent PID and the child PID.)The thread dump is placed in the javacore*.txt file in the install_dir/noapp/bindirectory.
Performing a Thread Dump in Linux
To perform a thread dump in Linux:1. Access the computer on which Sterling B2B Integrator is installed.2. Change your working directory to install_dir directory.3. In the command line, enter kill -QUIT noapp.pid child.pid.
(You must include both the parent PID and the child PID.)The thread dump is completed. Depending on your JVM, the thread dump isplaced in one of the following locations:v noapp.log in the install_dir/logs directoryv javacore*.txt
Performing a Thread Dump in Windows
To perform a thread dump in Windows:1. Navigate to install_dir\bin directory.2. Run hardstop.cmd command to stop Sterling B2B Integrator.3. Run the start_si_console.cmd command from the install_dir\bin directory. It
will run Sterling B2B Integrator in console mode.Running the start_si_console.cmd command does not start Sterling B2BIntegrator services. It will run Sterling B2B Integrator services in a series ofcommand prompt windows, which cannot be closed while it is running. Youcan track the progress by watching si_exe.log as running this command takeslonger time for Sterling B2B Integrator to start.
4. Perform a thread dump using the following steps:v Go to the start_noapp_console.cmd command prompt window.v Press Ctrl + Break.v Open the noapp_exe.log file in the install_dir\logs directory and scroll to the
bottom.v Verify that the thread information is present in the log file.
Performing a Thread Dump in IBM iSeries®
To perform a thread dump in iSeries:1. Access the computer on which Sterling B2B Integrator is installed.
Performance Management 237

2. In the iSeries command line, enter WRKACTJOB.3. Locate the two QP0ZSPWP jobs that are running in Sterling B2B Integrator and
note the name of the user associated with these jobs.4. Press F11 twice to locate the job numbers.5. In the iSeries command line, enter DMPJVM and press F4.6. In the Dump Java Virtual Machine (DMPJVM) panel, enter QP0ZSPWP as the
job name and user as the user prompt and jobnumber as the number prompt.7. Press Enter. The thread dump is completed.8. Repeat step 6 for the second job number.9. In the command line, enter WRKSPLF and locate the two QDMPJVM spooled
files. These files are the output from your thread dump.
Reading a Thread Dump
A thread dump contains the following components:v List of all the threads running in a virtual machine.v List of all the created monitors, including the current owner and number of
threads waiting for that monitor to be released.v List of all the special monitors used internally in the virtual machine.
Each thread has an associated state. The following states may be associated with athread:v Other than IBM JVMs:
– runnable – Running or executable thread.– object.wait () – Thread is waiting on a condition variable.
v For IBM JVM:– R – Running or executable thread.– S – Suspended thread.– CW – Thread is waiting on a condition variable.– MW – Thread is waiting on a monitor lock.– MS – Thread is suspended waiting on a monitor lock. An MS state indicates a
virtual machine error.
The following example shows a thread in a runnable state and a thread in awaiting state:"RMI TCP Accept-0" daemon prio=5 tid=0x015931f0 nid=0x1arunnable [bbbff000..bbb ffc28]at java.net.PlainSocketImpl.socketAccept(Native Method)at java.net.PlainSocketImpl.accept(PlainSocketImpl.java:353)- locked <0xcc709620> (a java.net.PlainSocketImpl)at java.net.ServerSocket.implAccept(ServerSocket.java:448)at java.net.ServerSocket.accept(ServerSocket.java:419)at sun.rmi.transport.tcp.TCPTransport.run(TCPTransport.java:334)at java.lang.Thread.run(Thread.java:534)"RMI RenewClean-[10.117.2.193:58586,com.sterlingcommerce.woodstock.util.frame.jndi.AddrClientFactory@c837cd]"daemon prio=5 tid=0x00b5f6f8 nid=0x13 in Object.wait()[bc97f000..bc97fc28]at java.lang.Object.wait(Native Method)- waiting on <0xcc709728> (a java.lang.ref.ReferenceQueue$Lock)at java.lang.ref.ReferenceQueue.remove(ReferenceQueue.java:111)
238 Sterling B2B Integrator: Performance Management

- locked <0xcc709728> (a java.lang.ref.ReferenceQueue$Lock)at sun.rmi.transport.DGCClient$EndpointEntry$RenewCleanThread.run(DGCClient.java:500)at java.lang.Thread.run(Thread.java:534)
Scenario-Based Troubleshooting Tips and TechniquesThis topic contains a list of scenario-based troubleshooting tips and techniques.This list is not exhaustive and does not cover all scenarios.
Situation Explanation/Resolution
During Oracle RACfailover, DMI visibilitytakes time to recoverunder high volumetest when defaultqueue sizes andthread counts areused.
You can increase the number of visibility queues and event inputqueue capacity in customer_overrides.properties to ensure thatadapters are responsive.
To increase the default queue size and the thread counts, performthe following tasks:
1. In the customer_overrides.properties file, set the followingvalues:
v dmivisibility.number_visibility_threads=6
v dmivisibility.event_input_queue_capacity=3072
2. From the install_dir/bin directory, run one of the followingcommands:
v (UNIX or Linux) setupfiles.sh
v (Windows) setupfiles.cmd
3. Restart Sterling B2B Integrator.
Performance Management 239

Situation Explanation/Resolution
While running Oracle11g in non-RAC orRAC environment,you might encounterindex hot spots,which may causeperformancedegradation.
It is recommended that you create the following indexes in aglobal partition to improve system performance:Note: If you have not deployed Sterling File Gateway in yourenvironment, you can ignore the indexes starting with the nameFG.
v PERF_IDX_1 : WORKFLOW_CONTEXT (BASIC_STATUS,START_TIME, WORKFLOW_ID, WFD_ID)
v PERF_IDX_2 : WORKFLOW_CONTEXT (START_TIME,WORKFLOW_ID, STEP_ID, ACTIVITYINFO_ID, WFD_ID)
v PERF_IDX_3 : WORKFLOW_CONTEXT (WFD_ID,START_TIME, WORKFLOW_ID, STEP_ID, ACTIVITYINFO_ID)
v SCI_IDX_125 : WORKFLOW_CONTEXT (WFD_ID,WFD_VERSION)
v SCI_IDX_195 : WORKFLOW_CONTEXT (END_TIME, WFD_ID,WFD_VERSION, STEP_ID)
v SCI_IDX_3 : WORKFLOW_CONTEXT (WORKFLOW_ID)
v PERF_IDX_4 : WORKFLOW_CONTEXT (WORKFLOW_ID,START_TIME, STEP_ID, ACTIVITYINFO_ID, WFD_ID)
v SCI_IDX_120 : WORKFLOW_CONTEXT (WORKFLOW_ID,BASIC_STATUS, NEXT_AI_ID, ACTIVITYINFO_ID,ARCHIVE_FLAG)
v SCI_IDX_109 : WORKFLOW_CONTEXT" (WORKFLOW_ID,BRANCH_ID)PERF_IDX_5 : EVENT (EXPIRES_AT)
v SCI_IDX_56_2 : TRANS_DATA (WF_ID)
v SCI_IDX_DMI17 : ACT_SESSION (CON_END_TIME,PROTOCOL, SESSION_ID, ADAPTER_NAME)
v FG_RTE_MODTS_IDX : FG_ROUTE_EVENT (MODIFYTS)
v FG_TEA_EVTKEY_IDX : FG_EVENTATTR (EVENT_KEY)
v FG_RE_DF_IDX : FG_ROUTE_EVENT (DATA_FLOW_ID)
Note: If there are any changes in a patch for the partitionedindexes, the patch installation will drop the index and create anon-partitioned index, treating it as a normal index. You shouldanalyze the indexdrop SQL's and recreate the partitioned indexesagain if they have changed.
The following example explains the procedure to drop an indexand create the same in a global partition:
1. To drop index PERF_IDX_1, run the following sql command:
drop index PERF_IDX_1 ;
2. Create the PERF_IDX_1 in global partitions by running thefollowing command:
create index PERF_IDX_1 on WORKFLOW_CONTEXT(BASIC_STATUS,START_TIME,WORKFLOW_ID,WFD_ID) globalpartition by hash(BASIC_STATUS,START_TIME,WORKFLOW_ID,WFD_ID) partitions16 store in (SI);
240 Sterling B2B Integrator: Performance Management
Situation Explanation/Resolution
In some cases,perimeter servicesmay fail with thefollowing error. Theerror will be recordedin the perimeterservices log(perimeter.log).
You can improve the situation by reducing high timeout values incommunications adapters and by increasing the delayed eventqueue size (delayed.event.queue.size) in perimeter.properties file.
The default value of the delayed.event.queue.size property is30000. You can increase the value based on your requirement.
Performance and Tuning WorksheetThe Performance and Tuning Worksheet can assist you in tuning Sterling B2BIntegrator for optimal performance.
It helps you take an inventory of the different parts of your installation that affectperformance.
Note: This worksheet is optional. It does not replace the Sterling B2B IntegratorSystem Requirements documentation that you used to install Sterling B2B Integrator.
Use the Performance and Tuning Worksheet to help you determine your hardwarerequirements according to your processing volumes, operating system, hardwarevendor, and number of CPUs you are running.
Request Description Your Answer
How many processing days are therein a month?
Enter the number of processing days ina month. Use 30 days as an average.This gives 5 days of maintenance timethroughout the year.
How many processing hours are therein a day?
Enter the number of hours you allowfor processing all the data.
How many translations are required foreach transaction?
Enter the largest number of translationsyou will have if multiple translationsare required for a business process. Forexample, is data mapped to a commonformat, and is the common format usedto interface with all the externalsystems?
Is content-based routing required? If content-based routing is required inyour business processes, you requiremaps, XML encoder, BPML choice,assigns, adapters that are used forrouting, and possibly othercomponents.
Does the content of a transaction haveto be verified?
This requires translating data intoXML. The data will then have to be putin process data and verified usingXPath.
Performance Management 241

Request Description Your Answer
What percentage of the content of thetransaction should be verified?
Typically, only a small part of atransaction has to be verified. However,if most of a transaction requiresverification, you may have significantresources depending on the verificationpath.
How many rules have to be applied toverify the content?
This is used to calculate the ServiceLatency.
How many content elements have to beverified?
Enter the number of elements that haveto be verified.
What is the future system growth rate? Current daily volume addition in thefuture. The default for the currentvolume is 1. For example, 2 means100% growth or doubling the systemrequirements.
What is the business processpersistence level that is required?
Enter the level of persistence (storageto the database) you require for yourbusiness process.
Choices include:
v Full – Saves a complete copy ofprocess data along each step of theprocess.
v Minimal – Saves all the steps in abusiness process and selected copiesof process data.
v None – Saves the first and the laststep of a business process, steps withan override persistence level, andselected steps in business processdata.
What is the average business processsize (KB)?
Unless you are very experienced andunderstand business process context,enter 3.5.
Who is the hardware vendor hostingSterling B2B Integrator?
Enter the hardware vendor's name, forexample, IBM, Sun, HP, or Dell.
What is the speed of CPUs in the host? Enter the speed in MHz, for example,450, 1900 (1.9 GHz).
What is the number of CPUs in thehost?
Enter the number of CPUs installed orthe number you plan to install.
What is the amount of main memoryin the host (RAM)?
Enter the amount of memory in MB,for example, 500 MB, 2048 MB.
What is the operating system that youare using to host Sterling B2BIntegrator?
Enter the host operating system, forexample, Solaris, Windows Server®
2008, AIX, or Linux.
What is the operating system releaseand version number?
For example, Red Hat EnterpriseLinux, Release 5, or Windows Server®
2008 Server Standard Edition R2.
242 Sterling B2B Integrator: Performance Management

Request Description Your Answer
What are the JVM version numbers? For example, IBM JDK 1.6.0 SR8 (64bit) build pxa6460sr8-20100409_01(SR8).
Your JVM version must match therequirements for your version ofSterling B2B Integrator. The build dateand lower release numbers must alsomatch.
What are the Sterling B2B Integratorversion and patch numbers?
Enter the version and patch number foryour copy of Sterling B2B Integrator.
Who is your relational databasevendor?
Enter the name of the relationaldatabase vendor Sterling B2B Integratoruses, for example, MySQL, Oracle, orDB2.
What is the relational database versionand patch number?
Enter the version number and patchnumber of the relational database.
What are the other businessapplications that have to be integratedwith?
Enter the vendor name of the otherbusiness applications that you use inyour business, for example, SAP orPeopleSoft. This helps determine whichadapters and services you require tocomplete processing.
What are the other businessapplications' version number and patchnumber?
Enter the version number and patchnumber of the other businessapplications.
What data format do you use toexchange data with the other businessapplications?
Enter the different data formats thatyou use to exchange data with theother business applications, forexample, XML or IDOC. This helpsdetermine the amount of translationprocessing that may be needed toincrease system resource requirements.
What type of inbound transactions doyou have?
Enter the types of inbound transactionsthat Sterling B2B Integrator willprocess.
What is the average size of eachinbound transaction type?
Enter the average size of your inboundtransactions that Sterling B2BIntegrator will process. Base yourplanning on the larger transactions atpeak times for better performance.
How many of each inbound transactiontype do you receive daily?
Enter the number of each inboundtransaction type received by you daily.This helps determine the processingvolumes.
What is the sum total size of eachinbound transaction type?
Enter the sum total of each inboundtransaction type. This helps indetermining the processing volumes.
What is the average number of files ineach inbound transaction by type?
Enter the average number of files ineach inbound transaction type. Thishelps determine the processingvolumes.
What types of outbound transactionsdo you have?
Enter the types of outboundtransactions that Sterling B2BIntegrator will process.
Performance Management 243

Request Description Your Answer
What is the average size of eachoutbound transaction type?
Enter the average size of each of youroutbound transactions that Sterling B2BIntegrator will process. Base yourplanning on the larger transactionsduring peak periods for betterperformance.
How many of each outboundtransaction type do you receive daily?
Enter the number of each outboundtransaction type received by you daily.This helps in determining theprocessing volumes.
What is the sum total of each outboundtransaction type?
Enter the sum total of each outboundtransaction type. This helps indetermining the processing volumes.
What is the average number of files ineach outbound transaction by type?
Enter the average number of files ineach outbound transaction type. Thishelps determine processing volumes.
workflowLauncher: Running a Business Process from a CommandLine
About this task
Sterling B2B Integrator provides a utility called workflowLauncher that allows youto launch a business process from a command line. The utility launches a businessprocess and provides the status when it has completed, or when a timeout hasoccurred (whichever comes first).
To launch a business process from a command line:
Procedure1. Change to the install_dir/bin directory.2. Run one of the following commands:v (For UNIX) - ./workflowLauncher.sh -n BPname [option(s)]v (For Windows) - workflowLauncher.cmd -n BPname [option(s)]
BPname is the name of the business process you want to launch. The availableoptions are listed in the following table:
Option Description
-n BPname Specifies the name of the business process definition to launch.Mandatory.
Example: workflowLauncher.sh -n testBP
An error will be generated if the business process name is notprovided.
-s Specifies Silent mode. Optional. In Silent mode, less informationabout the business process is output to the standard output.Default is Verbose mode.
244 Sterling B2B Integrator: Performance Management

Option Description
-u username Specifies the user name from which to include the userToken.Optional.
Example: -u username
This parameter is used to specify the user token of the businessprocess.
-d directory Specifies the output directory. Optional.
Example: -d absolutePath/directory
Used in conjunction with the -t parameter when you generate stepXML trace files. This is used to set the directory output of the tracefiles.
-t Turns on step XML trace generation. Optional. Used in conjunctionwith the -d parameter when you want to generate XML trace files.
By default, the trace file name will be prefixed with the businessprocess ID. To turn this feature off, use the -o parameter.
-o Used to prevent prefixing the trace file name with the businessprocess ID when generating step XML trace files. Optional.
-v versionNumber Specifies a specific version of the business process definition tolaunch. Optional.
Example: -v business_process_version_number
The version number is not the user description string. It is theinternal running number (a positive integer) that is automaticallyincremented each time you check in a new version of the samebusiness process (as described using the Graphical Process Modelerand/or XML). If there is only one version, the version number willbe 1. An error will be generated if the version number is notfound.
You can view the version number by resting your mouse on, orclicking the information icon for the business process in theChange History section of the Sterling B2B Integrator BusinessProcess Source Manager.
-f inputFile Specifies a file to use as the primary document when launching thebusiness process. Optional.
Example: -f path/filename
Only one file is allowed. An absolute path or a relative path to thefile may be used. To specify the encoding of the file, use the -eparameter.
An error will be generated if the file is not found.
-e encoding Specifies the encoding of the primary document. Optional.
Example: -e encodingName
Used in conjunction with the -f parameter.
To see what encoding names are supported, see theencodings.properties file in the install_dir/properties directory. Thefull listing is shown in the encodings_large.properties file.
Performance Management 245

Option Description
-w count Specifies the number of times to sleep. Default is 10.
Example: -w count
Used in conjunction with the -i parameter to define the totaltimeout value. For an example showing the total timeout value, seethe -i parameter.
-i time Specifies the length of time, in milliseconds, to sleep. Default is3000 (3 seconds).
Example: -i time
Used in conjunction with the -w parameter to define the totaltimeout value.
For example, the default value for -i time is 3000 milliseconds andthe default value for -w count is 10. Therefore, the default timeoutvalue is 30,000 milliseconds (3000 milliseconds x 10), or 30 seconds.
-x Specifies not to return an exit code. Optional. By default, the utilityreturns an exit code.
-h | -? Displays the Help screen.
Exit Codes
The workflowLauncher utility returns the following exit codes:
Exit Code Description
0 The business process completed with success status.
1 The business process completed with error status.
99 The workflowLauncher utility reached timeout while waiting forstatus from the business process.
246 Sterling B2B Integrator: Performance Management
Notices
This information was developed for products and services offered in the U.S.A.
IBM may not offer the products, services, or features discussed in this document inother countries. Consult your local IBM representative for information on theproducts and services currently available in your area. Any reference to an IBMproduct, program, or service is not intended to state or imply that only that IBMproduct, program, or service may be used. Any functionally equivalent product,program, or service that does not infringe any IBM intellectual property right maybe used instead. However, it is the user's responsibility to evaluate and verify theoperation of any non-IBM product, program, or service.
IBM may have patents or pending patent applications covering subject matterdescribed in this document. The furnishing of this document does not grant youany license to these patents. You can send license inquiries, in writing, to:
IBM Director of Licensing
IBM Corporation
North Castle Drive
Armonk, NY 10504-1785
U.S.A.
For license inquiries regarding double-byte character set (DBCS) information,contact the IBM Intellectual Property Department in your country or sendinquiries, in writing, to:
Intellectual Property Licensing
Legal and Intellectual Property Law
IBM Japan Ltd.
19-21, Nihonbashi-Hakozakicho, Chuo-ku
Tokyo 103-8510, Japan
The following paragraph does not apply to the United Kingdom or any othercountry where such provisions are inconsistent with local law:INTERNATIONAL BUSINESS MACHINES CORPORATION PROVIDES THISPUBLICATION "AS IS" WITHOUT WARRANTY OF ANY KIND, EITHEREXPRESS OR IMPLIED, INCLUDING, BUT NOT LIMITED TO, THE IMPLIEDWARRANTIES OF NON-INFRINGEMENT, MERCHANTABILITY OR FITNESSFOR A PARTICULAR PURPOSE. Some states do not allow disclaimer of express orimplied warranties in certain transactions, therefore, this statement may not applyto you.
This information could include technical inaccuracies or typographical errors.Changes are periodically made to the information herein; these changes will be
© Copyright IBM Corp. 2000, 2015 247

incorporated in new editions of the publication. IBM may make improvementsand/or changes in the product(s) and/or the program(s) described in thispublication at any time without notice.
Any references in this information to non-IBM Web sites are provided forconvenience only and do not in any manner serve as an endorsement of those Websites. The materials at those Web sites are not part of the materials for this IBMproduct and use of those Web sites is at your own risk.
IBM may use or distribute any of the information you supply in any way itbelieves appropriate without incurring any obligation to you.
Licensees of this program who wish to have information about it for the purposeof enabling: (i) the exchange of information between independently createdprograms and other programs (including this one) and (ii) the mutual use of theinformation which has been exchanged, should contact:
IBM Corporation
J46A/G4
555 Bailey Avenue
San Jose, CA 95141-1003
U.S.A.
Such information may be available, subject to appropriate terms and conditions,including in some cases, payment of a fee.
The licensed program described in this document and all licensed materialavailable for it are provided by IBM under terms of the IBM Customer Agreement,IBM International Program License Agreement or any equivalent agreementbetween us.
Any performance data contained herein was determined in a controlledenvironment. Therefore, the results obtained in other operating environments mayvary significantly. Some measurements may have been made on development-levelsystems and there is no guarantee that these measurements will be the same ongenerally available systems. Furthermore, some measurements may have beenestimated through extrapolation. Actual results may vary. Users of this documentshould verify the applicable data for their specific environment.
Information concerning non-IBM products was obtained from the suppliers ofthose products, their published announcements or other publicly available sources.IBM has not tested those products and cannot confirm the accuracy ofperformance, compatibility or any other claims related to non-IBM products.Questions on the capabilities of non-IBM products should be addressed to thesuppliers of those products.
All statements regarding IBM's future direction or intent are subject to change orwithdrawal without notice, and represent goals and objectives only.
All IBM prices shown are IBM's suggested retail prices, are current and are subjectto change without notice. Dealer prices may vary.
248 Sterling B2B Integrator: Performance Management

This information is for planning purposes only. The information herein is subject tochange before the products described become available.
This information contains examples of data and reports used in daily businessoperations. To illustrate them as completely as possible, the examples include thenames of individuals, companies, brands, and products. All of these names arefictitious and any similarity to the names and addresses used by an actual businessenterprise is entirely coincidental.
COPYRIGHT LICENSE:
This information contains sample application programs in source language, whichillustrate programming techniques on various operating platforms. You may copy,modify, and distribute these sample programs in any form without payment toIBM, for the purposes of developing, using, marketing or distributing applicationprograms conforming to the application programming interface for the operatingplatform for which the sample programs are written. These examples have notbeen thoroughly tested under all conditions. IBM, therefore, cannot guarantee orimply reliability, serviceability, or function of these programs. The sampleprograms are provided "AS IS", without warranty of any kind. IBM shall not beliable for any damages arising out of your use of the sample programs.
Each copy or any portion of these sample programs or any derivative work, mustinclude a copyright notice as follows:
© IBM 2015. Portions of this code are derived from IBM Corp. Sample Programs. ©Copyright IBM Corp. 2015.
If you are viewing this information softcopy, the photographs and colorillustrations may not appear.
Trademarks
IBM, the IBM logo, and ibm.com® are trademarks or registered trademarks ofInternational Business Machines Corp., registered in many jurisdictions worldwide.Other product and service names might be trademarks of IBM or other companies.A current list of IBM trademarks is available on the Web at “Copyright andtrademark information” at http://www.ibm.com/legal/copytrade.shtml.
Adobe, the Adobe logo, PostScript, and the PostScript logo are either registeredtrademarks or trademarks of Adobe Systems Incorporated in the United States,and/or other countries.
IT Infrastructure Library is a registered trademark of the Central Computer andTelecommunications Agency which is now part of the Office of GovernmentCommerce.
Intel, Intel logo, Intel Inside, Intel Inside logo, Intel Centrino, Intel Centrino logo,Celeron, Intel Xeon, Intel SpeedStep, Itanium, and Pentium are trademarks orregistered trademarks of Intel Corporation or its subsidiaries in the United Statesand other countries.
Linux is a registered trademark of Linus Torvalds in the United States, othercountries, or both.
Notices 249

Microsoft, Windows, Windows NT, and the Windows logo are trademarks ofMicrosoft Corporation in the United States, other countries, or both.
ITIL is a registered trademark, and a registered community trademark of the Officeof Government Commerce, and is registered in the U.S. Patent and TrademarkOffice.
UNIX is a registered trademark of The Open Group in the United States and othercountries.
Java and all Java-based trademarks and logos are trademarks or registeredtrademarks of Oracle and/or its affiliates.
Cell Broadband Engine is a trademark of Sony Computer Entertainment, Inc. in theUnited States, other countries, or both and is used under license therefrom.
Linear Tape-Open, LTO, the LTO Logo, Ultrium and the Ultrium Logo aretrademarks of HP, IBM Corp. and Quantum in the U.S. and other countries.
Connect Control Center®, Connect:Direct®, Connect:Enterprise, Gentran®,Gentran®:Basic®, Gentran:Control®, Gentran:Director®, Gentran:Plus®,Gentran:Realtime®, Gentran:Server®, Gentran:Viewpoint®, Sterling Commerce™,Sterling Information Broker®, and Sterling Integrator® are trademarks or registeredtrademarks of Sterling Commerce®, Inc., an IBM Company.
Other company, product, and service names may be trademarks or service marksof others.
250 Sterling B2B Integrator: Performance Management

Index
Aactive threads 101activities
monitoring 94stopping 95
AE_ExecuteCycle 174AE_ExecuteCycleTime 174aftrouting.log 89alerterlogger.log 90AllowStealing 176analyzing log files 84archive.log 90ASI 173
performance tuning 166queue tuning 173queues 172
ASI queue 173ASM 46audit.log 93, 94auditing 93Authentication.log 92
BBackuplogs.log 92Basic Scheduling policy 172bizIntel.log 91BLOB 32bpdeadline.log 92business process
resolving 232halted 232halting 232interrupted 232waiting 232
business process execution timecauses 231improving 230symptoms
increasing 230business process threads 3
Ccache 3
determining cause of inefficiency 228disk 227inefficient 228memory 227soft 227symptoms of inefficiency 228
cache contentscompressing 180
cache usage 104CacheThreshold 175capacity requirements 14
example 15causes
slow system 234cdinterop_cdjava.log 90
cdinterop.log 90cdsp.log 90ceuinterop.log 90checklist
Sterling File Gateway 9Sterling Integrator 5
Clean-Up Processes Monitor 104cluster environment and JNDI 101cluster node status 3common3splogger.log 92compressing cache contents 180configuring
DB resource monitor 225DB2 35Microsoft SQL Server 51Oracle 22
console listenerenabling 186
Consume business process 96controllers 99creating
performance statistics report 214crypto.log 90cspftp.log 90csphttp.log 90
Ddatabase
buffer pool statistics 29connection issues 222
failed requests 222resolve 224
db_optimization_tool 217down 224full database
causes 219issues 218resolution 220symptoms 219
instance efficiency 29JDBC connections 226maintenance 214monitoring disk space 14optimizing 217planning 13statistics report 215storage 26
ASM 26raw disks 26tablespaces 27
DB2configuring 35connections 39event monitors 49indexes 51logs 47
LOGFILSIZ 48LOGPRIMARY 48LOGSECOND 48NUM_LOG_SPAN 48
DB2 (continued)monitoring 35, 48
snapshots 48parameters 38performance manager 50storage 44tablespaces 45volatile tables 51
deadlock 50, 53, 61, 72defrag 61delete.log 90deprecated resources
identifying 109monitoring 109
descriptorsfile 191, 193
file descriptors 166determining cause
inefficient cache 228slow system 234
directory naming convention 82disabling
perimeter server 106document persistence 221DTDs
repositories 185trusted domains 185
EebXML.log 90EDI 187edi.log 90EDIINT.log 90embeddedEngine.log 90EnableDeadlines 175enabling
console listener 186perimeter server 106
enveloping.properties.in 187event.log 91
FFair Share Scheduling policy 172file descriptors 191, 193file system 14
native 16ftp.log 91ftpclient.log 91
Ggarbage collection 62
example 62HotSpot 64tools 65
© Copyright IBM Corp. 2000, 2015 251

Hheap 70HotSpot JVM
garbage collectionGCViewer 65HPjmeter 66Java Garbage Collector 66visualgc 66
http.log 91httpclient.log 91
Iimproving business process execution
time 230indexes
DB2 51Microsoft SQL Server 60Oracle 31rebuild 31, 60
inefficient cacheresolving inefficiency 228
InitialCycles 176installation path 101interrupting threads 95
JJavaPriority 175JBOD 15JDBC
monitor 3JDBC tracking
disable 226enable 226
jdbc.properties.in 181, 226jetty.log 91JMX event listener 186jmx.log 91JNDI 101
contexts 182JNDI and cluster environment 101JVM 62
garbage collectionexample 62HotSpot 64HotSpot tools 65statistics 62
heap dumps 77heap memory 64HotSpot 63, 69, 70, 72
blocked thread 73deadlock 72tuning 63
Hprof 77IBM 78
parameters 78tuning 78
profiling 77version 62
JVM monitor 3
Llatency 1lifecycle.log 91listenerStartup.properties.in 186load 1log file
changing location 88naming convention 83types 89
logs 3analyzing 84changing system 185DB2 47naming conventions 82overview 82redo 25types 89viewing contents 83
Mmailbox.log 91manageability 14managing
performance statistics 203system logs 82
MaxPoolSize 173, 174MaxThreads 174MaxWaitTime 176memory in use 101Message monitor 3messages 3
monitoring 96mgmtdash.log 90Microsoft SQL Server
autogrow 57configuring 51dynamic management views 58indexes 60
rebuild 60maintenance plan 59Management Studio 57monitoring 51, 57performance monitor 58SQL Server Profiler 57storage 56system monitor 58table statistics 60tips 61
MinPoolSize 173, 175modifying log levels 85monitoring
activities 94AWR report 28database usage report 222DB2 35, 48deprecated resources 109disk space 14HotSpot JVM heap 70HotSpot JVM thread 70messages 96Microsoft SQL Server 51, 57node status 106Oracle 22threads 94, 95
Nnaming conventions 82noapp.log 92, 186noapp.properties_platform_ifcresources_ext 173,
176noapp.properties_platform_ifcresources_ext.in 185node monitoring status 106
Oocsp.log 91OdetteFTP.log 91oftp.log 91open file descriptors 166, 191, 193ops_exe.log 92ops.log 89opsSecurity.log 89opsServer.log 89Oracle
BLOB caching 32configuring 22indexes 31
rebuild 31monitoring 22table statistics 31undo changes 25
Pperformance concepts 1performance statistics
creating report 214managing 203turning on/off 213
Performance statistics report 3performance tuning 182
ASI 166document body serialization
threshold 181JNDI contexts 182manual 166methodology 4prerequisites 1queues 173Sterling e-Invoicing 193system logging 185worksheet 241
Performance tuning wizard 3performance. 14perimeter server
area on troubleshooting page 106disabling 106enabling 106
Perimeter.log 91persistence level 183pipeline.log 91planning worksheet
performance and tuningworksheet 241
platform.log 91Produce business process 96PSLogger 93
252 Sterling B2B Integrator: Performance Management

QQueueDepth 174queues
ASI 172
RRAID 15redo
file size 25logs 25
report.log 91requirements planning worksheet 4rescheduling 175ReschedulingInterval 175resolutions
cache 228slow system 235
ResourceAllocation 176resourcemonitor.log 91rnif.log 91rollback transaction errors 26run.sh 182
Ssap.log 91sapxi.log 91scalability 1, 14schedule.log 91ScheduleBackup.log 92schedulemonitor.log 91ScheduleStopOps.log 93scheduling policies 3scheduling policy
changing 172overview 172
SchedulingPolicyName 172schemas
repositories 185trusted domains 185
searching messages 97secureproxy.log 92security.log 91segment
orderdata 194
segment ordermaps 194
server sizing 14servers 99servicesctl.log 89setupfiles.cmd 181, 182, 186, 188setupfiles.sh 181, 182, 185, 186, 188sftpclient.log 92sftpserver.log 92si_exe.log 92slow system
causes 234determining cause 234resolutions 235resolving 229, 234symptoms 234
soft stop 110sql.log 92start time 99
starting system logs 85StartupPS.log 93startWindowsService.cmd 182state 101status viewing
system logs 82StealThreads 176stopping
activities 95system logs 85
stopping threads 95storage
DB2 44Microsoft SQL Server 56
survivability 14symptoms
cache 228slow system 234
system classpath 101system information 3system logs 3
managing 82modifying log level 85starting 85stopping 85turning on and off 85
system recovery 3System troubleshooting 3system troubleshooting page 98system.log 91, 92
TT-SQL 60tablespaces
DB2 45DMS 45SMS 45
thread 70blocked 73
thread dumpexample 70IBM iSeries 237Linux 237performing 71reading 238tools 72UNIX (HP-UX or Sun Solaris) 236UNIX (IBM AIX) 237Windows 237
Thread monitor 3Thread Monitor 94threads 3
interrupting 95monitoring 94, 95stopping 95viewing 95
throughput 1tracking.log 90trusted domains
DTDs 185schemas 185
tuning 173HotSpot JVM 63, 66IBM JVM 78
tuning.properties 177, 182tx.log 92
txtrace.log 92
Uui.log 91uptime 99
Vviewing
JDBC report 226log files 83server status 82service status 82threads 95
visibility.log 92
Wwait events 30webdav.log 92WebSphereMQSuite.log 92webx.log 92wf.log 90wfexception.log 90wfstatistics.log 90workflowLauncher 244workflows.properties file 181worksheet 241wsrm.log 92wssec.log 92
Index 253

254 Sterling B2B Integrator: Performance Management


IBM®
Product Number:
Printed in USA