Stereotypes in Retail Print Advertising: The Effects of .../67531/metadc3069/m2/1/high_res_d ·...
125
APPROVED: Dr. Barbara Coe, Major Professor Dr. Robert Pavur, Minor Professor Dr. Marla Royne Stafford, Committee Member Dr. Nancy Spears, Committee Member Dr. David Strutton, Chair of the Department of Marketing and Logistics Dr. Jared Hazelton, Dean of the College of Business Administration Dr. C. Neal Tate, Dean of the Robert B. Toulouse School of Graduate Studies STEREOTYPES IN RETAIL PRINT ADVERTISING: THE EFFECTS OF GENDER AND PHYSICAL APPEARANCE ON CONSUMER PERCEPTIONS Charlotte Allen, B.S., M.B.A. Dissertation Prepared for the Degree of DOCTOR OF PHILISOPHY UNIVERSITY OF NORTH TEXAS December 2001
Transcript of Stereotypes in Retail Print Advertising: The Effects of .../67531/metadc3069/m2/1/high_res_d ·...
APPROVED: Dr. Barbara Coe, Major Professor Dr. Robert Pavur, Minor Professor Dr. Marla Royne Stafford, Committee
Member Dr. Nancy Spears, Committee Member Dr. David Strutton, Chair of the
Department of Marketing and Logistics
Dr. Jared Hazelton, Dean of the College of Business Administration
Dr. C. Neal Tate, Dean of the Robert B. Toulouse School of Graduate Studies
STEREOTYPES IN RETAIL PRINT ADVERTISING: THE EFFECTS OF
GENDER AND PHYSICAL APPEARANCE ON CONSUMER PERCEPTIONS
Charlotte Allen, B.S., M.B.A.
Dissertation Prepared for the Degree of
DOCTOR OF PHILISOPHY
UNIVERSITY OF NORTH TEXAS
December 2001
Allen, Charlotte, Stereotypes in Retail Print
Advertising: The Effects of Gender and Physical Appearance
on Consumer Perceptions. Doctor of Philosophy (Marketing),
December 2001, 117 pp., 26 tables, bibliography, 130
titles.
The retail sector spends millions of dollars each year
advertising to consumers. This is a considerable investment
for companies seeking effective ways to inform and persuade
the consumer. Consequently, retailers need to develop
creative message strategies and tactics that will
positively affect consumer attitudes. One particular tactic
available to retailers is the use of a spokesperson in the
advertisement. Salespersons are used in numerous
advertisements and can provide key benefits to an
advertiser. However, to maximize these benefits, retailers
need to carefully select the spokesperson that will be most
effective for their store and product. This purpose of
this research is to examine the characteristics that
influence consumers’ perceptions of print advertisements
that include a spokesperson in the advertisement.
Most of the past literature concerning spokespersons
has concentrated on the consumer perspective of meeting and
interacting with a living, breathing person. This research
seeks to use the past research on salespeople to examine
the spokesperson as a cue in a print advertisement. In this
perspective, the consumer views the spokesperson from a
visual-only perspective. The proposed experiment will
utilize print advertisements from two retail businesses.
More specifically the study will investigate how consumers
react if the individual viewed in the advertisement is
typical (matches with their preconceived stereotype) or if
the salesperson is atypical (does not match with their
preconceived stereotype). This research also examines how
men and women are viewed differently in the spokesperson
role and how changes in physical appearance may impact
consumers' perceptions. The research also studies the
influence of spokesperson stereotypes on consumers'
cognitive responses.

ii
Copyright 2001
by
Charlotte Allen
iii
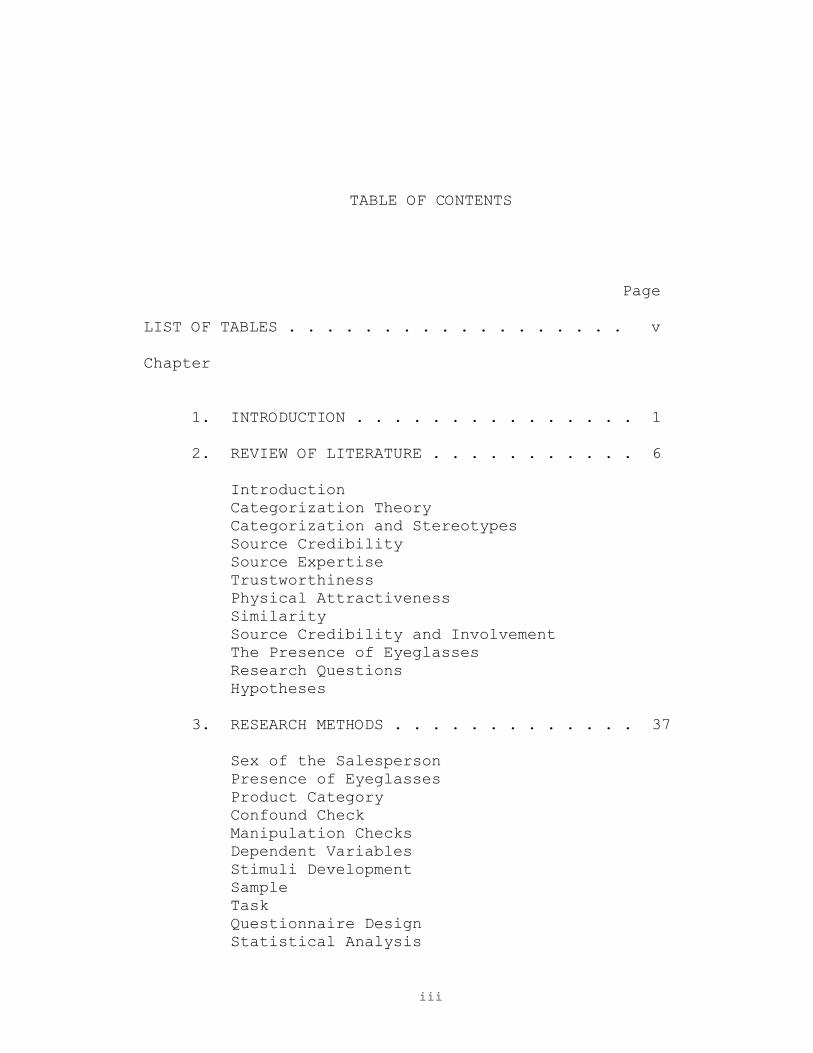
TABLE OF CONTENTS
Page LIST OF TABLES . . . . . . . . . . . . . . . . . . v Chapter
1. INTRODUCTION . . . . . . . . . . . . . . . 1
2. REVIEW OF LITERATURE . . . . . . . . . . . 6
Introduction Categorization Theory Categorization and Stereotypes Source Credibility Source Expertise Trustworthiness Physical Attractiveness Similarity Source Credibility and Involvement The Presence of Eyeglasses Research Questions Hypotheses
3. RESEARCH METHODS . . . . . . . . . . . . . 37
Sex of the Salesperson Presence of Eyeglasses Product Category Confound Check Manipulation Checks Dependent Variables Stimuli Development Sample Task Questionnaire Design Statistical Analysis
iv
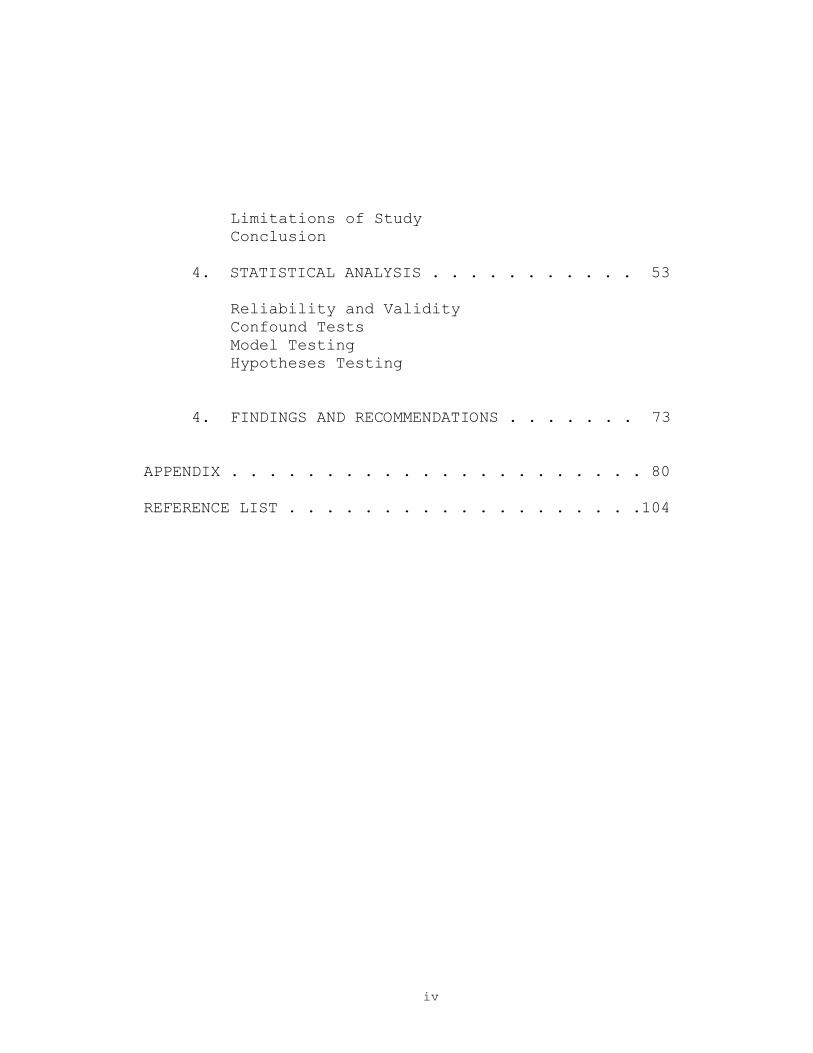
Limitations of Study Conclusion
4. STATISTICAL ANALYSIS . . . . . . . . . . . 53 Reliability and Validity Confound Tests Model Testing Hypotheses Testing
4. FINDINGS AND RECOMMENDATIONS . . . . . . . 73
APPENDIX . . . . . . . . . . . . . . . . . . . . . . 80 REFERENCE LIST . . . . . . . . . . . . . . . . . . .104
v
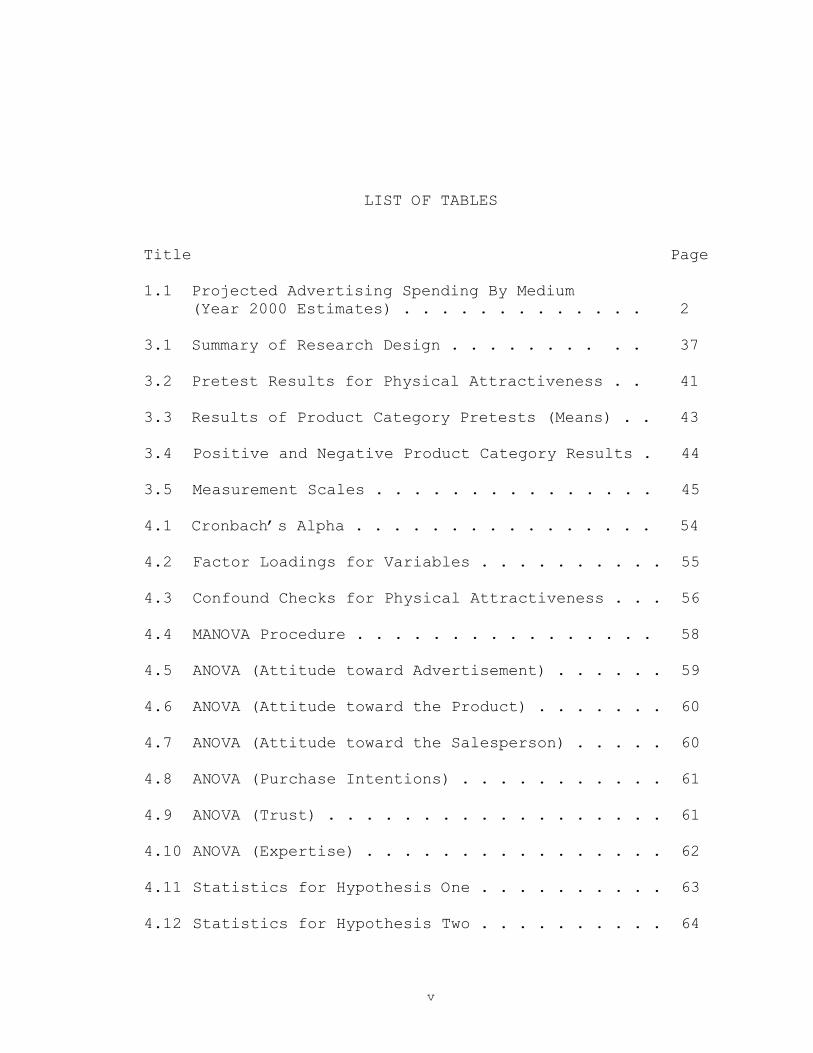
LIST OF TABLES Title Page 1.1 Projected Advertising Spending By Medium
(Year 2000 Estimates) . . . . . . . . . . . . . 2 3.1 Summary of Research Design . . . . . . . . . . 37 3.2 Pretest Results for Physical Attractiveness . . 41 3.3 Results of Product Category Pretests (Means) . . 43 3.4 Positive and Negative Product Category Results . 44 3.5 Measurement Scales . . . . . . . . . . . . . . . 45 4.1 Cronbach’s Alpha . . . . . . . . . . . . . . . . 54 4.2 Factor Loadings for Variables . . . . . . . . . . 55 4.3 Confound Checks for Physical Attractiveness . . . 56 4.4 MANOVA Procedure . . . . . . . . . . . . . . . . 58 4.5 ANOVA (Attitude toward Advertisement) . . . . . . 59 4.6 ANOVA (Attitude toward the Product) . . . . . . . 60 4.7 ANOVA (Attitude toward the Salesperson) . . . . . 60 4.8 ANOVA (Purchase Intentions) . . . . . . . . . . . 61 4.9 ANOVA (Trust) . . . . . . . . . . . . . . . . . . 61 4.10 ANOVA (Expertise) . . . . . . . . . . . . . . . . 62 4.11 Statistics for Hypothesis One . . . . . . . . . . 63 4.12 Statistics for Hypothesis Two . . . . . . . . . . 64
vi
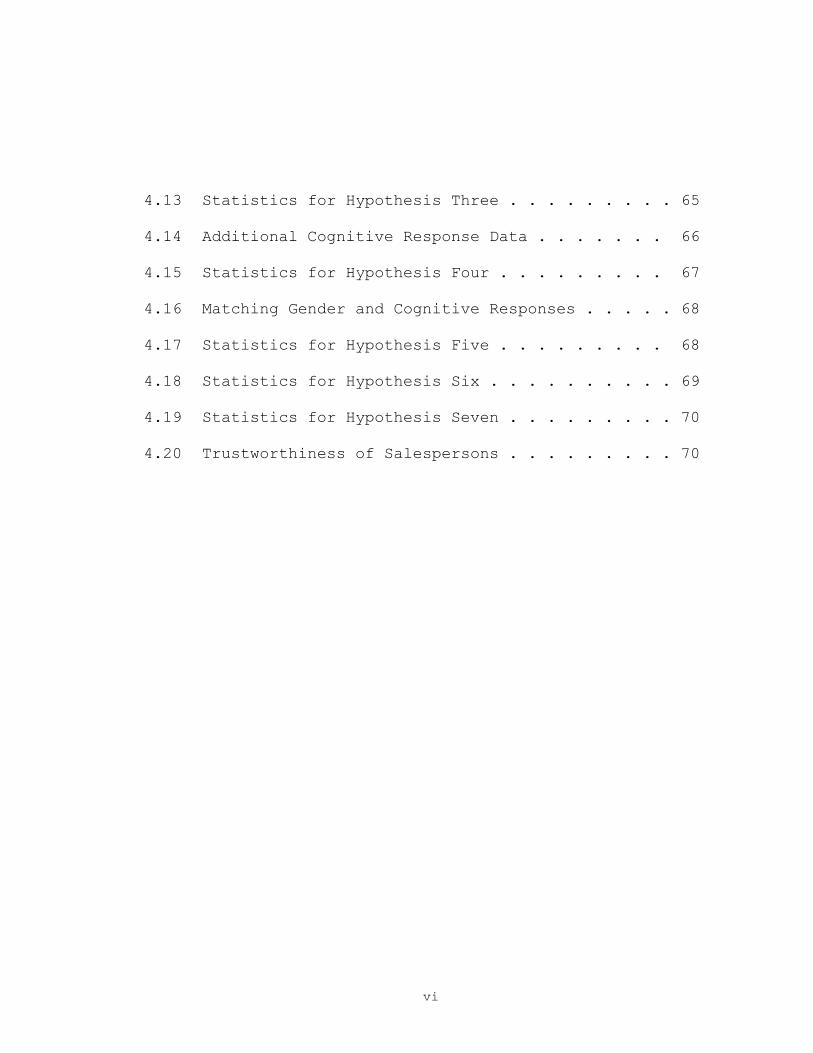
4.13 Statistics for Hypothesis Three . . . . . . . . . 65 4.14 Additional Cognitive Response Data . . . . . . . 66 4.15 Statistics for Hypothesis Four . . . . . . . . . 67 4.16 Matching Gender and Cognitive Responses . . . . . 68 4.17 Statistics for Hypothesis Five . . . . . . . . . 68 4.18 Statistics for Hypothesis Six . . . . . . . . . . 69 4.19 Statistics for Hypothesis Seven . . . . . . . . . 70 4.20 Trustworthiness of Salespersons . . . . . . . . . 70
1
CHAPTER I
INTRODUCTION
The retail sector accounted for $9,043.1 million of
all advertising expenditures in 1999 (Ad Age 2000). This
is a considerable investment for companies seeking
effective ways to inform and persuade the consumer.
Moreover, research has shown that consumer attitudes toward
the advertisement can impact attitude toward the brand (or
store) and purchase intentions (Maheswaran and Sternhall
1990).
Consequently, retailers need to develop creative
message strategies and tactics that will positively affect
consumer attitudes. One particular tactic available to
retailers is the use of a salesperson in the advertisement.
Salespersons are used in numerous advertisements and can
provide key benefits to an advertiser. However, to
maximize these benefits, retailers need to carefully select
the salesperson that will be most effective for their store
and product. This research seeks to examine the
characteristics that influence consumers’ perceptions of
2
print advertisements that include a salesperson in the
advertisement.
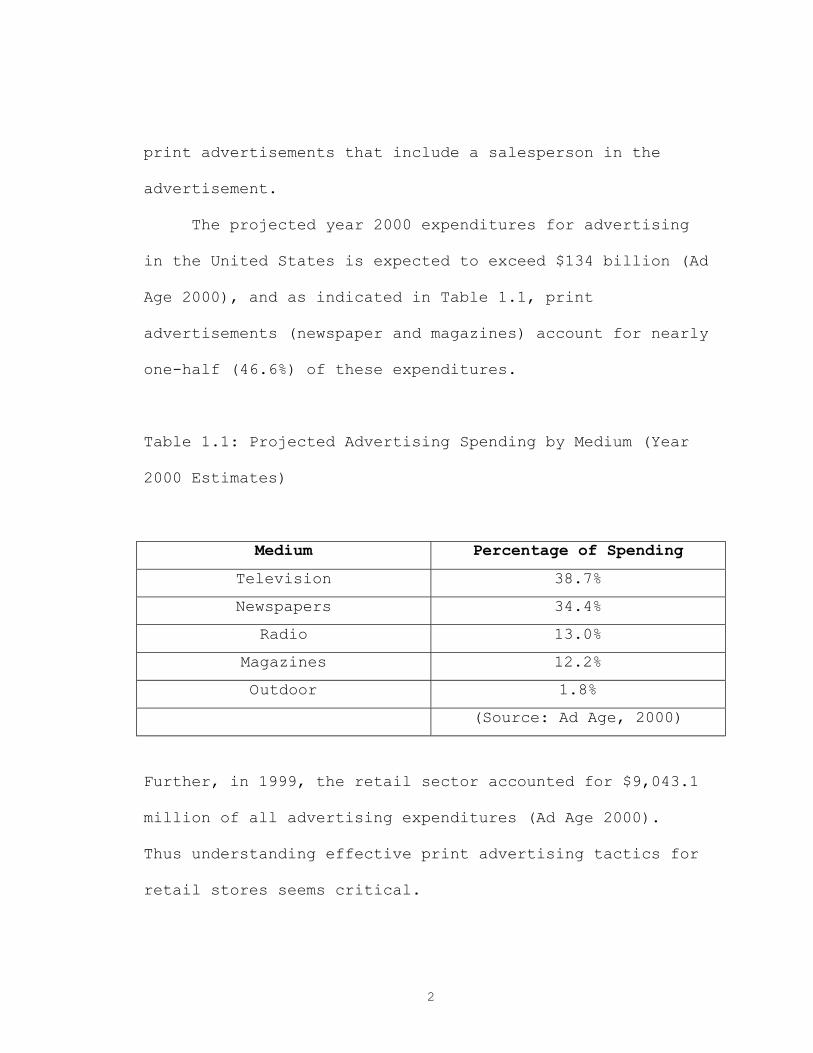
The projected year 2000 expenditures for advertising
in the United States is expected to exceed $134 billion (Ad
Age 2000), and as indicated in Table 1.1, print
advertisements (newspaper and magazines) account for nearly
one-half (46.6%) of these expenditures.
Table 1.1: Projected Advertising Spending by Medium (Year
2000 Estimates)
Medium Percentage of Spending Television 38.7%
Newspapers 34.4%
Radio 13.0%
Magazines 12.2%
Outdoor 1.8%
(Source: Ad Age, 2000)
Further, in 1999, the retail sector accounted for $9,043.1
million of all advertising expenditures (Ad Age 2000).
Thus understanding effective print advertising tactics for
retail stores seems critical.
3
Many consumers have a traditionally negative view of a
salesperson (Pavelchak 1991, Babin et al 1995, Thompson
1972). These negative stereotypes can actually cause
consumers to avoid salespersons in certain instances and
can decrease the number of selling activities performed by
the salesperson. There are also certain instances where a
consumer can possess positive stereotypes about a specific
type of profession (e.g., a medical doctor) which can
increase a person's likelihood to like and respect any
individual in that profession. Although there has been
some work conducted in the area of salesperson stereotypes
(Thompson 1972, Darden and French 1971, Stafford, Leigh and
Martin 1995), the topic of how salesperson stereotypes
impact consumer attitudes and cognitive responses has
remained an area in need of more academic research (Reingen
and Kerman 1993).
Most of the past literature concerning salespersons
has concentrated on the consumer perspective of meeting and
interacting with a living, breathing person. This research
seeks to use the past research on salespeople to examine
the spokesperson as a cue in a print advertisement. In this
perspective, the consumer views the spokesperson from a
visual-only perspective. The proposed experiment will
4
utilize print advertisements from two retail businesses.
More specifically the study will investigate how consumers
react if the individual viewed in the advertisement is
typical (matches with their preconceived stereotype) or if
the spokesperson is atypical (does not match with their
preconceived stereotype). This research also examines how
men and women are viewed differently in the spokesperson
role and how changes in physical appearance may impact
consumers' perceptions. The research also examines the
influence of spokesperson stereotypes on consumers'
cognitive responses.
Chapter two begins with a review of the literature
concerning how consumers, and people in general, process
and categorize information about objects and other people.
Topics further addressed in the literature review include
issue of sex of spokesperson and the physical appearance
and credibility of salespersons. Finally, the research
questions for this study are presented along with the
research hypotheses.
Chapter three begins with a description of the
research design utilized in this study along with a
description of the independent and dependent variables.
Details on sample design, questionnaire development, and

5
the respondent tasks are presented as well. A discussion
of the proposed statistical analysis and the limitations of
the study follow.
6
CHAPTER II
REVIEW OF LITERATURE
Introduction
American consumers are exposed to millions of
advertisements during their lifetime. While some of the
advertisements are lost in the clutter of an overabundance
of advertisements and information, some of the "better"
advertisements do invade the selective screening process
and consumers are entertained, informed and even persuaded
by those advertisements.
There are benefits to using spokespersons in
advertising, existing research has shown that the
credibility, the sex and physical attractiveness of the
spokesperson influence the persuasiveness of the
advertisement. Additionally, involvement levels can
influence and perhaps moderate the effectiveness of certain
advertisements. Further, how a person classifies or
“categorizes” information and people also impacts how
advertisements are viewed by the consumer. The following
literature review will examine each of these topics in more
7
detail beginning with categorization theory, the foundation
of chapter two.
Categorization Theory
Categorization is a process that persons use to help
identify and interact with other persons and objects. A
category is comprised of two or more distinguishable
objects or events that are treated equivalently (Mervis and
Rosch 1981). Fiske and Pavelchak (1986, p. 170) defined
categorization as the process of “identifying a stimulus as
a member of its class, similar to other members and
dissimilar from non-members by the process of rating
identifying characteristics”. More specifically,
categorization is used by consumers to determine that a
specific item is a member of a certain category (ex. this
person is a professor or this piece of furniture is a
chair). It can also be used to identify that a specific
concept is a subset of another concept (ex. McDonalds is a
fast food chain or roses are a flower).
For example, if a person possesses a concept of X and
knows attributes and information about X, then such
attributes and information can be used to categorize new
objects a person encounters (Smith and Medin 1981). As
8
Bruner, Goodnow and Austin (1956, p. 3) noted "to
categorize is to render discriminably different things
equivalent, to group objects and events and people around
us into classes, and to respond to them in terms of their
class membership rather than their uniqueness."
The Classical View of Categorization Theory posits
that each item in a category should have all of the
attributes that determine category membership and that all
items in a category should be equally representative (Smith
and Medin 1981). Therefore, from a classical perspective,
if in a person's view that all roses have thorns and that
person encounters a rose which does not have thorns, then
'having thorns' would not be an attribute for the category
of roses. However, in recent years, there has been growing
disillusionment with regards to the classical view. In the
Probabilistic View of Categorization, research has shown
that many categories may not be well-defined and not all
members of a category are equally good examples of that
category (Rosch and Mervis 1975, Smith and Medin 1981). For
example, a person might say that this smells like a rose,
looks like a rose and even if it does not have thorns, I
will still classify it as a rose.
9
Fiske and Pavelchak's (1986) basic model posits that a
person's reaction to another person or object consists of
an initial categorization stage followed by a second-affect
generation stage. While it has taken multiple pages to
explain how one person can react to another person or
object, this process is an instantaneous one with the match
immediately triggering an affect. One major implication of
this model is that the basic category label will possess
more impact than any single trait since the category label
has stronger and additional links to the attributes than
the attributes have to each other.
Persons can be evaluated by two different processes:
piecemeal and category-based evaluations. However, category
based-evaluations appear to be more simpler and efficient
(Pavelchak 1989). The category-based evaluation process
involves the retrieval of information stored in a person's
memory and is likely to be successful when there is a close
match between the person or object being evaluated and the
schema stored in memory. When category-based evaluations
are not successful, then a person reverts to piecemeal
based evaluations where each attribute is considered
individually rather than as a complete category.
10
Fiske's work (1982; Fiske and Pavelchak 1986) posits
that affective reactions to other persons are directed by a
person's prior experience and/or beliefs about that
category of individuals. This process of arriving at a
judgement is called "schema-triggered affect" or "category-
based affect" in the literature. If a person is perceived
as typical (i.e., matching a category based on prior
experience), a consumer tends to process less information
about the individual since category information already
exists. Research by Anderson, Klatsky and Murray (1990)
found that descriptions using stereotypes were processed
more quickly by respondents than descriptions that did not
contain stereotypes. Sujan et al (1986) found that if a
buyer perceived a salesperson as typical, product
evaluation was unaffected by the quality of product
arguments presented; however, when the salesperson was
perceived as atypical, buyers engaged in more analytical or
systematic processing than in the typical salesperson
situation (i.e. piecemeal evaluation).
Categorization and Stereotypes
While the earlier discussion in this chapter dealt
primarily with the categorization of tangible objects,
11
consumers also categorize people based on their past
experiences. The sum of a person's past experiences can
result in a stereotype of certain people (Pavelchak 1991),
occupations (Pratto and Bargh 1991) and/or physical
characteristics (Hoffman and Hurst 1990, Mussweiler and
Stack 2000). Specifically research has shown that many
consumers possess negative stereotypes of salespeople
(Thompson 1972, Adkins and Swan 1981, Babin, Boles and
Darden 1995). In general, stereotypes, whether they are
positive or negative, are viewed in the literature as
cognitive economizers. In other words, stereotypes allow a
subject to use less cognitive ability or to use that
ability to complete another task (Bodenhausen 1990, Gilbert
and Hixon 1991).
Social stereotypes do allow consumers to make
available limited cognitive resources for other necessary
or pleasing activities (Macrae, Milne and Bodenhausen
1994). In other words, if a consumer views a spokesperson
as atypical (not a stereotype), then the consumer will
engage in more cognitive processing or thinking than if a
consumer views a spokesperson as typical. Fiske (1982)
describes a process known as schema triggered affect (STA)
in which there are typical characteristics that can cause
12
category-typical conclusions to happen automatically. When
STA occurs, consumers perceive typical attributes or cues
for a category and retrieve from memory a habitual reaction
to those cues or attributes. Research by Fiske and
Pavelchak (1986), Fiske (1987), and Sujan, Bettman and
Sujan (1986) has provided evidence of this process.
Research has shown that consumers tend to view some
spokespersons more positively or negatively than other
spokespersons for certain product categories (Boles and
Darden 1995). Pavelchak (1991) found that consumers tend
to have very different views of spokespersons depending
upon the product category; used car spokespersons were
perceived less favorably than personal computer
salespersons. In fact, Babin, Boles and Darden (1995)
found that the following characteristics were most
associated with automobile salespersons: smiling
constantly, walking quickly, smoking, being overweight,
having thinning hair, dressing unstylishly, speaking
loudly, shaking hands, and lying. While the existing
research has illustrated that certain types of salespeople
are viewed differently by consumers, the next section will
examine how a credible or noncredible source can impact
consumer perceptions.
13
Source Credibility
Research has found that the perceived image of a
person, or the salesperson, in the advertisement can
influence the audience, or receiver's, response to the
advertisement (e.g., Sternhall et al 1978, Hovland and
Weiss 1952, Swartz 1984, Nataraajan and Chawla 1997). Over
the years source credibility has been defined in many ways.
Two of the highly used definitions of source credibility
are Rogers (1971, p. 244) which defined credibility as the
"degree to which a communication source or channel is
perceived as trustworthy and competent by the receiver" and
Ohanian (1990, p. 41) which defined source credibility as
"the communicator's positive characteristics that affect
the receiver's acceptance of a message".
Highly credible sources have a propensity to change
the attitudes of the subjects to a higher degree than less
credible sources (Choo 1964; Swartz 1984). Consumers
perceive products with highly credible sources as “more
safe” than products with less credible sources (Tse 1999).
Both the perceived expertise and credibility of a source
influence product purchase intentions by consumers
(O’Mahony and Meenaghan 1998). This is true not only with
14
salespersons in advertisements, but with salespeople as
well. Salesperson credibility has a direct effect on buying
decisions when consumer expectations of product and brand
quality are low while salesperson credibility does not have
an effect on buying decisions when customer expectations of
quality are high (Sharma 1990). Gotleib et al (1987) found
that source credibility influenced consumer perceptions for
both high and low involvement services.
Furthermore, Grewal et al (1994) proposed that the
effect of price on the consumer's perceptions of risk is
moderated by both how the message is framed and by the
credibility of the source; low source credibility resulted
in greater influence on price on consumer's expectation of
risk. Zhang and Buda’s study (1999) concentrated on a
consumer’s need for cognition (NFC) and source credibility
on the processing of framed advertising messages. They
found that source credibility functioned as a moderator
when there was low NFC (need for cognition) and that
subjects with a high NFC subjects paid less attention to
the source than low NFC subjects. While these studies have
highlighted the evidence of how source credibility can
impact the elements of the marketing mix, source
credibility itself can be divided into three elements or
15
dimensions according to the literature. Specifically,
Ohanian (1990) partitioned source credibility into three
dimensions: expertise, trustworthiness, and physical
attractiveness. Each of these dimensions will be discussed
in detail.
Source Expertise
Source expertise has been defined as "the extent to
which a communicator is perceived to be a source of valid
assertions" (Hovland, Janis and Kelley 1953). McCrosky
(1966) has used the term authoritativeness while Berlo
(1960) has used the term qualification to describe source
expertise. Tedeschi et al (1973) found that expertise can
result from the perception of his or her experience,
education or competence. Giffin (1967) found that
interpersonal trust is based upon the perception of
expertness, reliability, intentions, activeness and
personal attractiveness while expert sources are considered
more sincere than less expert sources (Maddux and Rogers
1980, Braunsberger and Munch 1998).
It is also suggested by O'Hara et al (1991) that
although trustworthiness of the source has a positive
impact on the amount of persuasion, source expertise has an
16
even greater impact on changing attitudes. Research by
O’Mahony and Meenaghan (1998) found that consumer purchase
intentions were swayed by both source credibility and
source expertise; the more expert the consumer believed the
source to be, the more likely the consumer would be to
purchase the product.
O'Hara et al (1991) found source expertise to be
strongly related to a consumer's attitude, behavior, and
perception of other people towards that same behavior.
Source expertise can act as a central processing cue in
print advertisements and possibly other advertising
conditions (Homer and Kahle 1990). Woodside and Davenport
(1974) and Busch and Wilson (1976) both found that
customer's purchasing behaviors were positively influenced
by the perceived expertise of the salesperson. While Till
and Busler (1998) found that physical attractiveness had an
effect on purchase intentions, the expertise of the source
was more important for matching a brand with the
appropriate spokesperson. This finding is furthered by the
research of Maddux and Rogers (1980) who found that
physical attractiveness had no main or interaction effects
on persuasion suggesting that under some conditions the
17
source must also be perceived as having expertise in order
to persuade.
Trustworthiness
Doney and Cannon (1997) and Ganesan (1994) define
trust as the customer's perception of credibility and
benevolence of a salesperson or a source. Trust is seen to
have an element of risk attached to it - with
trustworthiness comes the risk that trust has been
misplaced or that the trust could be misused (Tedeschi et
al 1973). Swan et al (1988) found that key trust
components in the industrial sales setting to be
responsibility, honesty, dependability, competence and
likability. McGinnis and Ward (1980) found that overall
the expert and trustworthy source generated the most
opinion change in the subjects; however the trustworthy
source, whether expert or not, was more persuasive than the
expert source in changing opinions.
Sources that are perceived by consumers as being more
"trustworthy" are more influential than "less trustworthy"
sources with regard to changing attitudes (Petty and
Cacioppo 1986). Trustworthiness was found to be
significantly related to consumer purchasing variables such
18
as product quality, price, and information search; when
trustworthiness was rated low, unit price and product
quality were rated as being more important by consumers
than when trustworthiness was rated high (Chawla, Dave and
Barr 1994). In the sales setting, trust in the salesperson
can have a positive impact on the persuasion and buying
attitudes of a customer (Millman and Fugate 1988).
The more likable a source is perceived to be, the more
persuasive that source tends to be (Chaiken 1980). O'Hara
et al (1991) posited that likability may have a smaller
impact on attitude change than either source expertise or
trustworthiness. This is due in part to research suggesting
that the impact of likability on persuasion is secondary to
the impact of source expertise and trustworthiness (McGuire
1985). Friedman and Friedman (1976) found trust to be
highly correlated with not only with liking, but with
similarity, attractiveness and source expertise. Also,
research by Swan et al (1988) regarding industrial
salespeople found that the more likeable a salesperson was
the more trustworthy the buyer perceived that salesperson
to be. Recent research by Nicholson, Compeau and Sethi
(2001) tested a model which posited that liking held a
mediating role in regard to developing trust.
19
Physical Attractiveness
Morrow (1990, p. 47) defines physical attractiveness
as the "degree to which one's facial image elicits
favorable reactions from others." Using photographs of a
person's face to rate physical attractiveness tends to be a
common and reliable form of measuring physical
attractiveness (Patzer 1985, Morrow 1990). Salesperson
attractiveness has been identified as a factor which
impacts persuasiveness of the communication medium (Baker
and Churchill 1977, Joseph 1982, DeShields, Kara and Kaynak
1996). Gillen (1981) found that people rated low in
physical attractiveness are perceived as having a lesser
amount of desirable character traits than people rated high
in physical attractiveness. Baker and Churchill (1977)
found partial confirmation that when the male model was
used in the advertisement, female subjects seemed to
express a stronger intention to act on the advertisement
than the male subjects, but neither the attractiveness of
the male model nor the type of product advertised had any
effect on consumer behavioral intentions.
20
Physically attractive sources were rated more highly
than less physically attractive sources on the following
characteristics: sociable, status, interesting, strong,
sexually warm and responsive, outgoing and poised (Maddux
and Rogers 1980). Byre, London and Reeves (1968) found
that attractive male salespersons were viewed as being less
moral and less intelligent than unattractive male
salespersons while attractive female salespersons were
perceived as more intelligent and more moral than
unattractive female salespersons. Till and Busler (1988)
found that the use of an attractive salesperson paired with
a product category that was perceived to enhance a user's
attractiveness (e.g., Colgate) was more effective than the
use of an attractive salesperson paired with a product
category that was not perceived as enhancing the user's
attractiveness (e.g., a ballpoint pen).
Studies indicate that employers possess a favorable
bias toward more physically attractive employees (Morrow et
al 1990, Jackson 1973). Eagly and Chaiken (1975) found
that both attractive and unattractive subjects were equally
persuasive when promoting a desirable position on a topic,
but that attractive salespersons were more persuasive than
their counterparts when promoting an undesirable position.
21
In addition, research by Patzer (1983) supported the
hypothesis that there is a causal relationship between
physical attractiveness of the communication source and the
perceived salesperson trust, expertise and likability.
Furthermore, more favorable selling skills have been
attributed to highly attractive salespersons: buyers tended
to treat physically attractive salespeople more cordially
than less attractive salespeople (Reingen and Kernan 1994).
Kelman (1961) even thought that the physical
attractiveness of the source and the perceived expertise of
the source could, under specific conditions, make an
involving decision more personally involving. It is thought
that under low involvement conditions, individuals are more
likely to agree with an expert, rather than nonexpert,
source, agree with a likable, rather than nonlikable
source, and agree with a physically attractive, rather than
a nonattractive, source (DeBono and Harnish 1988, Petty et
al 1981, Chaiken 1980 and Pallack 1983).
Physical Attractiveness and Sex of Source
While physical attractiveness certainly impacts how
persons view other people and objects, recent studies have
examined the notion of gender stereotypes (Deaux and Lewis
22
1984). Research by Broverman et al (1972) found that women
tend to be perceived as warmer and more expressive than men
and men tend to be perceived as more competent and
rational. In fact, Deaux and Lewis (1984, p. 1003) note
that the "importance of physical appearance cues to an
understanding of gender stereotypes cannot be minimized."
Further research by Snyder and Rothbart (1971) found
that the more physically attractive male model was liked by
the subjects (high school and college level males and
females) more than the less physically attractive male
model. Horai et al's (1974) study utilized female (junior
high) students and a male (college age) source and found
that physical attractiveness (three levels; high, low and
none) and source expertise had significantly positive main
effects, but no interaction effects; the dependent
variables in this study were message agreement, a measure
of source liking and message recall. Chaiken (1979) also
found that physical attractiveness had a positive effect on
attitude and intended behavior using both male and female
sources and male and female subjects of relatively the same
age.
Mills and Aronson's 1965 study contained male subjects
(college aged) and female sources (college aged as well).
23
Attractiveness was manipulated on two levels (high and low)
and main effects were found for source liking and certain
favorable personality traits. However Blass et al (1974)
used the same subjects and source as Mills and Aronson
(1965) with the main effect being non-significant. Joseph
(1977) used male and female undergraduates as subjects and
college age females as the sources and found that physical
attractiveness did impact source liking and similarity.
Furthermore, when a source was perceived as expert, the
source’s physical attractiveness had little impact on the
subject’s actions, but the source was not perceived as an
expert, the subjects tended to agree more with the highly
physically attractive source as opposed to the medium or
low physically attractive source (Joseph 1977). Frieden's
study of salesperson effects (1984) observed that on some
measures a male salesperson tended to have more favorable
response than a female salesperson; however this conclusion
was not statistically significant across all tested
variables. Swartz (1984) noted that physical
attractiveness, as a component of source credibility,
tended in research to be divided into three aspects,
similarity, familiarity, and liking, which factor into
salesperson attractiveness.
24
Similarity
The recipient's attitude toward an object can be
modified by the salesperson's manipulation of the perceived
similarity between recipient and salesperson (Brock 1965).
In Brock's 1965 study, a paint salesman attempted to
persuade a customer to switch to either a lower or higher
price line of paint by either communicating a similar or
dissimilar level of paint consumption by the salesman
personally. Studies have also indicated that a recipient's
perception of his/her similarity to the salesperson will
affect the salesperson's effectiveness (Brock 1965); the
life-stage, sex, cultural background, work attitude and
personality of the two parties will impact the trust,
satisfaction, commitment and overall quality of the
relationship (Smith 1998). Race and gender also that need
to be considered when conducting research on similarity
between salesperson and consumer (Chawla and Nataraajan
1995).
When salesperson attractiveness is controlled,
similarities between salesperson and recipient that are
relevant to the exchange effect a greater opinion change
than similarities which are not relevant to the exchange
(Berscheid 1966). Parties in a relationship will categorize
25
themselves by different social attributes and comparing and
contrasting themselves against the social attributes of
other parties they meet and encounter (Turner 1982).
Interestingly enough, consumers tend to categorize same-sex
(i.e. persons of similar sex) more quickly than opposite-
sex subjects (Zarate and Smith 1990).
In a sales context, selling behaviors were found to be
varied depending upon the gender similarity between the
buyer and seller (Palmer and Bejou 1995). There is also
evidence to suggest that similarity can turn into liking
for the similar person (Byrne 1961; Byrne and Wong 1962)
and could possibly could lead to trust and respect (Marsh
1967). In the selling context, Woodside and Davenport
(1974) found that similarity between customer and
salesperson influenced product purchases. Purchase
intentions were rated higher by subjects who were the same
sex as the salesperson than by subjects who were of the
opposite sex as the salesperson (Caballero, Lumpkin and
Madden 1989).
Source Credibility and Involvement
In the existing advertising literature, the construct
of involvement is often used as a mediator of advertising
26
effectiveness (Greenwald and Leavitt 1984, Zaichkowsky
1986, Mazursky and Schul 1992). Zaichkowsky (1985) defines
involvement as a person’s “perceived relevance” to an
object while Petty and Cacioppo (1981) define product
involvement as a function of its direct personal relevance
and the degree of the consumer's concern to form a reasoned
opinion. Richins and Bloch (1986) divide product
involvement into two categories: situational and enduring.
Situational involvement is the degree of involvement evoked
by a particular situation and influenced by marketing mix
variables and other situational variables. Enduring
involvement is an ongoing concern for the product that the
individual brings into a purchasing situation (Richins &
Bloch 1986; Houston and Rothschild 1978).
A body of advertising research has dealt with the
topic of persuasion, specifically the differences between
two alternate routes of persuasion (Chaiken 1980, Petty et
al 1983). The central route of persuasion is said to the
used when consumers actively engage in comprehending and
evaluating messages, and any attitude change by the
consumer will be done by a systematic processing of
information with a high degree of cognitive effort. Any
attitude change that results from a peripheral route will
27
originate from simple persuasive cues that the consumer
will perceive as independent of message content and not
because the consumer has personally examined and evaluated
the message content.
Mazursky and Schul (1992) found that involvement
moderates the joint effectiveness of source credibility and
message quality; under low involvement the source is
considered independently of the message while under high
involvement the source was perceived as part of the
message. In other words, source credibility functions as a
peripheral cue under low involvement and a central cue
under high involvement. This research is especially useful
in the area of involvement and consumer attitudes. Any
advertising containing a salesperson in a product category
that a consumer possesses a high level of involvement with
would be processed differently by the consumer than if the
advertisement were for a product category that the consumer
considered low involvement.
The Presence of Eyeglasses
Using Morrow's 1990 definition of physical
attractiveness, the presence or lack of eyeglasses would be
a factor in a person's perceived physical attractiveness.
28
According to research, one in four Americans under the age
of 35 wear eyeglasses, 38% percent of those age 35-54 wear
eyeglasses and 42% of those over 55 wear eyeglasses
(Crispell 1995). Psychological studies have indicated that
the presence of eyeglasses influences the facial memory of
subjects (McKelvie 1988, Harris 1991). Argyle and McHenry
(1971) found that persons who were wearing eyeglasses and
had only been seen briefly by the subject were viewed by
the subjects as being more intelligent than persons without
eyeglasses. This reinforces the findings by Thornton (1942)
and Manz and Lueck (1968) which concluded that subjects
wearing glasses tend to be viewed as more intelligent and
more industrious than subjects not wearing glasses.
However, Argyle and McHenry (1971) found that there
were no differences in perceived intelligence between
persons wearing and persons not wearing eyeglasses if the
person was viewed for more than five minutes by the
subject. This is an interesting conclusion both in the
area of sales, where it is usual to have longer interaction
times between salesperson and customer, and in advertising,
where normally the advertisement, where it be print or
televised medium, is viewed briefly. Boshier's (1975)
videotape study concluded that both men and women wearing
29
eyeglasses were perceived as more intelligent. In a later
study, Harris (1991) found that generally subjects wearing
glasses were generally perceived as more intelligent and
intense and interestingly enough, both women and men with
glasses were viewed as either being more feminine or more
masculine, respectively. Some studies have shown that,
overall, people wearing glasses have been perceived as
being less attractive than those who do not wear glasses
(Berk 1963, Knoll 1978, Terry 1989). Terry (1989),
however, found that while female subjects were rated as
less attractive when wearing their eyeglasses, male
subjects were actually rated as more attractive when
wearing their eyeglasses.
Elman (1977) found that both female and male subjects
perceived males wearing glasses as being softer, gentler
and more sensitive and more of a follower than males not
wearing glasses. Interestingly, research with children
indicate that children rate other children wearing
eyeglasses lower in physical attractiveness, school
performance and conduct (Terry and Stockton 1993)
Furthermore, the study also concluded that females were
rated as being lower in attractiveness when wearing
eyeglasses than their male stimulus counterparts wearing
30
eyeglasses. Preschool age subjects, however, seem to have
difficulty processing information concerning eyeglasses
(McGraw, Durm, and Patterson 1983) indicating that
perception of eyeglasses is a learned response in older
children and adults.
The Research Questions
Given the existing literature on advertising,
stereotypes, and source effects, the following research
questions will be examined:
1. How does the physical appearance of a spokesperson in a
print advertisement influence consumers' attitudes?
2. How do spokesperson stereotypes influence consumers'
perceptions of a print advertisement?
3. Do consumers react differently to print advertisements
when the spokesperson is typical or atypical?
These research questions, along with the preceding
literature review, will be used to guide the development of
the research hypotheses. A brief discussion of the key
literature regarding each hypothesis precedes each
hypothesis.
31
Hypotheses
In general, the existing literature suggests that
stereotypes are viewed in the literature as cognitive
economizers; that is, stereotypes allow a subject to use
lower levels of cognitive ability or to use that ability
with regard to another mental task (Bodenhausen 1990;
Gilbert and Hixon 1991). In other words, if a consumer
views a spokesperson as atypical (not a stereotype), then
the consumer will engage in more cognitive processing or
thinking. Extending this line of thinking to the use of a
spokesperson in a print advertisement for a retail
business, the following hypothesis is proposed.
H1: A stereotype mismatch between consumer perceptions and
a spokesperson in a retail print advertisement will result
in a higher number of cognitive responses than a stereotype
match between consumer perceptions and a spokesperson in a
retail print advertisement.
Consumers have different perceptions of various
product categories and how each of the salespersons for
those categories should look and act. For example,
existing research and pretests from this research suggests
32
that consumers possess more positive opinions about the
product category of personal computers versus the product
category of used automobiles. Further, consumers perceive
spokespersons for used automobile dealerships to be
typically male while consumers perceive spokespersons for
personal computer retailers to be typically male and to
wear glasses (Pavelchak 1991). As discussed, a category
match with a negatively viewed product category should
generate a quicker application of affect and a positive
match with a negatively viewed category should generate a
quicker application of negative affect (Fiske 1982, Fiske
and Pavelchak 1986, Sujan et al 1986). Further, a mismatch
should cause deliberate processing and contrast effects
(Fiske 1982, Fiske and Pavelchak 1986). Thus the following
hypotheses are offered:
H2: A stereotype match between consumer perceptions and a
spokesperson in a retail print advertisement for a
positively viewed product category (personal computers)
will result in more positive attitudinal judgments than a
stereotype match between consumer perceptions and a
spokessperson in a negatively viewed product category (used
automobiles).
33
H3: A stereotype mismatch between consumer perceptions and
a spokesperson in a retail print advertisement for a
negatively viewed product category (used automobiles) will
result in more positive attitudinal judgments than a
stereotype match between consumer perceptions and a
spokesperson for a positively viewed product category
(personal computers).
Research by Smith (1998) and Chawla and Nataraajan
(1995) found that sex of the salesperson or spokesperson
impacts the effectiveness of the communicated message.
Studies have also indicated that a recipient's perception
of his or her similarity to the spokesperson will affect
the salesperson's effectiveness (Brock 1965); that is, the
life-stage, sex, cultural background, work attitude and
personality of the two parties will impact the trust,
satisfaction, commitment and overall quality of the
relationship (Smith 1998). Furthermore, Palmer and Bejou
(1995) found that gender of the spokesperson influenced the
actual behaviors between salesperson and consumer. Also,
Woodside and Davenport (1974) and Caballero, Lumpkin and
Madden (1989) all found that similarity of sex between
34
spokesperson and consumer positively affected purchase
intentions. A significant amount of literature on this
subject deals with face to face encounters between a
salesperson and a possible customer. The current research
is interested in the print advertising impact of such
encounters, which does not contain the verbal information
found in a face to face sales encounter. However, it is
expected that same consumer perceptions would emerge from a
print advertisement. Thus the following is suggested.
H4: A match between sex of spokesperson in a retail print
advertisement and sex of the consumer viewing the
advertisement will result in the consumer having more
positive intentions than if there is a mismatch between the
sex of the spokesperson in a retail print advertisement and
the sex of the consumer viewing the advertisement.
Past research has shown that subjects wearing
eyeglasses are perceived as being more intelligent than
subjects who do not wear eyeglasses (Thornton 1944, Manz
and Lueck 1968, Argyle and McHenry 1971). Later studies
also confirm that both male and female subjects are
perceived as being more intelligent when wearing eyeglasses
35
whether on video (Boshier 1975) or through computer-
generated pictures (Terry and Krantz 1993). Harris (1991)
found that, generally, subjects wearing glasses were
perceived as more intelligence and intense than subjects
not wearing glasses while both men and women with glasses
were viewed as being more masculine or more feminine
respectively. Pavelchak (1991) found that consumers expect
computer spokespersons to be typically male, intelligent,
knowledgeable, and to wear glasses. Therefore, the
following hypotheses are offered:
H5: Male spokespersons in advertising who wear eyeglasses
are perceived as being more expert than male spokespersons
featured in the advertisement who do not wear eyeglasses.
H6: Female spokespersons in advertising who wear eyeglasses
are perceived as being more expert than female
spokespersons featured in the advertisement who do not wear
eyeglasses.
Earlier studies found that in general spokespersons
who wore glasses were perceived as being less attractive
(Berk 1963, Knoll 1978). However, Terry (1989) found that
36
male subjects were rated as being more attractive when
wearing eyeglasses than male subjects not wearing
eyeglasses, while female subjects were rated as less
attractive when wearing glasses than female subjects not
wearing glasses. Therefore, the following hypothesis is
offered:
H7: Female spokespersons who wear eyeglasses are perceived
as being less attractive than male spokespersons who wear
glasses.
37
CHAPTER III
RESEARCH METHODS
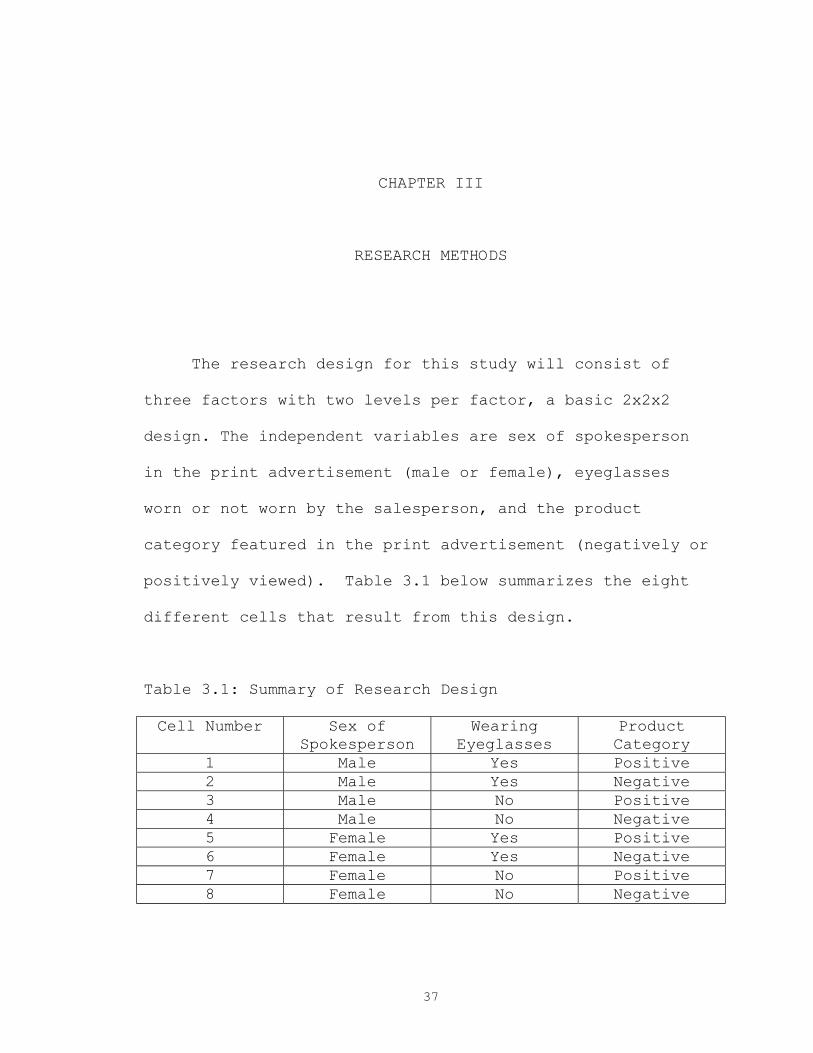
The research design for this study will consist of
three factors with two levels per factor, a basic 2x2x2
design. The independent variables are sex of spokesperson
in the print advertisement (male or female), eyeglasses
worn or not worn by the salesperson, and the product
category featured in the print advertisement (negatively or
positively viewed). Table 3.1 below summarizes the eight
different cells that result from this design.
Table 3.1: Summary of Research Design
Cell Number Sex of Spokesperson
Wearing Eyeglasses
Product Category
1 Male Yes Positive 2 Male Yes Negative 3 Male No Positive 4 Male No Negative 5 Female Yes Positive 6 Female Yes Negative 7 Female No Positive 8 Female No Negative
38
Print advertisements were created in which the
independent variables could be altered easily for the
different levels of each factor. A further description of
each of the variables and their factors follow.
The Sex of the Spokesperson
The sex of the spokesperson will be clear through the
use of a photograph of either a male or a female
salesperson. The development of personal stereotypes with
regards to a person's sex has been a topic of academic
study in both the field of psychology and marketing.
Research by Pavelchak (1991) and Babin, Boles and Darden
(1995) found that the typical spokesperson for the product
categories of personal computer and used automobiles tended
to be male, rather than female. A confound check to ensure
equal physical attractiveness of each of the spokespersons
was conducted and will be discussed in the confound check
section of this chapter.
Presence of Eyeglasses
The presence of eyeglasses would be altered in each
advertisement by a photograph of either a male spokesperson
wearing eyeglasses or a female spokesperson wearing
39
eyeglasses. The same model is used in each respective
photograph; one photograph shows the model wearing glasses
and one shows the model without glasses. Over 135 million
people in the U.S. need some form of vision correction;
approximately 80% of these people wear eyeglasses and about
20% wear contact lenses (Ocular Sciences 1999). Academic
studies have been conducted as early as the 1940s (Thorton
1944) in which the impact of wearing eyeglasses has been
studied from a psychological or social context, but this
researcher was not able to find any major academic research
which dealt with the attitudes towards a salesperson or
spokesperson who wore eyeglasses. It is interesting that
both men and women wearing eyeglasses are perceived as
being more intelligent, whether they in reality are or not,
than when the man or woman does not wear eyeglasses
(Boshier 1975). In an advertisement, it would be
interesting to discover whether that perception of
intelligence translates into the consumer possessing better
attitudes about the advertisement and the product being
advertised.
40
Product Category
The product categories of used automobiles and
personal computers were chosen as exemplars for the
negatively viewed product category (used automobile) and
the positively viewed category (personal computers). These
exemplars were also chosen due to existing literature that
offered clear stereotype descriptions of each spokesperson.
In regards to characteristics that could be tested using a
print advertisement, used automobile spokespersons were
stereotyped as being male and not wearing glasses while
personal computer spokespersons were stereotyped as being
male and wearing glasses (Pavelchak 1991). Since one of
the other independent variables was whether the
spokesperson in the advertisement was wearing glasses, it
was essential to select product categories in which that
variable could be utilized. The product category was
altered in each advertisement by changing the business name
slightly. A manipulation check for the product category was
conducted and will be discussed in the manipulation check
section of this chapter.
41
Confound Check
To ensure that male and female spokespersons were
perceived as equally attractive a confound check was
conducted. The physical attractiveness component of
Ohanian’s (1990) scale for source credibility was used.
Eighty-six test subjects viewed either the male or female
spokesperson and completed Ohanian's three-part scale.
Results (shown in Table 3.2) indicated that the test
subjects perceived the male and female spokesperson as
equally attractive (F=.476, p=,492). Thus it was believed
that attractiveness of the spokesperson was controlled and
would not interfere with the results. Table 3.2 below
summarizes the pretest results.
Table 3.2: Pretest Results for Physical Attractiveness
Sex of Spokesperson Mean
Male 54.90
Female 55.44
(F=.476, p=.492), n=86
42
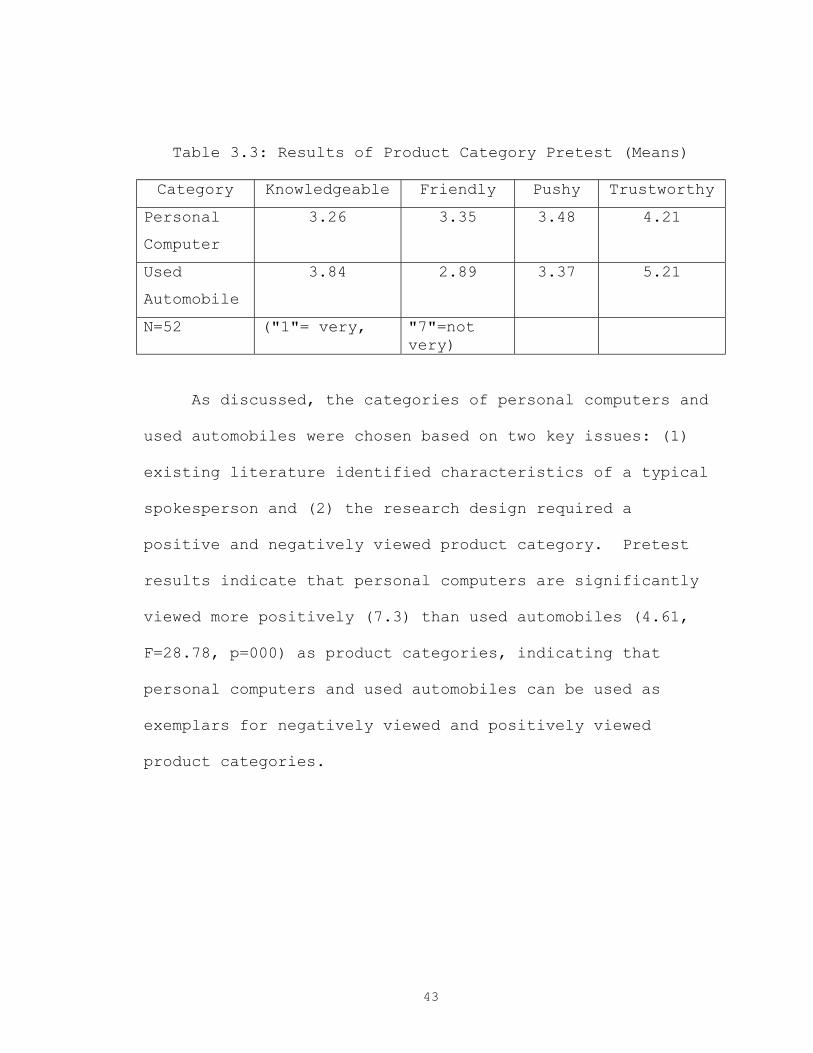
Manipulation Checks
The perception of product categories was checked using
Pavelchak’s (1991) research: the characteristics of
knowledgeable, friendliness, pushy, and trustworthiness
were used by Pavelchak to validate the typicality and
perception of a product category. Both personal computers
and used automobiles were found to be typical of their
respective product categories in the pretest. Specifically,
a sample of 52 respondents concluded that a used car
spokesperson was perceived to be less knowledgeable, more
friendly, more pushy and less trustworthy than a personal
computer spokesperson. These results match Pavelchak's
study and indicate that consumers have strongly held
beliefs about the two categories on which to base their
attitudes and stereotypes. In short, personal computers are
a positively viewed product category and used automobiles
are a negatively viewed product category. Table 3.3 below
summarizes the results of the pretest.
43
Table 3.3: Results of Product Category Pretest (Means)
Category Knowledgeable Friendly Pushy Trustworthy
Personal
Computer
3.26 3.35 3.48 4.21
Used
Automobile
3.84 2.89 3.37 5.21
N=52 ("1"= very, "7"=not very)
As discussed, the categories of personal computers and
used automobiles were chosen based on two key issues: (1)
existing literature identified characteristics of a typical
spokesperson and (2) the research design required a
positive and negatively viewed product category. Pretest
results indicate that personal computers are significantly
viewed more positively (7.3) than used automobiles (4.61,
F=28.78, p=000) as product categories, indicating that
personal computers and used automobiles can be used as
exemplars for negatively viewed and positively viewed
product categories.
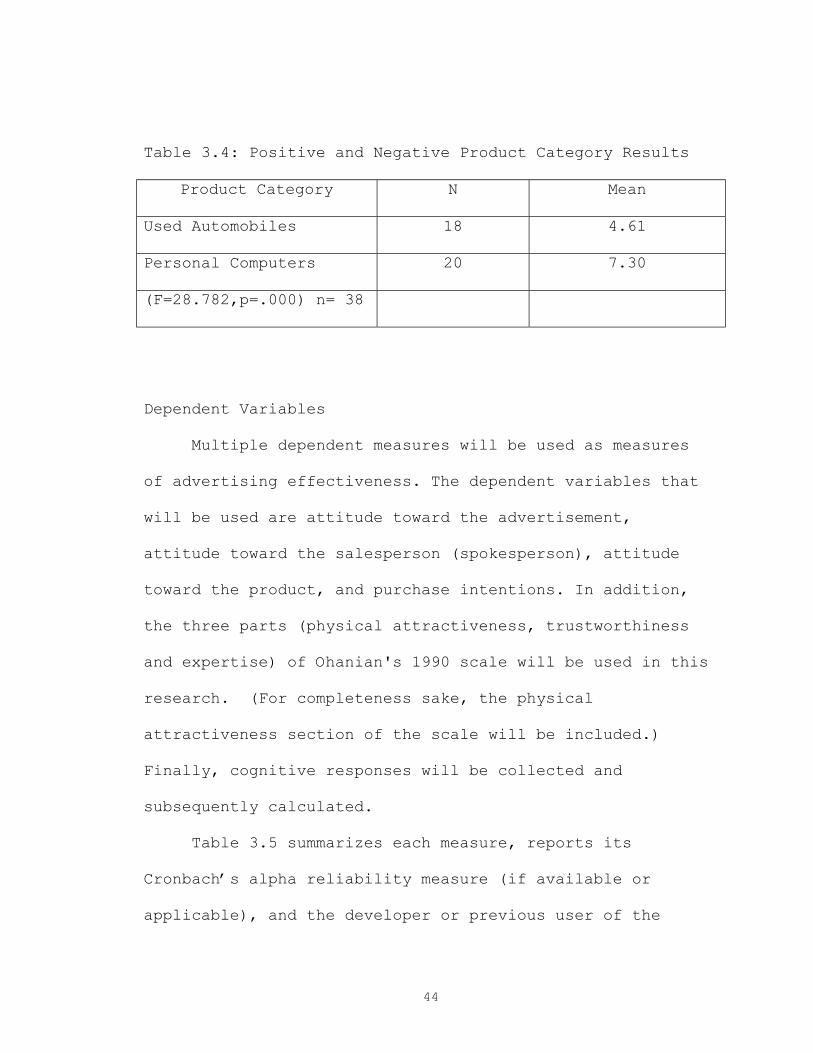
44
Table 3.4: Positive and Negative Product Category Results
Product Category N Mean
Used Automobiles 18 4.61
Personal Computers 20 7.30
(F=28.782,p=.000) n= 38
Dependent Variables
Multiple dependent measures will be used as measures
of advertising effectiveness. The dependent variables that
will be used are attitude toward the advertisement,
attitude toward the salesperson (spokesperson), attitude
toward the product, and purchase intentions. In addition,
the three parts (physical attractiveness, trustworthiness
and expertise) of Ohanian's 1990 scale will be used in this
research. (For completeness sake, the physical
attractiveness section of the scale will be included.)
Finally, cognitive responses will be collected and
subsequently calculated.
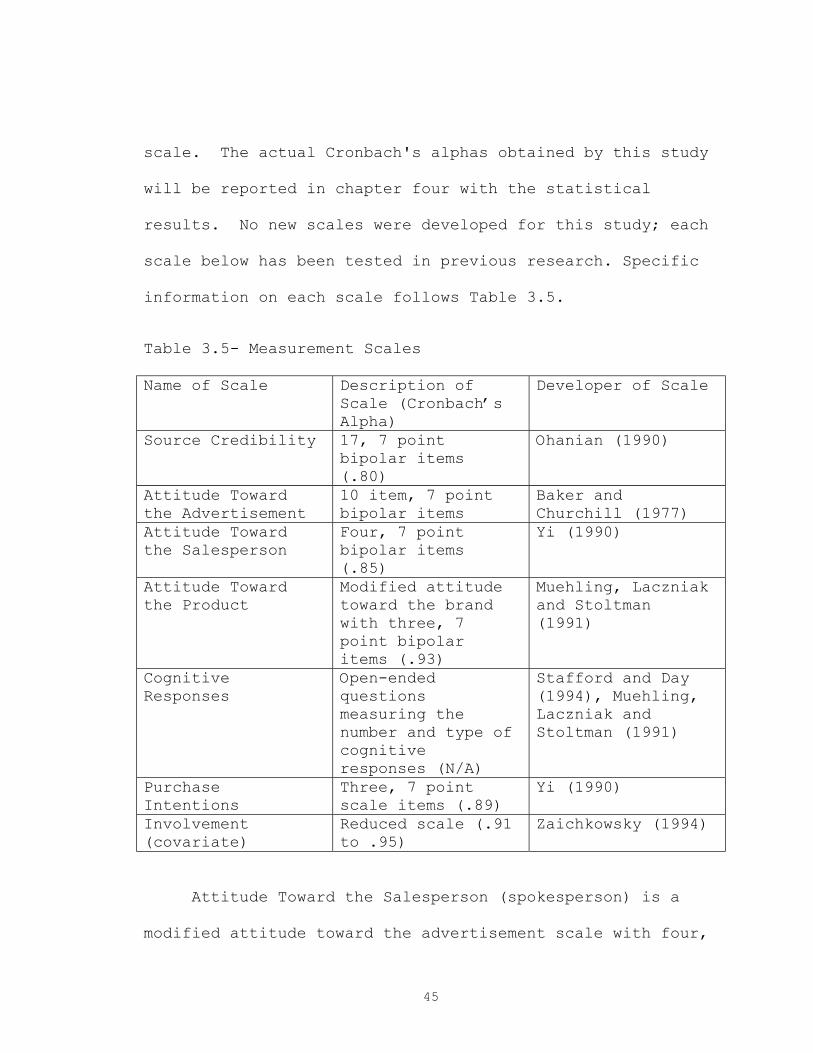
Table 3.5 summarizes each measure, reports its
Cronbach’s alpha reliability measure (if available or
applicable), and the developer or previous user of the
45
scale. The actual Cronbach's alphas obtained by this study
will be reported in chapter four with the statistical
results. No new scales were developed for this study; each
scale below has been tested in previous research. Specific
information on each scale follows Table 3.5.
Table 3.5- Measurement Scales
Name of Scale Description of Scale (Cronbach’s Alpha)
Developer of Scale
Source Credibility 17, 7 point bipolar items (.80)
Ohanian (1990)
Attitude Toward the Advertisement
10 item, 7 point bipolar items
Baker and Churchill (1977)
Attitude Toward the Salesperson
Four, 7 point bipolar items (.85)
Yi (1990)
Attitude Toward the Product
Modified attitude toward the brand with three, 7 point bipolar items (.93)
Muehling, Laczniak and Stoltman (1991)
Cognitive Responses
Open-ended questions measuring the number and type of cognitive responses (N/A)
Stafford and Day (1994), Muehling, Laczniak and Stoltman (1991)
Purchase Intentions
Three, 7 point scale items (.89)
Yi (1990)
Involvement (covariate)
Reduced scale (.91 to .95)
Zaichkowsky (1994)
Attitude Toward the Salesperson (spokesperson) is a
modified attitude toward the advertisement scale with four,
46
seven-point bipolar items (Yi 1990, alpha=.85). The
anchors for the items are good-bad, interesting-not
interesting, irritating-not irritating, and like-dislike.
Attitude Toward the Product is a modified Attitude
Toward the Brand scale with three, seven-point bipolar
items (Muehling, Laczniak, and Stoltman 1991, alpha=.93).
The anchors for the items are: good-bad, pleasant-
unpleasant, and like-dislike.
Purchase Intention contains three, seven-point bipolar
items (Yi 1990, alpha=.89). The anchors for the items are
likely-unlikely, possible-impossible and probable-
improbable.
Source Credibility is a three component scale
containing seventeen, seven- point bipolar items (Ohanian
1990, alpha=.80). The anchors for the items are
unattractive-attractive, dependable-undependable, not an
expert-expert, classy-not classy, honest-not honest,
experienced-inexperienced, handsome-ugly, unreliable-
reliable, knowledgeable-unknowledgeable, elegant-plain,
insincere-sincere, qualified-unqualified, sexy-not sexy,
trustworthy-untrustworthy, unskilled-skilled, not likable-
likable, and similar to me-not similar to me.
47
Attitude Toward the Advertisement contains ten, seven-
point Likert items (Baker and Churchill 1977). The
statements used are the ad is appealing; the ad is eye-
catching; the ad is impressive; if I needed an X, I would
actively seek out this retailer; the ad is believable; the
ad is clear; if I needed a X, I would patronize this
retailer; the ad is attractive; the ad is informative; and
if I needed a x, I would like to try this retailer.
Cognitive Responses are open ended responses used by
Stafford and Day (1994), Muehling, Laczniak and Stoltman
(1991), and Muehling, Laczniak and Andrews (1993) measuring
number and type of cognitive responses.
Covariate
Involvement is the reduced version which contains ten,
seven-point bipolar items (Zaichkowsky 1994, alpha=.91 to
.95). The anchors for the items are important-unimportant,
involving-uninvolving, irrelevant-relevant, means a lot to
me-means nothing to me, valuable-worthless, boring-
interesting, exciting-unexciting, appealing-unappealing,
fascinating-mundane, and not needed-needed.
48
Stimuli Development
As discussed earlier in this chapter, manipulation and
confounding checks were conducted on both the physical
attractiveness of the salesperson and the perception of the
product categories. Thus, the spokespersons that will be
used in the print advertisement are the same age, dressed
in the same attire (simple black professional suit), and
are perceived to have the same level of physical
attractiveness. The same spokespersons are used wearing
eyeglasses and not wearing eyeglasses. The business name of
“MotorWorld” was used for the used automotive dealership
while “CompWorld” was used for the personal computer
reseller. None of these business names exist in this area.
To avoid any confounding, the basic advertisement was the
same for each cell; that is, the typeface, layout and
format are identical.
Sample
The sample will be gathered from local groups who have
agreed to let the researcher administer the survey; this
will allow for a representative sampling of age ranges in
the area. The local groups will be both civic and
religious nature. Each subject will be randomly assigned to
49
one of the eight cells. The researcher is targeting a
sample size of 160 subjects, or about 20 per cell, which is
an ample number for the statistical measures that will be
used in the study.
Task
After a random assignment to one of the eight cells,
subjects will be told to give their personal and honest
opinion about the advertisements. Although audiences
generally can control the amount of time and number of
times they view a print advertisement, subjects will not be
allowed to control those variables in this study. Since
the number of cognitive responses are being measured in the
survey, subjects will be allowed 60 seconds to view the
advertisement. After viewing the advertisement, they will
be given three minutes to list their cognitive responses.
They will then be allowed to finish the questionnaire at
their own pace.
Questionnaire Design
The questionnaire will be administered in group
settings by the researcher. As stated each person will have
a set amount of time (60 seconds) to view the advertisement
50
so that subjects do not view the advertisements for
different time periods. The questionnaire will be
standardized; the only items that will be different are the
type of business being tested and the sex of the
spokessperson in the advertisement. Along with the scales
previously discussed, the questionnaire also contains
questions about the respondent's demographics (ex. age,
education, income, etc.). Please see Appendix A for the
pretests used in the research and Appendix B for the actual
questionnaire that will be used in the study.
Statistical Analysis
As noted, the research design for this study will be a
between subjects 2x2x2 design. The independent variables
are sex of salesperson, the presence of eyeglasses, and the
positive or negative product category. Descriptive
statistics will be calculated first in order to check for
errors and to obtain an overall feel of the data. A 2x2x2
multiple analysis of covariance (MANCOVA) will be used
along with analysis of covariance (ANCOVA) to perform
univariate F-tests for each dependent measure. Also,
Cronbach's alpha and confirmatory factor analysis will be
51
utilized to ensure satisfactory levels of reliability and
validity.
Limitations of the Study
As with many advertising experiments, subjects will
view the advertisement without any programming or editorial
content that normally accompanies print or televised
advertising. Therefore, it is possible that subject will
pay more attention to the advertisements used in the study
than they would have with normal advertisements seen in a
magazine or newspaper. However, this potential problem
notwithstanding, forced exposure to advertisements absent
of surrounding content is a standard advertising
experimental tool used to avoid possible confounding
effects (Norris and Colman 1992, Page, Thorson and Heide
1990).
Another limitation relates to the product categories
used in the study. While the categories (personal computer
and used automobile) were selected based on existing
research on typical product categories and spokesperson
stereotypes, it is possible that different product
categories could yield different results. The use of civic
and religious groups as part of the convenience sample
52
could also produce a sample with more conservative views
than the general US population. However, since the study
does not deal with any social issues the advertisements do
not contain any visual or verbal messages that could be
controversial, the convenience sample is not expected to
bias the results.
Conclusion
This chapter concludes the discussion of the research
design of this study. This chapter discusses the research
questions along with the research hypotheses, then outlines
the specifics of how the data would be gathered. The
statistical analyses that will be used are discussed along
with the limitations of the study. Chapters four and five
of the dissertation will discuss the actual results of the
proposal.
53
CHAPTER IV
STATISTICAL ANALYSIS
This chapter presents the research findings from the
data collection. Issues of reliability and validity,
confound checks, and finally, a statistical analysis of the
experiment will be addressed.
Reliability and Validity
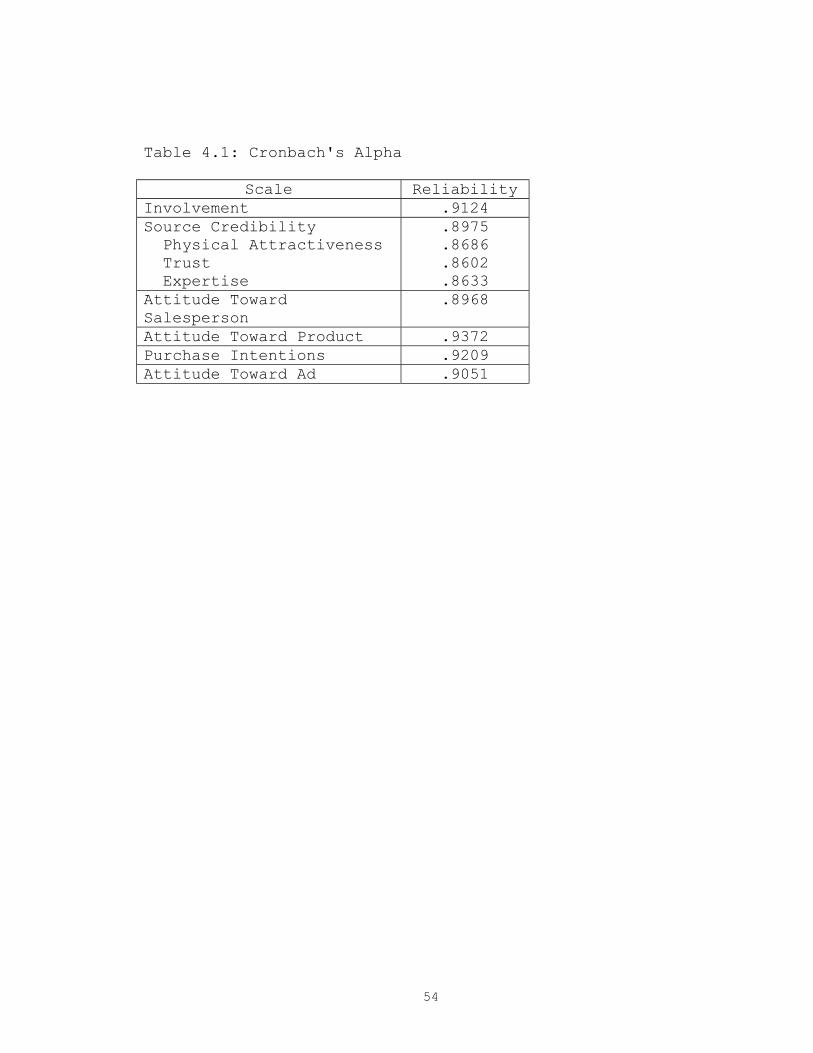
In Table 4.1, the reliabilities (Cronbach's Alpha) of
the scales used in the research are reported. The scales
measuring involvement, attitude toward the advertisement,
attitude toward the product, and purchase intentions all
reported Cronbach alpha scores of over .90; while the
scales measuring source credibility and attitude toward the
salesperson all reported Cronbach alpha scores of over .80.
Factor analysis was used for validity testing and the
factor loadings are reported in Table 4.2 below.
54
Table 4.1: Cronbach's Alpha
Scale Reliability Involvement .9124 Source Credibility Physical Attractiveness Trust Expertise
.8975
.8686
.8602
.8633 Attitude Toward Salesperson
.8968
Attitude Toward Product .9372 Purchase Intentions .9209 Attitude Toward Ad .9051
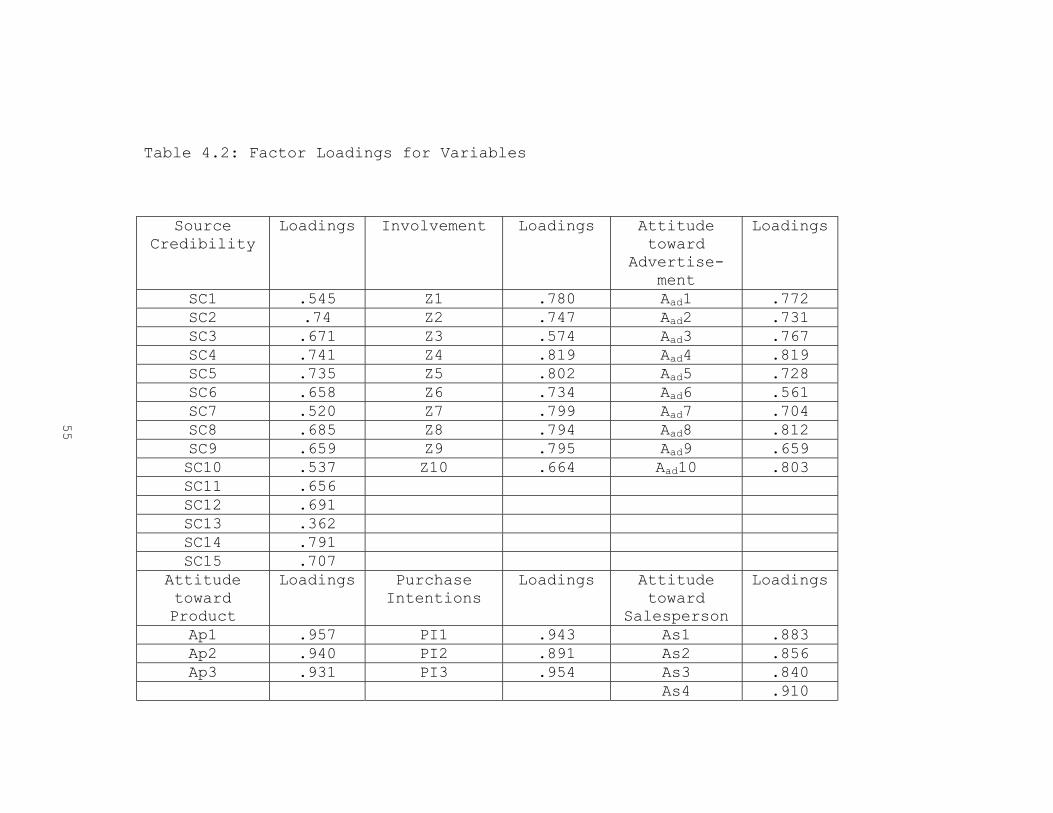
Table 4.2: Factor Loadings for Variables
Source Credibility
Loadings Involvement Loadings Attitude toward
Advertise-ment
Loadings
SC1 .545 Z1 .780 Aad1 .772 SC2 .74 Z2 .747 Aad2 .731 SC3 .671 Z3 .574 Aad3 .767 SC4 .741 Z4 .819 Aad4 .819 SC5 .735 Z5 .802 Aad5 .728 SC6 .658 Z6 .734 Aad6 .561 SC7 .520 Z7 .799 Aad7 .704 SC8 .685 Z8 .794 Aad8 .812 SC9 .659 Z9 .795 Aad9 .659 SC10 .537 Z10 .664 Aad10 .803 SC11 .656 SC12 .691 SC13 .362 SC14 .791 SC15 .707
Attitude toward Product
Loadings Purchase Intentions
Loadings Attitude toward
Salesperson
Loadings
Ap1 .957 PI1 .943 As1 .883 Ap2 .940 PI2 .891 As2 .856 Ap3 .931 PI3 .954 As3 .840 As4 .910
55
56
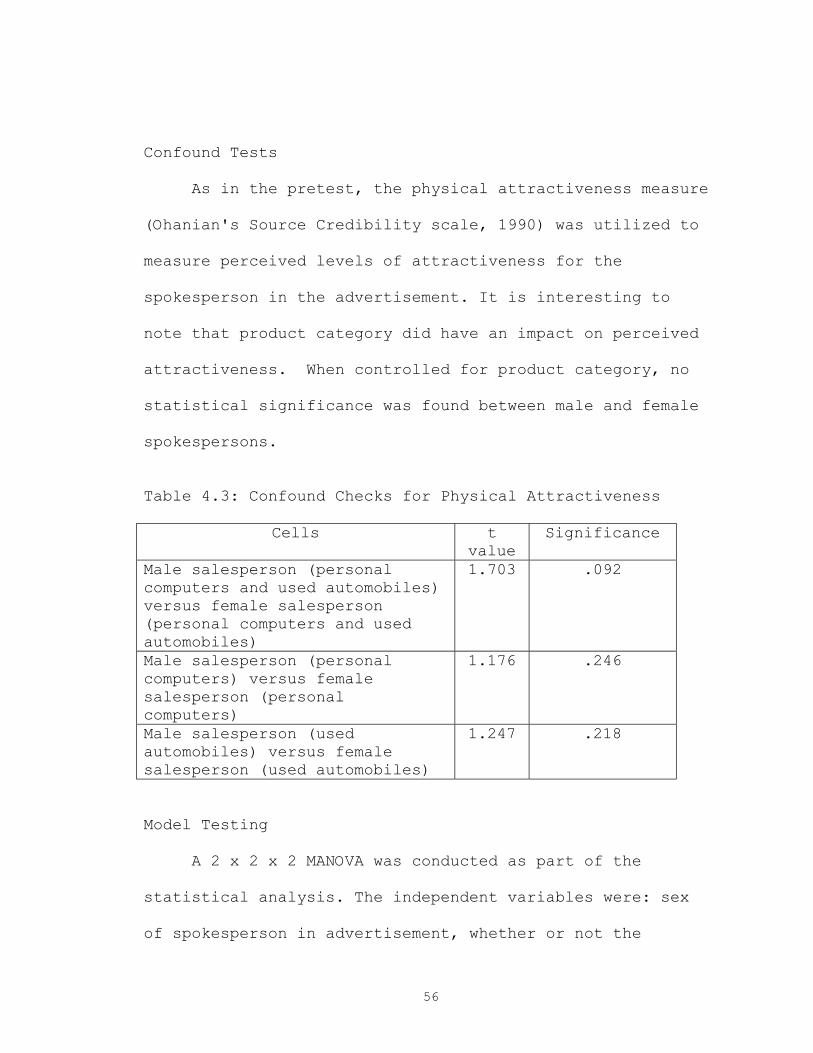
Confound Tests
As in the pretest, the physical attractiveness measure
(Ohanian's Source Credibility scale, 1990) was utilized to
measure perceived levels of attractiveness for the
spokesperson in the advertisement. It is interesting to
note that product category did have an impact on perceived
attractiveness. When controlled for product category, no
statistical significance was found between male and female
spokespersons.
Table 4.3: Confound Checks for Physical Attractiveness
Cells t value
Significance
Male salesperson (personal computers and used automobiles) versus female salesperson (personal computers and used automobiles)
1.703 .092
Male salesperson (personal computers) versus female salesperson (personal computers)
1.176 .246
Male salesperson (used automobiles) versus female salesperson (used automobiles)
1.247 .218
Model Testing
A 2 x 2 x 2 MANOVA was conducted as part of the
statistical analysis. The independent variables were: sex
of spokesperson in advertisement, whether or not the

57
spokesperson wore glasses, and either a positive or
negative product category. The dependent variables used in
the analysis were: attitude toward the advertisement,
attitude toward the salesperson (spokesperson), attitude
toward the product, purchase intentions, and both the
perceived level of trust and expertise of the spokesperson.
Perceived level of trust and expertise were added to the
analysis due to statistically significant results regarding
those variables and one of the independent variables (sex
of salesperson). A 2 x 2 x 2 MANCOVA was run with
involvement as a covariate; however, findings indicated
that involvement was highly correlated with product
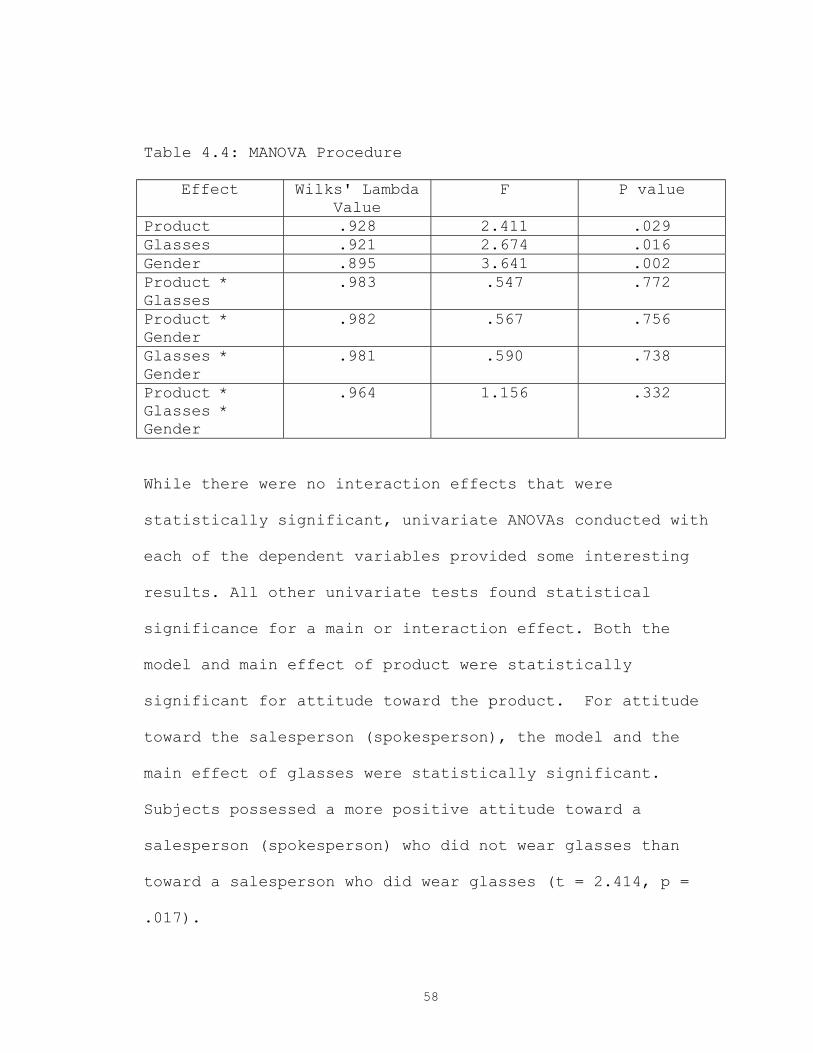
category and it was removed from the analysis. Table 4.4
contains the results from the MANOVA procedure; only main
effects were significant.
58
Table 4.4: MANOVA Procedure
Effect Wilks' Lambda Value
F P value
Product .928 2.411 .029 Glasses .921 2.674 .016 Gender .895 3.641 .002 Product * Glasses
.983 .547 .772
Product * Gender
.982 .567 .756
Glasses * Gender
.981 .590 .738
Product * Glasses * Gender
.964 1.156 .332
While there were no interaction effects that were
statistically significant, univariate ANOVAs conducted with
each of the dependent variables provided some interesting
results. All other univariate tests found statistical
significance for a main or interaction effect. Both the
model and main effect of product were statistically
significant for attitude toward the product. For attitude
toward the salesperson (spokesperson), the model and the
main effect of glasses were statistically significant.
Subjects possessed a more positive attitude toward a
salesperson (spokesperson) who did not wear glasses than
toward a salesperson who did wear glasses (t = 2.414, p =
.017).
59
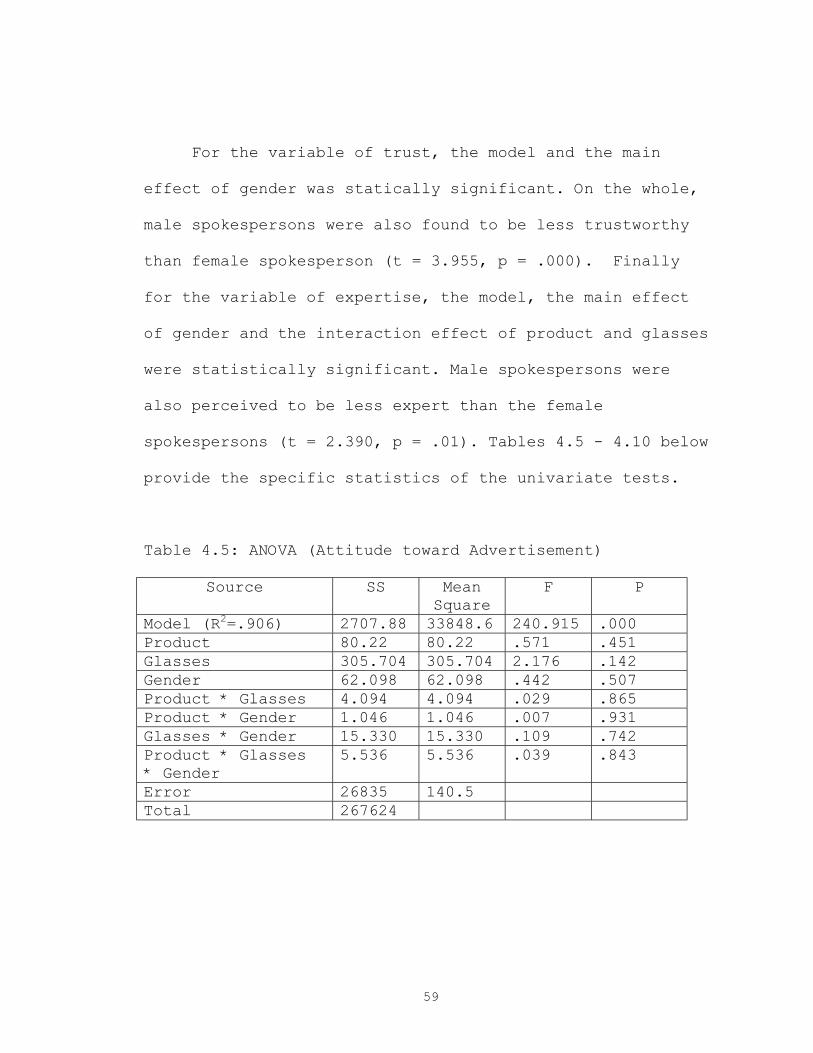
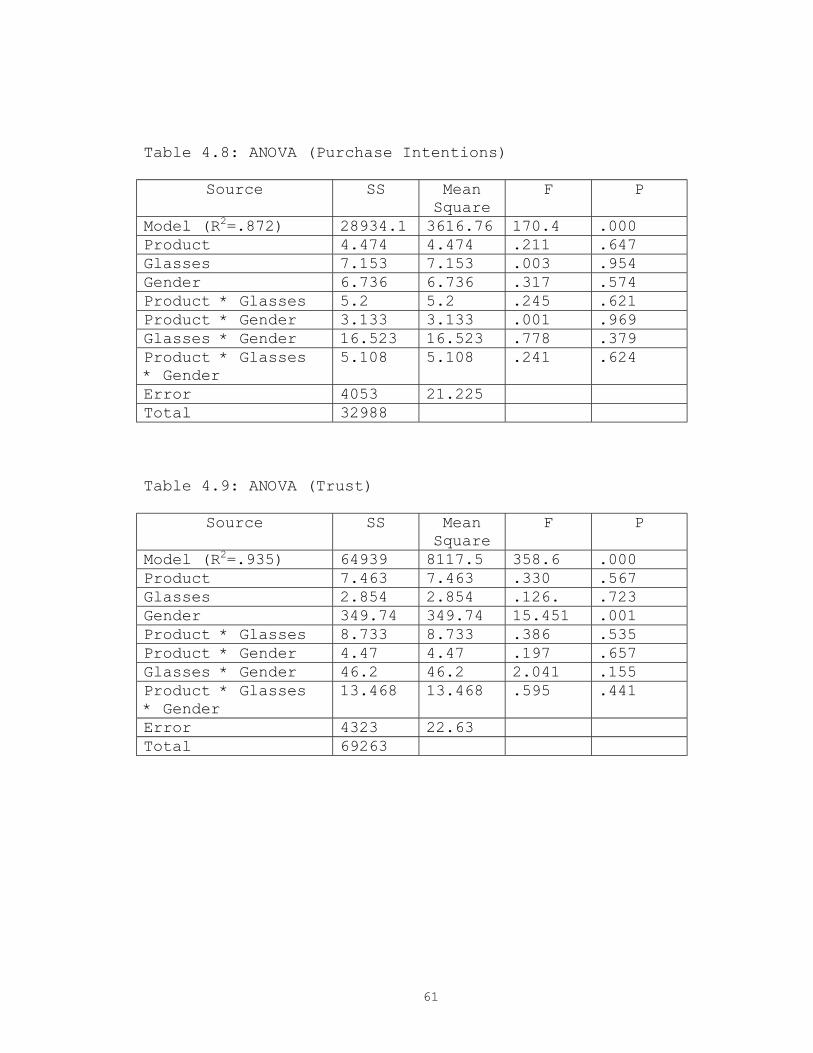
For the variable of trust, the model and the main
effect of gender was statically significant. On the whole,
male spokespersons were also found to be less trustworthy
than female spokesperson (t = 3.955, p = .000). Finally
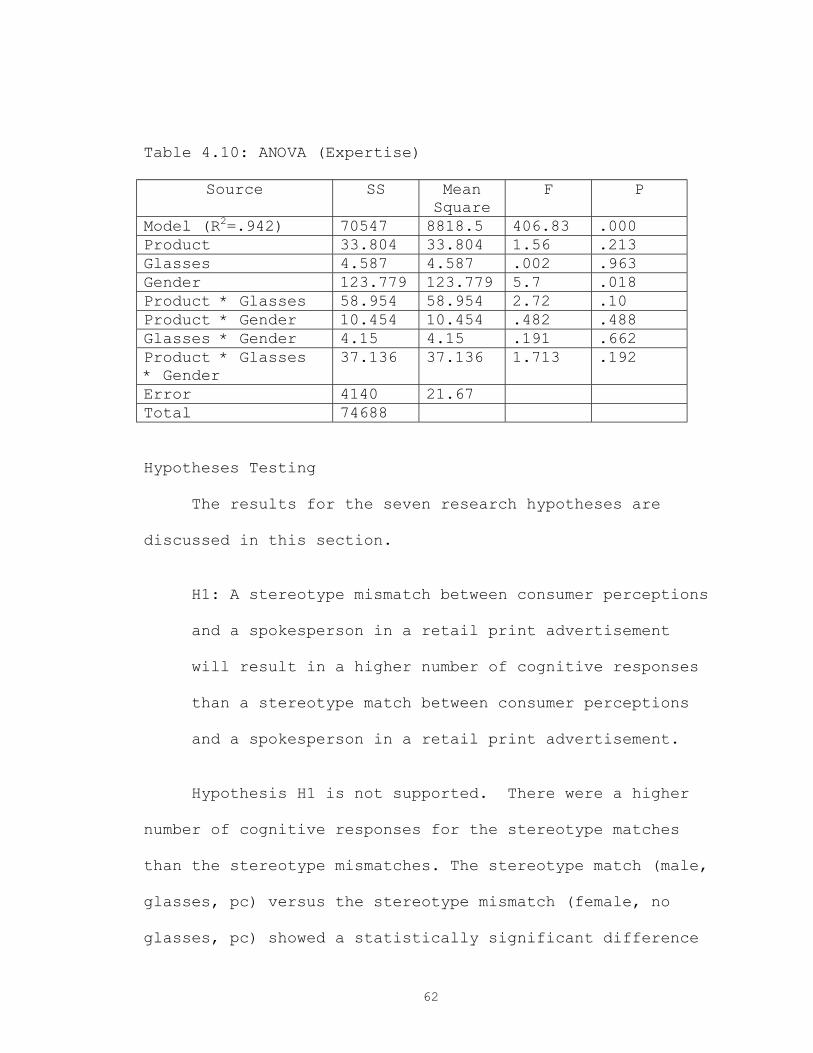
for the variable of expertise, the model, the main effect
of gender and the interaction effect of product and glasses
were statistically significant. Male spokespersons were
also perceived to be less expert than the female
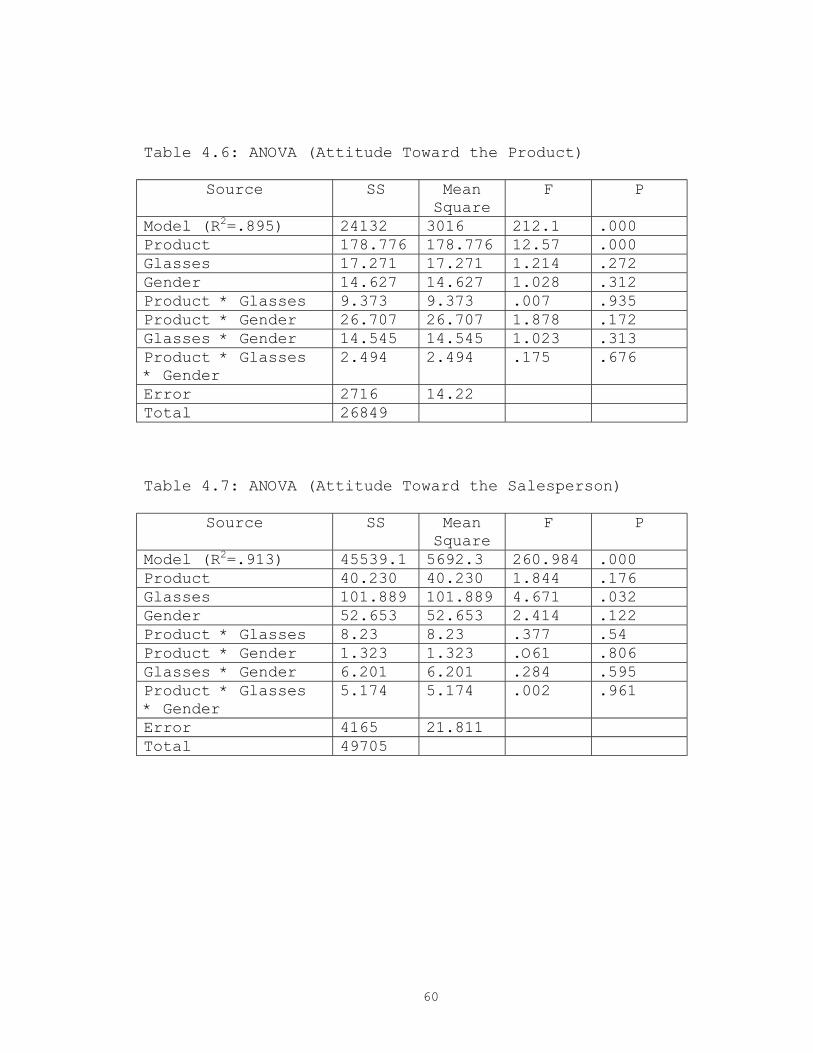
spokespersons (t = 2.390, p = .01). Tables 4.5 - 4.10 below
provide the specific statistics of the univariate tests.
Table 4.5: ANOVA (Attitude toward Advertisement)
Source SS Mean Square
F P
Model (R2=.906) 2707.88 33848.6 240.915 .000 Product 80.22 80.22 .571 .451 Glasses 305.704 305.704 2.176 .142 Gender 62.098 62.098 .442 .507 Product * Glasses 4.094 4.094 .029 .865 Product * Gender 1.046 1.046 .007 .931 Glasses * Gender 15.330 15.330 .109 .742 Product * Glasses * Gender
5.536 5.536 .039 .843
Error 26835 140.5 Total 267624
60
Table 4.6: ANOVA (Attitude Toward the Product)
Source SS Mean Square
F P
Model (R2=.895) 24132 3016 212.1 .000 Product 178.776 178.776 12.57 .000 Glasses 17.271 17.271 1.214 .272 Gender 14.627 14.627 1.028 .312 Product * Glasses 9.373 9.373 .007 .935 Product * Gender 26.707 26.707 1.878 .172 Glasses * Gender 14.545 14.545 1.023 .313 Product * Glasses * Gender
2.494 2.494 .175 .676
Error 2716 14.22 Total 26849 Table 4.7: ANOVA (Attitude Toward the Salesperson)
Source SS Mean Square
F P
Model (R2=.913) 45539.1 5692.3 260.984 .000 Product 40.230 40.230 1.844 .176 Glasses 101.889 101.889 4.671 .032 Gender 52.653 52.653 2.414 .122 Product * Glasses 8.23 8.23 .377 .54 Product * Gender 1.323 1.323 .O61 .806 Glasses * Gender 6.201 6.201 .284 .595 Product * Glasses * Gender
5.174 5.174 .002 .961
Error 4165 21.811 Total 49705
61
Table 4.8: ANOVA (Purchase Intentions)
Source SS Mean Square
F P
Model (R2=.872) 28934.1 3616.76 170.4 .000 Product 4.474 4.474 .211 .647 Glasses 7.153 7.153 .003 .954 Gender 6.736 6.736 .317 .574 Product * Glasses 5.2 5.2 .245 .621 Product * Gender 3.133 3.133 .001 .969 Glasses * Gender 16.523 16.523 .778 .379 Product * Glasses * Gender
5.108 5.108 .241 .624
Error 4053 21.225 Total 32988 Table 4.9: ANOVA (Trust)
Source SS Mean Square
F P
Model (R2=.935) 64939 8117.5 358.6 .000 Product 7.463 7.463 .330 .567 Glasses 2.854 2.854 .126. .723 Gender 349.74 349.74 15.451 .001 Product * Glasses 8.733 8.733 .386 .535 Product * Gender 4.47 4.47 .197 .657 Glasses * Gender 46.2 46.2 2.041 .155 Product * Glasses * Gender
13.468 13.468 .595 .441
Error 4323 22.63 Total 69263
62
Table 4.10: ANOVA (Expertise)
Source SS Mean Square
F P
Model (R2=.942) 70547 8818.5 406.83 .000 Product 33.804 33.804 1.56 .213 Glasses 4.587 4.587 .002 .963 Gender 123.779 123.779 5.7 .018 Product * Glasses 58.954 58.954 2.72 .10 Product * Gender 10.454 10.454 .482 .488 Glasses * Gender 4.15 4.15 .191 .662 Product * Glasses * Gender
37.136 37.136 1.713 .192
Error 4140 21.67 Total 74688 Hypotheses Testing
The results for the seven research hypotheses are
discussed in this section.
H1: A stereotype mismatch between consumer perceptions
and a spokesperson in a retail print advertisement
will result in a higher number of cognitive responses
than a stereotype match between consumer perceptions
and a spokesperson in a retail print advertisement.
Hypothesis H1 is not supported. There were a higher
number of cognitive responses for the stereotype matches
than the stereotype mismatches. The stereotype match (male,
glasses, pc) versus the stereotype mismatch (female, no
glasses, pc) showed a statistically significant difference
63
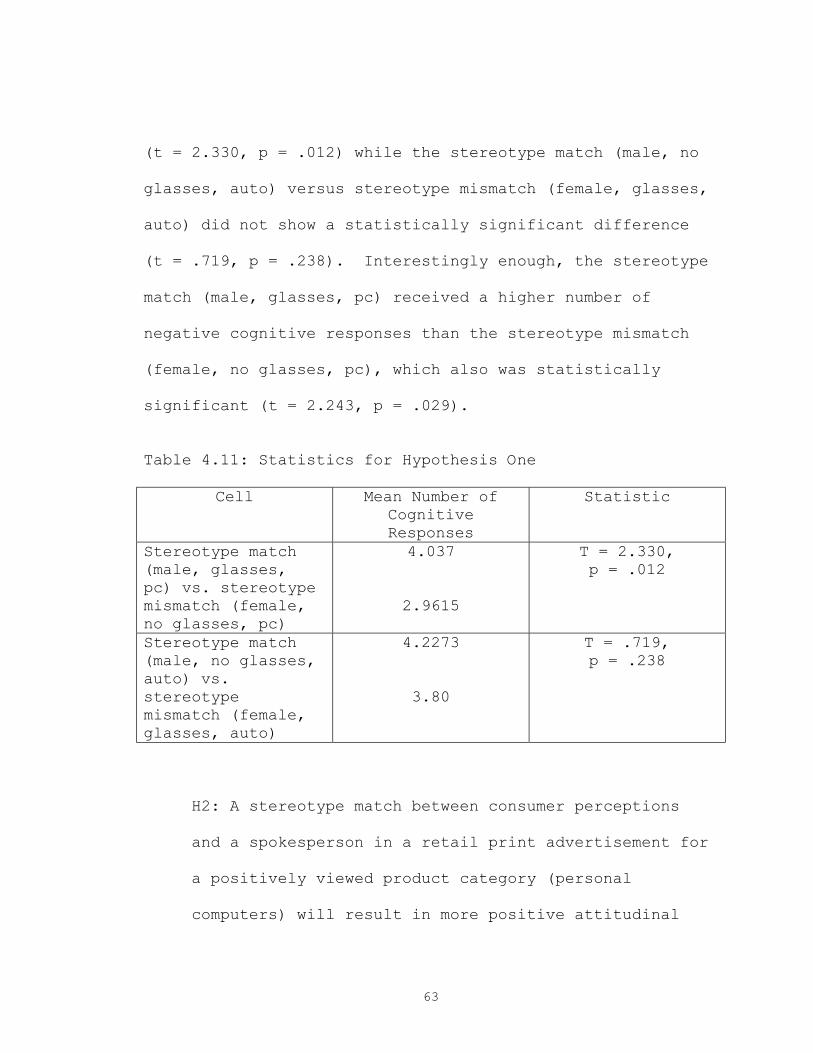
(t = 2.330, p = .012) while the stereotype match (male, no
glasses, auto) versus stereotype mismatch (female, glasses,
auto) did not show a statistically significant difference
(t = .719, p = .238). Interestingly enough, the stereotype
match (male, glasses, pc) received a higher number of
negative cognitive responses than the stereotype mismatch
(female, no glasses, pc), which also was statistically
significant (t = 2.243, p = .029).
Table 4.11: Statistics for Hypothesis One
Cell Mean Number of Cognitive Responses
Statistic
Stereotype match (male, glasses, pc) vs. stereotype mismatch (female, no glasses, pc)
4.037
2.9615
T = 2.330, p = .012
Stereotype match (male, no glasses, auto) vs. stereotype mismatch (female, glasses, auto)
4.2273
3.80
T = .719, p = .238
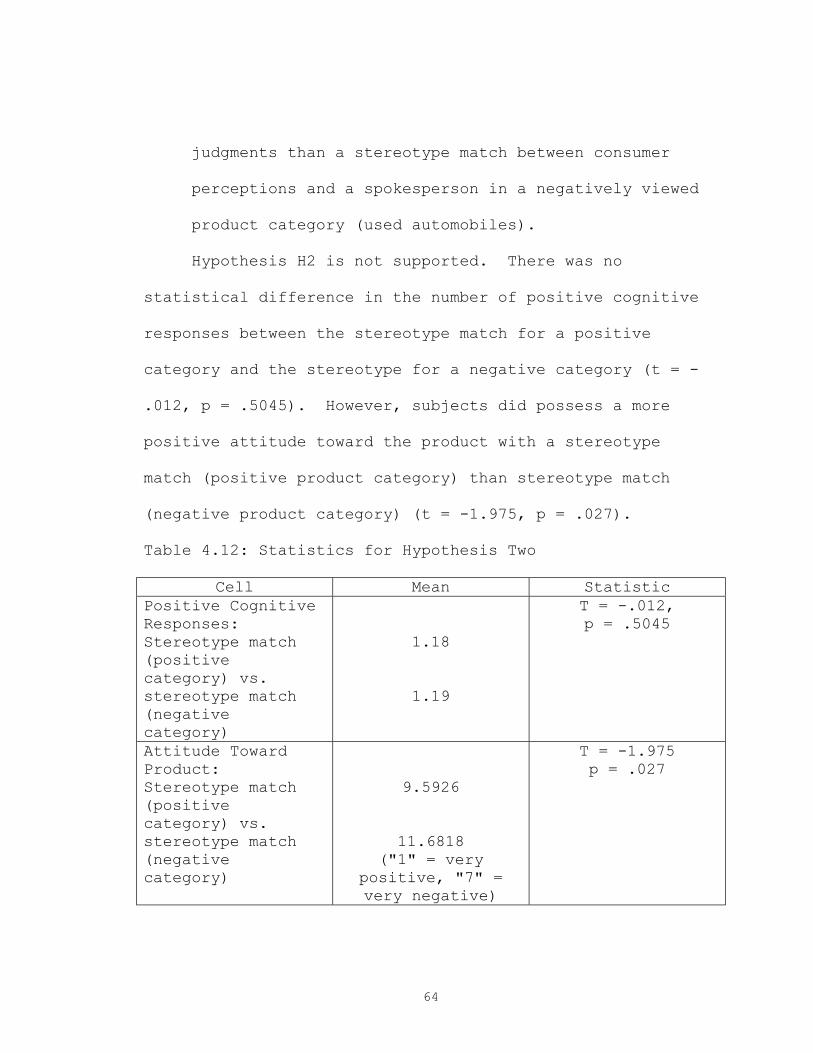
H2: A stereotype match between consumer perceptions
and a spokesperson in a retail print advertisement for
a positively viewed product category (personal
computers) will result in more positive attitudinal
64
judgments than a stereotype match between consumer
perceptions and a spokesperson in a negatively viewed
product category (used automobiles).
Hypothesis H2 is not supported. There was no
statistical difference in the number of positive cognitive
responses between the stereotype match for a positive
category and the stereotype for a negative category (t = -
.012, p = .5045). However, subjects did possess a more
positive attitude toward the product with a stereotype
match (positive product category) than stereotype match
(negative product category) (t = -1.975, p = .027).
Table 4.12: Statistics for Hypothesis Two
Cell Mean Statistic Positive Cognitive Responses: Stereotype match (positive category) vs. stereotype match (negative category)
1.18
1.19
T = -.012, p = .5045
Attitude Toward Product: Stereotype match (positive category) vs. stereotype match (negative category)
9.5926
11.6818 ("1" = very
positive, "7" = very negative)
T = -1.975 p = .027
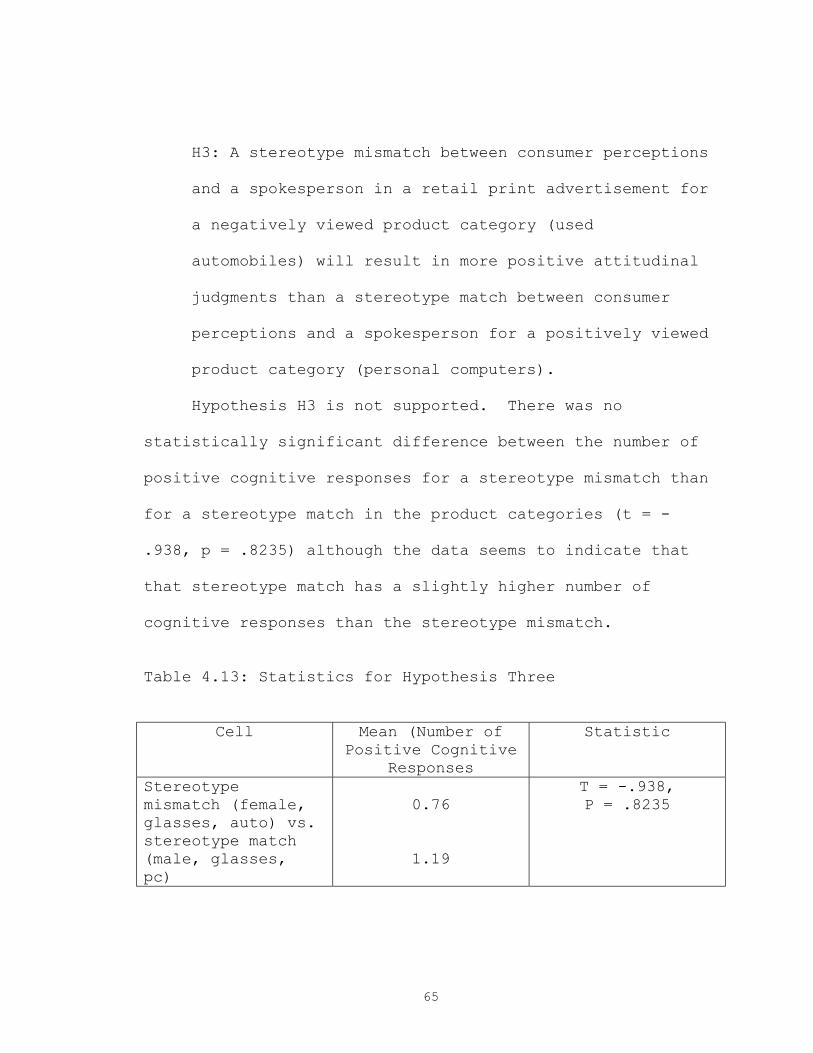
65
H3: A stereotype mismatch between consumer perceptions
and a spokesperson in a retail print advertisement for
a negatively viewed product category (used
automobiles) will result in more positive attitudinal
judgments than a stereotype match between consumer
perceptions and a spokesperson for a positively viewed
product category (personal computers).
Hypothesis H3 is not supported. There was no
statistically significant difference between the number of
positive cognitive responses for a stereotype mismatch than
for a stereotype match in the product categories (t = -
.938, p = .8235) although the data seems to indicate that
that stereotype match has a slightly higher number of
cognitive responses than the stereotype mismatch.
Table 4.13: Statistics for Hypothesis Three
Cell Mean (Number of Positive Cognitive
Responses
Statistic
Stereotype mismatch (female, glasses, auto) vs. stereotype match (male, glasses, pc)
0.76
1.19
T = -.938, P = .8235
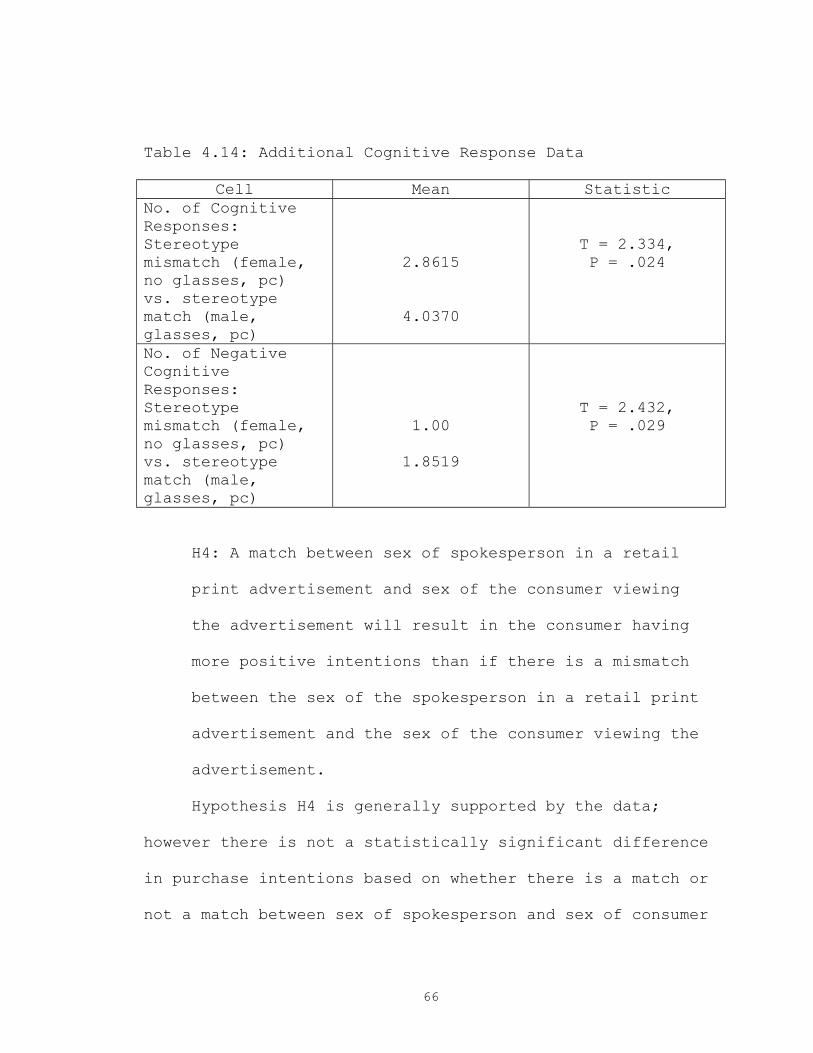
66
Table 4.14: Additional Cognitive Response Data
Cell Mean Statistic No. of Cognitive Responses: Stereotype mismatch (female, no glasses, pc) vs. stereotype match (male, glasses, pc)
2.8615
4.0370
T = 2.334, P = .024
No. of Negative Cognitive Responses: Stereotype mismatch (female, no glasses, pc) vs. stereotype match (male, glasses, pc)
1.00
1.8519
T = 2.432, P = .029
H4: A match between sex of spokesperson in a retail
print advertisement and sex of the consumer viewing
the advertisement will result in the consumer having
more positive intentions than if there is a mismatch
between the sex of the spokesperson in a retail print
advertisement and the sex of the consumer viewing the
advertisement.
Hypothesis H4 is generally supported by the data;
however there is not a statistically significant difference
in purchase intentions based on whether there is a match or
not a match between sex of spokesperson and sex of consumer
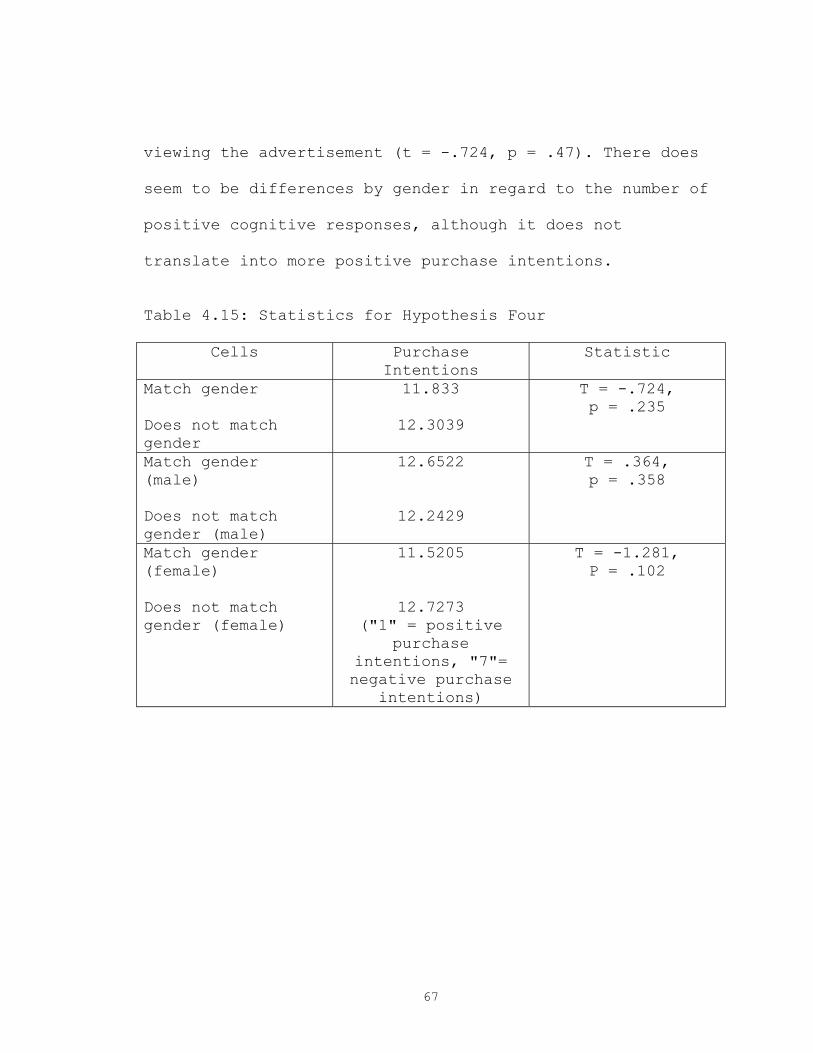
67
viewing the advertisement (t = -.724, p = .47). There does
seem to be differences by gender in regard to the number of
positive cognitive responses, although it does not
translate into more positive purchase intentions.
Table 4.15: Statistics for Hypothesis Four
Cells Purchase Intentions
Statistic
Match gender Does not match gender
11.833
12.3039
T = -.724, p = .235
Match gender (male) Does not match gender (male)
12.6522
12.2429
T = .364, p = .358
Match gender (female) Does not match gender (female)
11.5205
12.7273 ("1" = positive
purchase intentions, "7"= negative purchase
intentions)
T = -1.281, P = .102
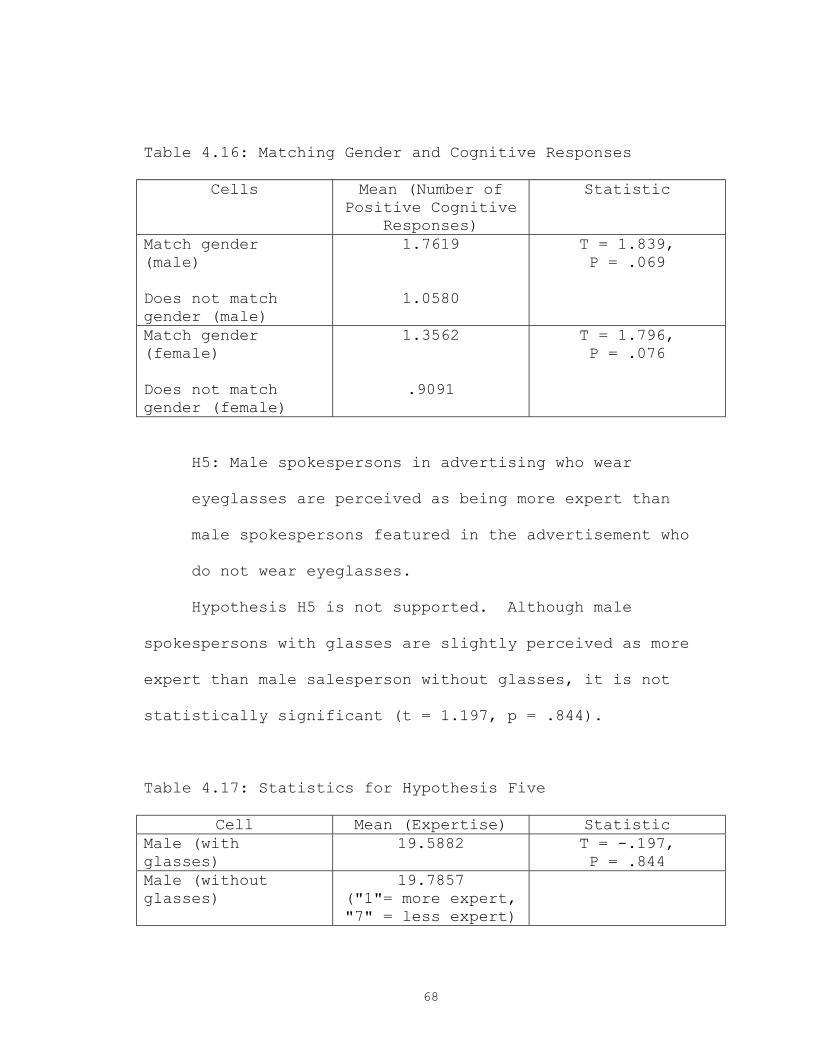
68
Table 4.16: Matching Gender and Cognitive Responses
Cells Mean (Number of Positive Cognitive
Responses)
Statistic
Match gender (male) Does not match gender (male)
1.7619
1.0580
T = 1.839, P = .069
Match gender (female) Does not match gender (female)
1.3562
.9091
T = 1.796, P = .076
H5: Male spokespersons in advertising who wear
eyeglasses are perceived as being more expert than
male spokespersons featured in the advertisement who
do not wear eyeglasses.
Hypothesis H5 is not supported. Although male
spokespersons with glasses are slightly perceived as more
expert than male salesperson without glasses, it is not
statistically significant (t = 1.197, p = .844).
Table 4.17: Statistics for Hypothesis Five
Cell Mean (Expertise) Statistic Male (with glasses)
19.5882 T = -.197, P = .844
Male (without glasses)
19.7857 ("1"= more expert, "7" = less expert)
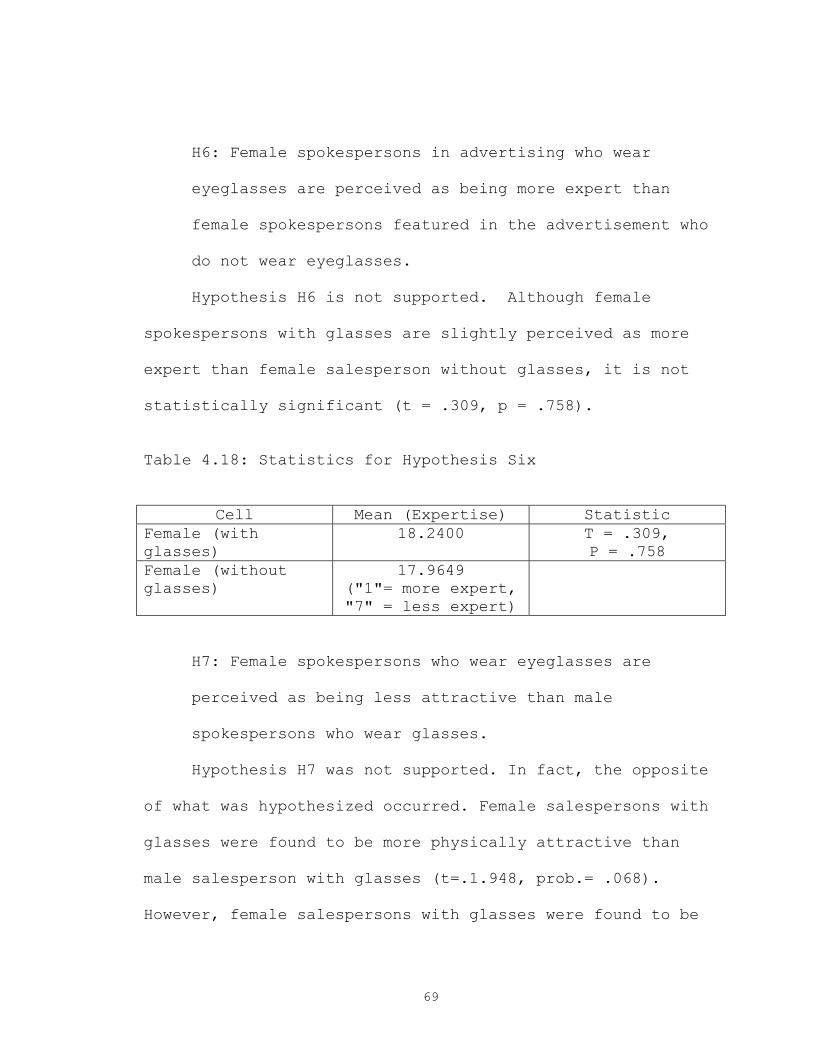
69
H6: Female spokespersons in advertising who wear
eyeglasses are perceived as being more expert than
female spokespersons featured in the advertisement who
do not wear eyeglasses.
Hypothesis H6 is not supported. Although female
spokespersons with glasses are slightly perceived as more
expert than female salesperson without glasses, it is not
statistically significant (t = .309, p = .758).
Table 4.18: Statistics for Hypothesis Six
Cell Mean (Expertise) Statistic Female (with glasses)
18.2400 T = .309, P = .758
Female (without glasses)
17.9649 ("1"= more expert, "7" = less expert)
H7: Female spokespersons who wear eyeglasses are
perceived as being less attractive than male
spokespersons who wear glasses.
Hypothesis H7 was not supported. In fact, the opposite
of what was hypothesized occurred. Female salespersons with
glasses were found to be more physically attractive than
male salesperson with glasses (t=.1.948, prob.= .068).
However, female salespersons with glasses were found to be
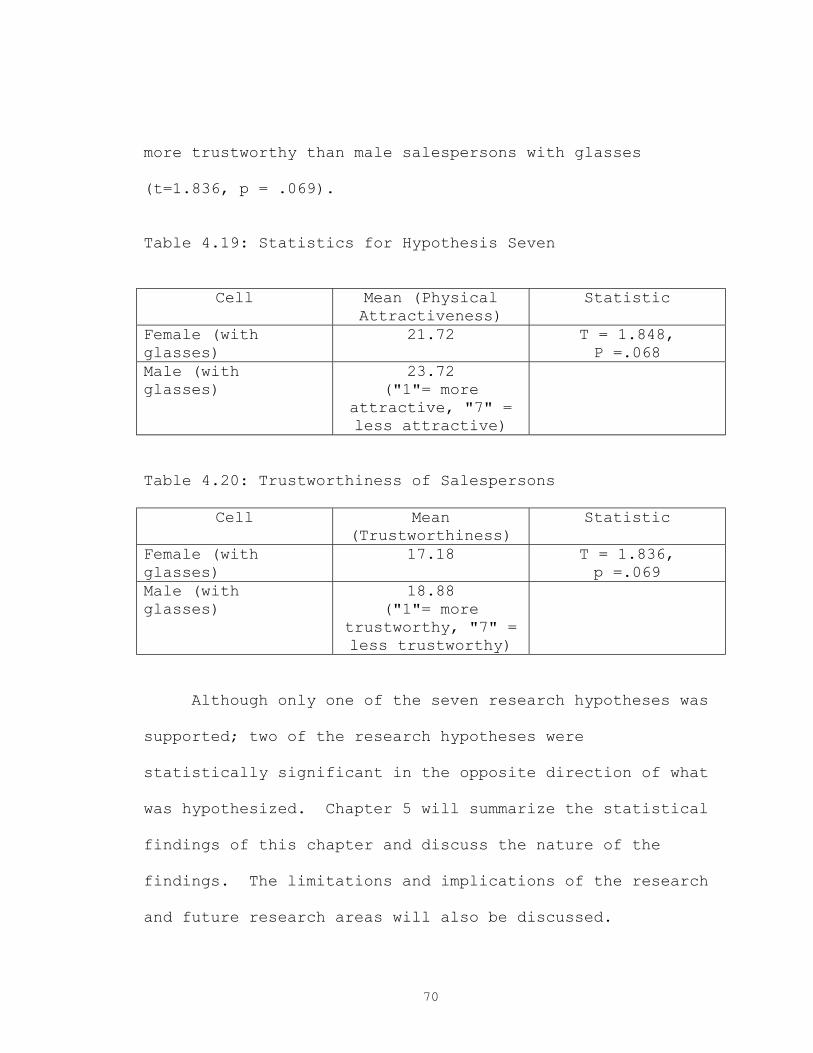
70
more trustworthy than male salespersons with glasses
(t=1.836, p = .069).
Table 4.19: Statistics for Hypothesis Seven
Cell Mean (Physical Attractiveness)
Statistic
Female (with glasses)
21.72 T = 1.848, P =.068
Male (with glasses)
23.72 ("1"= more
attractive, "7" = less attractive)
Table 4.20: Trustworthiness of Salespersons
Cell Mean (Trustworthiness)
Statistic
Female (with glasses)
17.18 T = 1.836, p =.069
Male (with glasses)
18.88 ("1"= more
trustworthy, "7" = less trustworthy)
Although only one of the seven research hypotheses was
supported; two of the research hypotheses were
statistically significant in the opposite direction of what
was hypothesized. Chapter 5 will summarize the statistical
findings of this chapter and discuss the nature of the
findings. The limitations and implications of the research
and future research areas will also be discussed.
71
CHAPTER V
FINDINGS AND RECOMMENDATIONS
This research sought to examine the characteristics
that impact how consumers view print advertisement that
include a spokesperson. Specifically, it was designed to
examine how consumers view and process spokesperson and
product category information from advertisements and how it
impacts their attitudes. A considerable amount of the
literature concerning the spokesperson or salesperson has
concentrated on the consumer perspective of meeting and
personally interacting with a person. This research
attempted to apply research on spokespersons using a print
advertisement perspective. The perspective focused on how
the consumer views the spokesperson from a two dimensional,
visual-only perspective. Although there had been some early
work in the area of salesperson and spokesperson
stereotypes (Thompson 1972, Darden and French 1971), the
topic of how salesperson stereotypes impact consumer
attitudes and cognitive responses has remained an area in
need of more academic research (Reingen and Kerman 1993).
72
This experiment was designed to test the effects of a
negatively or positively viewed product category, the
impact of eyeglasses being worn by a spokesperson, and the
influence of the spokesperson's gender on the consumers'
attitudes toward the advertisement, spokesperson, product,
and purchase intentions. Literature (Pavelchak 1991,
Babin, Boles and Darden 1995) had identified two
stereotypes of spokesperson that were to be used in the
research: a typical personal computer spokesperson was
identified as being male and wearing glasses and a typical
used automobile salesperson was identified as being male
and not wearing glasses. Thus, the research was also able
to compare attitudes by consumers based on whether they
were exposed to a stereotypical spokesperson or to a
nonstereotypical spokesperson.
Research found that the product category, whether or
not the spokesperson wore glasses, and the gender of the
spokesperson did in fact have a significant impact on the
dependent variables of attitude toward the advertisement,
attitude toward the salesperson (spokesperson), attitude
toward the product, purchase intentions, and perceived
levels of trust and expertise of the spokesperson.
However, there were no interactions between the independent
73
variables. Most surprising was the lack of interaction
between the sex of the spokesperson and whether eyeglasses
were worn by the spokesperson; psychological literature
(Terry 1989, Harris 1991) had indicated that a possible
interaction effect might be found.
The expectation was that a consumer would view a
nonstereotypical spokesperson with a different set of
reactions than a stereotypical spokesperson. It was
hypothesized that a consumer would have not only more
cognitive responses, but more positive cognitive responses
when the spokesperson was atypical versus when the
spokesperson was typical. However, results indicate that
the exact opposite occurred in most instances. A
stereotype match in the both the personal computer category
and the used automobile category had a higher number of
cognitive responses than the stereotype mismatch. The
stereotype match in general did have more negative
cognitive responses than the stereotype mismatch, possibly
indicating the general negative stereotype of a salesperson
(even when used as a spokesperson in an advertisement) did
translate into more negative views of the spokesperson in
this print advertisement.
74
Stereotypes also seemed to have little effect on the
higher order attitudinal judgments (for example, attitude
toward the spokesperson, purchase intentions) of the
consumer; their effect was limited to the lower order
measures (for example, number and type of cognitive
responses). This would indicate that perhaps stereotypes
do operate at a lower cognitive level, but other more
relevant attitudinal measures have more impact on consumer
perceptions of a product and/or their purchase intentions.
Furthermore, this lower order effect was also found
in regard to gender as well. A match between the sex of
the spokesperson in the advertisement and the sex of the
consumer viewing the advertisement resulted in more
positive cognitive responses. This did not translate into a
statistical significance regarding purchase intentions or
any of the other dependent variables.
Surprisingly, it was also found that wearing glasses
did not translate into a person being perceived as more
expert than if the person did not wear glasses. This is
contrary to the literature (Manz and Lueck 1968, Boshier
1975, Harris 1991) and to many widely held notions of
intelligence and appearance. Fashion models have for many
75
years worn glasses without any lenses on photoshoots in
order to appear more intelligent to the viewer.
While only one of the hypothesized relationships of
the research was found to be supported; two of the research
hypotheses regarding stereotypes were statistically
significant in the opposite direction. There are some
interesting conclusions that can be drawn from these
results. The spokesperson stereotypes (male, with glasses,
personal computer and male, without glasses, used
automobiles) were chosen due to existing literature
(Pavelchak 1991) that pointed to the proven existence of
each of the stereotypes. Much of the literature in this
area is dated and the research suggests that the
stereotypes in the technology industry may be changing much
faster than academic literature suggests (Strober and
Arnold 1987, Thottam 2001, Sunny 2000, Eisenberg 2000).
Pavelchak's research was published in 1991, it would be
interesting to see if the same results apply today, when
monumental changes in technology have occurred over the
last decade. Today, it is not unusual to see either a
female salesperson or a female executive officer in the
technology industry, especially for computer firms. The
changes in technological stereotypes would certainly impact
76
the experimental variables in the study and cloud the
results in regards to any data regarding the computer
product category.
Research in the area of gender dominated products has
indicated that subjects in general do have more positive
perceptions when there is a match between the type of
product (whether it is more male dominant or female
dominant) and the sex of the spokesperson in the
advertisement (Whipple and Courtney 1985); however there is
also research that indicates that the use of the opposite
sex can be more positive than the use of the same sex
(Debevec and Iyer 1985, Whipple and Courntey 1980). The
dissertation research found that the match-up of sex of
salesperson in the advertisement and sex of respondent
viewing the advertisement was not statistically
significant. It would be of interest in future research to
examine the issue in regard to male or female dominant
product categories instead of positive or negative product
categories. While research indicates the automotive
category remains male dominant (Stafford 1998), it would be
interesting to discover whether computers are considered
more male or female dominant and the extent of the gender
domination.
77
A major limitation of the research, which may have
impacted the results of the experiment, is the use of
forced exposure. Forced exposure is traditionally used in
advertising research; in this instance subjects were
allowed one minute to view the advertisement and three
minutes to write down their cognitive responses to the
advertisement. Since the research dealt with stereotypes
and how consumers react to nonstereotypical and
stereotypical salespersons in the advertisement, subjects
may have been forced to view the advertisement much longer
than they might have necessarily viewed the advertisement.
Literature suggests that when consumers view anything or
anyone in an advertisement that they do not expect to be
there, the consumers tend to pay more attention to the
advertisement. Thus, when the consumer views a person who
is nonstereotypical in the advertisement, they would,
according to theory, view it longer and have more cognitive
processing than if it were an advertisement which was
typical or what they expected. Thus, forcing subjects to
view the advertisement the same amount of time could have
caused a major effect to the data collection.
Another limitation of the research deals specifically
with changing stereotypes. It is quite possible the
78
stereotypical view of a computer salesperson or
spokesperson being male and wearing glasses is not as
widely held as it once was a decade ago. This could
impact the results of the experiment since the stereotypes
for the personal computer category may not be as widely and
as strongly held as the stereotypes for the used automobile
industry.
Another limitation of the study is the lack of
information on eyeglasses. This research shows that the
match of gender between a spokesperson and the consumer
viewing the advertisement had an effect on cognitive
responses. Based on these results the academic literature
of psychological similarity, future research could examine
the relationships to see if a person who wears glasses (or
even contact lenses) has a more positive cognitive
responses and attitudes toward a spokesperson who wears
glasses than a spokesperson who does not wear glasses.
However, no data was collected for this study in regard to
whether the respondent did or did not wear glasses.
Due to the fact that the data was gathered in
Northeast Texas region, there could be differences between
the sample and a general sample of all U.S. consumers.
While neither of the product categories (used automobiles
79
or personal computers) are regional centric products (i.e.
like tortillas or snow skis), certainly some geographic
biases could be contained in the data.
Further research in the area of stereotypes and
salespersons in advertisements needs to be conducted to
determine any changes that have occurred in stereotype
perceptions and how any of those changes impact consumer
reactions to salespersons and advertisements that feature
salespersons. Most of the existing literature used in the
research in regard to the wearing of eyeglasses was not
based in marketing or sales research, it was based on
psychological studies of how children and adults view
people who wear glasses. Further research in this area
needs to be conducted in regard to how physical
appearances, especially whether or not the salesperson
wears glasses, impact consumer perceptions of salespersons
or spokespersons in advertisements. Furthermore, research
examining the differences between types of advertisements
that use a spokesperson would also be of interest.
Specifically, it would be useful to know the differences or
similarities between image only advertisements and
promotionally geared advertisements, both with
spokespersons in the advertisements.

80
APPENDIX A
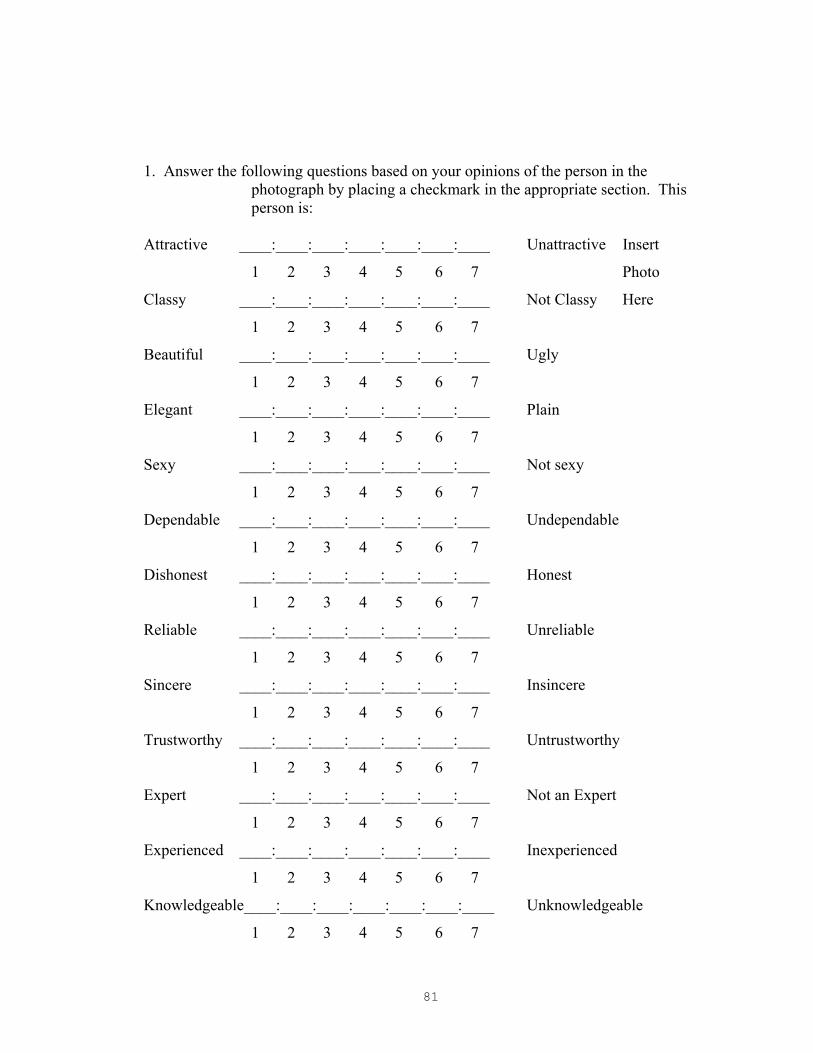
81
1. Answer the following questions based on your opinions of the person in the
photograph by placing a checkmark in the appropriate section. This person is:
Attractive ____:____:____:____:____:____:____ Unattractive Insert
1 2 3 4 5 6 7 Photo
Classy ____:____:____:____:____:____:____ Not Classy Here
1 2 3 4 5 6 7
Beautiful ____:____:____:____:____:____:____ Ugly
1 2 3 4 5 6 7
Elegant ____:____:____:____:____:____:____ Plain
1 2 3 4 5 6 7
Sexy ____:____:____:____:____:____:____ Not sexy
1 2 3 4 5 6 7
Dependable ____:____:____:____:____:____:____ Undependable
1 2 3 4 5 6 7
Dishonest ____:____:____:____:____:____:____ Honest
1 2 3 4 5 6 7
Reliable ____:____:____:____:____:____:____ Unreliable
1 2 3 4 5 6 7
Sincere ____:____:____:____:____:____:____ Insincere
1 2 3 4 5 6 7
Trustworthy ____:____:____:____:____:____:____ Untrustworthy
1 2 3 4 5 6 7
Expert ____:____:____:____:____:____:____ Not an Expert
1 2 3 4 5 6 7
Experienced ____:____:____:____:____:____:____ Inexperienced
1 2 3 4 5 6 7
Knowledgeable____:____:____:____:____:____:____ Unknowledgeable
1 2 3 4 5 6 7
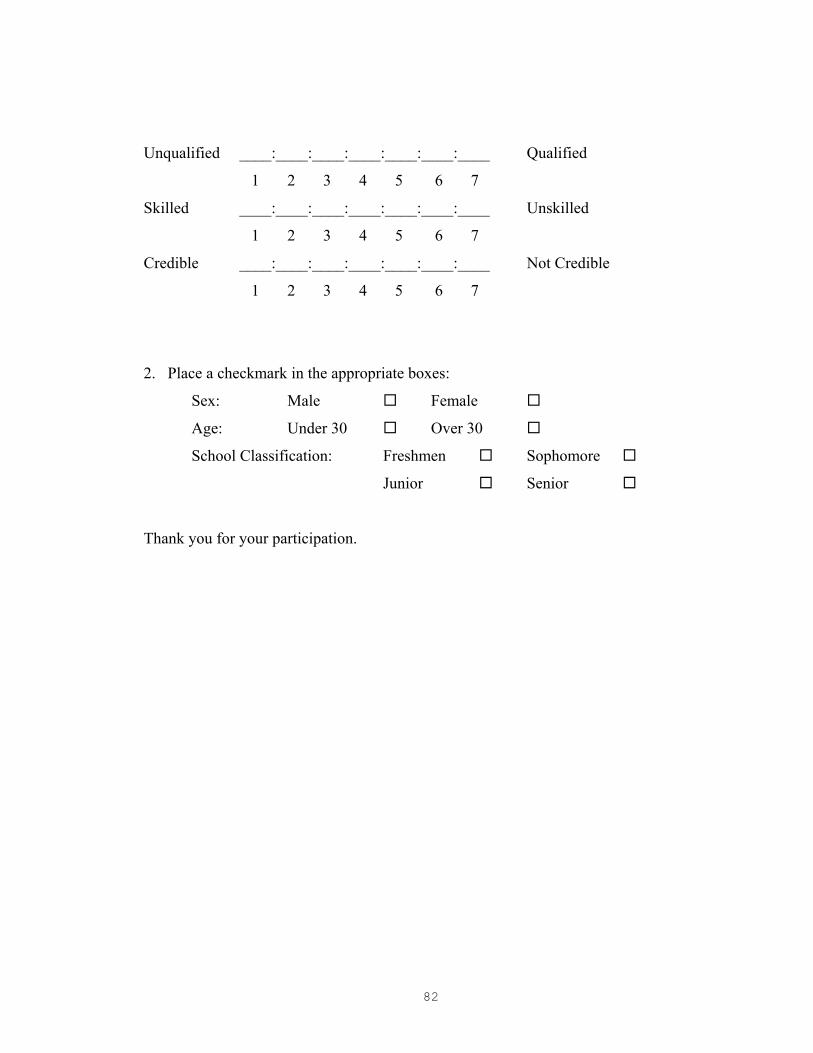
82
Unqualified ____:____:____:____:____:____:____ Qualified
1 2 3 4 5 6 7
Skilled ____:____:____:____:____:____:____ Unskilled
1 2 3 4 5 6 7
Credible ____:____:____:____:____:____:____ Not Credible
1 2 3 4 5 6 7
2. Place a checkmark in the appropriate boxes:
Sex: Male Female
Age: Under 30 Over 30
School Classification: Freshmen Sophomore
Junior Senior
Thank you for your participation.
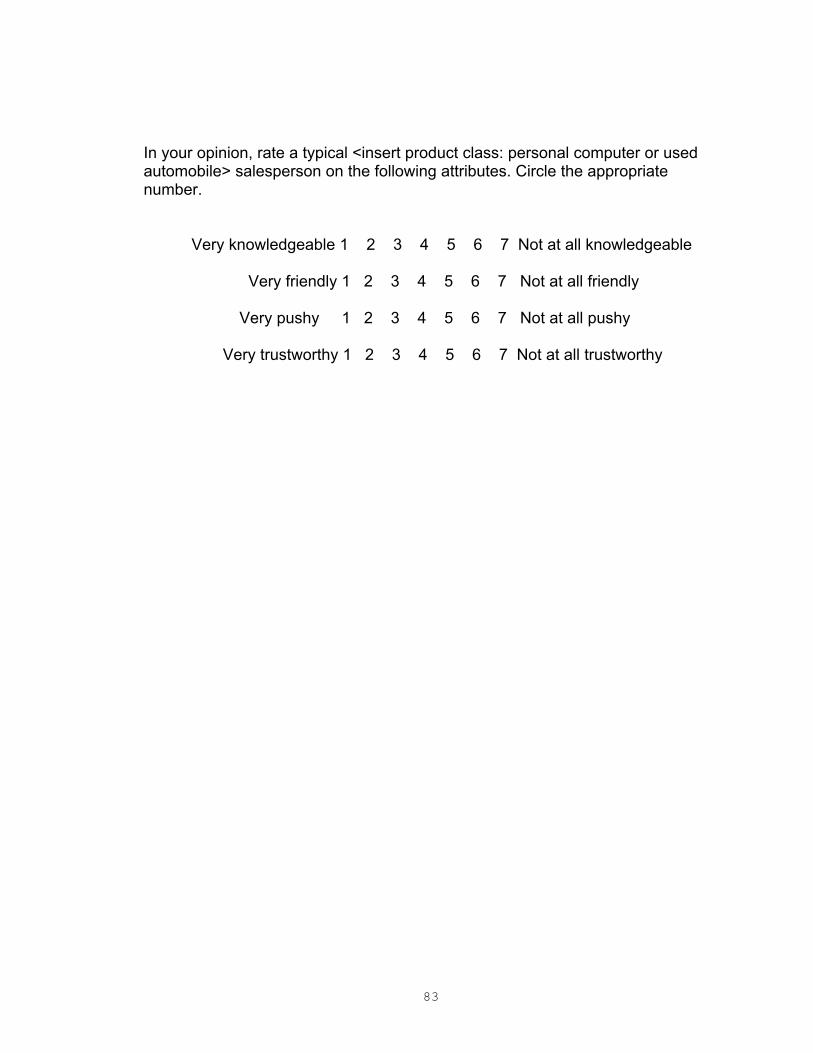
83
In your opinion, rate a typical <insert product class: personal computer or used automobile> salesperson on the following attributes. Circle the appropriate number. Very knowledgeable 1 2 3 4 5 6 7 Not at all knowledgeable Very friendly 1 2 3 4 5 6 7 Not at all friendly Very pushy 1 2 3 4 5 6 7 Not at all pushy
Very trustworthy 1 2 3 4 5 6 7 Not at all trustworthy
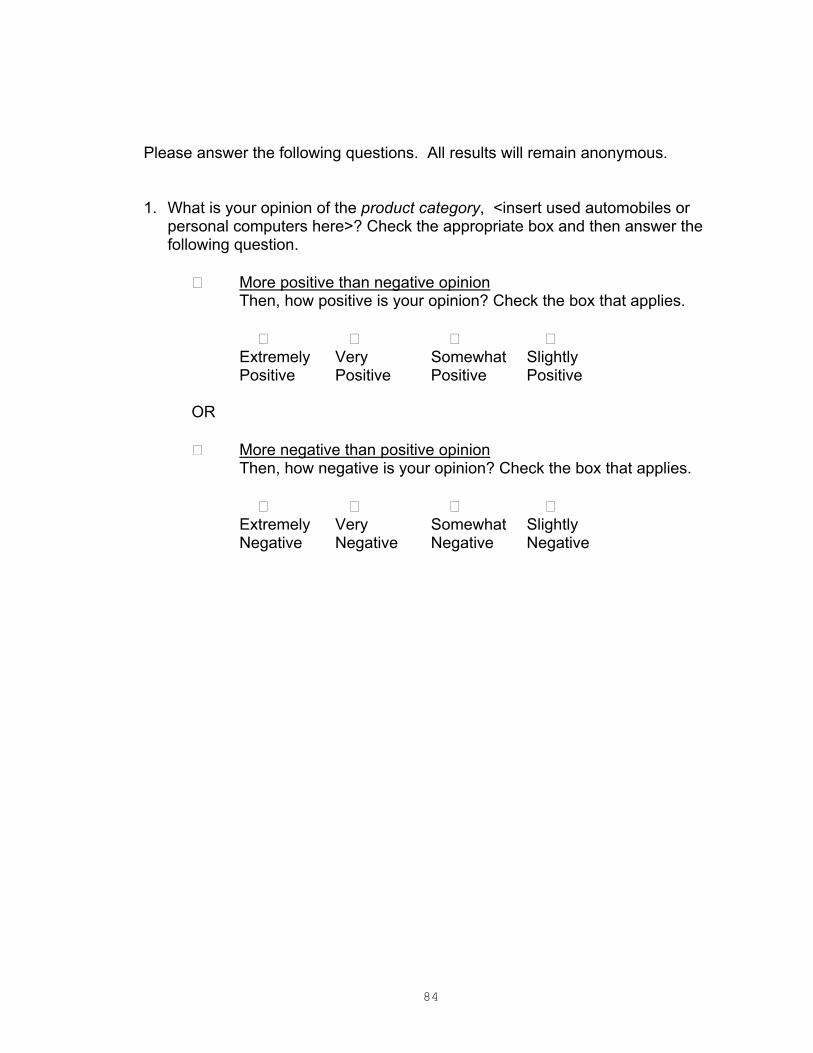
84
Please answer the following questions. All results will remain anonymous. 1. What is your opinion of the product category, <insert used automobiles or
personal computers here>? Check the appropriate box and then answer the following question.
More positive than negative opinion
Then, how positive is your opinion? Check the box that applies. Extremely Very Somewhat Slightly Positive Positive Positive Positive
OR
More negative than positive opinion
Then, how negative is your opinion? Check the box that applies. Extremely Very Somewhat Slightly Negative Negative Negative Negative

85
APPENDIX B
86
INSTRUCTIONS
Please look at the following ad for a new business in town. Read the advertisement for as long as you like. After you are finished, turn the ad over and without looking back at the ad, please complete the attached questionnaire.

87

88
Questionnaire Instructions There are several sections to this questionnaire. Each section has its own set of instructions. However, while completing this questionnaire, remember the following:
1. All responses are anonymous. 2. The questionnaire cannot be used unless every item is completed. 3. There are no right or wrong answers. Your opinions are what we want. 4. Work at a fairly high speed through the questionnaire. We really want your first
impressions. These are usually the most accurate. 5. Do not read ahead into the questionnaire. Also, once you have finished a section
do not turn back to a previous section. But you may work at your own pace throughout the questionnaire.
6. When you respond to a series of scales, please use the following guide and examples:
If you feel that your opinion is very closely related to one end of the scale or the other, you should place your ‘X’ as follows: This is good _X__ ____ ____ ____ ____ ____ ____ This is bad. or This is good ____ ____ ____ ____ ____ ____ _ X_ This is bad. If you feel that your opinion is closely related to one end of the scale or the other (but not extremely), you should place your ‘X’ as follows:
This is good ____ X ____ ____ ____ ____ ____ This is bad. or
This is good ____ ____ ____ ____ ____ _ X_ ____ This is bad. If you feel that your opinion is slightly related to one end of the scale or the other (but not really neutral), you should place your ‘X’ as follows:
This is good ____ ____ _ X_ ____ ____ ____ ____ This is bad. or
This is good ____ ____ ____ ____ _ X ____ ____ This is bad.
If you feel that your opinion is neutral, then you should place your ‘X’ as follows:
This is good ____ ____ ____ _ X ____ ____ ____ This is bad.
IMPORTANT: Never put more than one ‘X’ on a single scale.
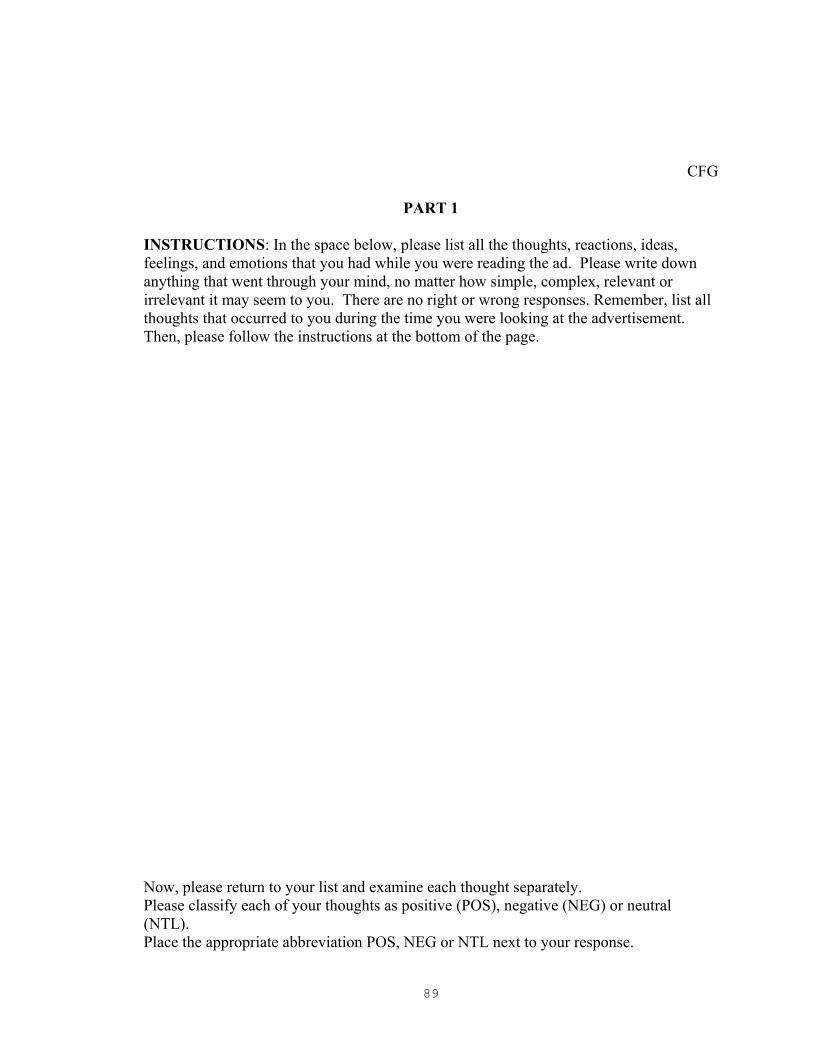
89
CFG
PART 1
INSTRUCTIONS: In the space below, please list all the thoughts, reactions, ideas, feelings, and emotions that you had while you were reading the ad. Please write down anything that went through your mind, no matter how simple, complex, relevant or irrelevant it may seem to you. There are no right or wrong responses. Remember, list all thoughts that occurred to you during the time you were looking at the advertisement. Then, please follow the instructions at the bottom of the page. Now, please return to your list and examine each thought separately. Please classify each of your thoughts as positive (POS), negative (NEG) or neutral (NTL). Place the appropriate abbreviation POS, NEG or NTL next to your response.
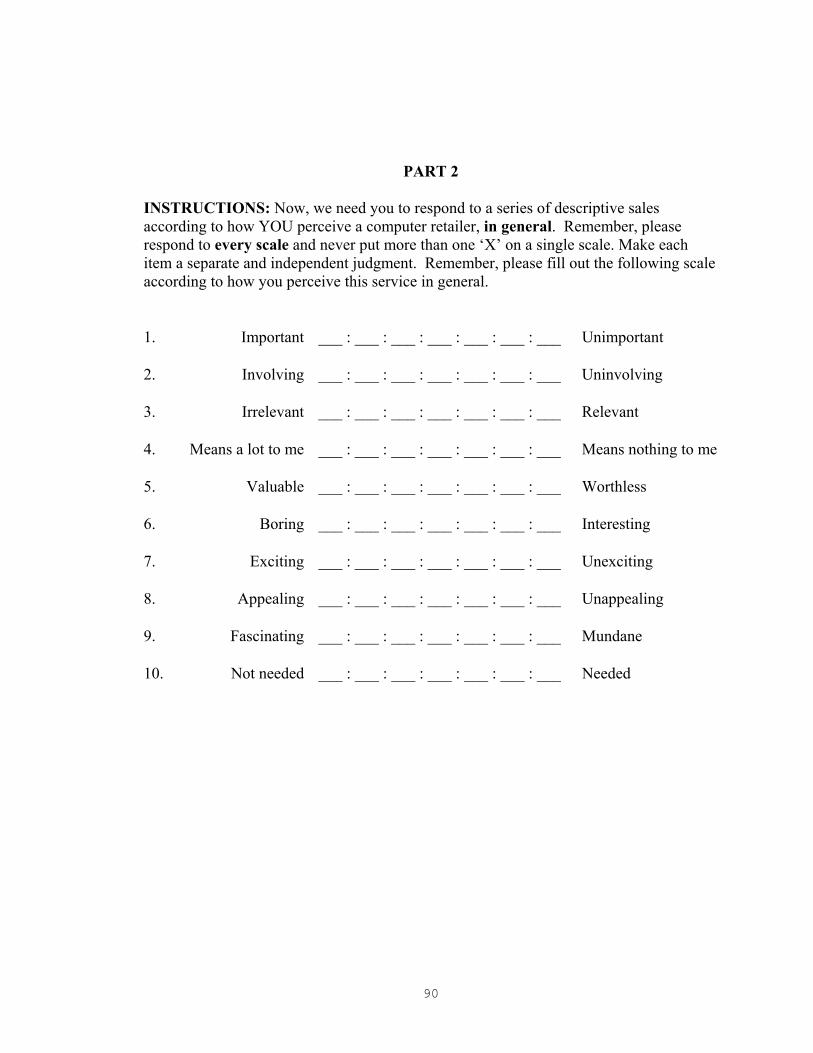
90
PART 2
INSTRUCTIONS: Now, we need you to respond to a series of descriptive sales according to how YOU perceive a computer retailer, in general. Remember, please respond to every scale and never put more than one ‘X’ on a single scale. Make each item a separate and independent judgment. Remember, please fill out the following scale according to how you perceive this service in general. 1. Important ___ : ___ : ___ : ___ : ___ : ___ : ___ Unimportant
2. Involving ___ : ___ : ___ : ___ : ___ : ___ : ___ Uninvolving
3. Irrelevant ___ : ___ : ___ : ___ : ___ : ___ : ___ Relevant
4. Means a lot to me ___ : ___ : ___ : ___ : ___ : ___ : ___ Means nothing to me
5. Valuable ___ : ___ : ___ : ___ : ___ : ___ : ___ Worthless
6. Boring ___ : ___ : ___ : ___ : ___ : ___ : ___ Interesting
7. Exciting ___ : ___ : ___ : ___ : ___ : ___ : ___ Unexciting
8. Appealing ___ : ___ : ___ : ___ : ___ : ___ : ___ Unappealing
9. Fascinating ___ : ___ : ___ : ___ : ___ : ___ : ___ Mundane
10. Not needed ___ : ___ : ___ : ___ : ___ : ___ : ___ Needed
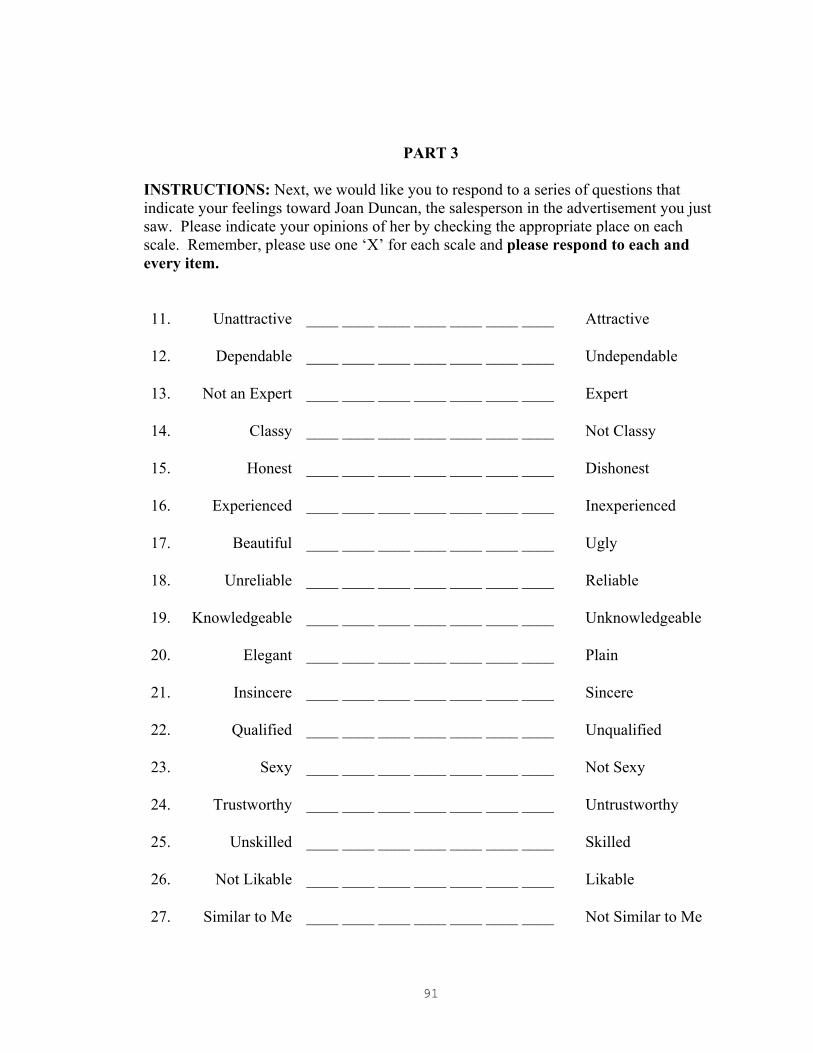
91
PART 3 INSTRUCTIONS: Next, we would like you to respond to a series of questions that indicate your feelings toward Joan Duncan, the salesperson in the advertisement you just saw. Please indicate your opinions of her by checking the appropriate place on each scale. Remember, please use one ‘X’ for each scale and please respond to each and every item. 11. Unattractive ____ ____ ____ ____ ____ ____ ____ Attractive
12. Dependable ____ ____ ____ ____ ____ ____ ____ Undependable
13. Not an Expert ____ ____ ____ ____ ____ ____ ____ Expert
14. Classy ____ ____ ____ ____ ____ ____ ____ Not Classy
15. Honest ____ ____ ____ ____ ____ ____ ____ Dishonest
16. Experienced ____ ____ ____ ____ ____ ____ ____ Inexperienced
17. Beautiful ____ ____ ____ ____ ____ ____ ____ Ugly
18. Unreliable ____ ____ ____ ____ ____ ____ ____ Reliable
19. Knowledgeable ____ ____ ____ ____ ____ ____ ____ Unknowledgeable
20. Elegant ____ ____ ____ ____ ____ ____ ____ Plain
21. Insincere ____ ____ ____ ____ ____ ____ ____ Sincere
22. Qualified ____ ____ ____ ____ ____ ____ ____ Unqualified
23. Sexy ____ ____ ____ ____ ____ ____ ____ Not Sexy
24. Trustworthy ____ ____ ____ ____ ____ ____ ____ Untrustworthy
25. Unskilled ____ ____ ____ ____ ____ ____ ____ Skilled
26. Not Likable ____ ____ ____ ____ ____ ____ ____ Likable
27. Similar to Me ____ ____ ____ ____ ____ ____ ____ Not Similar to Me
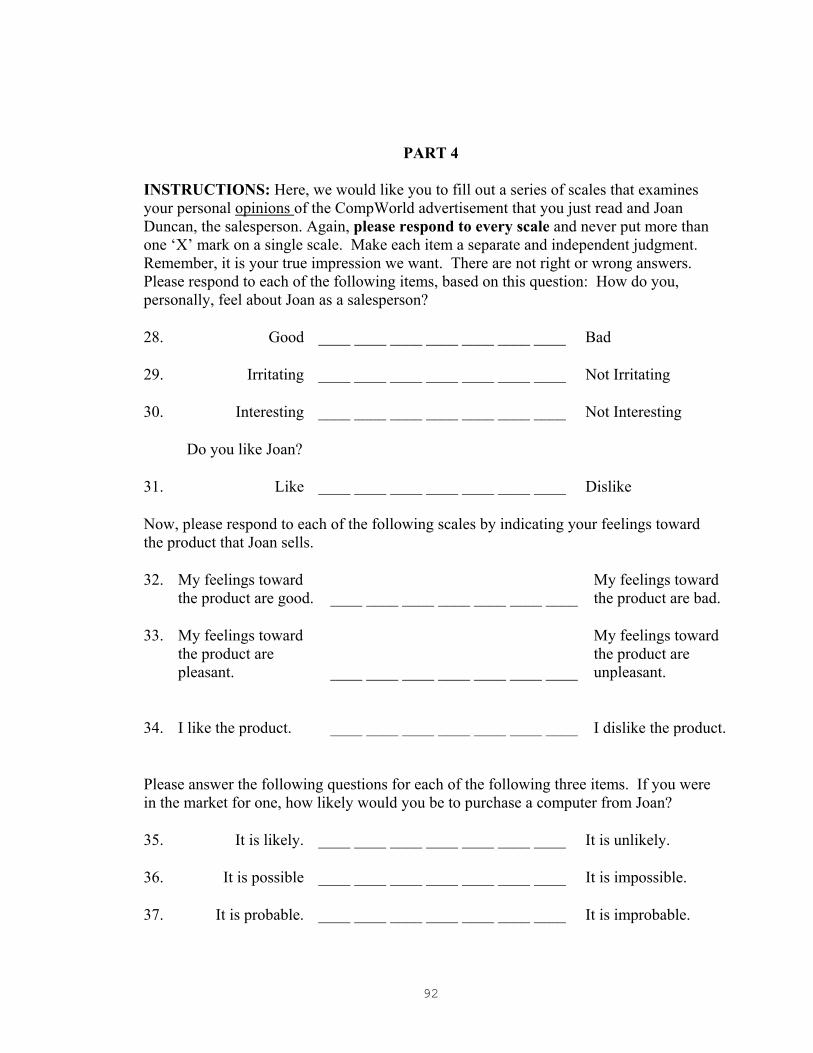
92
PART 4 INSTRUCTIONS: Here, we would like you to fill out a series of scales that examines your personal opinions of the CompWorld advertisement that you just read and Joan Duncan, the salesperson. Again, please respond to every scale and never put more than one ‘X’ mark on a single scale. Make each item a separate and independent judgment. Remember, it is your true impression we want. There are not right or wrong answers. Please respond to each of the following items, based on this question: How do you, personally, feel about Joan as a salesperson? 28. Good ____ ____ ____ ____ ____ ____ ____ Bad
29. Irritating ____ ____ ____ ____ ____ ____ ____ Not Irritating
30. Interesting ____ ____ ____ ____ ____ ____ ____ Not Interesting
Do you like Joan?
31. Like ____ ____ ____ ____ ____ ____ ____ Dislike
Now, please respond to each of the following scales by indicating your feelings toward the product that Joan sells. 32. My feelings toward
the product are good. ____ ____ ____ ____ ____ ____ ____
My feelings toward the product are bad.
33. My feelings toward the product are pleasant.
____ ____ ____ ____ ____ ____ ____
My feelings toward the product are unpleasant.
34.
I like the product.
____ ____ ____ ____ ____ ____ ____
I dislike the product.
Please answer the following questions for each of the following three items. If you were in the market for one, how likely would you be to purchase a computer from Joan? 35. It is likely. ____ ____ ____ ____ ____ ____ ____ It is unlikely.
36. It is possible ____ ____ ____ ____ ____ ____ ____ It is impossible.
37. It is probable. ____ ____ ____ ____ ____ ____ ____ It is improbable.
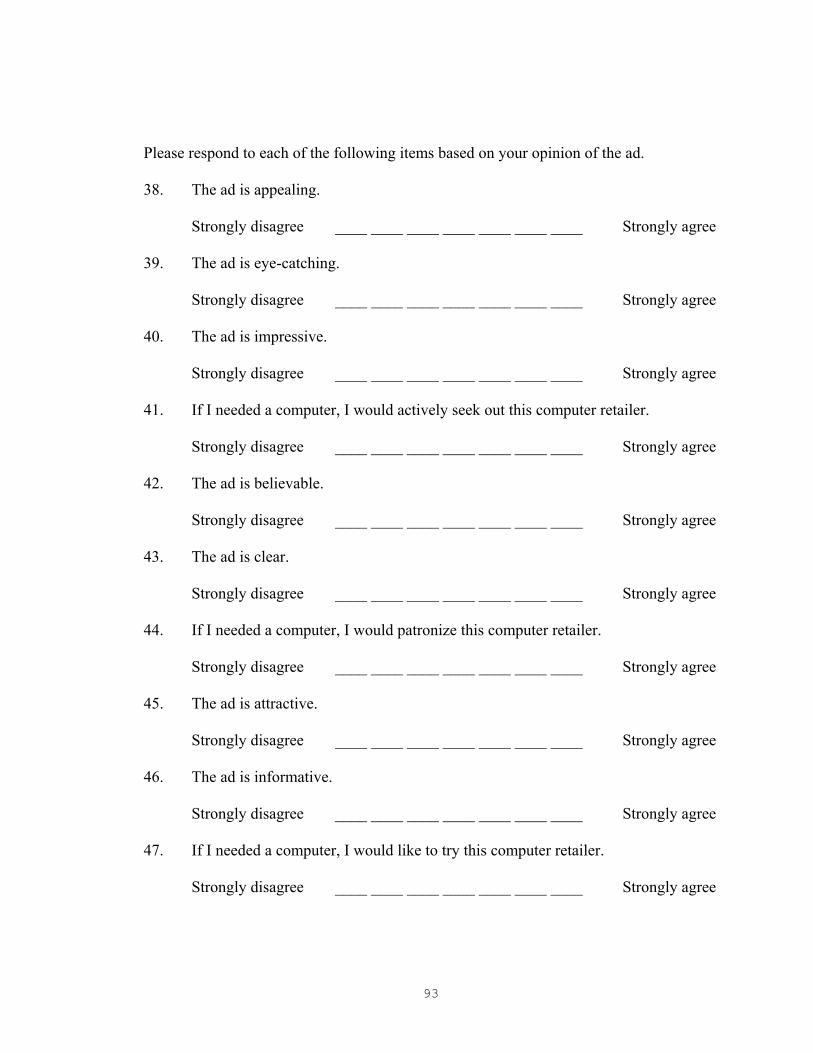
93
Please respond to each of the following items based on your opinion of the ad. 38. The ad is appealing.
Strongly disagree ____ ____ ____ ____ ____ ____ ____ Strongly agree
39. The ad is eye-catching.
Strongly disagree ____ ____ ____ ____ ____ ____ ____ Strongly agree
40. The ad is impressive.
Strongly disagree ____ ____ ____ ____ ____ ____ ____ Strongly agree
41. If I needed a computer, I would actively seek out this computer retailer.
Strongly disagree ____ ____ ____ ____ ____ ____ ____ Strongly agree
42. The ad is believable.
Strongly disagree ____ ____ ____ ____ ____ ____ ____ Strongly agree
43. The ad is clear.
Strongly disagree ____ ____ ____ ____ ____ ____ ____ Strongly agree
44. If I needed a computer, I would patronize this computer retailer.
Strongly disagree ____ ____ ____ ____ ____ ____ ____ Strongly agree
45. The ad is attractive.
Strongly disagree ____ ____ ____ ____ ____ ____ ____ Strongly agree
46. The ad is informative.
Strongly disagree ____ ____ ____ ____ ____ ____ ____ Strongly agree
47. If I needed a computer, I would like to try this computer retailer.
Strongly disagree ____ ____ ____ ____ ____ ____ ____ Strongly agree
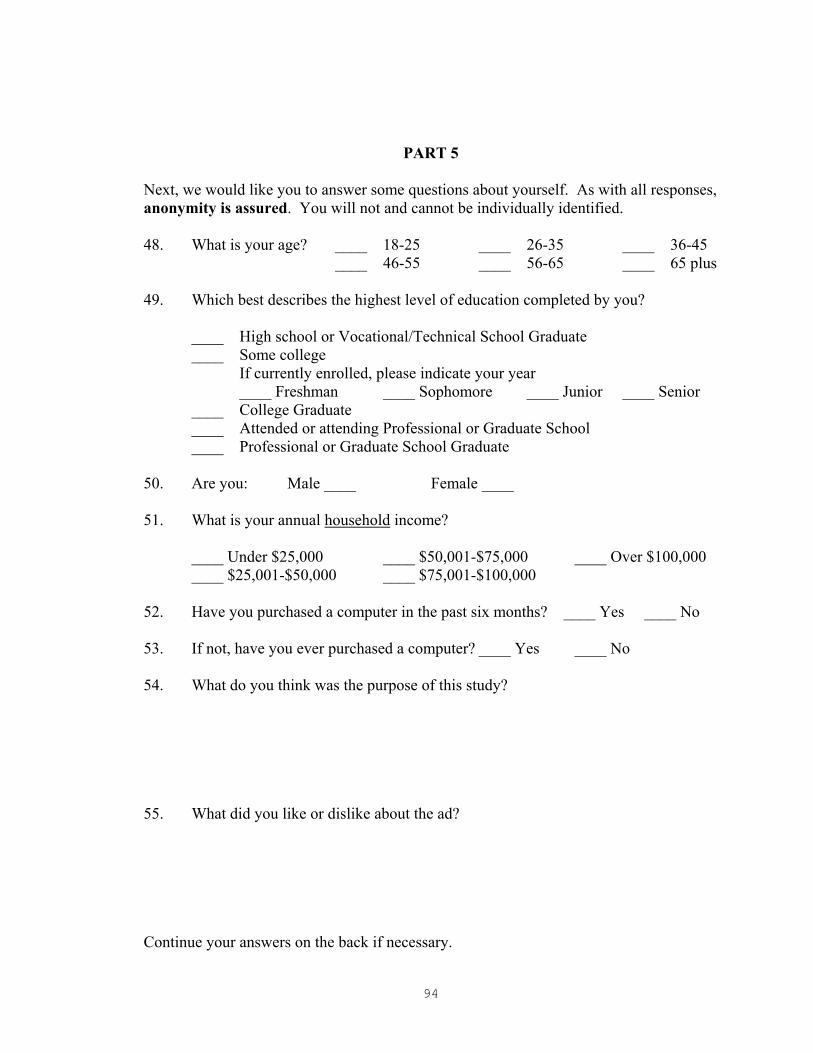
94
PART 5 Next, we would like you to answer some questions about yourself. As with all responses, anonymity is assured. You will not and cannot be individually identified. 48. What is your age? ____ 18-25 ____ 26-35 ____ 36-45 ____ 46-55 ____ 56-65 ____ 65 plus 49. Which best describes the highest level of education completed by you?
____ High school or Vocational/Technical School Graduate ____ Some college If currently enrolled, please indicate your year ____ Freshman ____ Sophomore ____ Junior ____ Senior ____ College Graduate ____ Attended or attending Professional or Graduate School ____ Professional or Graduate School Graduate
50. Are you: Male ____ Female ____ 51. What is your annual household income?
____ Under $25,000 ____ $50,001-$75,000 ____ Over $100,000 ____ $25,001-$50,000 ____ $75,001-$100,000
52. Have you purchased a computer in the past six months? ____ Yes ____ No 53. If not, have you ever purchased a computer? ____ Yes ____ No 54. What do you think was the purpose of this study? 55. What did you like or dislike about the ad? Continue your answers on the back if necessary.

95
INSTRUCTIONS
Please look at the following ad for a new business in town. Read the advertisement for as long as you like. After you are finished, turn the ad over and without looking back at the ad, please complete the attached questionnaire.
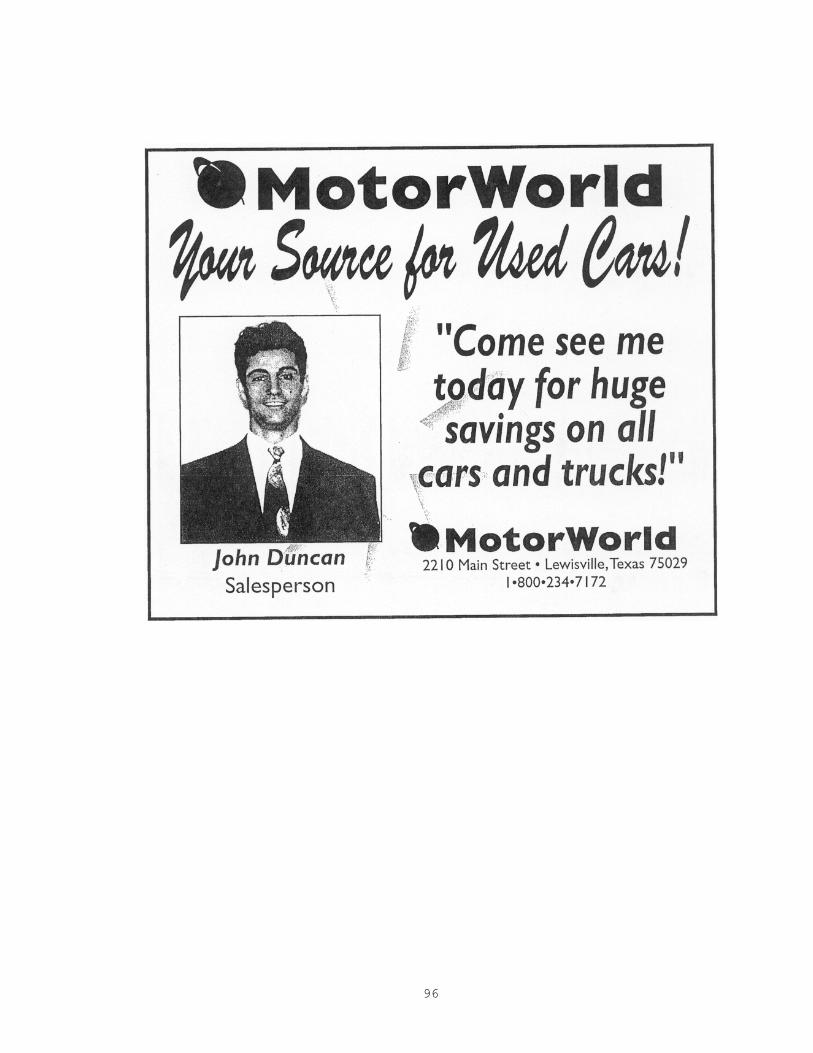
96
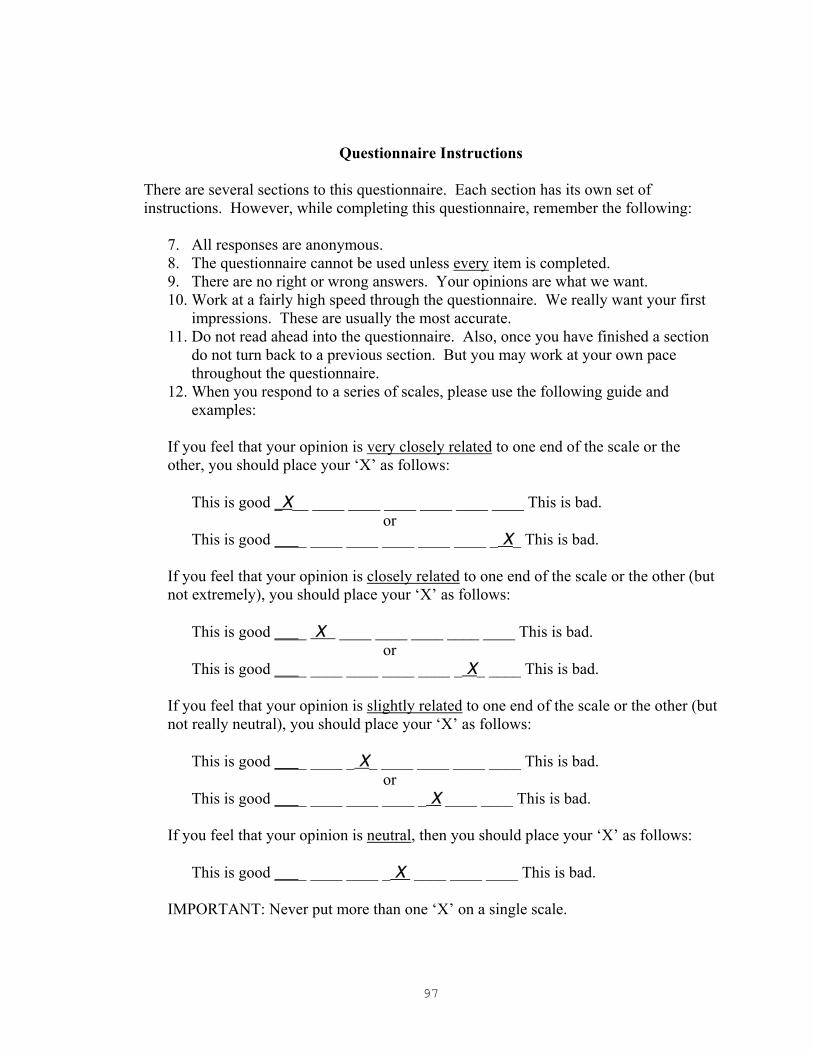
97
Questionnaire Instructions There are several sections to this questionnaire. Each section has its own set of instructions. However, while completing this questionnaire, remember the following:
7. All responses are anonymous. 8. The questionnaire cannot be used unless every item is completed. 9. There are no right or wrong answers. Your opinions are what we want. 10. Work at a fairly high speed through the questionnaire. We really want your first
impressions. These are usually the most accurate. 11. Do not read ahead into the questionnaire. Also, once you have finished a section
do not turn back to a previous section. But you may work at your own pace throughout the questionnaire.
12. When you respond to a series of scales, please use the following guide and examples:
If you feel that your opinion is very closely related to one end of the scale or the other, you should place your ‘X’ as follows: This is good _X__ ____ ____ ____ ____ ____ ____ This is bad. or This is good ____ ____ ____ ____ ____ ____ _ X_ This is bad. If you feel that your opinion is closely related to one end of the scale or the other (but not extremely), you should place your ‘X’ as follows:
This is good ____ X ____ ____ ____ ____ ____ This is bad. or
This is good ____ ____ ____ ____ ____ _ X_ ____ This is bad. If you feel that your opinion is slightly related to one end of the scale or the other (but not really neutral), you should place your ‘X’ as follows:
This is good ____ ____ _ X_ ____ ____ ____ ____ This is bad. or
This is good ____ ____ ____ ____ _ X ____ ____ This is bad.
If you feel that your opinion is neutral, then you should place your ‘X’ as follows:
This is good ____ ____ ____ _ X ____ ____ ____ This is bad.
IMPORTANT: Never put more than one ‘X’ on a single scale.
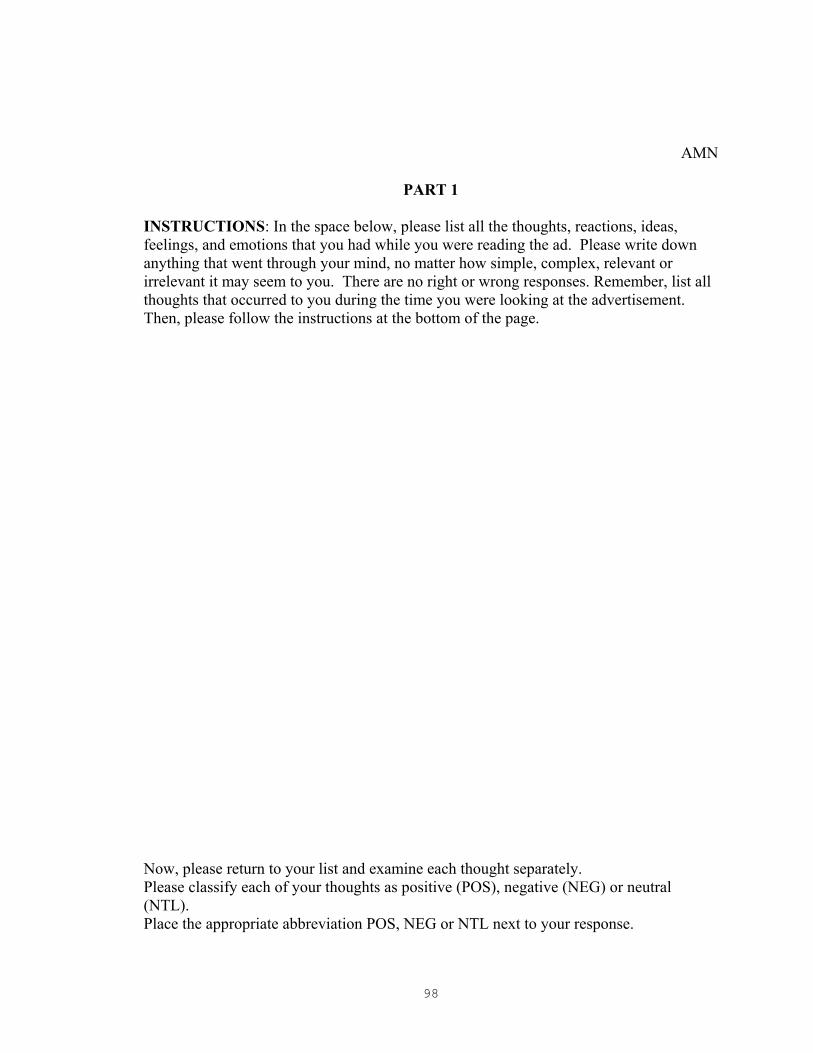
98
AMN
PART 1 INSTRUCTIONS: In the space below, please list all the thoughts, reactions, ideas, feelings, and emotions that you had while you were reading the ad. Please write down anything that went through your mind, no matter how simple, complex, relevant or irrelevant it may seem to you. There are no right or wrong responses. Remember, list all thoughts that occurred to you during the time you were looking at the advertisement. Then, please follow the instructions at the bottom of the page. Now, please return to your list and examine each thought separately. Please classify each of your thoughts as positive (POS), negative (NEG) or neutral (NTL). Place the appropriate abbreviation POS, NEG or NTL next to your response.
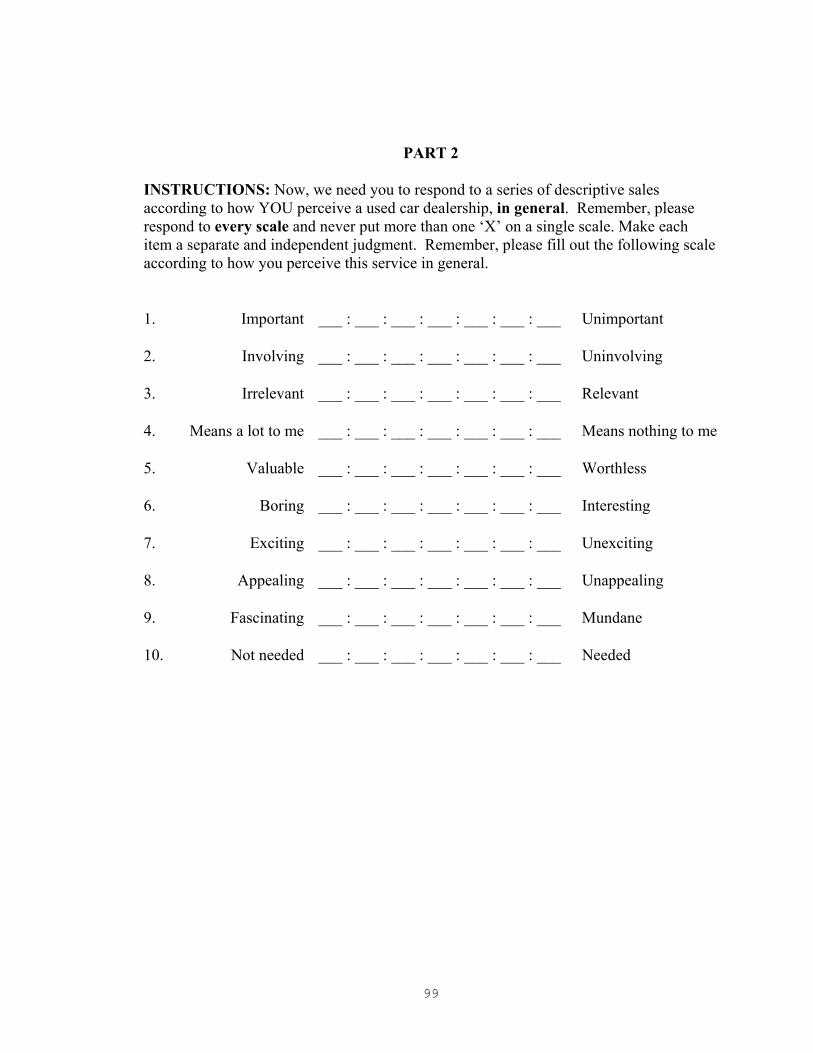
99
PART 2 INSTRUCTIONS: Now, we need you to respond to a series of descriptive sales according to how YOU perceive a used car dealership, in general. Remember, please respond to every scale and never put more than one ‘X’ on a single scale. Make each item a separate and independent judgment. Remember, please fill out the following scale according to how you perceive this service in general. 1. Important ___ : ___ : ___ : ___ : ___ : ___ : ___ Unimportant
2. Involving ___ : ___ : ___ : ___ : ___ : ___ : ___ Uninvolving
3. Irrelevant ___ : ___ : ___ : ___ : ___ : ___ : ___ Relevant
4. Means a lot to me ___ : ___ : ___ : ___ : ___ : ___ : ___ Means nothing to me
5. Valuable ___ : ___ : ___ : ___ : ___ : ___ : ___ Worthless
6. Boring ___ : ___ : ___ : ___ : ___ : ___ : ___ Interesting
7. Exciting ___ : ___ : ___ : ___ : ___ : ___ : ___ Unexciting
8. Appealing ___ : ___ : ___ : ___ : ___ : ___ : ___ Unappealing
9. Fascinating ___ : ___ : ___ : ___ : ___ : ___ : ___ Mundane
10. Not needed ___ : ___ : ___ : ___ : ___ : ___ : ___ Needed

100
PART 3 INSTRUCTIONS: Next, we would like you to respond to a series of questions that indicate your feelings toward John Duncan, the salesperson in the advertisement you just saw. Please indicate your opinions of her by checking the appropriate place on each scale. Remember, please use one ‘X’ for each scale and please respond to each and every item. 11. Unattractive ____ ____ ____ ____ ____ ____ ____ Attractive
12. Dependable ____ ____ ____ ____ ____ ____ ____ Undependable
13. Not an Expert ____ ____ ____ ____ ____ ____ ____ Expert
14. Classy ____ ____ ____ ____ ____ ____ ____ Not Classy
15. Honest ____ ____ ____ ____ ____ ____ ____ Dishonest
16. Experienced ____ ____ ____ ____ ____ ____ ____ Inexperienced
17. Beautiful ____ ____ ____ ____ ____ ____ ____ Ugly
18. Unreliable ____ ____ ____ ____ ____ ____ ____ Reliable
19. Knowledgeable ____ ____ ____ ____ ____ ____ ____ Unknowledgeable
20. Elegant ____ ____ ____ ____ ____ ____ ____ Plain
21. Insincere ____ ____ ____ ____ ____ ____ ____ Sincere
22. Qualified ____ ____ ____ ____ ____ ____ ____ Unqualified
23. Sexy ____ ____ ____ ____ ____ ____ ____ Not Sexy
24. Trustworthy ____ ____ ____ ____ ____ ____ ____ Untrustworthy
25. Unskilled ____ ____ ____ ____ ____ ____ ____ Skilled
26. Not Likable ____ ____ ____ ____ ____ ____ ____ Likable
27. Similar to Me ____ ____ ____ ____ ____ ____ ____ Not Similar to Me

101
PART 4 INSTRUCTIONS: Here, we would like you to fill out a series of scales that examines your personal opinions of the MotorWorld advertisement that you just read and John Duncan, the salesperson. Again, please respond to every scale and never put more than one ‘X’ mark on a single scale. Make each item a separate and independent judgment. Remember, it is your true impression we want. There are not right or wrong answers. Please respond to each of the following items, based on this question: How do you, personally, feel about Joan as a salesperson? 28. Good ____ ____ ____ ____ ____ ____ ____ Bad
29. Irritating ____ ____ ____ ____ ____ ____ ____ Not Irritating
30. Interesting ____ ____ ____ ____ ____ ____ ____ Not Interesting
Do you like John?
31. Like ____ ____ ____ ____ ____ ____ ____ Dislike
Now, please respond to each of the following scales by indicating your feelings toward the product that John sells. 32. My feelings toward
the product are good. ____ ____ ____ ____ ____ ____ ____
My feelings toward the product are bad.
33. My feelings toward the product are pleasant.
____ ____ ____ ____ ____ ____ ____
My feelings toward the product are unpleasant.
34.
I like the product.
____ ____ ____ ____ ____ ____ ____
I dislike the product.
Please answer the following questions for each of the following three items. If you were in the market for one, how likely would you be to purchase a car from John? 35. It is likely. ____ ____ ____ ____ ____ ____ ____ It is unlikely.
36. It is possible ____ ____ ____ ____ ____ ____ ____ It is impossible.
37. It is probable. ____ ____ ____ ____ ____ ____ ____ It is improbable.
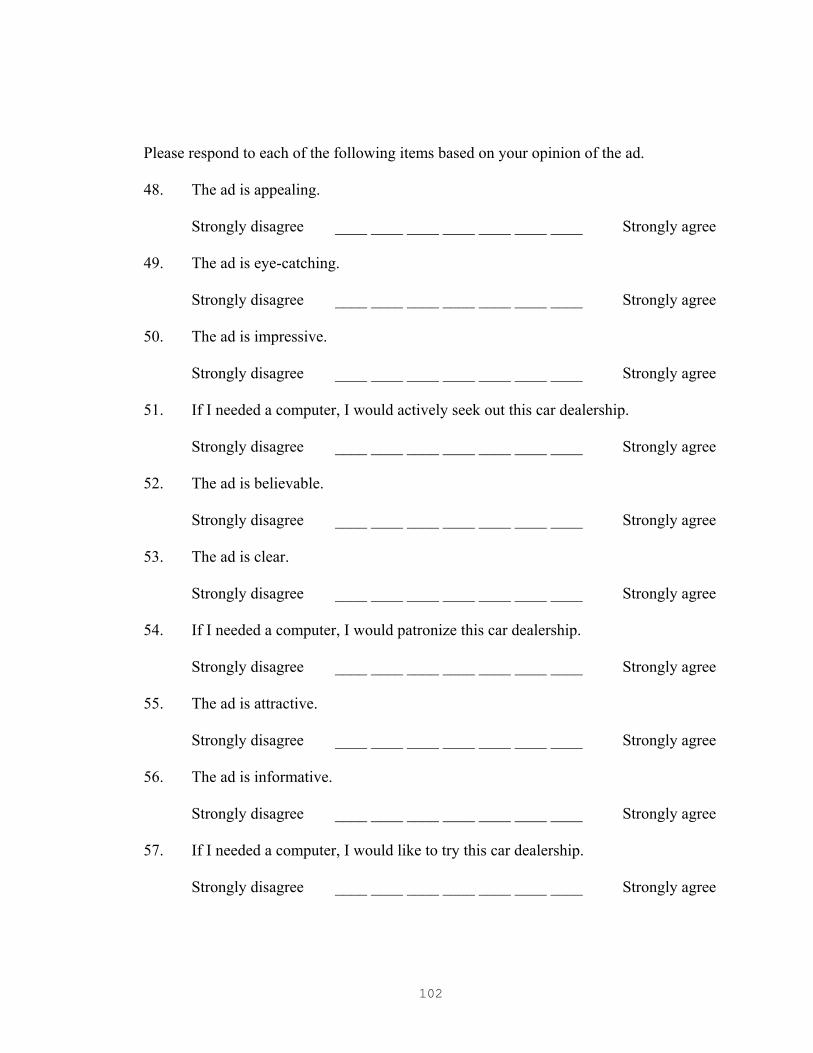
102
Please respond to each of the following items based on your opinion of the ad. 48. The ad is appealing.
Strongly disagree ____ ____ ____ ____ ____ ____ ____ Strongly agree
49. The ad is eye-catching.
Strongly disagree ____ ____ ____ ____ ____ ____ ____ Strongly agree
50. The ad is impressive.
Strongly disagree ____ ____ ____ ____ ____ ____ ____ Strongly agree
51. If I needed a computer, I would actively seek out this car dealership.
Strongly disagree ____ ____ ____ ____ ____ ____ ____ Strongly agree
52. The ad is believable.
Strongly disagree ____ ____ ____ ____ ____ ____ ____ Strongly agree
53. The ad is clear.
Strongly disagree ____ ____ ____ ____ ____ ____ ____ Strongly agree
54. If I needed a computer, I would patronize this car dealership.
Strongly disagree ____ ____ ____ ____ ____ ____ ____ Strongly agree
55. The ad is attractive.
Strongly disagree ____ ____ ____ ____ ____ ____ ____ Strongly agree
56. The ad is informative.
Strongly disagree ____ ____ ____ ____ ____ ____ ____ Strongly agree
57. If I needed a computer, I would like to try this car dealership.
Strongly disagree ____ ____ ____ ____ ____ ____ ____ Strongly agree
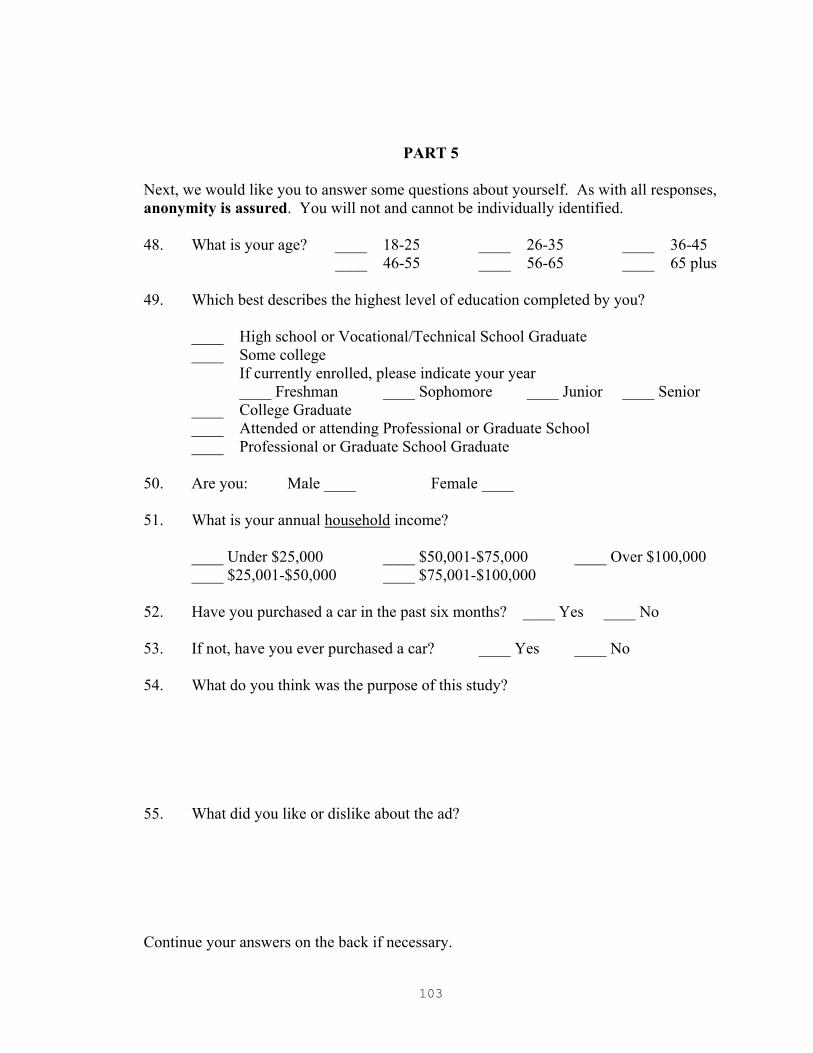
103
PART 5 Next, we would like you to answer some questions about yourself. As with all responses, anonymity is assured. You will not and cannot be individually identified. 48. What is your age? ____ 18-25 ____ 26-35 ____ 36-45 ____ 46-55 ____ 56-65 ____ 65 plus 49. Which best describes the highest level of education completed by you?
____ High school or Vocational/Technical School Graduate ____ Some college If currently enrolled, please indicate your year ____ Freshman ____ Sophomore ____ Junior ____ Senior ____ College Graduate ____ Attended or attending Professional or Graduate School ____ Professional or Graduate School Graduate
50. Are you: Male ____ Female ____ 51. What is your annual household income?
____ Under $25,000 ____ $50,001-$75,000 ____ Over $100,000 ____ $25,001-$50,000 ____ $75,001-$100,000
52. Have you purchased a car in the past six months? ____ Yes ____ No 53. If not, have you ever purchased a car? ____ Yes ____ No 54. What do you think was the purpose of this study? 55. What did you like or dislike about the ad? Continue your answers on the back if necessary.
104
REFERENCES "Ad Age Dataplace," (http:://www.adage.dataplace.com), 9/18/2000. Adkins, Robert and John Swan (1981), "Improving the Public Acceptance of Sales People Through Professionalization," Journal of Personal Selling & Sales Management, 2 (1), 32-51. Anderson, Susan, Klatsky, Roberta, and John Murray (1990), "Traits and Social Stereotypes: Efficiency Differences in Social Information Processing," Journal of Social Personality and Social Psychology, 59 (2), 192-201. Argyle, Michael and Robert McHenry (1971), "Do Spectacles Really Affect Judgements of Intelligence?," British Journal of Social Clinical Psychology, 10, 27-29. Babin, Barry, Boles, James and William Darden (1995), "Salesperson Stereotypes, Consumer Emotions, and Their Impact on Information Processing," Journal of the Academy of Marketing Science, 23 (2), 94-105. Baker, Michael J. and Gilbert A. Churchill, Jr. (1977), "The Impact of Physically Attractive Models on Advertising Evaluations," Journal of Marketing Research, 14 (November), 538-55. Berk, R. L. (1963), "The Psychological Impact of Contact Lenses on Children and Youth," Journal of the American Optometric Association, 34, 1217-22. Berlo, David K. (1960), The Process of Communciation. New York: Holt, Rinehart, and Winston. Berscheid, Ellen (1966), "Opinion Change and Communicator-Communicatee Similarity and Dissimilarity," Journal of Personality and Social Psychology, 4 (6), 670-80.
105
Blass, T., Alpenstein, L., and S.H. Block (1974), "Effects of Communicator's Race and Beauty and of Receiver's Objectivity-Subjectivity on Attitude Change," in American Psychological Association, C. Ward (Ed.). New Orleans. Bodenhausen, Galen (1990), "Stereotypes as Judgmental Heuristics: Evidence of Circadian Variations in Discrimination," Psychological Science, 1 (5), 319-22. Boshier, Roger (1975), "A Videotape Study on the Relationship Between Wearing Spectacles and Judgments of Intelligence," Perceptual and Motor Skills, 40 (Feb/June), 69-70. Braunsberger, Karin and James Munch (1998), "Source Expertise versus Experience Effects in Hospital Advertising," Journal of Services Marketing, 12 (1), 23-38. Brock, Timothy (1965), "Communicator-Recipient Similarity and Decision Change," Journal of Personality and Social Psychology, 1 (6), 650-54. Broverman, I. K., Vogel, S. R., Broverman, D. M., Clarkson, F. E. and P. S. Rosenkrantz (1972), "Sex-role Stereotypes," Journal of Social Issues, 28 (2), 59-78. Bruner, Jerome S., Goodnow, Jacqueline, and George S. Austin (1956), A Study of Thinking, New York: Wiley. Busch, Paul and David T. Wilson (1976), "An Experimental Analysis of a Salesman's Expert and Referent Bases of Power in the Buyer-Seller Dyad," Journal of Marketing Research, 13 (February), 3-11. Byrne, D. (1961), "Interpersonal Attraction and Attitude Similarity," Journal of Abnormal and Social Psychology, 62, 713-15. Byrne, D., London, O., and K. Reeves (1968), "The Effects of Physical Attractiveness, Sex, and Attitude Similarity on Interpersonal Attraction," Journal of Personality, 36 (June), 259-71.
106
Byrne D., and T. J. Wong (1962), "Racial Prejudice, Interpersonal Attraction, and Assumed Dissimilarity of Attitudes," Journal of Abnormal and Social Psychology, 65, 246-53. Caballero, Marjorie, Lumpkin, James and Charles Madden (1989), "Using Physical Attractiveness as an Advertising Tool: An Empirical Test of the Attraction Phenomenon," Journal of Advertising Research, 29 (4), 16-21. Chaiken, Shelly (1979), "Communicator Physical Attractiveness and Persuasion," Journal of Personality and Social Psychology, 37 (8), 1387-97. ---- (1980), "Heuristic Versus Systematic Information Processing and the Use of Source Versus Message Cues in Persuasion," Journal of Personality and Social Psychology, 39 (November), 752-66. Chawla, Sudhir, Dave, Dinesh and Peter Barr (1994), "Role of Physical Attractiveness in Endorsement: An Empirical Study," Journal of Professional Services Marketing, 10 (2), 203-15. Chawla, Sudkir K. and Rajan Nataraajan (1995), "Endorsing an Ethnic Food Product: The Roles of Race and Gender," Journal of Food Products Marketing, 2 (3), 3-16. Choo, Tong-He (1964), "Communicator Credibility and Communication Discrepancy as Determinants of Opinion Change," The Journal of Social Psychology, 64, 65-76. Crispell, Diane (1995), "Contact Lenses or Glasses?," American Demographics, 17 (6), 38-39. Darden, William and Warren French (1971), "Dimensions of Salesman Stereotypes and Their Relation to Executive Characteristics," Social Science Quarterly (March), 959-67. Deaux, Kay and Laurie L. Lewis (1984), "Structure of Gender Stereotypes: Interrelationships Among Components and Gender Label," Journal of Personality and Social Psychology, 46 (5), 991-1004.
107
Debevec, Kathleen and Easwar Iyer (1985), “The Influence of Spokespersons in Altering a Product’s Gender Image,” Journal of Advertising, 15 (4), 12-20. DeBono, Kenneth and Richard Harnish (1988), "Source Expertise, Source Attractiveness, and the Processing of Persuasive Information: A Functional Approach," Journal of Personality and Social Psychology, 55 (4), 541-46. DeShields, Oscar W., Jr., Kara, Ali and Erdener Kaynak (1996), "Source Effects in Purchase Decisions: The Impact of Physical Attractiveness and Accent of Salesperson," International Journal of Research in Marketing, 13 (1), 89-101. Doney, Patricia M. and Joseph P. Cannon (1997), "An Examination of the Nature of Trust in Buyer-Seller Relationships," Journal of Marketing, 61 (April), 35-51. Eisenberg, Anne (2001), “Sounding Off: Talking computers will imitate male and female stereotypes with real and synthesized voices,” (http://www.chron.com/cs/CDA/ printstory.htm), 6/21/2001. Elman, Donald (1977), "Physical Characteristics and the Perception of Masculine Traits," The Journal of Social Psychology, 103 (1), 157-58. Fiske, Susan (1982), "Schema Triggered Affect: Applications to Social Perceptions," in Affect and Cognition, M. Clark and S. Fiske, Ed. Hillsdale, NJ: Erlbaum. Fiske, Susan T. and Mark A. Pavelchak (1986), "Chapter 7: Category-Based versus Piecemeal-Based Affective Responses," in Handbook of Motivation and Cognition: Foundations of Social Behavior, Richard M. and E. Tory Higgins Sorrentino, Ed. New York: Guilford Press. Fiske, Susan T., Neuberg, Steven L, Beattie, Ann E., and Sandra J. Milberg (1987), "Category-Based and Attribute-Based Reactions to Others: Some Informational Conditions of Stereotyping and Individual Processes," Journal of Experimental Social Psychology, 23 (September), 399-427.
108
Friedman, Hershey and Linda Friedman (1979), "Endorser Effectiveness by Product Type," Journal of Advertising Research, 19 (5), 63-71. Ganesan, Shankar (1994), "Determinants of Long-Term Orientation in Buyer-Seller Relationships," Journal of Marketing, 58 (April), 1-19. Giffin, Kim (1967), "The Contribution of Studies of Source Credibility to a Theory of Interpersonal Trust in the Communication Process," Psychological Bulletin, 68 (2), 104-20. Gilbert, Daniel and J. Gregory Hixon (1991), "The Trouble of Thinking: Activation and Application of Stereotypical Beliefs," Journal of Personality and Social Psychology, 60 (May), 509-17. Gillen, B. (1981), "Physical Attractiveness: A Determinant of Two Types of Goodness," Personality and Social Psychology Bulletin, 7, 277-81. Gotlieb, Jerry B., Gwinner, Robert F., Schlacter, John L. and Robert D. St. Louis (1987), "Explaining Consumers' Reactions to Price Changes in Service Industries: The Effects of Location of the Service Provider, the Credibility of the Information Source and the Importance of the Service to the Consumer," Journal of Professional Services Marketing, 3 (1), 19-33. Greenwald, Anthony A. and Clark Leavitt (1984), "Audience Involvement in Advertising: Four Levels," Journal of Consumer Research, 11 (June), 581-92. Grewal, Dhruv, Gotlieb, Jerry and Howard Marmorstein (1994), "The Moderating Effects of Message Framing and Source Credibility on the Price-Perceived Risk Relationship," Journal of Consumer Research, 21 (June), 145-53. Harris, Mary B. (1991), "Sex Differences in Stereotypes of Spectacles," Journal of Applied Social Psychology, 21 (20), 1659-80.
109
Hoffman, Curt and Nancy Hurst (1990), "Gender Stereotypes: Perception or Rationalization," Journal of Personality and Social Psychology, 58 (February), 197-208. Homer, Pamela M. and Lynn R. Kahle (1990), "Source Expertise, Time of Source Identification, and Involvement in Persuasion: An Elaborate Processing Perspective," Journal of Advertising, 19 (1), 30-39. Horai, J., Naccari, N., and E. Fatoullah (1974), "The Effects of Expertise and Physical Attractiveness Upon Opinion Agreement and Liking," Sociometry, 37, 601-06. Hovland, Carl L. and Walter Weiss (1951-1952), "The Influence of Source Credibility on Communication Effectiveness," Public Opinion Quarterly, 15 (Winter), 635-50. Hovland, C. I., Janis, I. L., and H. H. Kelley (1953), Communication and Persuasion. New Haven: Yale Press. Jackson, L. A. (1983), "The Influence of Sex, Physical Attractiveness, Sex Role, and Occupational Sex-Linkage on Perception of Occupational Suitability," Journal of Applied Social Psychology, 13, 31-44. Joseph, W. Benoy (1977),"Effect of Communicator Physical Attractiveness and Expertness on Opinion Change and Information Processing," Doctoral Dissertation, Ohio State University, Columbus, OH. ---- (1982), "The Credibility of Physically Attractive Communicators: A Review," Journal of Advertising, 11 (3), 15-24. Kahle, Lynn and Pamela Homer (1975), "Physical Attractiveness of the Celebrity Endorser: A Social Adoption Perspective," Journal of Consumer Research, 11 (4), 954-61. Kelman, H.C. (1961), "Processes of Opinion Change," Public Opinion Quarterly, 25, 57-78.
110
Knoll, Henry (1978), "Eyeglasses and Contact Lenses," Journal of the American Optometric Association, 49 (8), 861-66. Macrae, C. Neil, Milne, Alan B., and Galen V. Bodenhausen (1994), "Stereotypes as Energy-Saving Devices: A Peek Inside the Cognitive Toolbox," Journal of Personality and Social Psychology, 66 (January), 37-47. Maddux, James E. and Ronald W. Rogers (1980), "Effects of Source Expertness, Physical Attractiveness, and Supporting Arguments on Persuasion: A Case of Brains Over Beauty," Journal of Personality and Social Psychology, 39 (2), 235-44. Maheswaran, Durairaj and Brian Sternhall (1990), "The Effects of Knowledge, Motivation, and Type of Message on Ad Processing and Product Judgments," Journal of Consumer Research, 17 (June), 66-73. Manz, Wolfgang and Helmut E. Lueck (1968), "Influence of Wearing Glasses on Personality Ratings: Crosscultural Validation of an Old Experiment," Perceptual and Motor Skills, 27, 704. Marsh, P. O. (1967), Persuasive Speaking. New York: Harper & Row. Mazursky, David and Yaacov Schul (1992), "Learning from the Ad or Relying on Related Attitudes: The Moderating Role of Involvement," Journal of Business Research, 25 (1), 81-93. McCrosky, J. C. (1966), "Scales for the Measurement of Ethos," Speech Monographs, 33, 65-72. McGinnies, Elliott and Charles Ward (1980), "Better Liked Than Right: Trustworthiness and Expertise as Factors in Credibility," Personality and Social Psychology Bulletin, 6 (3), 467-72. McGraw, Kenneth O., Durm, Mark W., and Jana N. Patterson (1983), "Concept Discrimination Learning by Preschool Children Using Facial Stimuli Differing in Age, Sex, Race, and Eyeglasses," The Journal of General Psychology, 108 (April), 193-202.
111
McKelvie, Stuart (1988), "The Role of Spectacles in Facial Memory: A Replicaton and Extension," Perceptual and Motor Skills, 66 (2), 651-58. Mervis, Carolyn B. and Eleanor Rosch (1981), "Categorization of Natural Objects," Annual Review of Psychology, 32, 89-115. Millman, Ronald E. and Douglas L. Fugate (1988), "Using Trust-Transference as a Persuasion Technique: An Empirical Field Investigation," Journal of Personal Selling and Sales Management, 7, 1-7. Mills, J. and E. Aronson (1965), "Opinion Change as a Function of the Communicator's Attractiveness and Desire to Influence," Journal of Personality and Social Psychology, 1, 173-77. Morrow, Paula C., McElroy, James C., Stampter, Bernard G. and Mark A. Wilson (1990), "The Effects of Physical Attractiveness and Other Demographic Characteristics on Promotion Decisions," Journal of Management, 16 (4), 723-36. Morrow, Paula (1990), "Physical Attractiveness and Selection Decision Making," Journal of Management, 16 (1), 45-60. Muehling, Darrel D., Laczniak, Russell N. and Jeffrey Stoltman (1991), "The Moderating Effects of Ad Message Involvement: A Reassessment," Journal of Advertising, 20 (June), 29-38. Muehling, Darrel D., Laczniak, Russell N., and J. Craig Andrews (1993), "Defining, Operationalizing, and Using Involvement in Advertising Research: A Review," Journal of Current Issues and Research in Advertising, 15 (1), 21-57. Mussweiler, Thomas and Fritz Stack (2000), "The Use of Category and Exemplar Knowledge in the Solution of Anchoring Tasks," Journal of Personality and Social Psychology, 78 (6), 1038-52.
112
Nataraajan, Rajan and Sudhir K. Chawla (1997), ""Fitness" Marketing: Celebrity or Non-Celebrity Endorser," Journal of Professional Services Marketing, 15 (2), 119-29. Nicholson, Carolyn Y., Compeau, Larry D., and Rajesh Sethi (2001), "The Role of Interpersonal Liking in Building Trust in Long-Term Channel Relationships," Journal of the Academy of Marketing Science, 29 (1), 3-15. Norris, Clarie E. and Andrew M. Colman (1992), "Context Effects on Recall and Recognition of Magazine Advertisements," Journal of Advertising, 21 (September), 37-46. "Ocular Sciences." (http://www.ocularsciences.com), 10/25/2000. O'Hara, Bradley S., Netemeyer, Richard G. and Scot Burton (1991), "An Examination of the Relative Effects of Source Expertise, Trustworthiness, and Likability," Social Behavior and Personality, 19 (4), 305-14. O'Mahony, Sheila and Tony Meenaghan (1997/1998), "The Impact of Celebrity Endorsments on Consumers," Irish Marketing Review-Dublin, 10 (2), 15-24. Ohanian, Roobina (1990), "Communication and Validation of a Scale to Measure Celebrity Endorser's Perceived Attractiveness and Design to Influence," Journal of Advertising, 19 (3), 39-52. Page, Thomas J., Thorson, Esther and Maria Pappas Heide (1990), "The Memory Impact of Commercials Varying in Emotional Appeal and Product Involvement," in Emotion in Advertising, Stuart J. Agres, Edell, Julie A., and Tony M. Dubitsky, Ed. New York: Quorum Books. Pallack, S.R. (1983), "Salience of a Communicator's Physical Attractiveness and Persuasion: A Heuristic Versus Systematic Processing Interpretation," Journal of Social Cognition, 2, 156-68.
113
Palmer, A. and D. Bejou (1995), "The Effects of Gender on the Development of Relationships Between Clients and Financial Advisors," International Journal of Bank Marketing, 13 (3), 18-27. Patzer, Gordon L. (1983), "Source Credibility as a Function of Communicator Physical Attractiveness," Journal of Business Research, 11, 229-41. Pavelchak, Mark A. (1989), "Piecemeal and Category-Based Evaluation: An Idiographic Analysis," Journal of Personality and Social Psychology, 56 (3), 354-63. ---- (1991), "When Salespersons Are Typical: Does Stereotype Consistency Increase or Decrease Customers' Attention to Sales Presentations?," in American Marketing Association, Mary C. Gilly (Ed.) Vol. 2: American Marketing Association. Petty, Richard E. and John Cacioppo (1981), "Issue Involvement as Moderator of the Effects on Attitude of Advertising Content and Context," in Advances in Consumer Research, Kent B. Monroe (Ed.) Vol. 8: Association for Consumer Research. Petty, Richard E., Cacioppo, John T., and David Schumann (1983), "Central and Peripheral Routes to Advertising Effectiveness: The Moderating Role of Involvement," Journal of Consumer Research, 10 (September), 135-44. Petty, Richard and John Cacioppo (1986), "The Elaboration Likelihood Model of Persuasion," in Advances in Experimental Social Psychology, L. Berkowitz, Ed. New York: Academic Press. Pratto, Felecia and John Bargh (1991), "Stereotyping Based on Apparently Individualizing Information: Trait and Global Components of Sex Stereotypes under Attention Overload," Journal of Experimental Social Psychology, 27 (1), 26-47. Reingen, P.H. and J.B. Kernan (1994), "Social Perception and Interpersonal Influence: Some Consequences of the Physical Attractiveness Stereotype in a Personal Selling Situation," Journal of Consumer Psychology, 2 (1), 25-38.
114
Richins, Marsha L. and Peter H. Bloch (1986), "After The New Wears Off: The Temporal Context of Product Involvement," Journal of Consumer Research, 13 (September), 280-85. Rogers, Everett M. with F. Floyd Shoemaker (1971), "The Change Agent," in Communication of Innovations: A Cross Cultural Approach. New York City, NY: The Free Press. Rosch, Eleanor and Carolyn B. Mervis (1975), "Family Resemblances: Studies in Internal Structure of Categories," Cognitive Psychology, 7, 573-605. Sharma, Arun (1990), "The Persuasive Effect of Salesperson Credibility: Conceptual and Empirical Examination," Journal of Personal Selling and Sales Management, 10 (Fall), 71-80. Smith, Edward and Douglas Medin Ed. (1981), Categories and Concepts. Cambridge, MA: Harvard University Press. Smith, J. Brock (1998), "Buyer-Seller Relationships: Similarity, Relationship Management, and Quality," Psychology & Marketing, 15 (1), 3-21. Snyder, M. and M. Rothbart (1971), "Communicator Attractiveness and Opinion Change," Canadian Journal of Behavioral Science, 3, 377-87. Stafford, Marla Royne and Ellen Day (1994), "The Value of Cognitive Response Data: An Illustration in Services Advertising Research," in Conference of the American Academy of Advertising, Karen Whitehall King (Ed.): American Academy of Advertising. Stafford, Marla Royne (1998), “Advertising Sex-Typed Services: The Effects of Sex, Service Type, and Employee Type on Consumer Attitudes,” Journal of Advertising, 27 (2), 65-81). Stafford, Thomas F., Leigh, Thomas W., and Leonard L. Martin (1995), "Assimilation and Contrast Priming Effects in the Initial Consumer Sales Call," Psychology & Marketing, 12 (4), 321-28.
115
Sternthal, Brian, Dholakia, Ruby, and Clark Leavitt (1978), "The Persuasive Effect of Source Credibility: Tests of Cognitive Response," Journal of Consumer Research, 4 (March), 252-60. Strober, Myra H. and Carolyn Arnold (1987), “Computer Chips and Paper Clips: Technology and Women’s Employment, (http://www.amherst.edu/~erreich.html), 6/21/2001. Sujan, Mita, Bettman, James R., and Harish Sujan (1986), "Effects of Consumer Expectations on Information Processing in Selling Encounters," Journal of Marketing Research, 23 (November), 346-53. Sunny, Hansen L. (2000), “Changing Paradigms in Career Development: Finding Work to Do in the 21st Century,” (http://www.icdl.uncg.edu/ft/080800-01.html), 6/21/2001. Swan, John E., Trawick, I. Fred, Jr., Rink, David R., and Jenny J. Roberts (1988), "Measuring Dimensions of Purchaser Trust of Industrial Salespeople," Journal of Personal Selling and Sales Management, 8 (1), 1-9. Swann, John E., Trawick, I. Frederick, Jr., Rink, David R., and Jenny Roberts (1988), "Measuring Dimensions of Purchaser Trust of Industrial Salespeople," Journal of Personal Selling and Sales Management, 8, 1-9. Swartz, Teresa (1984), "Relationship between Source Expertise and Source Similarity in an Advertising Context," Journal of Advertising, 13 (2), 49-55. Tedeschi, J.T., Schlenker, B., and T. Bonoma (1973), Conflict, Power and Games. Chicago: Aldine. Terry, Roger L. and Cindy Ann Hall (1989), "Affective Responses to Eyeglasses," Journal of the American Optometric Association, 60 (8), 609-11. Terry, Roger L. and John H. Krantz (1993), "Dimensions of Trait Attributions Associated with Eyeglasses, Men's Facial Hair, and Women's Hair Length," Journal of Applied Social Psychology, 23 (21), 1757-69.
116
Terry, Roger L. and Lesley A. Stockton (1993), "Eyeglasses and Children's Schemata," The Journal of Social Psychology, 133 (4), 425-38. Thompson, Donald L. (1972), "Stereotype of the Salesman," Harvard Business Review, 50 (January/February), 20-29. Thorton, G. R. (1944), "The Effect of Wearing Glasses upon Judgements of Personality Traits of Persons Seen Briefly," Journal of Applied Psychology, 28, 203-07. Thottam, Jyoti (2001), “What a Girl Wants,” (http://www. Onmagazine.com), 6/15/2001. Till, Brian D. and Michael Busler (1998), "Matching Products with Endorsers: Attractiveness Versus Expertise," Journal of Consumer Marketing, 15 (6), 576-84. Tse, Alan Ching Biu (1999), "Factors Affecting Consumer Perceptions of Product Safety- The Case of Nondurables," Journal of International Consumer Marketing, 12 (1), 39-55. Turner, J.C. (1982), "Toward a Cognitive Redefinition of the Social Group," in Social Identity and Intergroup Relations, H. Tajfel, Ed. Cambridge: Cambridge University Press. Whipple, Thomas W. and Alice E. Courtney (1980), “How to Portray Women in TV Commercials, “ Journal of Advertising Research, 20 (April), 4-17. Whipple, Thomas W. and Alice E. Courtney (1985), “Female Role Portrayals in Advertising and Communication Effectiveness: A Review,” Journal of Advertising, 14 (3), 4-18. Woodside, Arch G., Davenport, J. William (1974), "The Effect of Salesman Similarity and Expertise on Consumer Purchasing Behavior," Journal of Marketing Research, 11 (May), 198-202. Yi, Youjae (1990), "Cognitive and Affective Priming Effects of the Context for Print Advertisements," Journal of Advertising, 19 (2), 40-48.
117
Zaichkowsky, Judith L. (1986), "Conceptualizing Involvement," Journal of Advertising, 15 (2), 4-14. Zaichowsky, Judith Lynne (1985), "Measuring the Involvement Construct," Journal of Consumer Research, 12 (December), 341-52. ---- (1994), "The Personal Involvement Inventory: Reduction, Revision, and Application to Advertising," Journal of Advertising, 23 (4), 59-70. Zarate, Michael and Eliot Smith (1990), "Person Categorization and Stereotyping," Social Cognition, 8 (2), 161-85. Zhang, Yong and Richard Buda (1999), "Moderating Effects of Need for Cognition on Responses to Positively versus Negatively Framed Advertising Messages," Journal of Advertising, 28 (2), 1-15.