STEPS TO A WELL BERMUDA - Government of Bermuda BERMUDA HEALTH SURVEY 2014.pdfSTEPS to a Well...
72
GOVERNMENT OF BERMUDA Ministry of Health, Seniors and Environment Department of Health HEALTH SURVEY OF ADULTS IN BERMUDA 2014 STEPS TO A WELL BERMUDA
Transcript of STEPS TO A WELL BERMUDA - Government of Bermuda BERMUDA HEALTH SURVEY 2014.pdfSTEPS to a Well...
GOVERNMENT OF BERMUDAMinistry of Health, Seniors and EnvironmentDepartment of Health
H E A LT H S U R V E Y O F A D U LT S I N B E R M U D A 2 0 1 4
STEPS TO A WELL BERMUDA

Ministry of Health, Seniors and Environment
STEPS TO A WELL BERMUDA
Health Survey of Adults in Bermuda 2014
Published by:
Government of Bermuda, Ministry of Health, Seniors and Environment
Copyright © 2016 Ministry of Health, Seniors and Environment
Mailing Address:
P.O. Box HM 1195
Hamilton HM EX
Bermuda
Tel: 278-4900
Fax : 296-3283
Email: [email protected]
Author:
Dy-Juan DeRoza, M. Sc., CHES, Assessment Officer, Ministry of Health, Seniors and Environment
Reference as:
Ministry of Health, Seniors and Environment (2016) Steps to a Well Bermuda: Health Survey of Adults in
Bermuda 2014. Government of Bermuda

Health Survey of Adults in Bermuda 2014
1
Table of Contents Executive Summary ......................................................................................................................... 3
Highlights .................................................................................................................................... 3
STEPS 1 and 2 ......................................................................................................................................................... 3
STEP 3 .................................................................................................................................................................... 5
Acknowledgements ............................................................................................................................................... 5
Introduction .................................................................................................................................... 6
Purpose ....................................................................................................................................... 6
Methodology ............................................................................................................................... 6
STEPS 1 and 2: Behavioural and Physical Measurements .............................................................. 8
Demographic Information .......................................................................................................... 8
Results ....................................................................................................................................... 11
Nutrition .............................................................................................................................................................. 11
Physical Activity ................................................................................................................................................... 20
Overweight and Obesity ...................................................................................................................................... 23
Blood Pressure ..................................................................................................................................................... 25
Diabetes ............................................................................................................................................................... 27
Cholesterol ........................................................................................................................................................... 29
Cardiovascular Disease ........................................................................................................................................ 31
Family History ...................................................................................................................................................... 32
Alcohol Consumption .......................................................................................................................................... 33
Tobacco Use ......................................................................................................................................................... 36
Health Care .......................................................................................................................................................... 42
Lifestyle Advice .................................................................................................................................................... 44
Non-Communicable Disease Risk (Combined Risk Factors) ................................................................................. 45
STEP 3: Biochemical Measurements ............................................................................................. 46
Demographic Information ........................................................................................................ 46
Results ....................................................................................................................................... 49
Fasting Blood Glucose .......................................................................................................................................... 49
Health Survey of Adults in Bermuda 2014
2
Total Cholesterol.................................................................................................................................................. 50
Discussion...................................................................................................................................... 51
Conclusion ........................................................................................................................................................... 52
Appendix: STEPS to a Well Bermuda Survey Instrument ............................................................. 53
References .................................................................................................................................... 66
Health Survey of Adults in Bermuda 2014
3
Executive Summary The Office of the Chief Medical Officer, within the Ministry of Health, Seniors and Environment, and the Health
Promotion Office of the Department of Health in Bermuda collaborated with representatives from the Bermuda
Diabetes Association to conduct a comprehensive survey on selected non-communicable diseases and their risk
factors. As the World Health Organization STEPwise approach to chronic disease risk factor surveillance (STEPS)
was designed for this purpose, the STEPS protocol was used. Given the region in which Bermuda is situated, the
Pan-American version (PAHO-STEPS) was used with assistance from the Caribbean Public Health Agency (CARPHA).
As Bermuda’s National Health Promotion Strategy is entitled Well Bermuda, it was deemed appropriate to entitle
this health survey of adults as “STEPS to a Well Bermuda”. Indeed, the results of the survey indicate that Bermuda
must continue to take steps towards a Well Bermuda. The results indicate the need for improvements in fruit and
vegetable consumption and physical activity for health, and the need to reduce or halt any rise in overweight and
obesity in the population. Effort must also be made to further reduce and/or halt the rates of hypertension,
diabetes and high cholesterol. Alcohol use continues to be high and tobacco use is relatively unchanged. Bermuda
has to address these key risk factors. These results should be used to drive policies and programmes, inform public
health priorities, and garner greater intersectoral collaboration as necessary to combat these risks to the health
and wellbeing of the residents of Bermuda.
Highlights Nearly 1200 adults were interviewed about their risk factors and chronic disease conditions and had physical
measurements taken (STEPS 1 and 2). Also, just over 450 persons had biochemical measurements taken (STEP 3).
This report presents the main findings of the survey by age, gender, race, education and income level.
STEPS 1 and 2
18% consumed five or more servings of fruit and/or vegetables per day.
50% drank at least one sugary drink per day.
27% do not meet the current World Health Organization recommendations of physical activity for health.
Women are more likely to not meet the recommendations (34%).
37% have low levels of physical activity, 24% have moderate levels of physical activity, and 40% have high
levels of physical activity. Men are more likely to have a high level of physical activity (52%).
60% do not engage in work-related physical activity, 67% do not engage in any transport-related physical
activity and 39% do not engage in physical activity for recreation. Persons least likely to engage in physical
activity for recreation tended to be:
- Aged 65 years and older (57%)
- Black (45%)
- With secondary education or lower (53%)
Health Survey of Adults in Bermuda 2014
4
75% were overweight or obese (40.2% and 34.4%, respectively). Men were more likely to be overweight,
not obese, than women (50% compared to 30%). Younger adults aged 18-34 years were least likely to be
overweight or obese (53%).
33% reported having high blood pressure – a slight decrease from 36% in 2011. Those with high blood
pressure tended to be:
- Aged 55-64 years (51%) or 65 years and older (58%)
- Black (41%)
12% reported having diabetes – consistent with 13% in 2011. Those with diabetes tended to be aged 65
years and older (23%).
34% reported having high cholesterol – unchanged from 2011. Those with high cholesterol tended to be
aged 55-64 years (42%) or 65 years and older (46%).
6% reported having cardiovascular disease (angina, heart attack or stroke). Those with cardiovascular
disease tended to be aged 55-64 years (11%) or 65 years and older (14%).
In terms of family history, the common conditions among immediate family members were high blood
pressure (64%), diabetes (52%), high cholesterol (48%) and cancer (47%). Fewer had immediate family
members who had a stroke (23%) or early heart attack (14%). Blacks were most likely to have an
immediate family member with diabetes (60%).
64% currently drank alcohol – an increase from 50% in 2011. Current drinkers were more likely to be:
- Men (75%)
- Aged 18-34 years (68%) or 35-54 years (73%)
- White (82%)
28% reported binge drinking – a slight increase from 24% in 2006. Binge drinkers were more likely to be:
- Men (37%)
- Aged 18-34 years (48%)
14% were current smokers – consistent with 13% in 2011. Men were more likely to be current smokers
(20%). Among current smokers, 45% had attempted to stop smoking – a decline from 49% in 2011.
8% reported no health insurance – an increase of 2% from 2011. Blacks were more likely to not have
insurance (13%). Half of those without health insurance (4%) did not have health insurance because they
could not afford it. Persons who could not afford health insurance tended to be :
- Aged 18-34 years (11%)
- Blacks (82%)
Health Survey of Adults in Bermuda 2014
5
17% reported having a non-communicable disease (NCD) including cardiovascular disease, cancer,
chronic respiratory disease, diabetes, etc. Adults aged 55-64 years (25%) and 65 years and older (34%)
were more likely to have a NCD.
In terms of lifestyle advice, the commonly received advice from health care providers was in regards to
improving physical activity (44%), weight management (38%), and fruit and vegetable consumption (31%).
Fewer received advice about fat and salt in the diet (25% and 18%, respectively).
In terms of NCD risk, 42% had three or more significant risk factors for non-communicable diseases.
Persons with three or more risk factors tended to be :
- Aged 55-64 years (59%) or 65 years and older (66%)
- With secondary or lower education (54%)
- In households with income less than $72,000 (52%)
STEP 3
12% had a fasting blood glucose measurement within the diabetic range or were currently on medication
for diabetes. Additionally, 8% had a fasting blood glucose measurement in the pre-diabetic range. Those
with raised blood glucose tended to be:
- Aged 65 years and older (26%)
- With secondary or lower education (23%)
- In households with income less than $72,000 (17%)
26% had a raised total cholesterol measurement or were currently on medication for high cholesterol.
Additionally, 21% had a total cholesterol measurement in the borderline high range. Those with raised
total cholesterol tended to be in households with income less than $72,000 (36%). Those with cholesterol
levels above the normal range tended to be aged 55-64 years (65.7%) and aged 65 years and older
(64.7%).
Acknowledgements STEPS to a Well Bermuda 2014 was completed under the guidance of the Chief Medical Officer, Dr. Cheryl Peek-Ball, with the assistance of Dr. Glennis Andall-Brereton and Ms. Sarah Quesnel-Crooks of CARPHA. It would not have been possible without the collaborative efforts of the additional core members of the STEPS Coordinating Committee: Dr. Annabel Fountain, Ms. Debbie Jones, and Dr. Virloy Lewin. The STEPS Coordinating Committee is also grateful for the assistance of the Department of Health Clinical Laboratory, namely Ms. Susan Jatto and Ms. Aaisha Farooqui, Oral Health personnel led by Dr. Celia Nzabalinda, and Ms. Pauleter Stevens of the Health Promotion Office. There were also countless hours of effort expended by STEPS Supervisors and Interviewers, too numerous to mention, and personnel at, and engaged by, the Chronic Disease Management Centre and the Bermuda Diabetes Association. Last but not least, the assistance of Ms. Shakira Warner, was invaluable in the completion of STEPS to a Well Bermuda 2014.
Health Survey of Adults in Bermuda 2014
6
Introduction
This document reports on data from STEPS to a Well Bermuda 2014, a population-based cross-sectional
assessment of chronic disease risk factors in adults aged 18 and over. It was carried out from November 2013
through December 2014 using the Pan-American version of the World Health Organization’s STEPwise approach to
chronic disease risk factor surveillance (STEPS) methodology. STEPS to a Well Bermuda was conducted with the
assistance of the Caribbean Public Health Agency (CARPHA) and local public health partners, including the
Bermuda Hospitals Board and the Bermuda Diabetes Association
Purpose STEPS to a Well Bermuda, using self-reported information and a range of objective physical and biochemical
measures, aimed to:
describe the prevalence and distribution of chronic disease risk factors and selected chronic diseases in
the population,
track the direction and magnitude of risk factor trends, and
provide a sound evidence base to inform public health priorities for the prevention and control of chronic
non-communicable diseases.
Methodology The Pan-American Health Organization STEPwise approach to chronic disease risk factor surveillance (PAHO-STEPS)
was used in Bermuda. PAHO-STEPS is adapted from the WHO STEPwise approach to chronic disease risk factor
surveillance (WHO-STEPS) and is PAHO’s recommended tool for surveillance of chronic disease risk factors in
adults in the region.
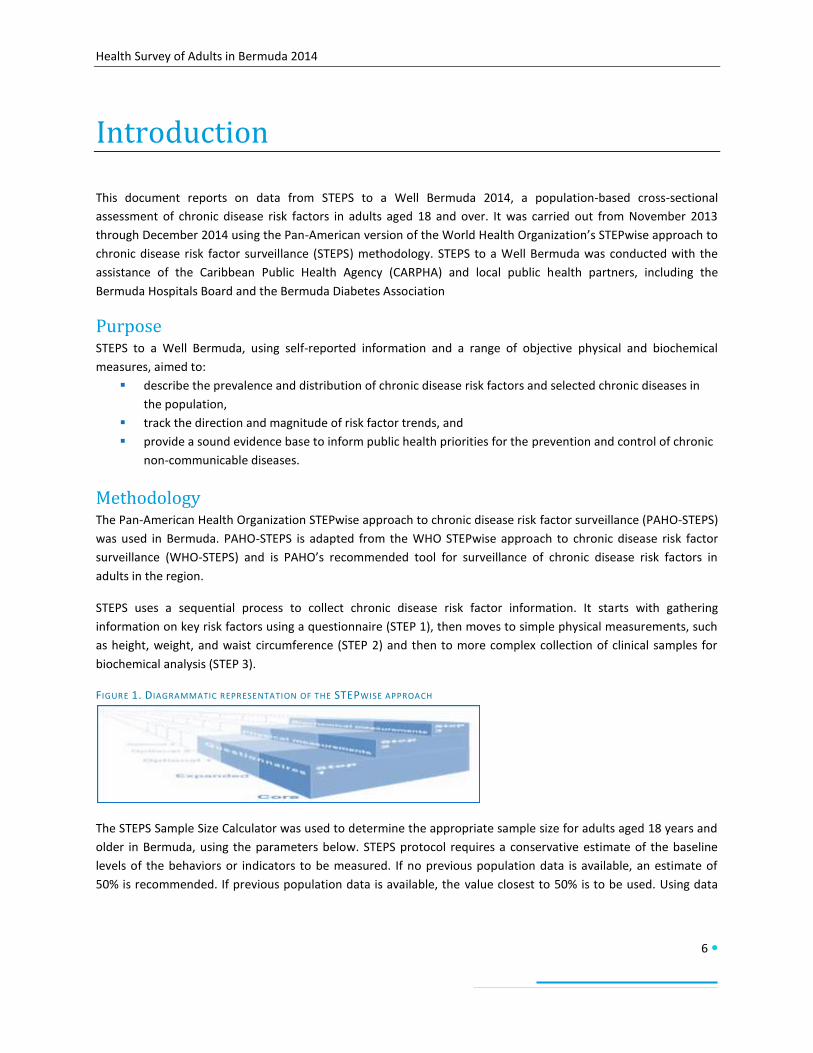
STEPS uses a sequential process to collect chronic disease risk factor information. It starts with gathering
information on key risk factors using a questionnaire (STEP 1), then moves to simple physical measurements, such
as height, weight, and waist circumference (STEP 2) and then to more complex collection of clinical samples for
biochemical analysis (STEP 3).
FIGURE 1. DIAGRAMMATIC REPRESENTATION OF THE STEPWISE APPROACH
The STEPS Sample Size Calculator was used to determine the appropriate sample size for adults aged 18 years and
older in Bermuda, using the parameters below. STEPS protocol requires a conservative estimate of the baseline
levels of the behaviors or indicators to be measured. If no previous population data is available, an estimate of
50% is recommended. If previous population data is available, the value closest to 50% is to be used. Using data
Health Survey of Adults in Bermuda 2014
7
from the Health Survey of Adults and Children 2011, it was determined that the baseline value of 36% was to be
used for the sample calculation.
The total sample size for STEPS 1 and 2 was determined to be 2656 households. The STEPS protocol states that
STEP 3 can be conducted on a smaller sample size and recommends a subsample using a minimum of 20% of the
total sample size for STEP 3. As non-response for STEP 3 was likely to be high, all respondents in the total sample
were eligible to participate in STEP 3.
Data collection was extended and occurred from 10 November 2013 through 20 December 2014 (excluding
periods around Christmas and other large public holidays). Households were included from each parish,
proportionate to size. Within each selected household, on adult was randomly selected to participate in the
survey.
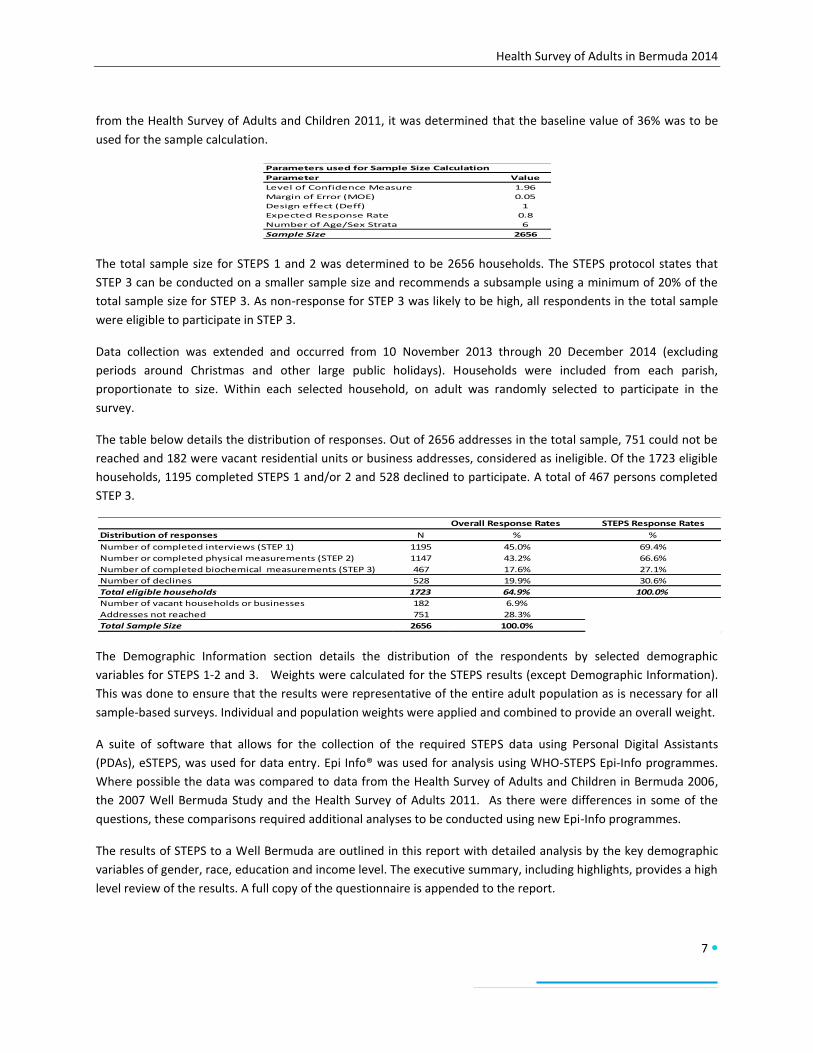
The table below details the distribution of responses. Out of 2656 addresses in the total sample, 751 could not be
reached and 182 were vacant residential units or business addresses, considered as ineligible. Of the 1723 eligible
households, 1195 completed STEPS 1 and/or 2 and 528 declined to participate. A total of 467 persons completed
STEP 3.
The Demographic Information section details the distribution of the respondents by selected demographic
variables for STEPS 1-2 and 3. Weights were calculated for the STEPS results (except Demographic Information).
This was done to ensure that the results were representative of the entire adult population as is necessary for all
sample-based surveys. Individual and population weights were applied and combined to provide an overall weight.
A suite of software that allows for the collection of the required STEPS data using Personal Digital Assistants
(PDAs), eSTEPS, was used for data entry. Epi Info® was used for analysis using WHO-STEPS Epi-Info programmes.
Where possible the data was compared to data from the Health Survey of Adults and Children in Bermuda 2006,
the 2007 Well Bermuda Study and the Health Survey of Adults 2011. As there were differences in some of the
questions, these comparisons required additional analyses to be conducted using new Epi-Info programmes.
The results of STEPS to a Well Bermuda are outlined in this report with detailed analysis by the key demographic
variables of gender, race, education and income level. The executive summary, including highlights, provides a high
level review of the results. A full copy of the questionnaire is appended to the report.
Parameters used for Sample Size Calculation
Parameter Value
Level of Confidence Measure 1.96
Margin of Error (MOE) 0.05
Design effect (Deff) 1
Expected Response Rate 0.8
Number of Age/Sex Strata 6
Sample Size 2656
Overall Response Rates STEPS Response Rates
Distribution of responses N % %
Number of completed interviews (STEP 1) 1195 45.0% 69.4%
Number or completed physical measurements (STEP 2) 1147 43.2% 66.6%
Number of completed biochemical measurements (STEP 3) 467 17.6% 27.1%
Number of declines 528 19.9% 30.6%
Total eligible households 1723 64.9% 100.0%
Number of vacant households or businesses 182 6.9%
Addresses not reached 751 28.3%
Total Sample Size 2656 100.0%

Health Survey of Adults in Bermuda 2014
8
STEPS 1 and 2: Behavioural and Physical
Measurements
Demographic Information Gender
Age
N % N % N %
1195 100.0% 494 41.3% 701 58.7%
Men 494 41.3% 494 100.0% 0 0.0%
Women 701 58.7% 0 0.0% 701 100.0%
18-34 205 17.2% 91 44.4% 114 55.6%
35-54 433 36.2% 194 44.8% 239 55.2%
55-64 247 20.7% 91 36.8% 156 63.2%
65+ 310 25.9% 118 38.1% 192 61.9%
Black 664 55.6% 261 39.3% 403 60.7%
White 390 32.6% 177 45.4% 213 54.6%
Mixed & Other 141 11.8% 56 39.7% 85 60.3%
Secondary & Lower 422 35.3% 195 46.2% 227 53.8%
Technical & Higher 773 64.7% 299 38.7% 474 61.3%
Under $72,000 516 43.2% 184 35.7% 332 64.3%
$72,000 to $107,999 187 15.6% 86 46.0% 101 54.0%
$108,000 and over 293 24.5% 144 49.1% 149 50.9%
Not Stated 199 16.7% 80 40.2% 119 59.8%
Total Men Women
Gender
Total
Gender
Age
Race
Education
Income
N % N % N % N %
205 17.2% 433 36.2% 247 20.7% 310 25.9%
Men 91 18.4% 194 39.3% 91 18.4% 118 23.9%
Women 114 16.3% 239 34.1% 156 22.3% 192 27.4%
18-34 205 100.0% 0 0.0% 0 0.0% 0 0.0%
35-54 0 0.0% 433 100.0% 0 0.0% 0 0.0%
55-64 0 0.0% 0 0.0% 247 100.0% 0 0.0%
65+ 0 0.0% 0 0.0% 0 0.0% 310 100.0%
Black 109 16.4% 219 33.0% 148 22.3% 188 28.3%
White 52 13.3% 154 39.5% 76 19.5% 108 27.7%
Mixed & Other 44 31.2% 60 42.6% 23 16.3% 14 9.9%
Secondary & Lower 54 12.8% 105 24.9% 84 19.9% 179 42.4%
Technical & Higher 151 19.5% 328 42.4% 163 21.1% 131 16.9%
Under $72,000 87 16.9% 124 24.0% 112 21.7% 193 37.4%
$72,000 to $107,999 38 20.3% 76 40.6% 43 23.0% 30 16.0%
$108,000 and over 43 14.7% 172 58.7% 58 19.8% 20 6.8%
Not Stated 37 18.6% 61 30.7% 34 17.1% 67 33.7%
Income
Gender
Age
Race
Education
Total
54-65 65+18-34 35-54
Age Group
Health Survey of Adults in Bermuda 2014
9
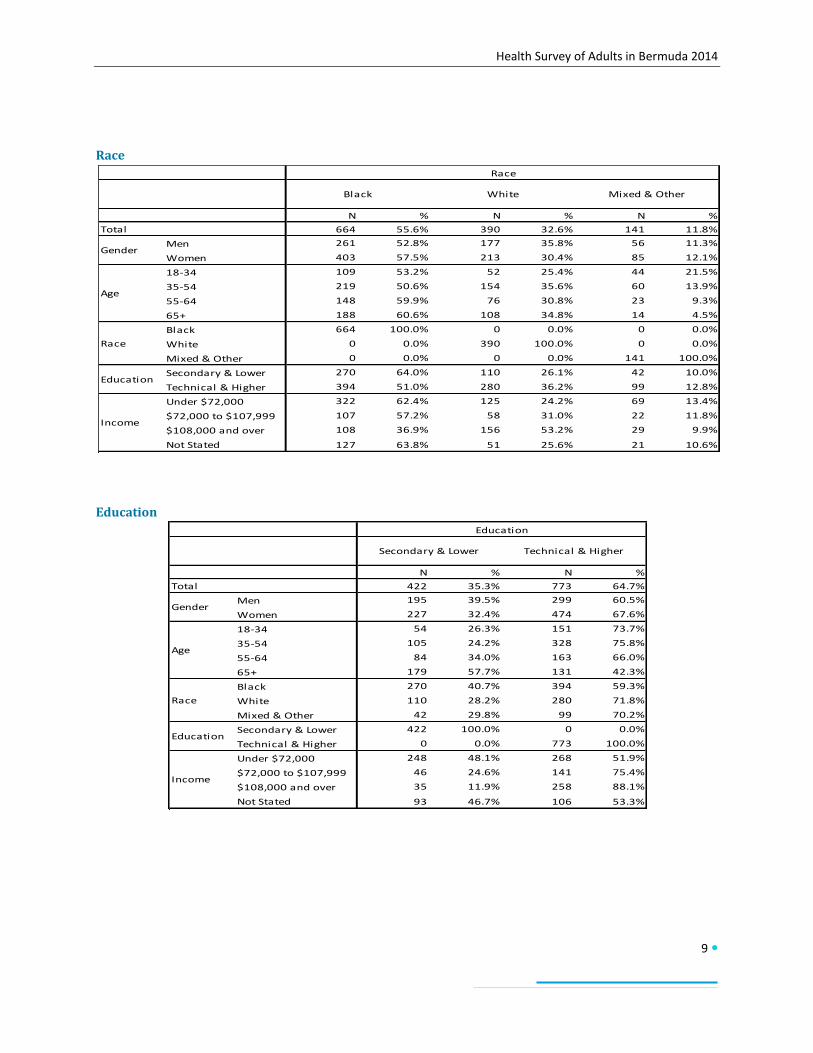
Race
Education
N % N % N %
664 55.6% 390 32.6% 141 11.8%
Men 261 52.8% 177 35.8% 56 11.3%
Women 403 57.5% 213 30.4% 85 12.1%
18-34 109 53.2% 52 25.4% 44 21.5%
35-54 219 50.6% 154 35.6% 60 13.9%
55-64 148 59.9% 76 30.8% 23 9.3%
65+ 188 60.6% 108 34.8% 14 4.5%
Black 664 100.0% 0 0.0% 0 0.0%
White 0 0.0% 390 100.0% 0 0.0%
Mixed & Other 0 0.0% 0 0.0% 141 100.0%
Secondary & Lower 270 64.0% 110 26.1% 42 10.0%
Technical & Higher 394 51.0% 280 36.2% 99 12.8%
Under $72,000 322 62.4% 125 24.2% 69 13.4%
$72,000 to $107,999 107 57.2% 58 31.0% 22 11.8%
$108,000 and over 108 36.9% 156 53.2% 29 9.9%
Not Stated 127 63.8% 51 25.6% 21 10.6%
Mixed & Other
Race
Total
Black White
Gender
Age
Race
Education
Income
N % N %
422 35.3% 773 64.7%
Men 195 39.5% 299 60.5%
Women 227 32.4% 474 67.6%
18-34 54 26.3% 151 73.7%
35-54 105 24.2% 328 75.8%
55-64 84 34.0% 163 66.0%
65+ 179 57.7% 131 42.3%
Black 270 40.7% 394 59.3%
White 110 28.2% 280 71.8%
Mixed & Other 42 29.8% 99 70.2%
Secondary & Lower 422 100.0% 0 0.0%
Technical & Higher 0 0.0% 773 100.0%
Under $72,000 248 48.1% 268 51.9%
$72,000 to $107,999 46 24.6% 141 75.4%
$108,000 and over 35 11.9% 258 88.1%
Not Stated 93 46.7% 106 53.3%
Secondary & Lower
Education
Total
Technical & Higher
Gender
Age
Race
Education
Income
Health Survey of Adults in Bermuda 2014
10
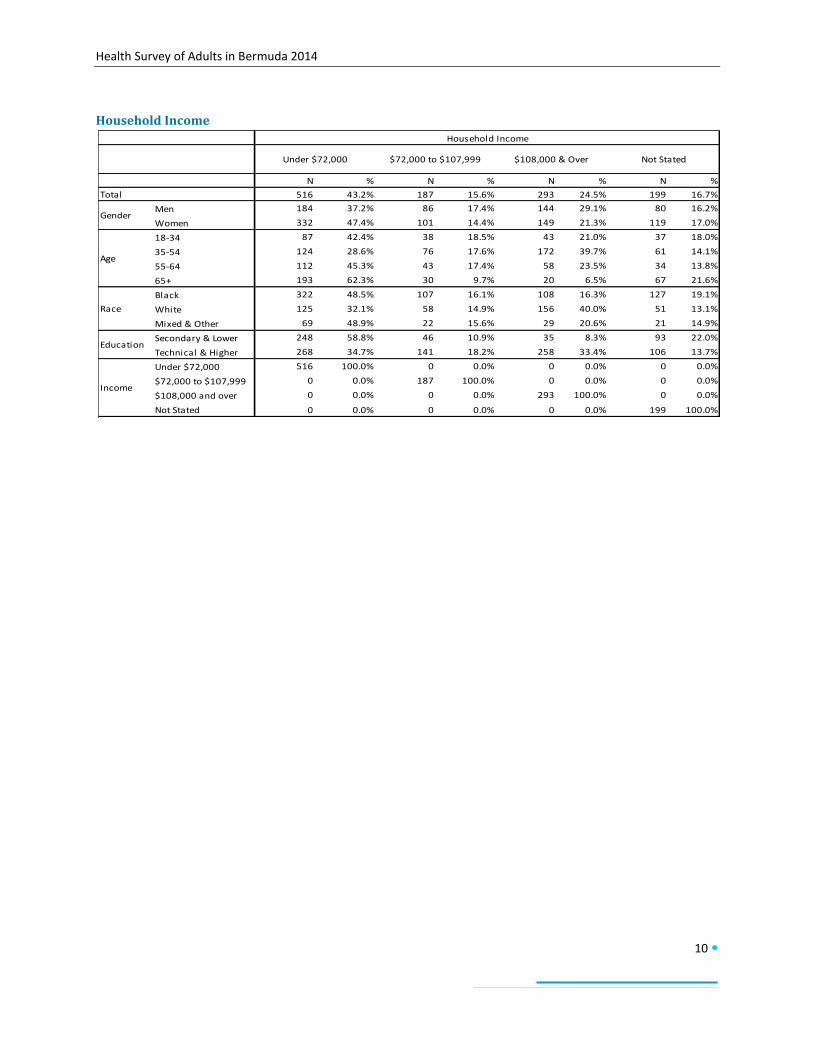
Household Income
N % N % N % N %
516 43.2% 187 15.6% 293 24.5% 199 16.7%
Men 184 37.2% 86 17.4% 144 29.1% 80 16.2%
Women 332 47.4% 101 14.4% 149 21.3% 119 17.0%
18-34 87 42.4% 38 18.5% 43 21.0% 37 18.0%
35-54 124 28.6% 76 17.6% 172 39.7% 61 14.1%
55-64 112 45.3% 43 17.4% 58 23.5% 34 13.8%
65+ 193 62.3% 30 9.7% 20 6.5% 67 21.6%
Black 322 48.5% 107 16.1% 108 16.3% 127 19.1%
White 125 32.1% 58 14.9% 156 40.0% 51 13.1%
Mixed & Other 69 48.9% 22 15.6% 29 20.6% 21 14.9%
Secondary & Lower 248 58.8% 46 10.9% 35 8.3% 93 22.0%
Technical & Higher 268 34.7% 141 18.2% 258 33.4% 106 13.7%
Under $72,000 516 100.0% 0 0.0% 0 0.0% 0 0.0%
$72,000 to $107,999 0 0.0% 187 100.0% 0 0.0% 0 0.0%
$108,000 and over 0 0.0% 0 0.0% 293 100.0% 0 0.0%
Not Stated 0 0.0% 0 0.0% 0 0.0% 199 100.0%
Income
Not Stated
Gender
Age
Race
Education
Total
Household Income
Under $72,000 $72,000 to $107,999 $108,000 & Over
Health Survey of Adults in Bermuda 2014
11
Results
Nutrition
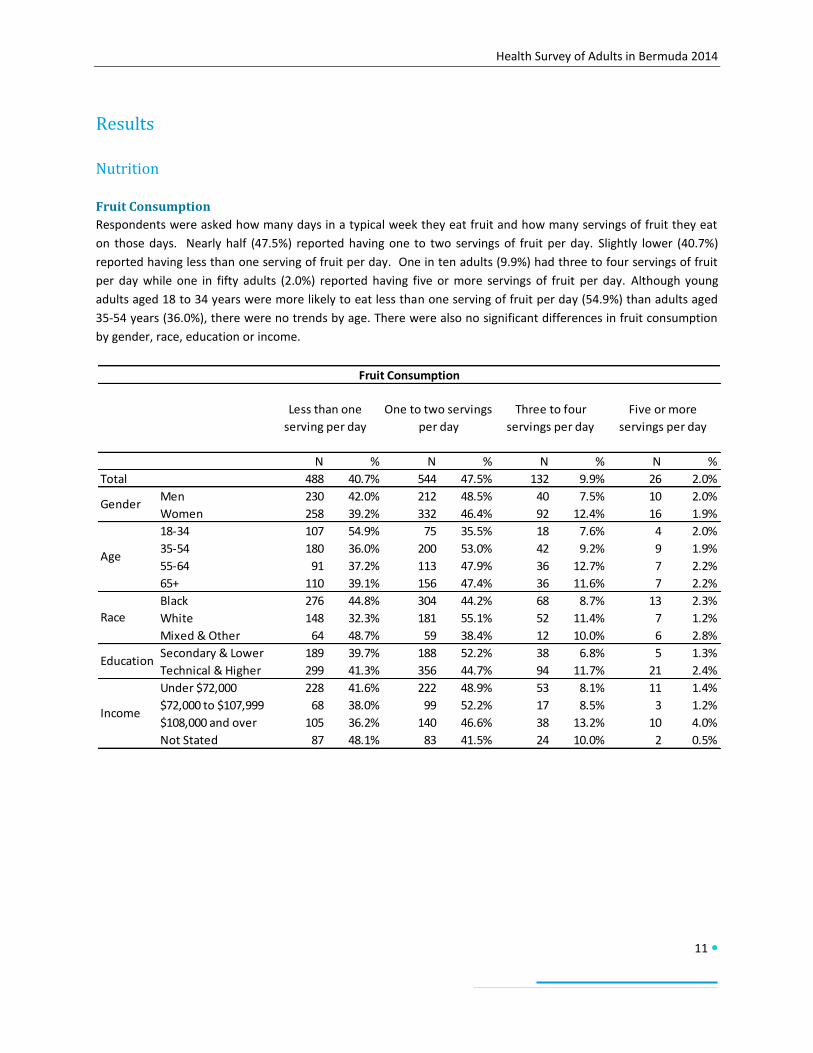
Fruit Consumption
Respondents were asked how many days in a typical week they eat fruit and how many servings of fruit they eat
on those days. Nearly half (47.5%) reported having one to two servings of fruit per day. Slightly lower (40.7%)
reported having less than one serving of fruit per day. One in ten adults (9.9%) had three to four servings of fruit
per day while one in fifty adults (2.0%) reported having five or more servings of fruit per day. Although young
adults aged 18 to 34 years were more likely to eat less than one serving of fruit per day (54.9%) than adults aged
35-54 years (36.0%), there were no trends by age. There were also no significant differences in fruit consumption
by gender, race, education or income.
N % N % N % N %
Total 488 40.7% 544 47.5% 132 9.9% 26 2.0%
Men 230 42.0% 212 48.5% 40 7.5% 10 2.0%
Women 258 39.2% 332 46.4% 92 12.4% 16 1.9%
18-34 107 54.9% 75 35.5% 18 7.6% 4 2.0%
35-54 180 36.0% 200 53.0% 42 9.2% 9 1.9%
55-64 91 37.2% 113 47.9% 36 12.7% 7 2.2%
65+ 110 39.1% 156 47.4% 36 11.6% 7 2.2%
Black 276 44.8% 304 44.2% 68 8.7% 13 2.3%
White 148 32.3% 181 55.1% 52 11.4% 7 1.2%
Mixed & Other 64 48.7% 59 38.4% 12 10.0% 6 2.8%
Secondary & Lower 189 39.7% 188 52.2% 38 6.8% 5 1.3%
Technical & Higher 299 41.3% 356 44.7% 94 11.7% 21 2.4%
Under $72,000 228 41.6% 222 48.9% 53 8.1% 11 1.4%
$72,000 to $107,999 68 38.0% 99 52.2% 17 8.5% 3 1.2%
$108,000 and over 105 36.2% 140 46.6% 38 13.2% 10 4.0%
Not Stated 87 48.1% 83 41.5% 24 10.0% 2 0.5%
Gender
Age
Race
Education
Income
Fruit Consumption
Less than one
serving per day
One to two servings
per day
Three to four
servings per day
Five or more
servings per day
Health Survey of Adults in Bermuda 2014
12
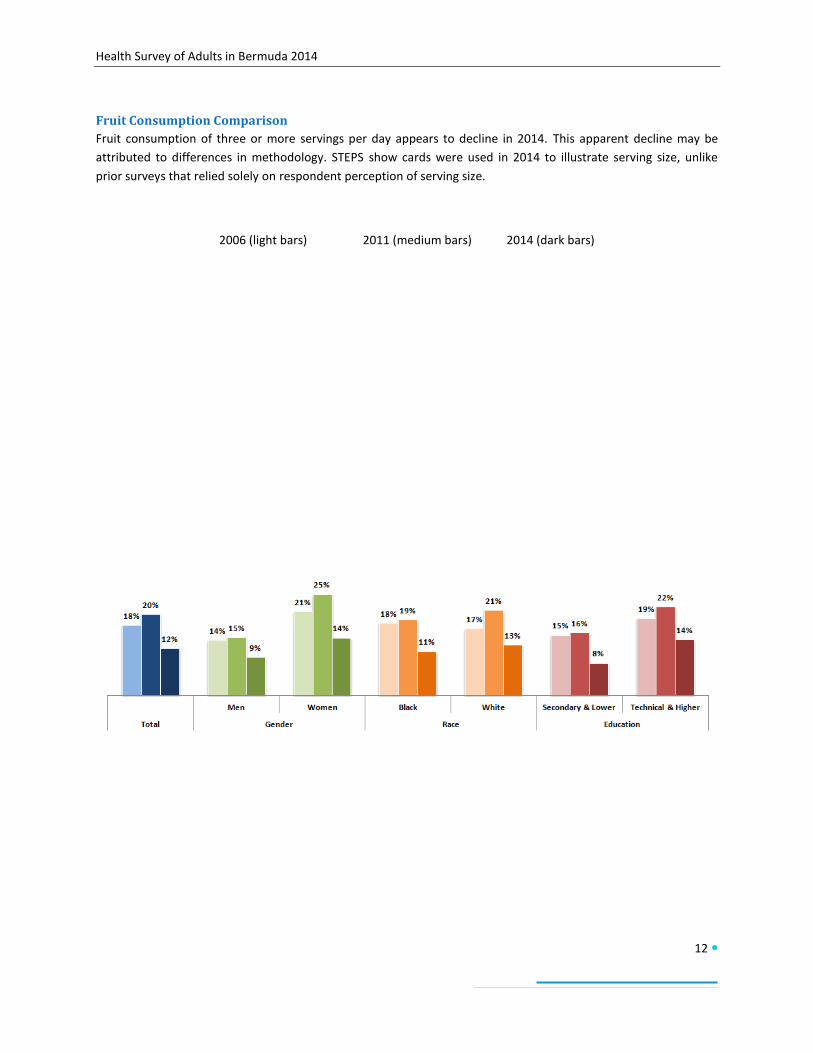
Fruit Consumption Comparison
Fruit consumption of three or more servings per day appears to decline in 2014. This apparent decline may be
attributed to differences in methodology. STEPS show cards were used in 2014 to illustrate serving size, unlike
prior surveys that relied solely on respondent perception of serving size.
2006 (light bars) 2011 (medium bars) 2014 (dark bars)
Health Survey of Adults in Bermuda 2014
13
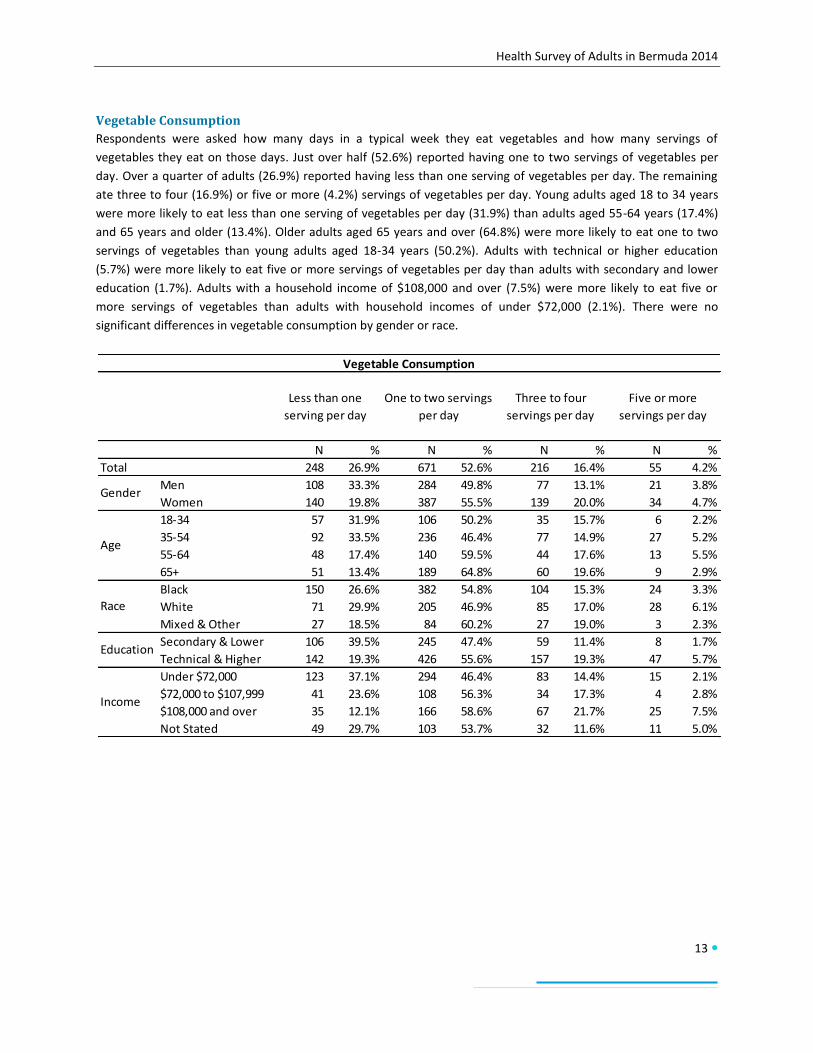
Vegetable Consumption
Respondents were asked how many days in a typical week they eat vegetables and how many servings of
vegetables they eat on those days. Just over half (52.6%) reported having one to two servings of vegetables per
day. Over a quarter of adults (26.9%) reported having less than one serving of vegetables per day. The remaining
ate three to four (16.9%) or five or more (4.2%) servings of vegetables per day. Young adults aged 18 to 34 years
were more likely to eat less than one serving of vegetables per day (31.9%) than adults aged 55-64 years (17.4%)
and 65 years and older (13.4%). Older adults aged 65 years and over (64.8%) were more likely to eat one to two
servings of vegetables than young adults aged 18-34 years (50.2%). Adults with technical or higher education
(5.7%) were more likely to eat five or more servings of vegetables per day than adults with secondary and lower
education (1.7%). Adults with a household income of $108,000 and over (7.5%) were more likely to eat five or
more servings of vegetables than adults with household incomes of under $72,000 (2.1%). There were no
significant differences in vegetable consumption by gender or race.
N % N % N % N %
Total 248 26.9% 671 52.6% 216 16.4% 55 4.2%
Men 108 33.3% 284 49.8% 77 13.1% 21 3.8%
Women 140 19.8% 387 55.5% 139 20.0% 34 4.7%
18-34 57 31.9% 106 50.2% 35 15.7% 6 2.2%
35-54 92 33.5% 236 46.4% 77 14.9% 27 5.2%
55-64 48 17.4% 140 59.5% 44 17.6% 13 5.5%
65+ 51 13.4% 189 64.8% 60 19.6% 9 2.9%
Black 150 26.6% 382 54.8% 104 15.3% 24 3.3%
White 71 29.9% 205 46.9% 85 17.0% 28 6.1%
Mixed & Other 27 18.5% 84 60.2% 27 19.0% 3 2.3%
Secondary & Lower 106 39.5% 245 47.4% 59 11.4% 8 1.7%
Technical & Higher 142 19.3% 426 55.6% 157 19.3% 47 5.7%
Under $72,000 123 37.1% 294 46.4% 83 14.4% 15 2.1%
$72,000 to $107,999 41 23.6% 108 56.3% 34 17.3% 4 2.8%
$108,000 and over 35 12.1% 166 58.6% 67 21.7% 25 7.5%
Not Stated 49 29.7% 103 53.7% 32 11.6% 11 5.0%
Vegetable Consumption
Less than one
serving per day
One to two servings
per day
Three to four
servings per day
Five or more
servings per day
Gender
Age
Race
Education
Income
Health Survey of Adults in Bermuda 2014
14
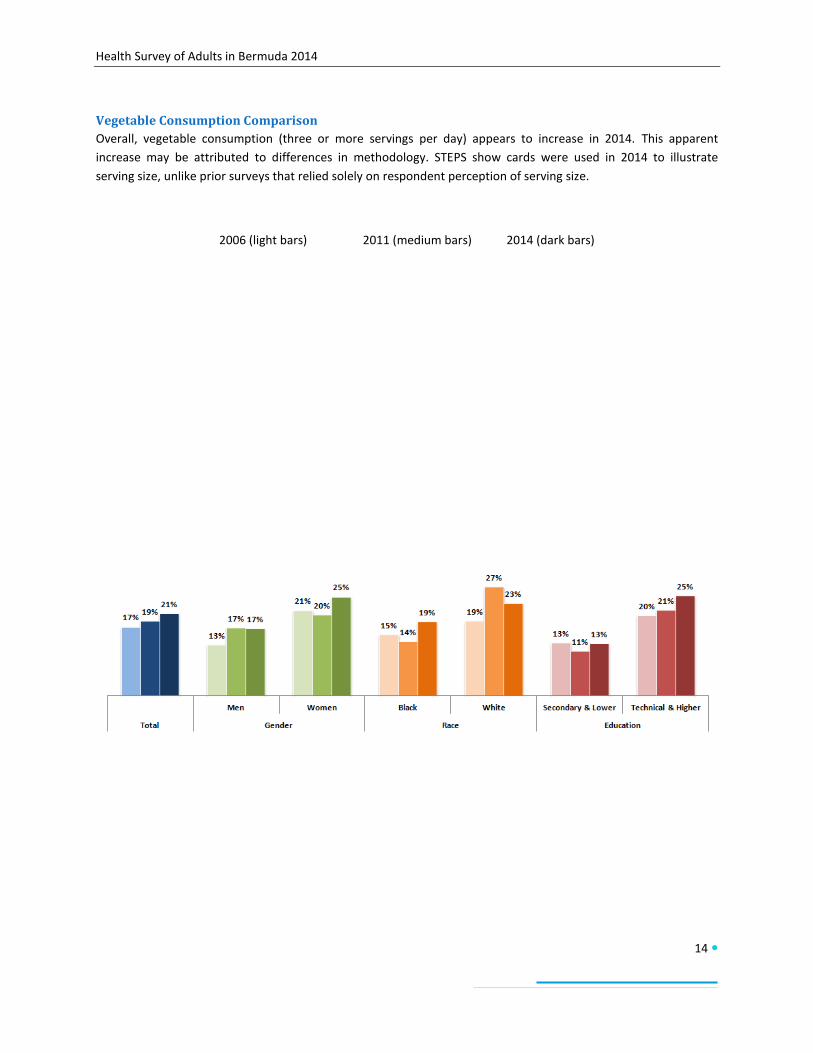
Vegetable Consumption Comparison
Overall, vegetable consumption (three or more servings per day) appears to increase in 2014. This apparent
increase may be attributed to differences in methodology. STEPS show cards were used in 2014 to illustrate
serving size, unlike prior surveys that relied solely on respondent perception of serving size.
2006 (light bars) 2011 (medium bars) 2014 (dark bars)
Health Survey of Adults in Bermuda 2014
15
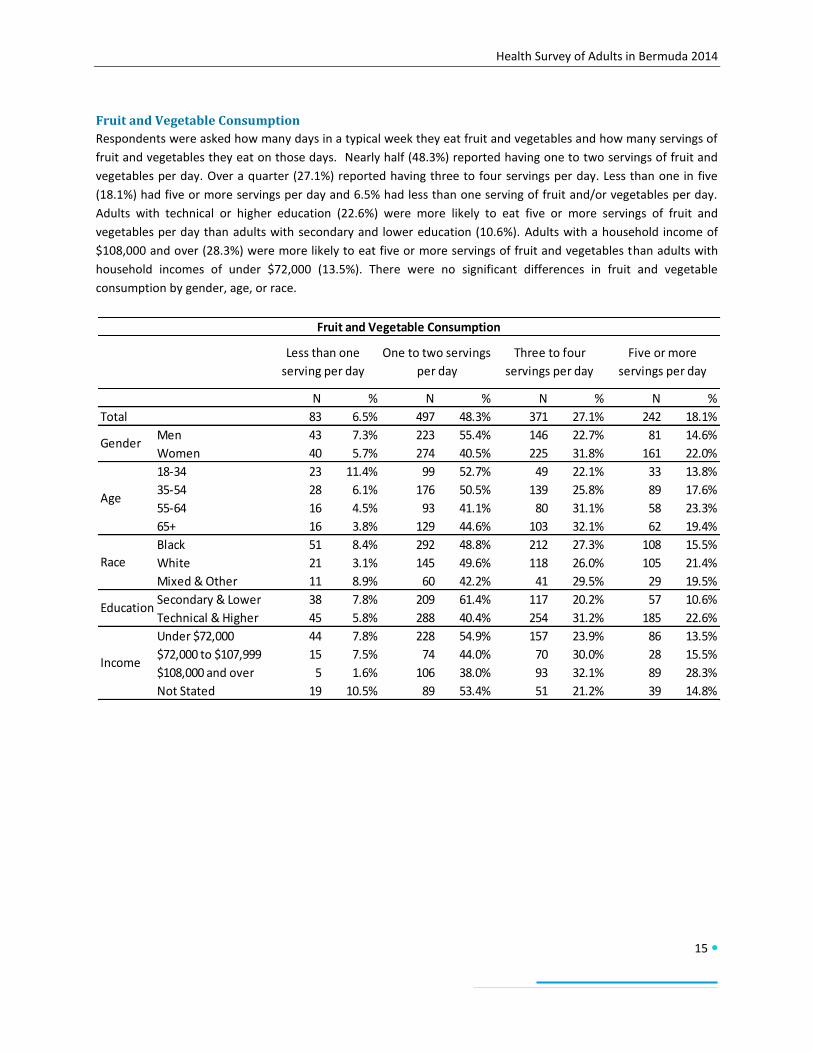
Fruit and Vegetable Consumption
Respondents were asked how many days in a typical week they eat fruit and vegetables and how many servings of
fruit and vegetables they eat on those days. Nearly half (48.3%) reported having one to two servings of fruit and
vegetables per day. Over a quarter (27.1%) reported having three to four servings per day. Less than one in five
(18.1%) had five or more servings per day and 6.5% had less than one serving of fruit and/or vegetables per day.
Adults with technical or higher education (22.6%) were more likely to eat five or more servings of fruit and
vegetables per day than adults with secondary and lower education (10.6%). Adults with a household income of
$108,000 and over (28.3%) were more likely to eat five or more servings of fruit and vegetables than adults with
household incomes of under $72,000 (13.5%). There were no significant differences in fruit and vegetable
consumption by gender, age, or race.
N % N % N % N %
Total 83 6.5% 497 48.3% 371 27.1% 242 18.1%
Men 43 7.3% 223 55.4% 146 22.7% 81 14.6%
Women 40 5.7% 274 40.5% 225 31.8% 161 22.0%
18-34 23 11.4% 99 52.7% 49 22.1% 33 13.8%
35-54 28 6.1% 176 50.5% 139 25.8% 89 17.6%
55-64 16 4.5% 93 41.1% 80 31.1% 58 23.3%
65+ 16 3.8% 129 44.6% 103 32.1% 62 19.4%
Black 51 8.4% 292 48.8% 212 27.3% 108 15.5%
White 21 3.1% 145 49.6% 118 26.0% 105 21.4%
Mixed & Other 11 8.9% 60 42.2% 41 29.5% 29 19.5%
Secondary & Lower 38 7.8% 209 61.4% 117 20.2% 57 10.6%
Technical & Higher 45 5.8% 288 40.4% 254 31.2% 185 22.6%
Under $72,000 44 7.8% 228 54.9% 157 23.9% 86 13.5%
$72,000 to $107,999 15 7.5% 74 44.0% 70 30.0% 28 15.5%
$108,000 and over 5 1.6% 106 38.0% 93 32.1% 89 28.3%
Not Stated 19 10.5% 89 53.4% 51 21.2% 39 14.8%
Age
Race
Education
Income
Fruit and Vegetable Consumption
Less than one
serving per day
One to two servings
per day
Three to four
servings per day
Five or more
servings per day
Gender
Health Survey of Adults in Bermuda 2014
16
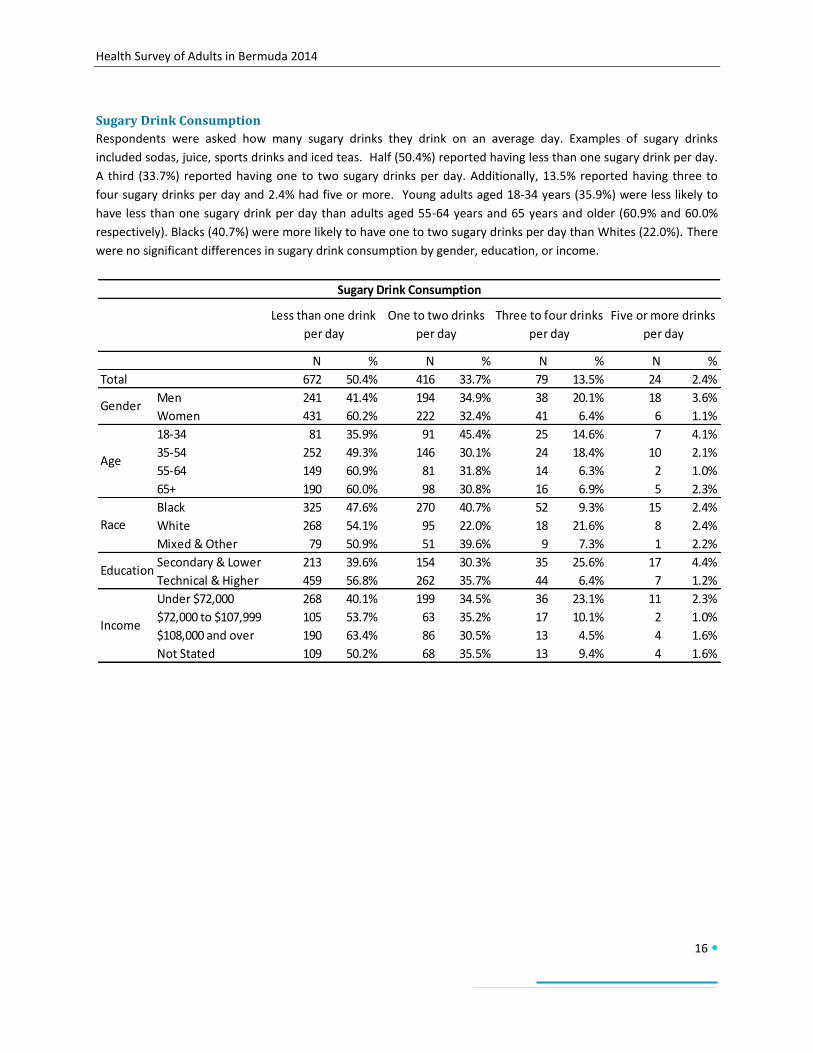
Sugary Drink Consumption
Respondents were asked how many sugary drinks they drink on an average day. Examples of sugary drinks
included sodas, juice, sports drinks and iced teas. Half (50.4%) reported having less than one sugary drink per day.
A third (33.7%) reported having one to two sugary drinks per day. Additionally, 13.5% reported having three to
four sugary drinks per day and 2.4% had five or more. Young adults aged 18-34 years (35.9%) were less likely to
have less than one sugary drink per day than adults aged 55-64 years and 65 years and older (60.9% and 60.0%
respectively). Blacks (40.7%) were more likely to have one to two sugary drinks per day than Whites (22.0%). There
were no significant differences in sugary drink consumption by gender, education, or income.
N % N % N % N %
Total 672 50.4% 416 33.7% 79 13.5% 24 2.4%
Men 241 41.4% 194 34.9% 38 20.1% 18 3.6%
Women 431 60.2% 222 32.4% 41 6.4% 6 1.1%
18-34 81 35.9% 91 45.4% 25 14.6% 7 4.1%
35-54 252 49.3% 146 30.1% 24 18.4% 10 2.1%
55-64 149 60.9% 81 31.8% 14 6.3% 2 1.0%
65+ 190 60.0% 98 30.8% 16 6.9% 5 2.3%
Black 325 47.6% 270 40.7% 52 9.3% 15 2.4%
White 268 54.1% 95 22.0% 18 21.6% 8 2.4%
Mixed & Other 79 50.9% 51 39.6% 9 7.3% 1 2.2%
Secondary & Lower 213 39.6% 154 30.3% 35 25.6% 17 4.4%
Technical & Higher 459 56.8% 262 35.7% 44 6.4% 7 1.2%
Under $72,000 268 40.1% 199 34.5% 36 23.1% 11 2.3%
$72,000 to $107,999 105 53.7% 63 35.2% 17 10.1% 2 1.0%
$108,000 and over 190 63.4% 86 30.5% 13 4.5% 4 1.6%
Not Stated 109 50.2% 68 35.5% 13 9.4% 4 1.6%
Gender
Age
Race
Education
Income
Sugary Drink Consumption
Less than one drink
per day
One to two drinks
per day
Three to four drinks
per day
Five or more drinks
per day
Health Survey of Adults in Bermuda 2014
17
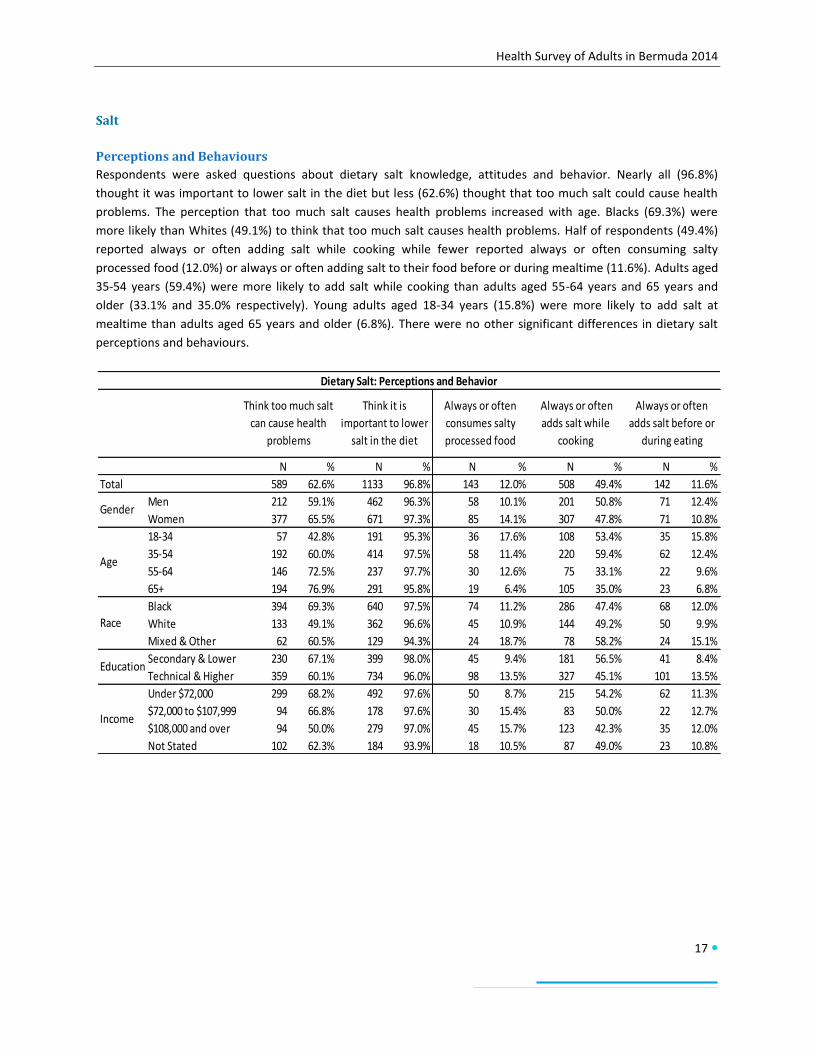
Salt
Perceptions and Behaviours
Respondents were asked questions about dietary salt knowledge, attitudes and behavior. Nearly all (96.8%)
thought it was important to lower salt in the diet but less (62.6%) thought that too much salt could cause health
problems. The perception that too much salt causes health problems increased with age. Blacks (69.3%) were
more likely than Whites (49.1%) to think that too much salt causes health problems. Half of respondents (49.4%)
reported always or often adding salt while cooking while fewer reported always or often consuming salty
processed food (12.0%) or always or often adding salt to their food before or during mealtime (11.6%). Adults aged
35-54 years (59.4%) were more likely to add salt while cooking than adults aged 55-64 years and 65 years and
older (33.1% and 35.0% respectively). Young adults aged 18-34 years (15.8%) were more likely to add salt at
mealtime than adults aged 65 years and older (6.8%). There were no other significant differences in dietary salt
perceptions and behaviours.
N % N % N % N % N %
Total 589 62.6% 1133 96.8% 143 12.0% 508 49.4% 142 11.6%
Men 212 59.1% 462 96.3% 58 10.1% 201 50.8% 71 12.4%
Women 377 65.5% 671 97.3% 85 14.1% 307 47.8% 71 10.8%
18-34 57 42.8% 191 95.3% 36 17.6% 108 53.4% 35 15.8%
35-54 192 60.0% 414 97.5% 58 11.4% 220 59.4% 62 12.4%
55-64 146 72.5% 237 97.7% 30 12.6% 75 33.1% 22 9.6%
65+ 194 76.9% 291 95.8% 19 6.4% 105 35.0% 23 6.8%
Black 394 69.3% 640 97.5% 74 11.2% 286 47.4% 68 12.0%
White 133 49.1% 362 96.6% 45 10.9% 144 49.2% 50 9.9%
Mixed & Other 62 60.5% 129 94.3% 24 18.7% 78 58.2% 24 15.1%
Secondary & Lower 230 67.1% 399 98.0% 45 9.4% 181 56.5% 41 8.4%
Technical & Higher 359 60.1% 734 96.0% 98 13.5% 327 45.1% 101 13.5%
Under $72,000 299 68.2% 492 97.6% 50 8.7% 215 54.2% 62 11.3%
$72,000 to $107,999 94 66.8% 178 97.6% 30 15.4% 83 50.0% 22 12.7%
$108,000 and over 94 50.0% 279 97.0% 45 15.7% 123 42.3% 35 12.0%
Not Stated 102 62.3% 184 93.9% 18 10.5% 87 49.0% 23 10.8%
Dietary Salt: Perceptions and Behavior
Income
Gender
Age
Race
Education
Think too much salt
can cause health
problems
Think it is
important to lower
salt in the diet
Always or often
consumes salty
processed food
Always or often
adds salt while
cooking
Always or often
adds salt before or
during eating
Health Survey of Adults in Bermuda 2014
18
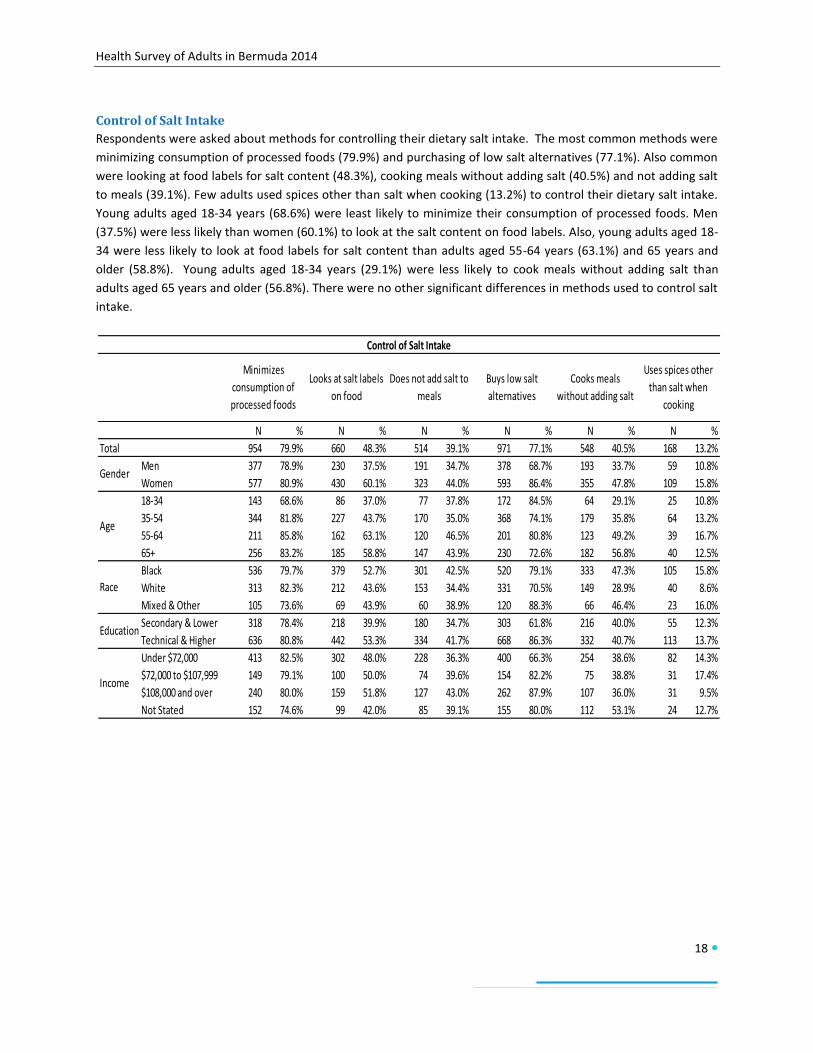
Control of Salt Intake
Respondents were asked about methods for controlling their dietary salt intake. The most common methods were
minimizing consumption of processed foods (79.9%) and purchasing of low salt alternatives (77.1%). Also common
were looking at food labels for salt content (48.3%), cooking meals without adding salt (40.5%) and not adding salt
to meals (39.1%). Few adults used spices other than salt when cooking (13.2%) to control their dietary salt intake.
Young adults aged 18-34 years (68.6%) were least likely to minimize their consumption of processed foods. Men
(37.5%) were less likely than women (60.1%) to look at the salt content on food labels. Also, young adults aged 18-
34 were less likely to look at food labels for salt content than adults aged 55-64 years (63.1%) and 65 years and
older (58.8%). Young adults aged 18-34 years (29.1%) were less likely to cook meals without adding salt than
adults aged 65 years and older (56.8%). There were no other significant differences in methods used to control salt
intake.
N % N % N % N % N % N %
Total 954 79.9% 660 48.3% 514 39.1% 971 77.1% 548 40.5% 168 13.2%
Men 377 78.9% 230 37.5% 191 34.7% 378 68.7% 193 33.7% 59 10.8%
Women 577 80.9% 430 60.1% 323 44.0% 593 86.4% 355 47.8% 109 15.8%
18-34 143 68.6% 86 37.0% 77 37.8% 172 84.5% 64 29.1% 25 10.8%
35-54 344 81.8% 227 43.7% 170 35.0% 368 74.1% 179 35.8% 64 13.2%
55-64 211 85.8% 162 63.1% 120 46.5% 201 80.8% 123 49.2% 39 16.7%
65+ 256 83.2% 185 58.8% 147 43.9% 230 72.6% 182 56.8% 40 12.5%
Black 536 79.7% 379 52.7% 301 42.5% 520 79.1% 333 47.3% 105 15.8%
White 313 82.3% 212 43.6% 153 34.4% 331 70.5% 149 28.9% 40 8.6%
Mixed & Other 105 73.6% 69 43.9% 60 38.9% 120 88.3% 66 46.4% 23 16.0%
Secondary & Lower 318 78.4% 218 39.9% 180 34.7% 303 61.8% 216 40.0% 55 12.3%
Technical & Higher 636 80.8% 442 53.3% 334 41.7% 668 86.3% 332 40.7% 113 13.7%
Under $72,000 413 82.5% 302 48.0% 228 36.3% 400 66.3% 254 38.6% 82 14.3%
$72,000 to $107,999 149 79.1% 100 50.0% 74 39.6% 154 82.2% 75 38.8% 31 17.4%
$108,000 and over 240 80.0% 159 51.8% 127 43.0% 262 87.9% 107 36.0% 31 9.5%
Not Stated 152 74.6% 99 42.0% 85 39.1% 155 80.0% 112 53.1% 24 12.7%
Control of Salt Intake
Minimizes
consumption of
processed foods
Looks at salt labels
on food
Does not add salt to
meals
Buys low salt
alternatives
Income
Cooks meals
without adding salt
Uses spices other
than salt when
cooking
Gender
Age
Race
Education
Health Survey of Adults in Bermuda 2014
19
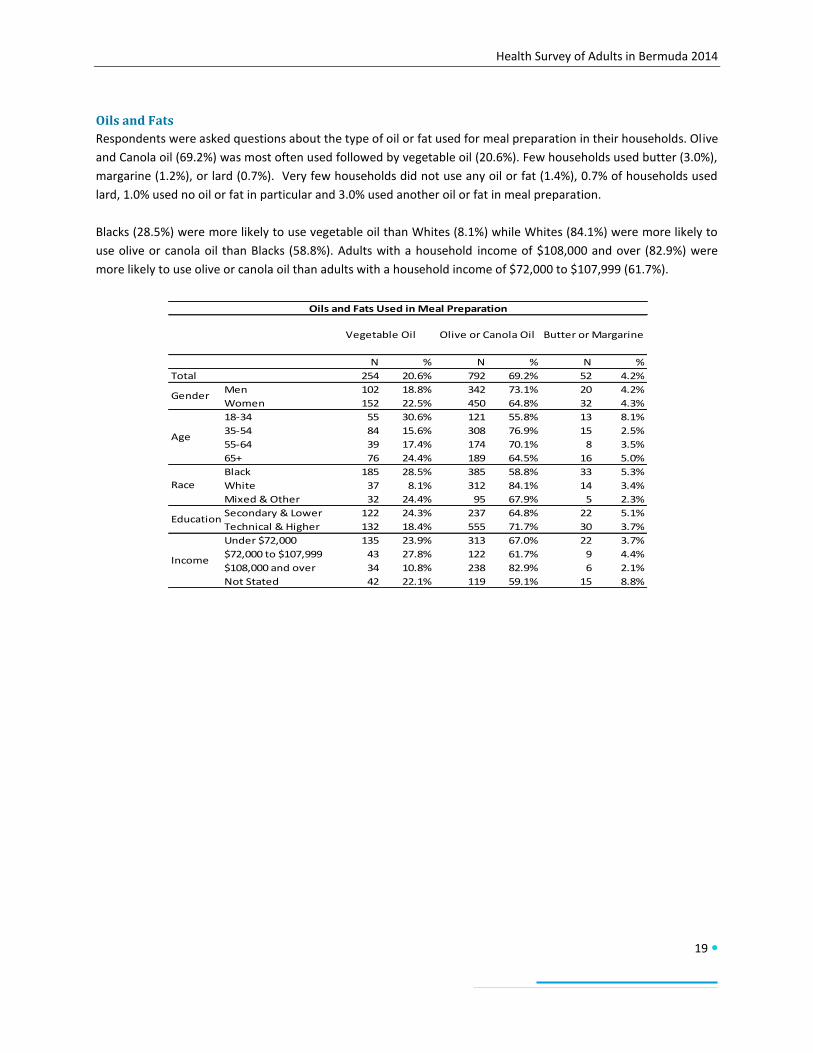
Oils and Fats
Respondents were asked questions about the type of oil or fat used for meal preparation in their households. Olive
and Canola oil (69.2%) was most often used followed by vegetable oil (20.6%). Few households used butter (3.0%),
margarine (1.2%), or lard (0.7%). Very few households did not use any oil or fat (1.4%), 0.7% of households used
lard, 1.0% used no oil or fat in particular and 3.0% used another oil or fat in meal preparation.
Blacks (28.5%) were more likely to use vegetable oil than Whites (8.1%) while Whites (84.1%) were more likely to
use olive or canola oil than Blacks (58.8%). Adults with a household income of $108,000 and over (82.9%) were
more likely to use olive or canola oil than adults with a household income of $72,000 to $107,999 (61.7%).
N % N % N %
Total 254 20.6% 792 69.2% 52 4.2%
Men 102 18.8% 342 73.1% 20 4.2%
Women 152 22.5% 450 64.8% 32 4.3%
18-34 55 30.6% 121 55.8% 13 8.1%
35-54 84 15.6% 308 76.9% 15 2.5%
55-64 39 17.4% 174 70.1% 8 3.5%
65+ 76 24.4% 189 64.5% 16 5.0%
Black 185 28.5% 385 58.8% 33 5.3%
White 37 8.1% 312 84.1% 14 3.4%
Mixed & Other 32 24.4% 95 67.9% 5 2.3%
Secondary & Lower 122 24.3% 237 64.8% 22 5.1%
Technical & Higher 132 18.4% 555 71.7% 30 3.7%
Under $72,000 135 23.9% 313 67.0% 22 3.7%
$72,000 to $107,999 43 27.8% 122 61.7% 9 4.4%
$108,000 and over 34 10.8% 238 82.9% 6 2.1%
Not Stated 42 22.1% 119 59.1% 15 8.8%
Gender
Age
Race
Education
Income
Oils and Fats Used in Meal Preparation
Vegetable Oil Olive or Canola Oil Butter or Margarine
Health Survey of Adults in Bermuda 2014
20
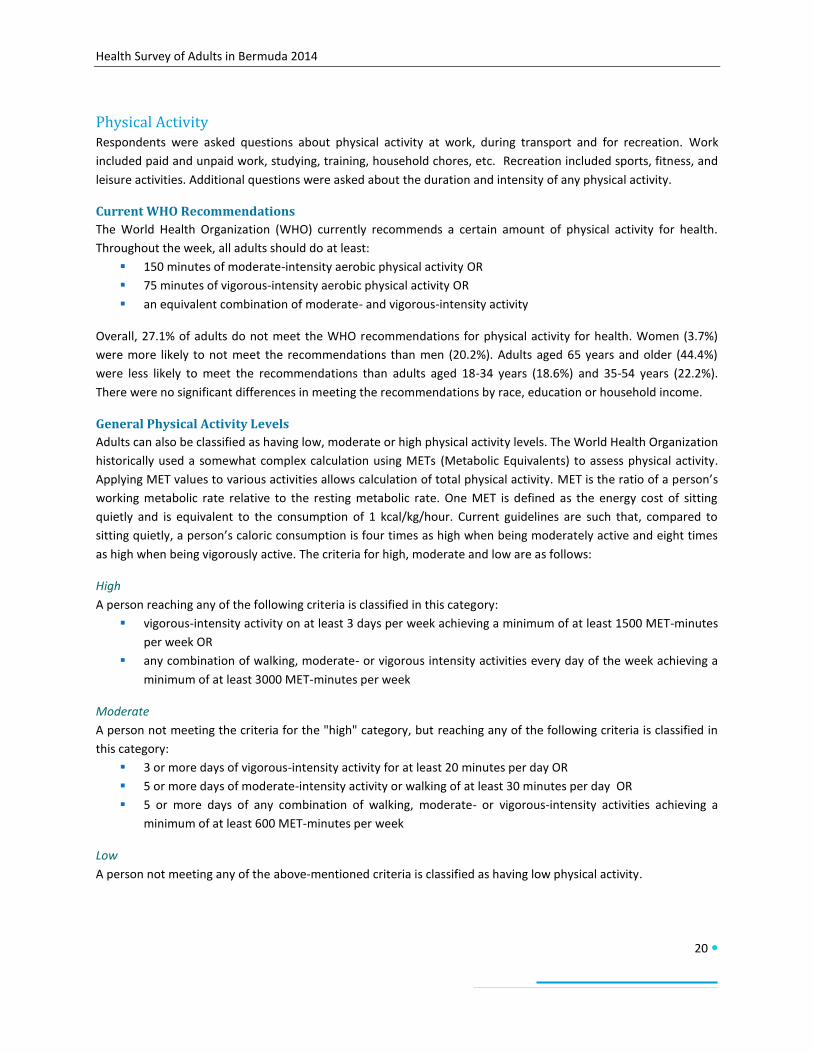
Physical Activity Respondents were asked questions about physical activity at work, during transport and for recreation. Work
included paid and unpaid work, studying, training, household chores, etc. Recreation included sports, fitness, and
leisure activities. Additional questions were asked about the duration and intensity of any physical activity.
Current WHO Recommendations
The World Health Organization (WHO) currently recommends a certain amount of physical activity for health.
Throughout the week, all adults should do at least:
150 minutes of moderate-intensity aerobic physical activity OR
75 minutes of vigorous-intensity aerobic physical activity OR
an equivalent combination of moderate- and vigorous-intensity activity
Overall, 27.1% of adults do not meet the WHO recommendations for physical activity for health. Women (3.7%)
were more likely to not meet the recommendations than men (20.2%). Adults aged 65 years and older (44.4%)
were less likely to meet the recommendations than adults aged 18-34 years (18.6%) and 35-54 years (22.2%).
There were no significant differences in meeting the recommendations by race, education or household income.
General Physical Activity Levels
Adults can also be classified as having low, moderate or high physical activity levels. The World Health Organization
historically used a somewhat complex calculation using METs (Metabolic Equivalents) to assess physical activity.
Applying MET values to various activities allows calculation of total physical activity. MET is the ratio of a person’s
working metabolic rate relative to the resting metabolic rate. One MET is defined as the energy cost of sitting
quietly and is equivalent to the consumption of 1 kcal/kg/hour. Current guidelines are such that, compared to
sitting quietly, a person’s caloric consumption is four times as high when being moderately active and eight times
as high when being vigorously active. The criteria for high, moderate and low are as follows:
High
A person reaching any of the following criteria is classified in this category:
vigorous-intensity activity on at least 3 days per week achieving a minimum of at least 1500 MET-minutes
per week OR
any combination of walking, moderate- or vigorous intensity activities every day of the week achieving a
minimum of at least 3000 MET-minutes per week
Moderate
A person not meeting the criteria for the "high" category, but reaching any of the following criteria is classified in
this category:
3 or more days of vigorous-intensity activity for at least 20 minutes per day OR
5 or more days of moderate-intensity activity or walking of at least 30 minutes per day OR
5 or more days of any combination of walking, moderate- or vigorous-intensity activities achieving a
minimum of at least 600 MET-minutes per week
Low
A person not meeting any of the above-mentioned criteria is classified as having low physical activity.
Health Survey of Adults in Bermuda 2014
21
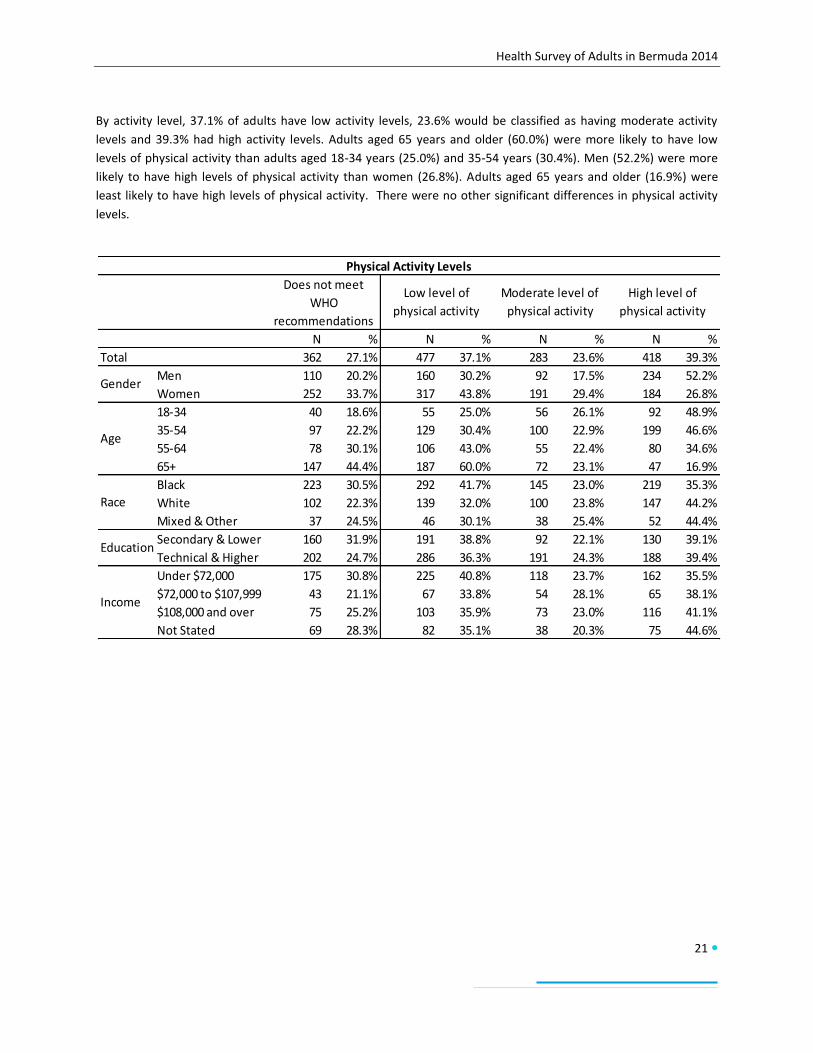
By activity level, 37.1% of adults have low activity levels, 23.6% would be classified as having moderate activity
levels and 39.3% had high activity levels. Adults aged 65 years and older (60.0%) were more likely to have low
levels of physical activity than adults aged 18-34 years (25.0%) and 35-54 years (30.4%). Men (52.2%) were more
likely to have high levels of physical activity than women (26.8%). Adults aged 65 years and older (16.9%) were
least likely to have high levels of physical activity. There were no other significant differences in physical activity
levels.
N % N % N % N %
Total 362 27.1% 477 37.1% 283 23.6% 418 39.3%
Men 110 20.2% 160 30.2% 92 17.5% 234 52.2%
Women 252 33.7% 317 43.8% 191 29.4% 184 26.8%
18-34 40 18.6% 55 25.0% 56 26.1% 92 48.9%
35-54 97 22.2% 129 30.4% 100 22.9% 199 46.6%
55-64 78 30.1% 106 43.0% 55 22.4% 80 34.6%
65+ 147 44.4% 187 60.0% 72 23.1% 47 16.9%
Black 223 30.5% 292 41.7% 145 23.0% 219 35.3%
White 102 22.3% 139 32.0% 100 23.8% 147 44.2%
Mixed & Other 37 24.5% 46 30.1% 38 25.4% 52 44.4%
Secondary & Lower 160 31.9% 191 38.8% 92 22.1% 130 39.1%
Technical & Higher 202 24.7% 286 36.3% 191 24.3% 188 39.4%
Under $72,000 175 30.8% 225 40.8% 118 23.7% 162 35.5%
$72,000 to $107,999 43 21.1% 67 33.8% 54 28.1% 65 38.1%
$108,000 and over 75 25.2% 103 35.9% 73 23.0% 116 41.1%
Not Stated 69 28.3% 82 35.1% 38 20.3% 75 44.6%
Does not meet
WHO
recommendations
Low level of
physical activity
Moderate level of
physical activity
High level of
physical activity
Physical Activity Levels
Gender
Age
Race
Education
Income
Health Survey of Adults in Bermuda 2014
22
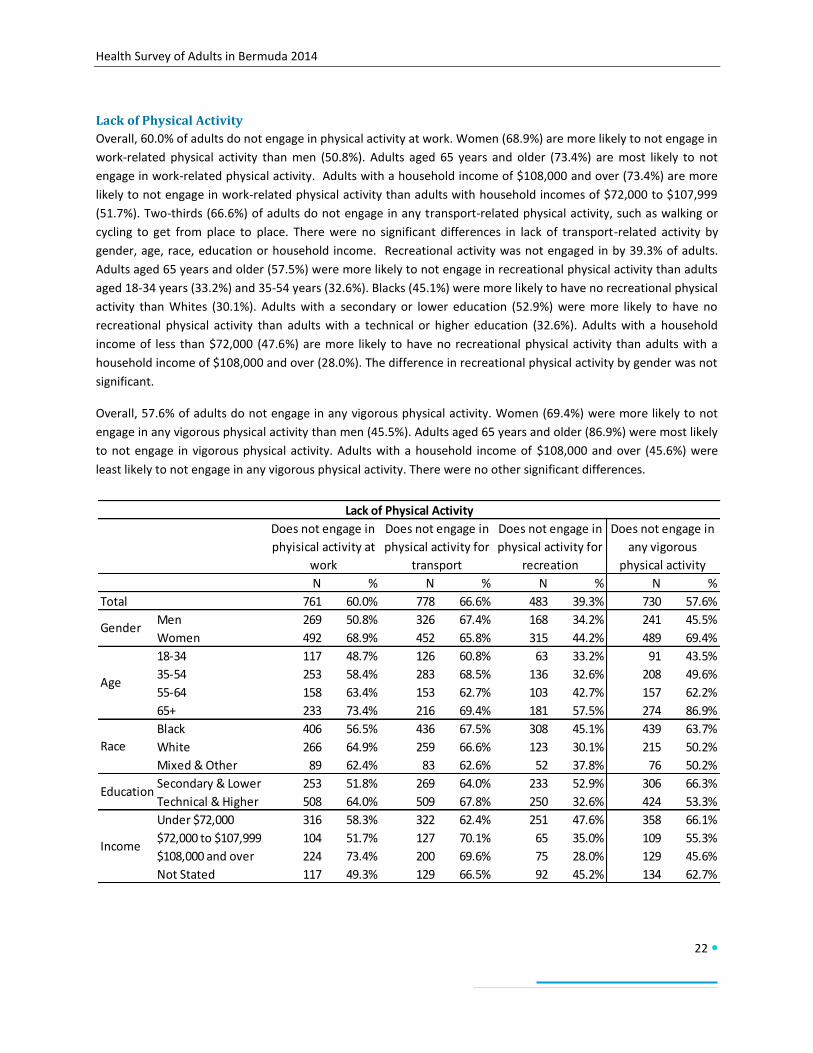
Lack of Physical Activity
Overall, 60.0% of adults do not engage in physical activity at work. Women (68.9%) are more likely to not engage in
work-related physical activity than men (50.8%). Adults aged 65 years and older (73.4%) are most likely to not
engage in work-related physical activity. Adults with a household income of $108,000 and over (73.4%) are more
likely to not engage in work-related physical activity than adults with household incomes of $72,000 to $107,999
(51.7%). Two-thirds (66.6%) of adults do not engage in any transport-related physical activity, such as walking or
cycling to get from place to place. There were no significant differences in lack of transport-related activity by
gender, age, race, education or household income. Recreational activity was not engaged in by 39.3% of adults.
Adults aged 65 years and older (57.5%) were more likely to not engage in recreational physical activity than adults
aged 18-34 years (33.2%) and 35-54 years (32.6%). Blacks (45.1%) were more likely to have no recreational physical
activity than Whites (30.1%). Adults with a secondary or lower education (52.9%) were more likely to have no
recreational physical activity than adults with a technical or higher education (32.6%). Adults with a household
income of less than $72,000 (47.6%) are more likely to have no recreational physical activity than adults with a
household income of $108,000 and over (28.0%). The difference in recreational physical activity by gender was not
significant.
Overall, 57.6% of adults do not engage in any vigorous physical activity. Women (69.4%) were more likely to not
engage in any vigorous physical activity than men (45.5%). Adults aged 65 years and older (86.9%) were most likely
to not engage in vigorous physical activity. Adults with a household income of $108,000 and over (45.6%) were
least likely to not engage in any vigorous physical activity. There were no other significant differences.
N % N % N % N %
Total 761 60.0% 778 66.6% 483 39.3% 730 57.6%
Men 269 50.8% 326 67.4% 168 34.2% 241 45.5%
Women 492 68.9% 452 65.8% 315 44.2% 489 69.4%
18-34 117 48.7% 126 60.8% 63 33.2% 91 43.5%
35-54 253 58.4% 283 68.5% 136 32.6% 208 49.6%
55-64 158 63.4% 153 62.7% 103 42.7% 157 62.2%
65+ 233 73.4% 216 69.4% 181 57.5% 274 86.9%
Black 406 56.5% 436 67.5% 308 45.1% 439 63.7%
White 266 64.9% 259 66.6% 123 30.1% 215 50.2%
Mixed & Other 89 62.4% 83 62.6% 52 37.8% 76 50.2%
Secondary & Lower 253 51.8% 269 64.0% 233 52.9% 306 66.3%
Technical & Higher 508 64.0% 509 67.8% 250 32.6% 424 53.3%
Under $72,000 316 58.3% 322 62.4% 251 47.6% 358 66.1%
$72,000 to $107,999 104 51.7% 127 70.1% 65 35.0% 109 55.3%
$108,000 and over 224 73.4% 200 69.6% 75 28.0% 129 45.6%
Not Stated 117 49.3% 129 66.5% 92 45.2% 134 62.7%
Gender
Age
Race
Education
Income
Does not engage in
phyisical activity at
work
Does not engage in
physical activity for
transport
Does not engage in
physical activity for
recreation
Lack of Physical Activity
Does not engage in
any vigorous
physical activity
Health Survey of Adults in Bermuda 2014
23
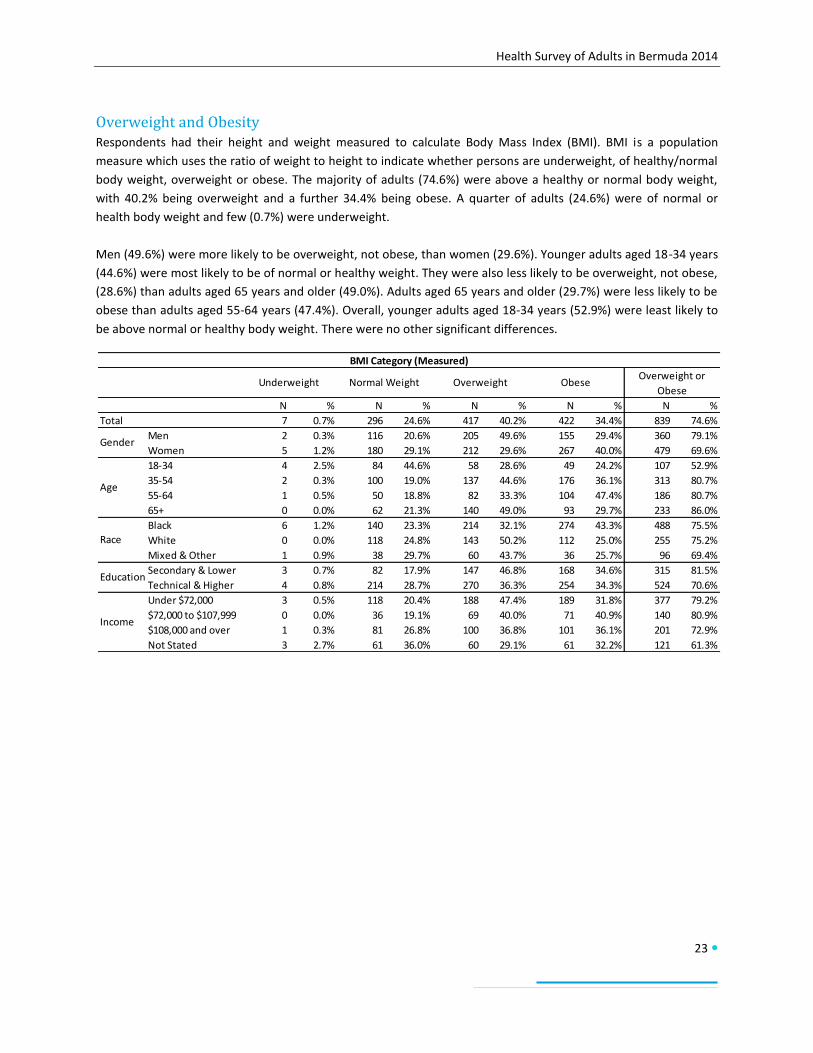
Overweight and Obesity Respondents had their height and weight measured to calculate Body Mass Index (BMI). BMI is a population
measure which uses the ratio of weight to height to indicate whether persons are underweight, of healthy/normal
body weight, overweight or obese. The majority of adults (74.6%) were above a healthy or normal body weight,
with 40.2% being overweight and a further 34.4% being obese. A quarter of adults (24.6%) were of normal or
health body weight and few (0.7%) were underweight.
Men (49.6%) were more likely to be overweight, not obese, than women (29.6%). Younger adults aged 18-34 years
(44.6%) were most likely to be of normal or healthy weight. They were also less likely to be overweight, not obese,
(28.6%) than adults aged 65 years and older (49.0%). Adults aged 65 years and older (29.7%) were less likely to be
obese than adults aged 55-64 years (47.4%). Overall, younger adults aged 18-34 years (52.9%) were least likely to
be above normal or healthy body weight. There were no other significant differences.
N % N % N % N % N %
Total 7 0.7% 296 24.6% 417 40.2% 422 34.4% 839 74.6%
Men 2 0.3% 116 20.6% 205 49.6% 155 29.4% 360 79.1%
Women 5 1.2% 180 29.1% 212 29.6% 267 40.0% 479 69.6%
18-34 4 2.5% 84 44.6% 58 28.6% 49 24.2% 107 52.9%
35-54 2 0.3% 100 19.0% 137 44.6% 176 36.1% 313 80.7%
55-64 1 0.5% 50 18.8% 82 33.3% 104 47.4% 186 80.7%
65+ 0 0.0% 62 21.3% 140 49.0% 93 29.7% 233 86.0%
Black 6 1.2% 140 23.3% 214 32.1% 274 43.3% 488 75.5%
White 0 0.0% 118 24.8% 143 50.2% 112 25.0% 255 75.2%
Mixed & Other 1 0.9% 38 29.7% 60 43.7% 36 25.7% 96 69.4%
Secondary & Lower 3 0.7% 82 17.9% 147 46.8% 168 34.6% 315 81.5%
Technical & Higher 4 0.8% 214 28.7% 270 36.3% 254 34.3% 524 70.6%
Under $72,000 3 0.5% 118 20.4% 188 47.4% 189 31.8% 377 79.2%
$72,000 to $107,999 0 0.0% 36 19.1% 69 40.0% 71 40.9% 140 80.9%
$108,000 and over 1 0.3% 81 26.8% 100 36.8% 101 36.1% 201 72.9%
Not Stated 3 2.7% 61 36.0% 60 29.1% 61 32.2% 121 61.3%
Underweight Normal Weight Overweight Obese
BMI Category (Measured)
Overweight or
Obese
Gender
Age
Race
Education
Income
Health Survey of Adults in Bermuda 2014
24
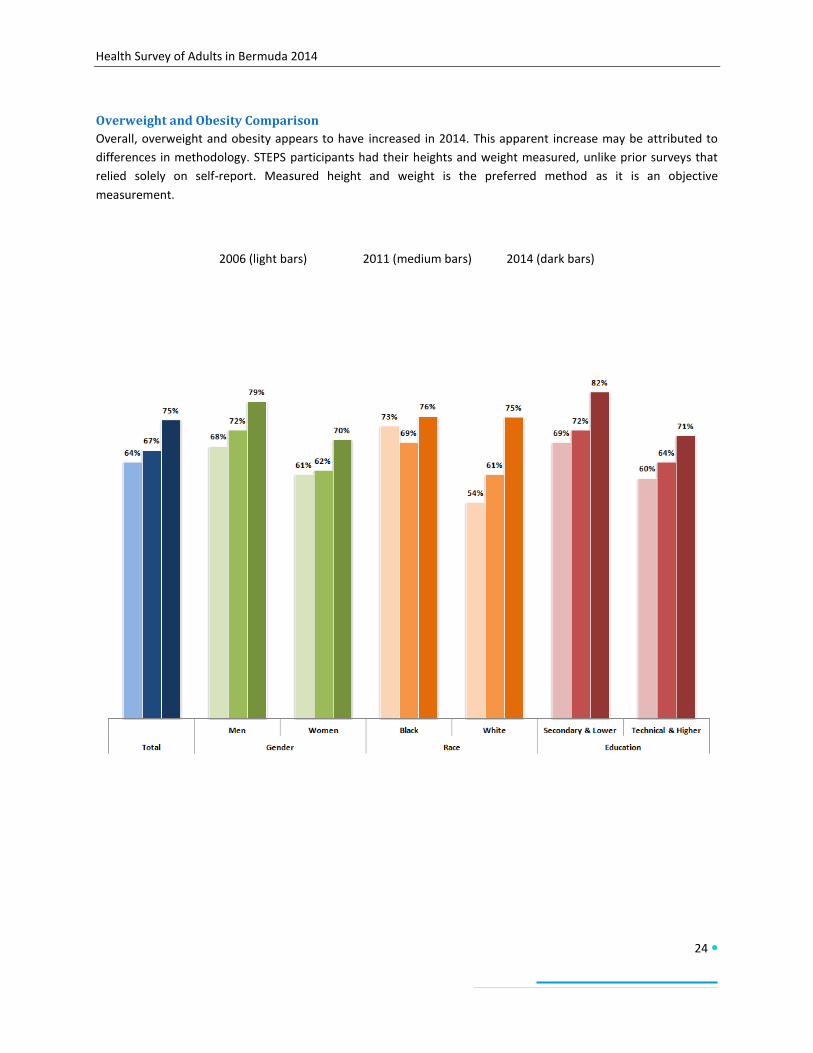
Overweight and Obesity Comparison
Overall, overweight and obesity appears to have increased in 2014. This apparent increase may be attributed to
differences in methodology. STEPS participants had their heights and weight measured, unlike prior surveys that
relied solely on self-report. Measured height and weight is the preferred method as it is an objective
measurement.
2006 (light bars) 2011 (medium bars) 2014 (dark bars)
Health Survey of Adults in Bermuda 2014
25
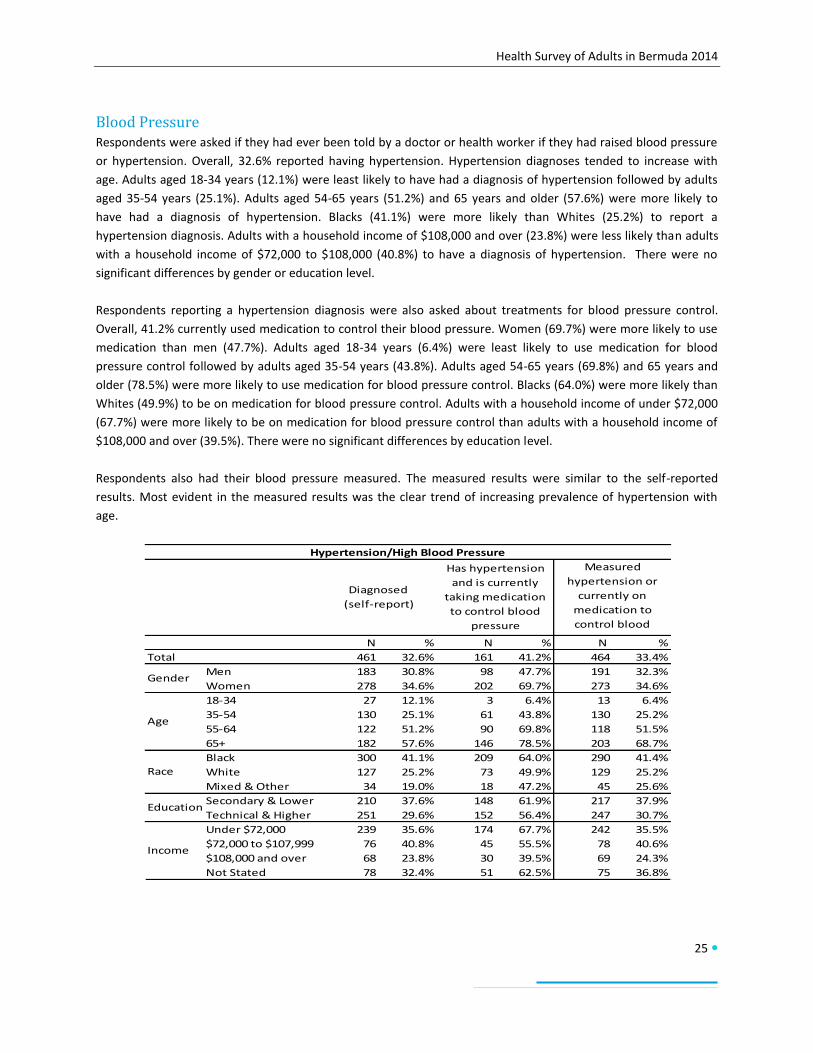
Blood Pressure Respondents were asked if they had ever been told by a doctor or health worker if they had raised blood pressure
or hypertension. Overall, 32.6% reported having hypertension. Hypertension diagnoses tended to increase with
age. Adults aged 18-34 years (12.1%) were least likely to have had a diagnosis of hypertension followed by adults
aged 35-54 years (25.1%). Adults aged 54-65 years (51.2%) and 65 years and older (57.6%) were more likely to
have had a diagnosis of hypertension. Blacks (41.1%) were more likely than Whites (25.2%) to report a
hypertension diagnosis. Adults with a household income of $108,000 and over (23.8%) were less likely than adults
with a household income of $72,000 to $108,000 (40.8%) to have a diagnosis of hypertension. There were no
significant differences by gender or education level.
Respondents reporting a hypertension diagnosis were also asked about treatments for blood pressure control.
Overall, 41.2% currently used medication to control their blood pressure. Women (69.7%) were more likely to use
medication than men (47.7%). Adults aged 18-34 years (6.4%) were least likely to use medication for blood
pressure control followed by adults aged 35-54 years (43.8%). Adults aged 54-65 years (69.8%) and 65 years and
older (78.5%) were more likely to use medication for blood pressure control. Blacks (64.0%) were more likely than
Whites (49.9%) to be on medication for blood pressure control. Adults with a household income of under $72,000
(67.7%) were more likely to be on medication for blood pressure control than adults with a household income of
$108,000 and over (39.5%). There were no significant differences by education level.
Respondents also had their blood pressure measured. The measured results were similar to the self-reported
results. Most evident in the measured results was the clear trend of increasing prevalence of hypertension with
age.
N % N % N %
Total 461 32.6% 161 41.2% 464 33.4%
Men 183 30.8% 98 47.7% 191 32.3%
Women 278 34.6% 202 69.7% 273 34.6%
18-34 27 12.1% 3 6.4% 13 6.4%
35-54 130 25.1% 61 43.8% 130 25.2%
55-64 122 51.2% 90 69.8% 118 51.5%
65+ 182 57.6% 146 78.5% 203 68.7%
Black 300 41.1% 209 64.0% 290 41.4%
White 127 25.2% 73 49.9% 129 25.2%
Mixed & Other 34 19.0% 18 47.2% 45 25.6%
Secondary & Lower 210 37.6% 148 61.9% 217 37.9%
Technical & Higher 251 29.6% 152 56.4% 247 30.7%
Under $72,000 239 35.6% 174 67.7% 242 35.5%
$72,000 to $107,999 76 40.8% 45 55.5% 78 40.6%
$108,000 and over 68 23.8% 30 39.5% 69 24.3%
Not Stated 78 32.4% 51 62.5% 75 36.8%
Hypertension/High Blood Pressure
Diagnosed
(self-report)
Measured
hypertension or
currently on
medication to
control blood
pressure
Has hypertension
and is currently
taking medication
to control blood
pressure
Gender
Age
Race
Education
Income
Health Survey of Adults in Bermuda 2014
26
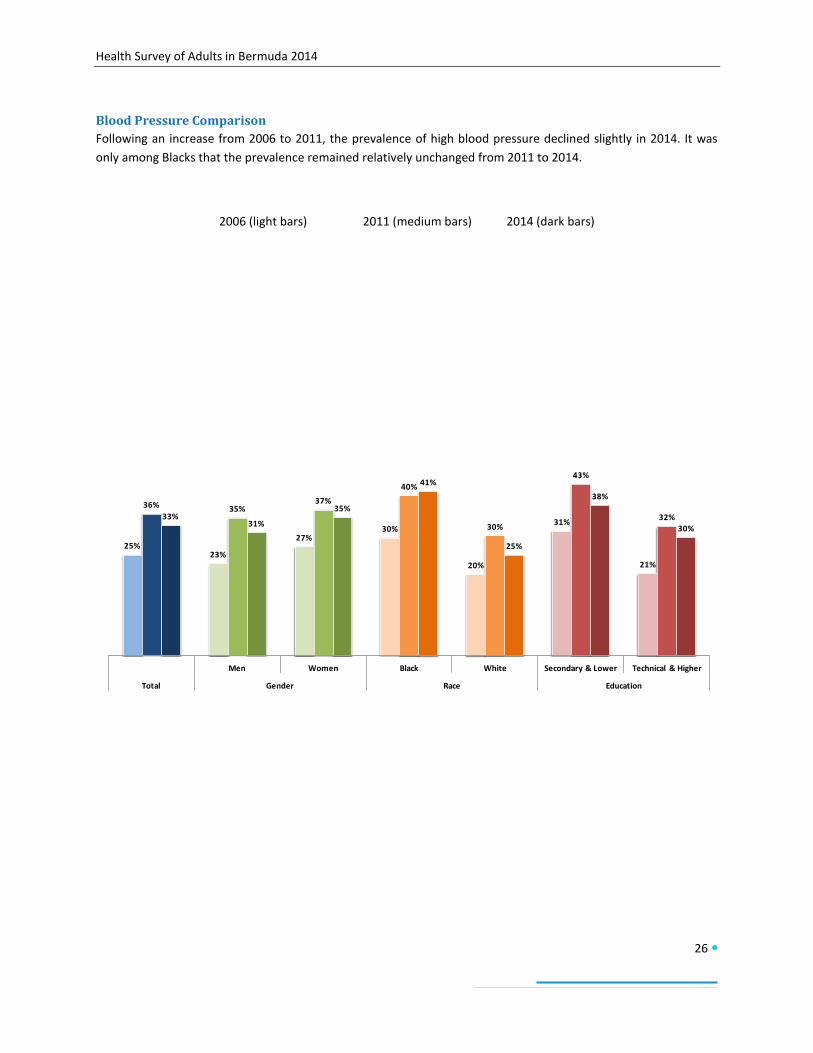
Blood Pressure Comparison
Following an increase from 2006 to 2011, the prevalence of high blood pressure declined slightly in 2014. It was
only among Blacks that the prevalence remained relatively unchanged from 2011 to 2014.
2006 (light bars) 2011 (medium bars) 2014 (dark bars)
25%23%
27%30%
20%
31%
21%
36% 35%37%
40%
30%
43%
32%33%31%
35%
41%
25%
38%
30%
Men Women Black White Secondary & Lower Technical & Higher
Total Gender Race Education
Health Survey of Adults in Bermuda 2014
27
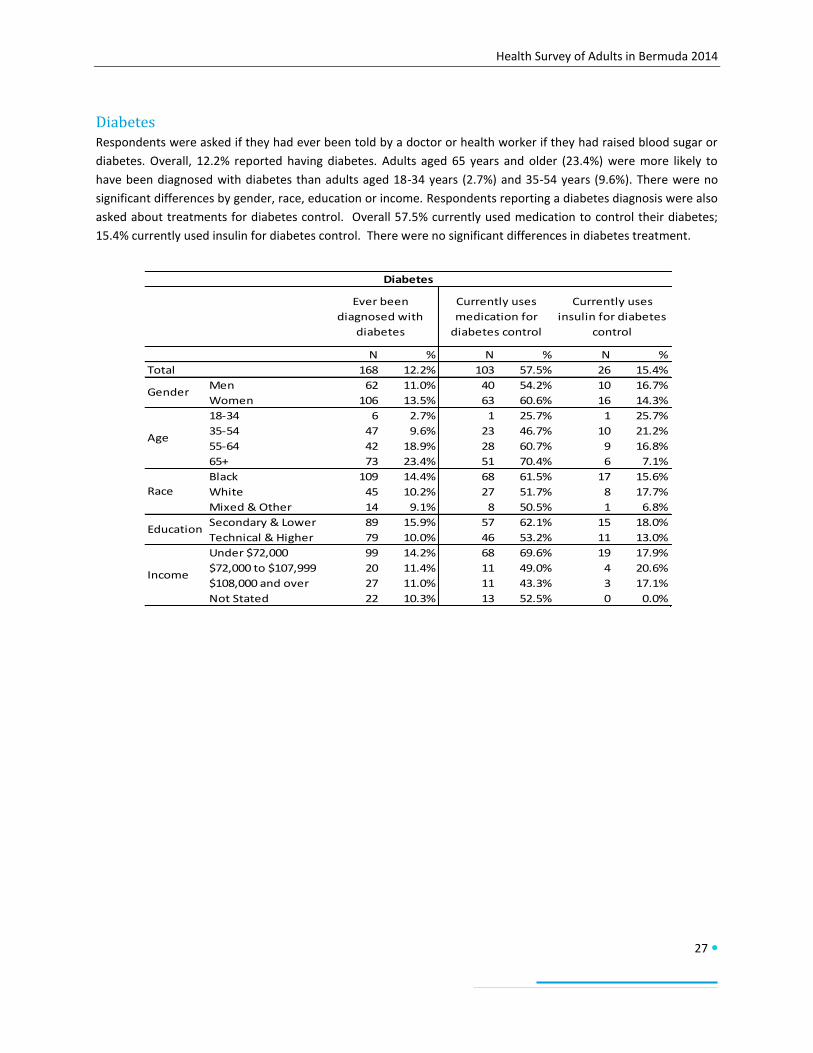
Diabetes Respondents were asked if they had ever been told by a doctor or health worker if they had raised blood sugar or
diabetes. Overall, 12.2% reported having diabetes. Adults aged 65 years and older (23.4%) were more likely to
have been diagnosed with diabetes than adults aged 18-34 years (2.7%) and 35-54 years (9.6%). There were no
significant differences by gender, race, education or income. Respondents reporting a diabetes diagnosis were also
asked about treatments for diabetes control. Overall 57.5% currently used medication to control their diabetes;
15.4% currently used insulin for diabetes control. There were no significant differences in diabetes treatment.
N % N % N %
Total 168 12.2% 103 57.5% 26 15.4%
Men 62 11.0% 40 54.2% 10 16.7%
Women 106 13.5% 63 60.6% 16 14.3%
18-34 6 2.7% 1 25.7% 1 25.7%
35-54 47 9.6% 23 46.7% 10 21.2%
55-64 42 18.9% 28 60.7% 9 16.8%
65+ 73 23.4% 51 70.4% 6 7.1%
Black 109 14.4% 68 61.5% 17 15.6%
White 45 10.2% 27 51.7% 8 17.7%
Mixed & Other 14 9.1% 8 50.5% 1 6.8%
Secondary & Lower 89 15.9% 57 62.1% 15 18.0%
Technical & Higher 79 10.0% 46 53.2% 11 13.0%
Under $72,000 99 14.2% 68 69.6% 19 17.9%
$72,000 to $107,999 20 11.4% 11 49.0% 4 20.6%
$108,000 and over 27 11.0% 11 43.3% 3 17.1%
Not Stated 22 10.3% 13 52.5% 0 0.0%
Gender
Age
Race
Education
Income
Diabetes
Ever been
diagnosed with
diabetes
Currently uses
medication for
diabetes control
Currently uses
insulin for diabetes
control
Health Survey of Adults in Bermuda 2014
28
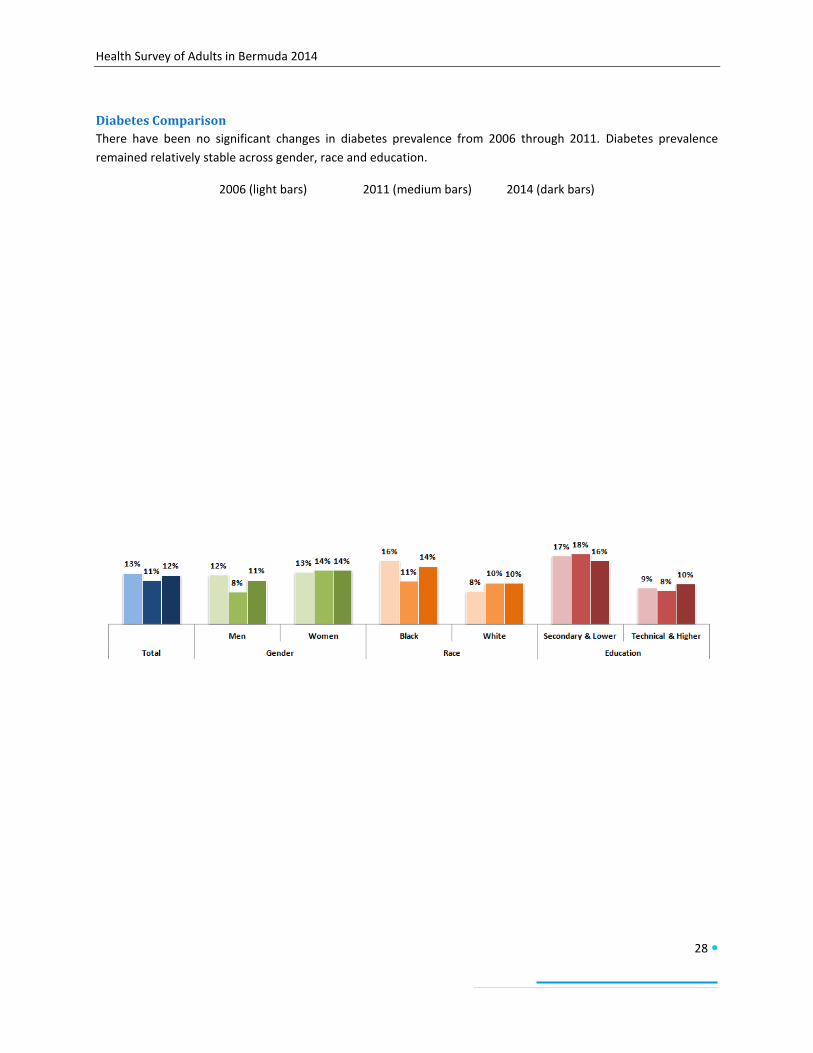
Diabetes Comparison
There have been no significant changes in diabetes prevalence from 2006 through 2011. Diabetes prevalence
remained relatively stable across gender, race and education.
2006 (light bars) 2011 (medium bars) 2014 (dark bars)
Health Survey of Adults in Bermuda 2014
29
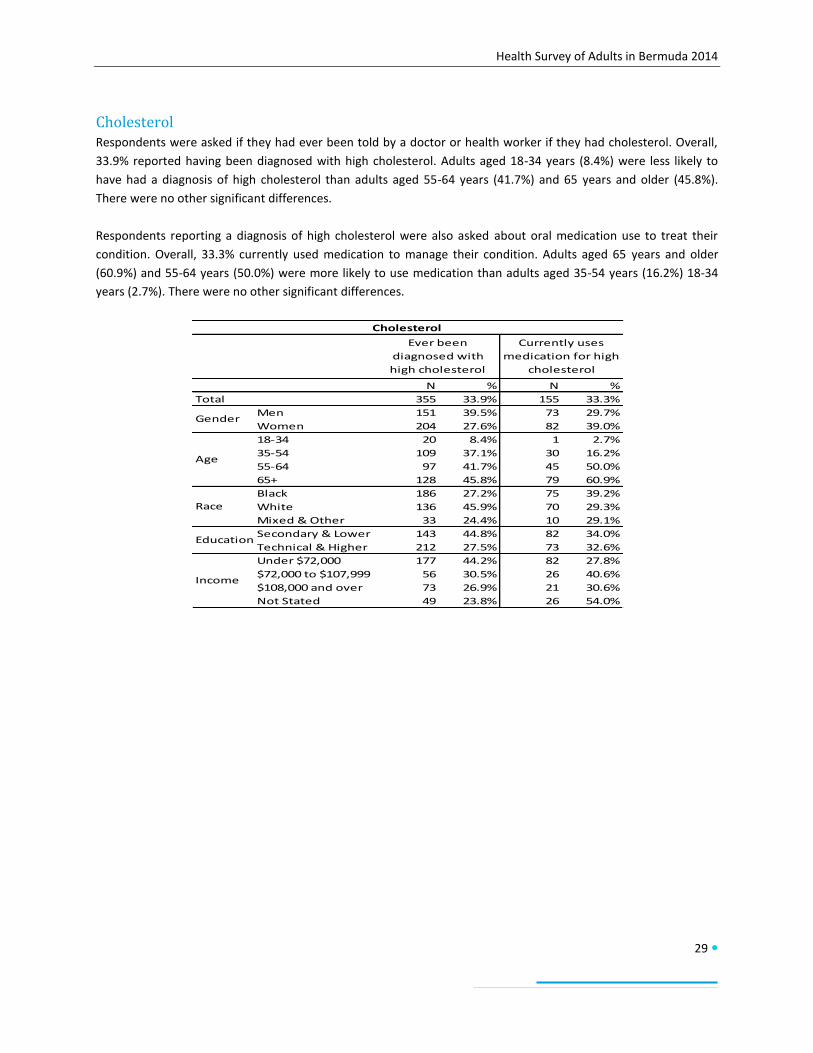
Cholesterol Respondents were asked if they had ever been told by a doctor or health worker if they had cholesterol. Overall,
33.9% reported having been diagnosed with high cholesterol. Adults aged 18-34 years (8.4%) were less likely to
have had a diagnosis of high cholesterol than adults aged 55-64 years (41.7%) and 65 years and older (45.8%).
There were no other significant differences.
Respondents reporting a diagnosis of high cholesterol were also asked about oral medication use to treat their
condition. Overall, 33.3% currently used medication to manage their condition. Adults aged 65 years and older
(60.9%) and 55-64 years (50.0%) were more likely to use medication than adults aged 35-54 years (16.2%) 18-34
years (2.7%). There were no other significant differences.
N % N %
Total 355 33.9% 155 33.3%
Men 151 39.5% 73 29.7%
Women 204 27.6% 82 39.0%
18-34 20 8.4% 1 2.7%
35-54 109 37.1% 30 16.2%
55-64 97 41.7% 45 50.0%
65+ 128 45.8% 79 60.9%
Black 186 27.2% 75 39.2%
White 136 45.9% 70 29.3%
Mixed & Other 33 24.4% 10 29.1%
Secondary & Lower 143 44.8% 82 34.0%
Technical & Higher 212 27.5% 73 32.6%
Under $72,000 177 44.2% 82 27.8%
$72,000 to $107,999 56 30.5% 26 40.6%
$108,000 and over 73 26.9% 21 30.6%
Not Stated 49 23.8% 26 54.0%
Cholesterol
Ever been
diagnosed with
high cholesterol
Currently uses
medication for high
cholesterol
Gender
Age
Race
Education
Income
Health Survey of Adults in Bermuda 2014
30
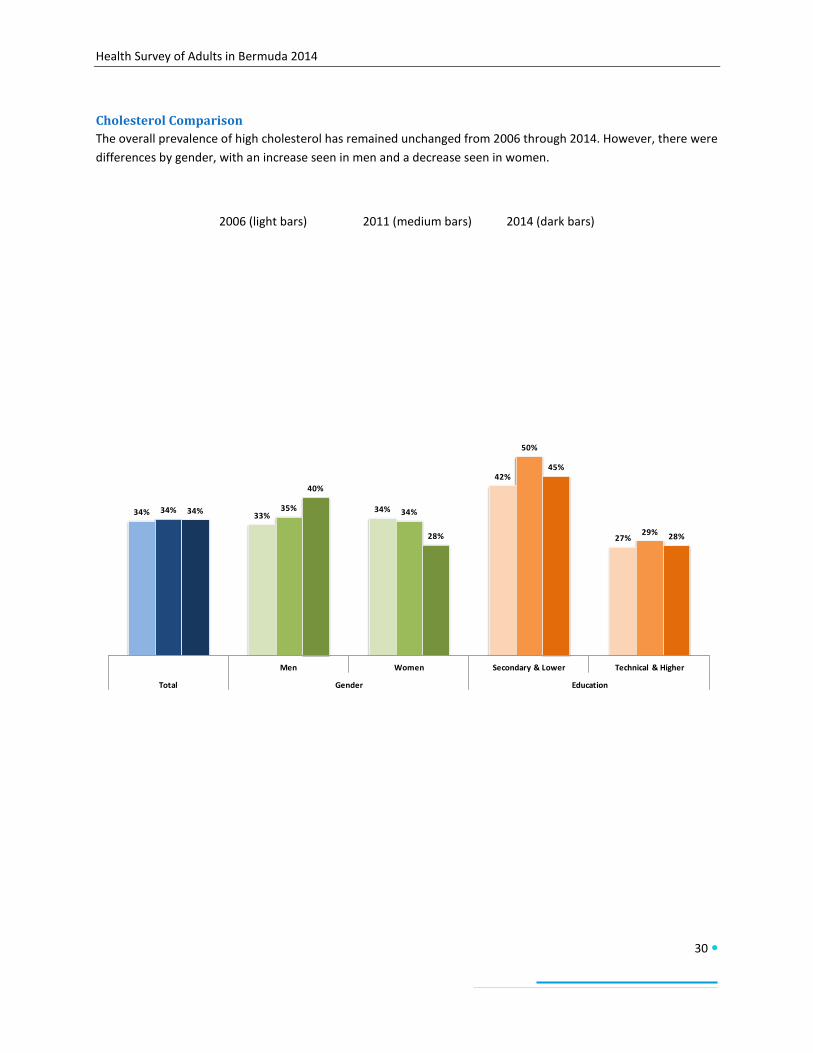
Cholesterol Comparison
The overall prevalence of high cholesterol has remained unchanged from 2006 through 2014. However, there were
differences by gender, with an increase seen in men and a decrease seen in women.
2006 (light bars) 2011 (medium bars) 2014 (dark bars)
34% 33%34%
42%
27%
34% 35% 34%
50%
29%
34%
40%
28%
45%
28%
Men Women Secondary & Lower Technical & Higher
Total Gender Education
Health Survey of Adults in Bermuda 2014
31
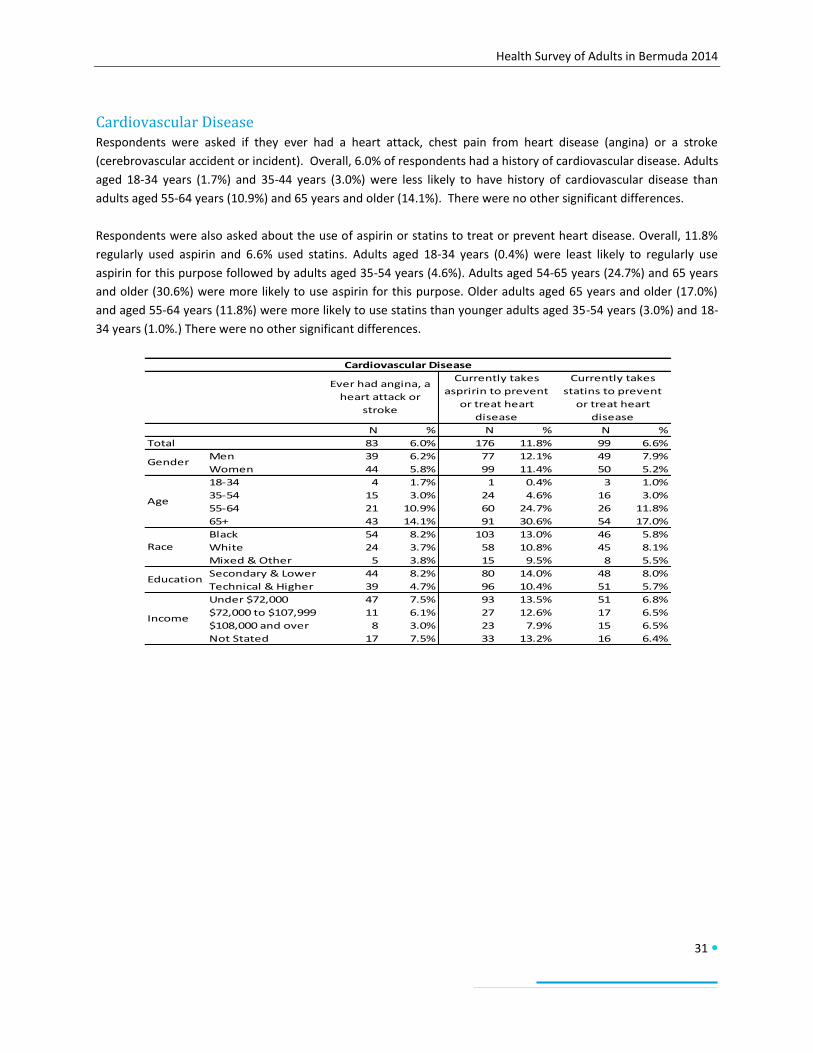
Cardiovascular Disease Respondents were asked if they ever had a heart attack, chest pain from heart disease (angina) or a stroke
(cerebrovascular accident or incident). Overall, 6.0% of respondents had a history of cardiovascular disease. Adults
aged 18-34 years (1.7%) and 35-44 years (3.0%) were less likely to have history of cardiovascular disease than
adults aged 55-64 years (10.9%) and 65 years and older (14.1%). There were no other significant differences.
Respondents were also asked about the use of aspirin or statins to treat or prevent heart disease. Overall, 11.8%
regularly used aspirin and 6.6% used statins. Adults aged 18-34 years (0.4%) were least likely to regularly use
aspirin for this purpose followed by adults aged 35-54 years (4.6%). Adults aged 54-65 years (24.7%) and 65 years
and older (30.6%) were more likely to use aspirin for this purpose. Older adults aged 65 years and older (17.0%)
and aged 55-64 years (11.8%) were more likely to use statins than younger adults aged 35-54 years (3.0%) and 18-
34 years (1.0%.) There were no other significant differences.
N % N % N %
Total 83 6.0% 176 11.8% 99 6.6%
Men 39 6.2% 77 12.1% 49 7.9%
Women 44 5.8% 99 11.4% 50 5.2%
18-34 4 1.7% 1 0.4% 3 1.0%
35-54 15 3.0% 24 4.6% 16 3.0%
55-64 21 10.9% 60 24.7% 26 11.8%
65+ 43 14.1% 91 30.6% 54 17.0%
Black 54 8.2% 103 13.0% 46 5.8%
White 24 3.7% 58 10.8% 45 8.1%
Mixed & Other 5 3.8% 15 9.5% 8 5.5%
Secondary & Lower 44 8.2% 80 14.0% 48 8.0%
Technical & Higher 39 4.7% 96 10.4% 51 5.7%
Under $72,000 47 7.5% 93 13.5% 51 6.8%
$72,000 to $107,999 11 6.1% 27 12.6% 17 6.5%
$108,000 and over 8 3.0% 23 7.9% 15 6.5%
Not Stated 17 7.5% 33 13.2% 16 6.4%
Race
Education
Income
Cardiovascular Disease
Ever had angina, a
heart attack or
stroke
Currently takes
aspririn to prevent
or treat heart
disease
Currently takes
statins to prevent
or treat heart
disease
Gender
Age
Health Survey of Adults in Bermuda 2014
32
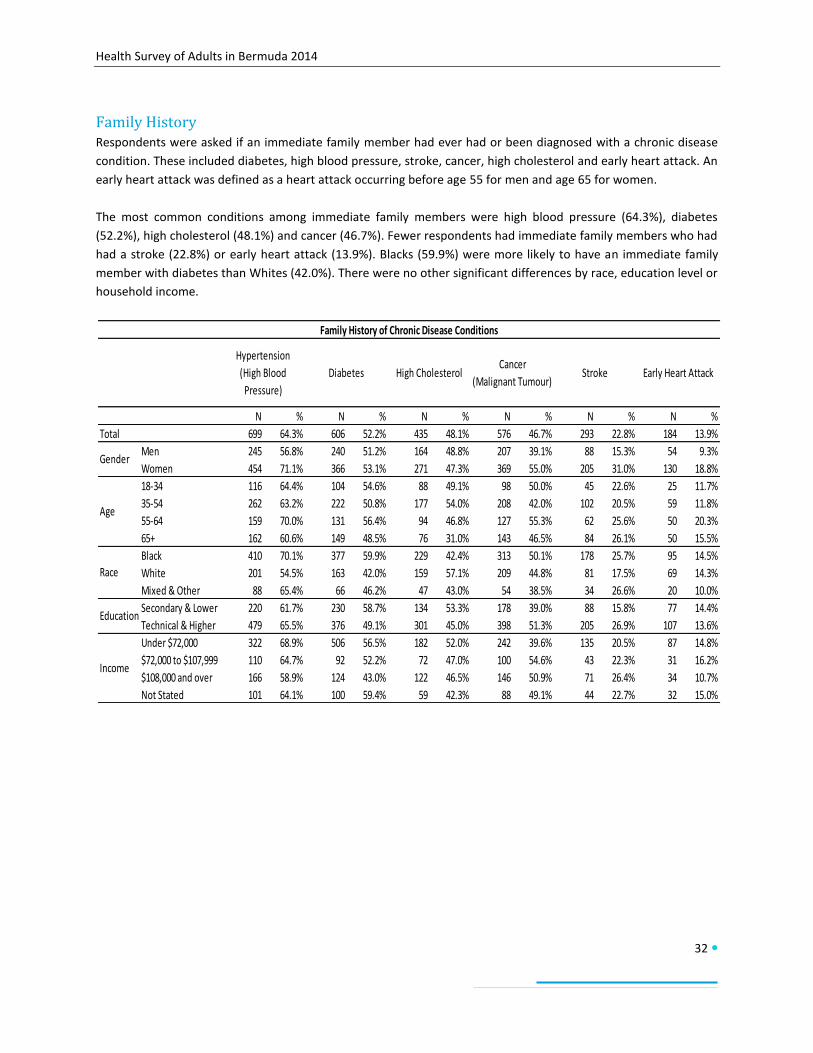
Family History Respondents were asked if an immediate family member had ever had or been diagnosed with a chronic disease
condition. These included diabetes, high blood pressure, stroke, cancer, high cholesterol and early heart attack. An
early heart attack was defined as a heart attack occurring before age 55 for men and age 65 for women.
The most common conditions among immediate family members were high blood pressure (64.3%), diabetes
(52.2%), high cholesterol (48.1%) and cancer (46.7%). Fewer respondents had immediate family members who had
had a stroke (22.8%) or early heart attack (13.9%). Blacks (59.9%) were more likely to have an immediate family
member with diabetes than Whites (42.0%). There were no other significant differences by race, education level or
household income.
N % N % N % N % N % N %
Total 699 64.3% 606 52.2% 435 48.1% 576 46.7% 293 22.8% 184 13.9%
Men 245 56.8% 240 51.2% 164 48.8% 207 39.1% 88 15.3% 54 9.3%
Women 454 71.1% 366 53.1% 271 47.3% 369 55.0% 205 31.0% 130 18.8%
18-34 116 64.4% 104 54.6% 88 49.1% 98 50.0% 45 22.6% 25 11.7%
35-54 262 63.2% 222 50.8% 177 54.0% 208 42.0% 102 20.5% 59 11.8%
55-64 159 70.0% 131 56.4% 94 46.8% 127 55.3% 62 25.6% 50 20.3%
65+ 162 60.6% 149 48.5% 76 31.0% 143 46.5% 84 26.1% 50 15.5%
Black 410 70.1% 377 59.9% 229 42.4% 313 50.1% 178 25.7% 95 14.5%
White 201 54.5% 163 42.0% 159 57.1% 209 44.8% 81 17.5% 69 14.3%
Mixed & Other 88 65.4% 66 46.2% 47 43.0% 54 38.5% 34 26.6% 20 10.0%
Secondary & Lower 220 61.7% 230 58.7% 134 53.3% 178 39.0% 88 15.8% 77 14.4%
Technical & Higher 479 65.5% 376 49.1% 301 45.0% 398 51.3% 205 26.9% 107 13.6%
Under $72,000 322 68.9% 506 56.5% 182 52.0% 242 39.6% 135 20.5% 87 14.8%
$72,000 to $107,999 110 64.7% 92 52.2% 72 47.0% 100 54.6% 43 22.3% 31 16.2%
$108,000 and over 166 58.9% 124 43.0% 122 46.5% 146 50.9% 71 26.4% 34 10.7%
Not Stated 101 64.1% 100 59.4% 59 42.3% 88 49.1% 44 22.7% 32 15.0%
Stroke
Family History of Chronic Disease Conditions
Hypertension
(High Blood
Pressure)
Diabetes High CholesterolCancer
(Malignant Tumour)Early Heart Attack
Gender
Age
Race
Education
Income
Health Survey of Adults in Bermuda 2014
33
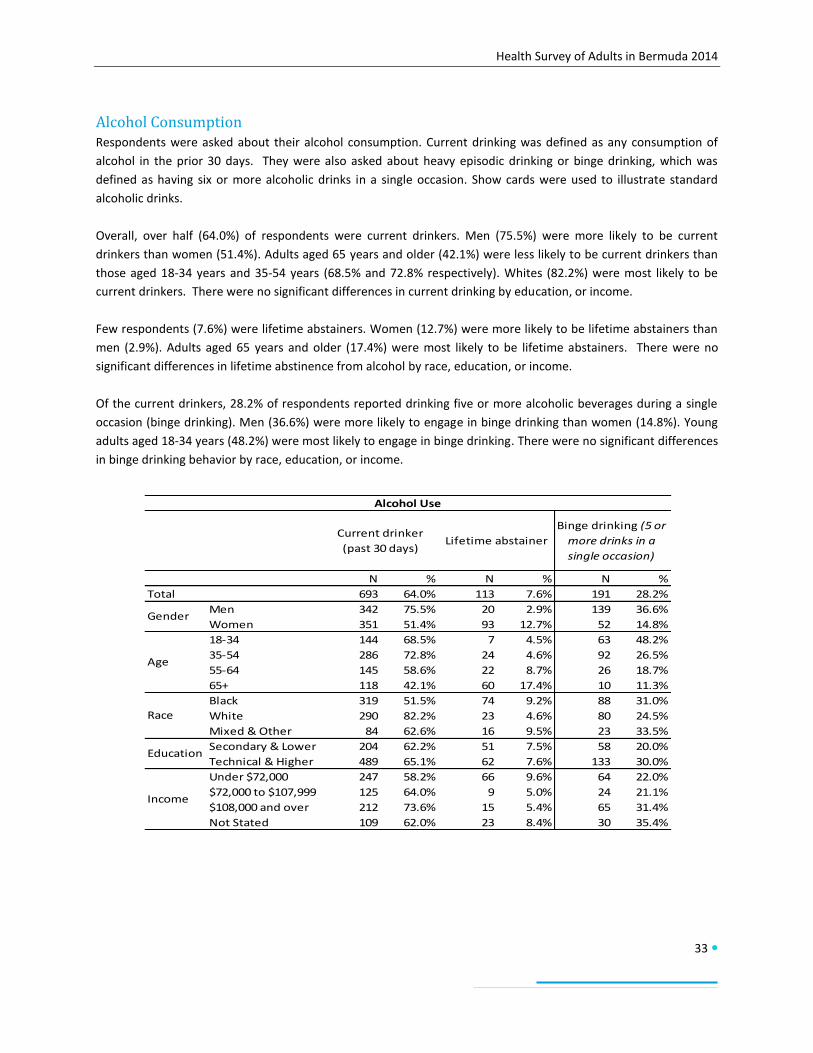
Alcohol Consumption Respondents were asked about their alcohol consumption. Current drinking was defined as any consumption of
alcohol in the prior 30 days. They were also asked about heavy episodic drinking or binge drinking, which was
defined as having six or more alcoholic drinks in a single occasion. Show cards were used to illustrate standard
alcoholic drinks.
Overall, over half (64.0%) of respondents were current drinkers. Men (75.5%) were more likely to be current
drinkers than women (51.4%). Adults aged 65 years and older (42.1%) were less likely to be current drinkers than
those aged 18-34 years and 35-54 years (68.5% and 72.8% respectively). Whites (82.2%) were most likely to be
current drinkers. There were no significant differences in current drinking by education, or income.
Few respondents (7.6%) were lifetime abstainers. Women (12.7%) were more likely to be lifetime abstainers than
men (2.9%). Adults aged 65 years and older (17.4%) were most likely to be lifetime abstainers. There were no
significant differences in lifetime abstinence from alcohol by race, education, or income.
Of the current drinkers, 28.2% of respondents reported drinking five or more alcoholic beverages during a single
occasion (binge drinking). Men (36.6%) were more likely to engage in binge drinking than women (14.8%). Young
adults aged 18-34 years (48.2%) were most likely to engage in binge drinking. There were no significant differences
in binge drinking behavior by race, education, or income.
N % N % N %
Total 693 64.0% 113 7.6% 191 28.2%
Men 342 75.5% 20 2.9% 139 36.6%
Women 351 51.4% 93 12.7% 52 14.8%
18-34 144 68.5% 7 4.5% 63 48.2%
35-54 286 72.8% 24 4.6% 92 26.5%
55-64 145 58.6% 22 8.7% 26 18.7%
65+ 118 42.1% 60 17.4% 10 11.3%
Black 319 51.5% 74 9.2% 88 31.0%
White 290 82.2% 23 4.6% 80 24.5%
Mixed & Other 84 62.6% 16 9.5% 23 33.5%
Secondary & Lower 204 62.2% 51 7.5% 58 20.0%
Technical & Higher 489 65.1% 62 7.6% 133 30.0%
Under $72,000 247 58.2% 66 9.6% 64 22.0%
$72,000 to $107,999 125 64.0% 9 5.0% 24 21.1%
$108,000 and over 212 73.6% 15 5.4% 65 31.4%
Not Stated 109 62.0% 23 8.4% 30 35.4%
Binge drinking (5 or
more drinks in a
single occasion)
Alcohol Use
Income
Lifetime abstainer
Gender
Age
Race
Education
Current drinker
(past 30 days)
Health Survey of Adults in Bermuda 2014
34
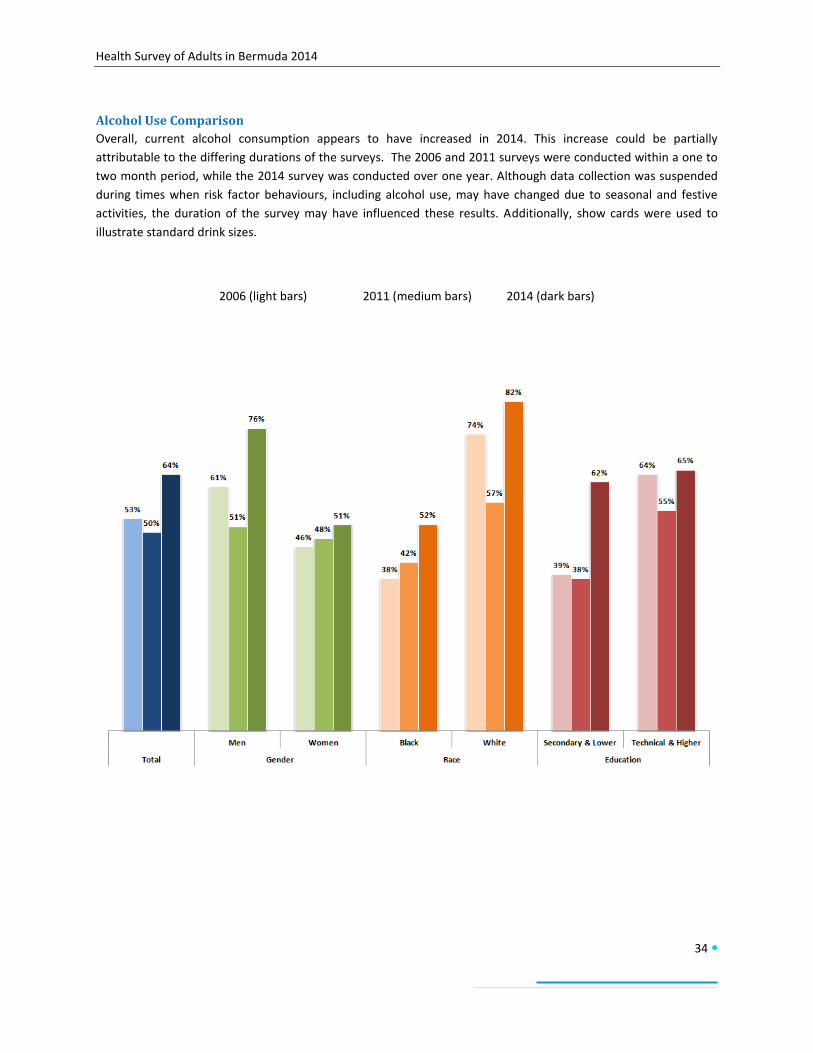
Alcohol Use Comparison
Overall, current alcohol consumption appears to have increased in 2014. This increase could be partially
attributable to the differing durations of the surveys. The 2006 and 2011 surveys were conducted within a one to
two month period, while the 2014 survey was conducted over one year. Although data collection was suspended
during times when risk factor behaviours, including alcohol use, may have changed due to seasonal and festive
activities, the duration of the survey may have influenced these results. Additionally, show cards were used to
illustrate standard drink sizes.
2006 (light bars) 2011 (medium bars) 2014 (dark bars)
Health Survey of Adults in Bermuda 2014
35
Binge Drinking Comparison
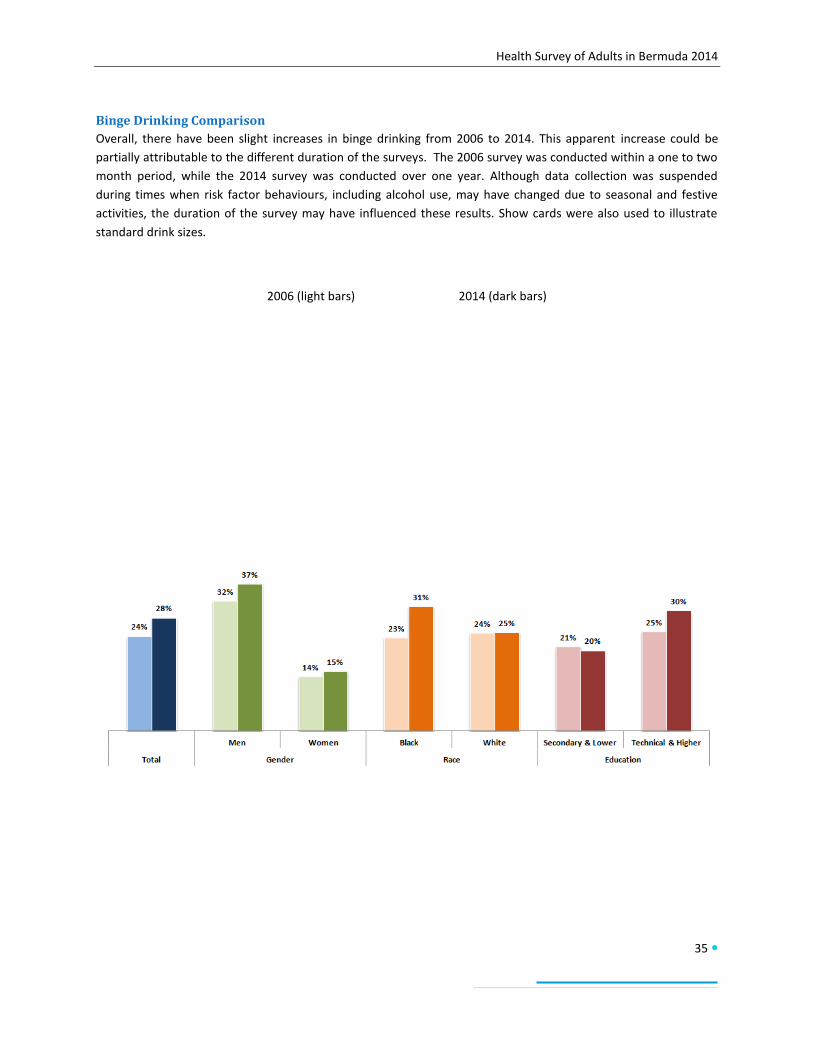
Overall, there have been slight increases in binge drinking from 2006 to 2014. This apparent increase could be
partially attributable to the different duration of the surveys. The 2006 survey was conducted within a one to two
month period, while the 2014 survey was conducted over one year. Although data collection was suspended
during times when risk factor behaviours, including alcohol use, may have changed due to seasonal and festive
activities, the duration of the survey may have influenced these results. Show cards were also used to illustrate
standard drink sizes.
2006 (light bars) 2014 (dark bars)
Health Survey of Adults in Bermuda 2014
36
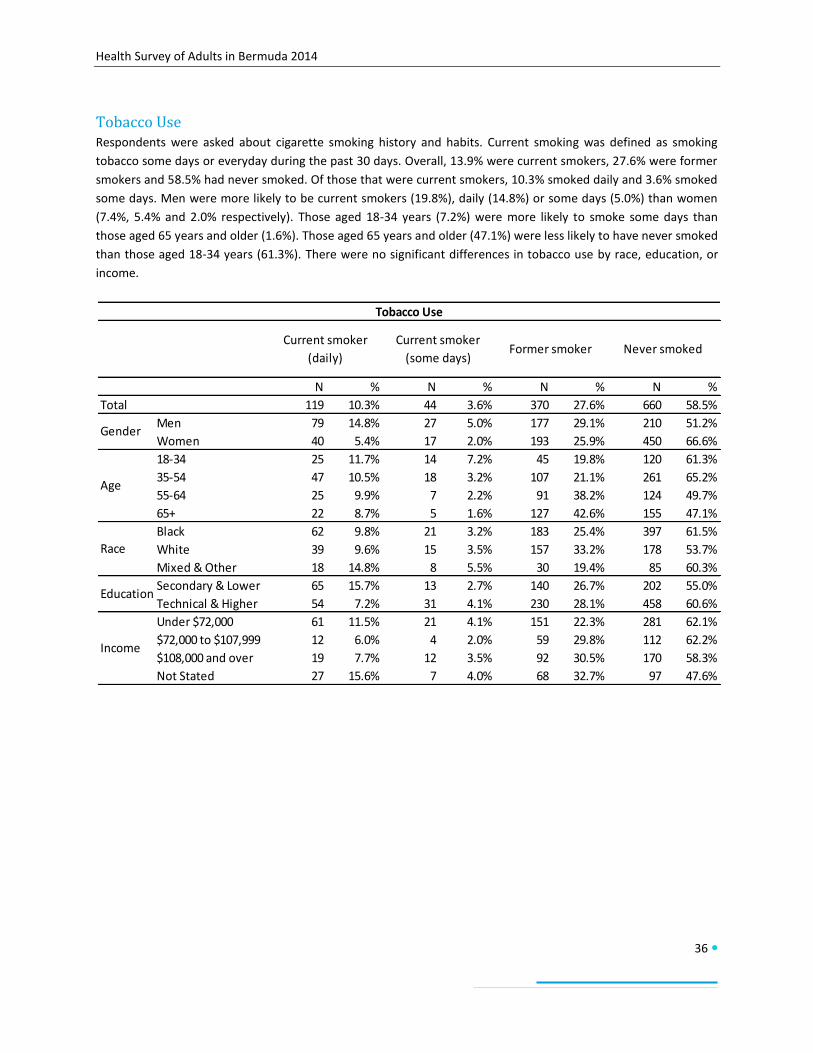
Tobacco Use Respondents were asked about cigarette smoking history and habits. Current smoking was defined as smoking
tobacco some days or everyday during the past 30 days. Overall, 13.9% were current smokers, 27.6% were former
smokers and 58.5% had never smoked. Of those that were current smokers, 10.3% smoked daily and 3.6% smoked
some days. Men were more likely to be current smokers (19.8%), daily (14.8%) or some days (5.0%) than women
(7.4%, 5.4% and 2.0% respectively). Those aged 18-34 years (7.2%) were more likely to smoke some days than
those aged 65 years and older (1.6%). Those aged 65 years and older (47.1%) were less likely to have never smoked
than those aged 18-34 years (61.3%). There were no significant differences in tobacco use by race, education, or
income.
N % N % N % N %
Total 119 10.3% 44 3.6% 370 27.6% 660 58.5%
Men 79 14.8% 27 5.0% 177 29.1% 210 51.2%
Women 40 5.4% 17 2.0% 193 25.9% 450 66.6%
18-34 25 11.7% 14 7.2% 45 19.8% 120 61.3%
35-54 47 10.5% 18 3.2% 107 21.1% 261 65.2%
55-64 25 9.9% 7 2.2% 91 38.2% 124 49.7%
65+ 22 8.7% 5 1.6% 127 42.6% 155 47.1%
Black 62 9.8% 21 3.2% 183 25.4% 397 61.5%
White 39 9.6% 15 3.5% 157 33.2% 178 53.7%
Mixed & Other 18 14.8% 8 5.5% 30 19.4% 85 60.3%
Secondary & Lower 65 15.7% 13 2.7% 140 26.7% 202 55.0%
Technical & Higher 54 7.2% 31 4.1% 230 28.1% 458 60.6%
Under $72,000 61 11.5% 21 4.1% 151 22.3% 281 62.1%
$72,000 to $107,999 12 6.0% 4 2.0% 59 29.8% 112 62.2%
$108,000 and over 19 7.7% 12 3.5% 92 30.5% 170 58.3%
Not Stated 27 15.6% 7 4.0% 68 32.7% 97 47.6%
Gender
Age
Race
Education
Income
Tobacco Use
Current smoker
(daily)
Current smoker
(some days)Former smoker Never smoked
Health Survey of Adults in Bermuda 2014
37
Tobacco Use Comparison
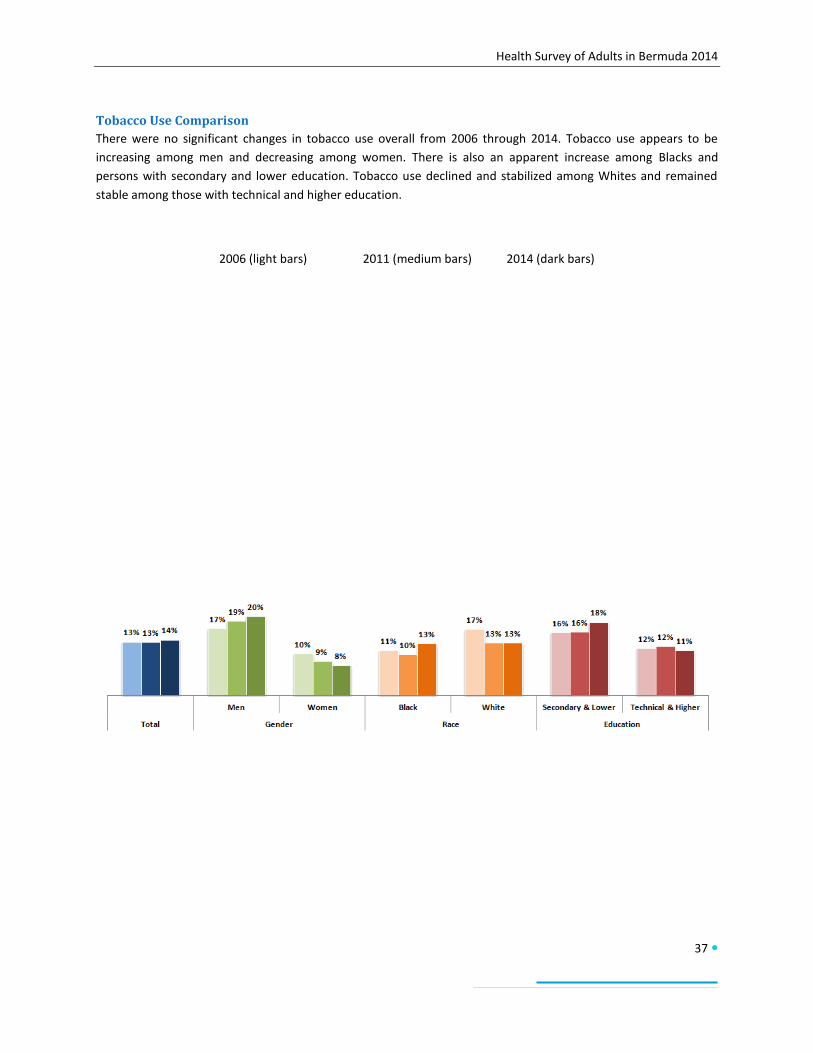
There were no significant changes in tobacco use overall from 2006 through 2014. Tobacco use appears to be
increasing among men and decreasing among women. There is also an apparent increase among Blacks and
persons with secondary and lower education. Tobacco use declined and stabilized among Whites and remained
stable among those with technical and higher education.
2006 (light bars) 2011 (medium bars) 2014 (dark bars)
Health Survey of Adults in Bermuda 2014
38
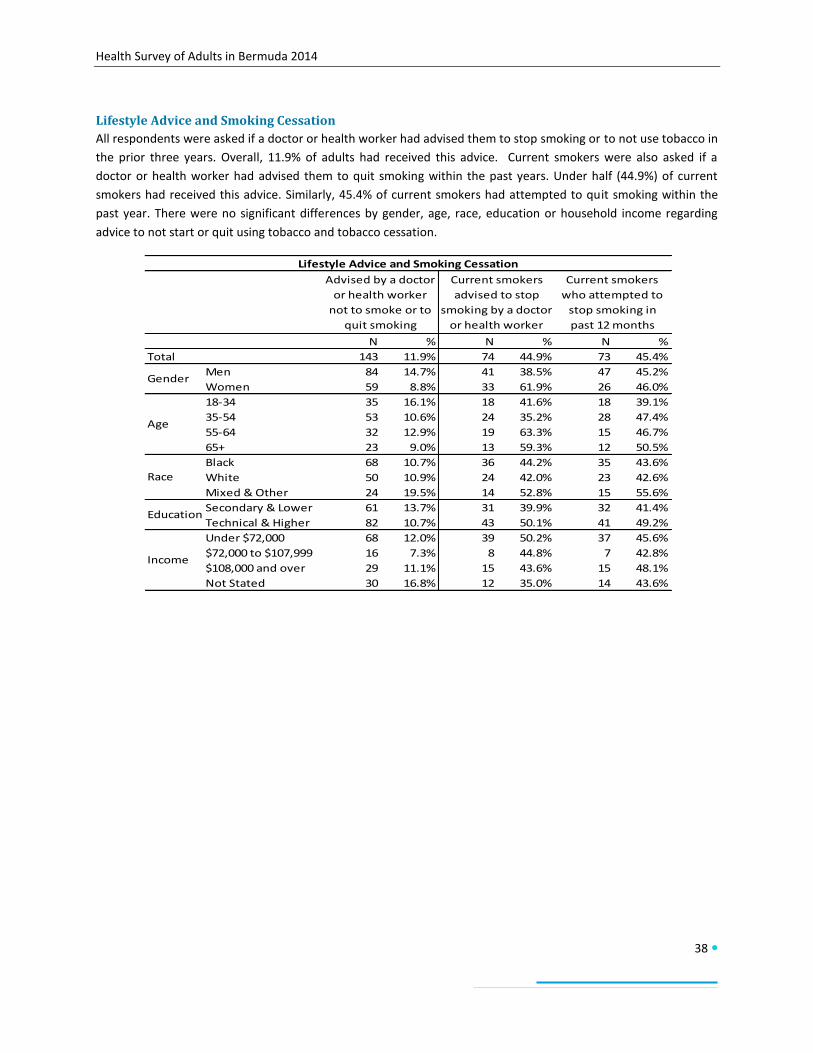
Lifestyle Advice and Smoking Cessation
All respondents were asked if a doctor or health worker had advised them to stop smoking or to not use tobacco in
the prior three years. Overall, 11.9% of adults had received this advice. Current smokers were also asked if a
doctor or health worker had advised them to quit smoking within the past years. Under half (44.9%) of current
smokers had received this advice. Similarly, 45.4% of current smokers had attempted to quit smoking within the
past year. There were no significant differences by gender, age, race, education or household income regarding
advice to not start or quit using tobacco and tobacco cessation.
N % N % N %
Total 143 11.9% 74 44.9% 73 45.4%
Men 84 14.7% 41 38.5% 47 45.2%
Women 59 8.8% 33 61.9% 26 46.0%
18-34 35 16.1% 18 41.6% 18 39.1%
35-54 53 10.6% 24 35.2% 28 47.4%
55-64 32 12.9% 19 63.3% 15 46.7%
65+ 23 9.0% 13 59.3% 12 50.5%
Black 68 10.7% 36 44.2% 35 43.6%
White 50 10.9% 24 42.0% 23 42.6%
Mixed & Other 24 19.5% 14 52.8% 15 55.6%
Secondary & Lower 61 13.7% 31 39.9% 32 41.4%
Technical & Higher 82 10.7% 43 50.1% 41 49.2%
Under $72,000 68 12.0% 39 50.2% 37 45.6%
$72,000 to $107,999 16 7.3% 8 44.8% 7 42.8%
$108,000 and over 29 11.1% 15 43.6% 15 48.1%
Not Stated 30 16.8% 12 35.0% 14 43.6%
Lifestyle Advice and Smoking Cessation
Age
Race
Education
Income
Gender
Advised by a doctor
or health worker
not to smoke or to
quit smoking
Current smokers
advised to stop
smoking by a doctor
or health worker
Current smokers
who attempted to
stop smoking in
past 12 months
Health Survey of Adults in Bermuda 2014
39
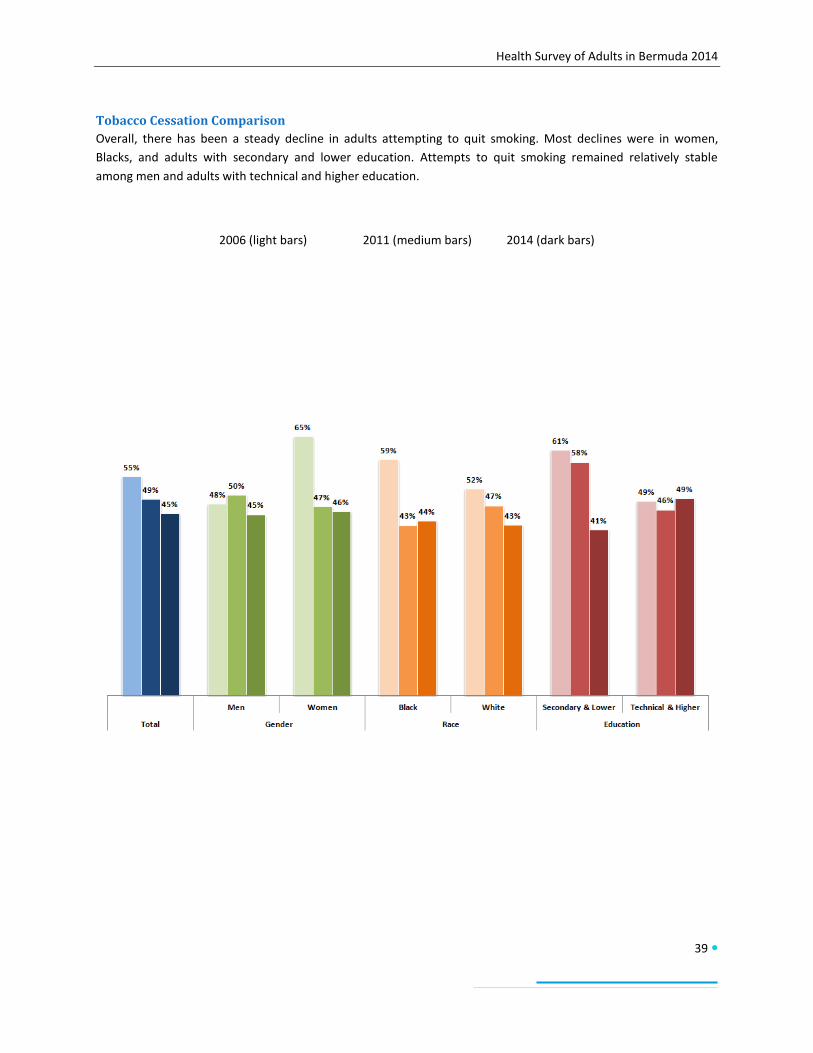
Tobacco Cessation Comparison
Overall, there has been a steady decline in adults attempting to quit smoking. Most declines were in women,
Blacks, and adults with secondary and lower education. Attempts to quit smoking remained relatively stable
among men and adults with technical and higher education.
2006 (light bars) 2011 (medium bars) 2014 (dark bars)
Health Survey of Adults in Bermuda 2014
40
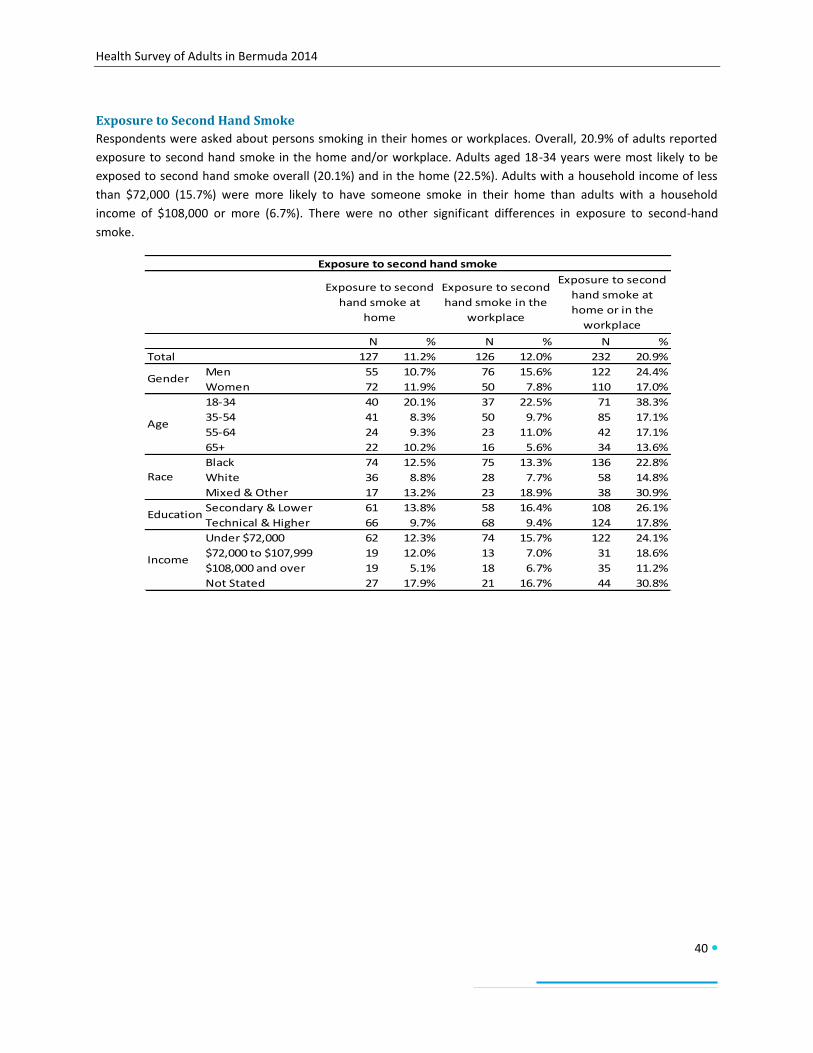
Exposure to Second Hand Smoke
Respondents were asked about persons smoking in their homes or workplaces. Overall, 20.9% of adults reported
exposure to second hand smoke in the home and/or workplace. Adults aged 18-34 years were most likely to be
exposed to second hand smoke overall (20.1%) and in the home (22.5%). Adults with a household income of less
than $72,000 (15.7%) were more likely to have someone smoke in their home than adults with a household
income of $108,000 or more (6.7%). There were no other significant differences in exposure to second-hand
smoke.
N % N % N %
Total 127 11.2% 126 12.0% 232 20.9%
Men 55 10.7% 76 15.6% 122 24.4%
Women 72 11.9% 50 7.8% 110 17.0%
18-34 40 20.1% 37 22.5% 71 38.3%
35-54 41 8.3% 50 9.7% 85 17.1%
55-64 24 9.3% 23 11.0% 42 17.1%
65+ 22 10.2% 16 5.6% 34 13.6%
Black 74 12.5% 75 13.3% 136 22.8%
White 36 8.8% 28 7.7% 58 14.8%
Mixed & Other 17 13.2% 23 18.9% 38 30.9%
Secondary & Lower 61 13.8% 58 16.4% 108 26.1%
Technical & Higher 66 9.7% 68 9.4% 124 17.8%
Under $72,000 62 12.3% 74 15.7% 122 24.1%
$72,000 to $107,999 19 12.0% 13 7.0% 31 18.6%
$108,000 and over 19 5.1% 18 6.7% 35 11.2%
Not Stated 27 17.9% 21 16.7% 44 30.8%
Exposure to second hand smoke
Exposure to second
hand smoke at
home
Exposure to second
hand smoke in the
workplace
Exposure to second
hand smoke at
home or in the
workplace
Gender
Income
Age
Race
Education
Health Survey of Adults in Bermuda 2014
41
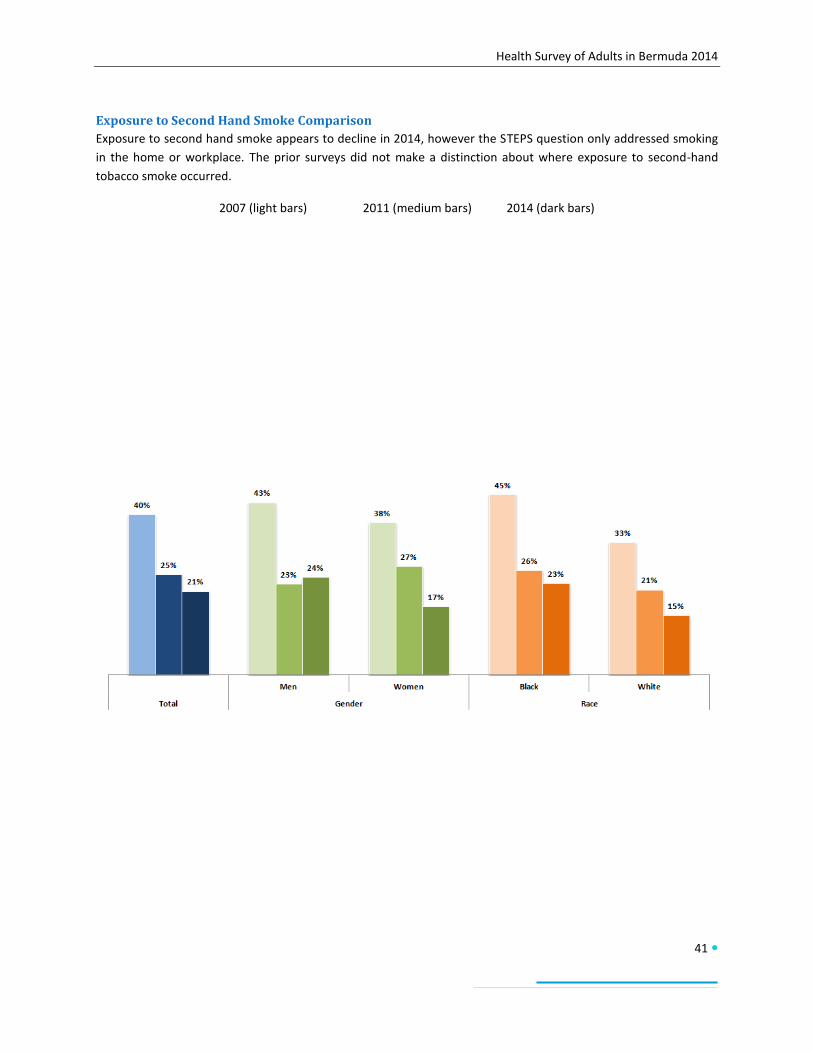
Exposure to Second Hand Smoke Comparison
Exposure to second hand smoke appears to decline in 2014, however the STEPS question only addressed smoking
in the home or workplace. The prior surveys did not make a distinction about where exposure to second-hand
tobacco smoke occurred.
2007 (light bars) 2011 (medium bars) 2014 (dark bars)
Health Survey of Adults in Bermuda 2014
42
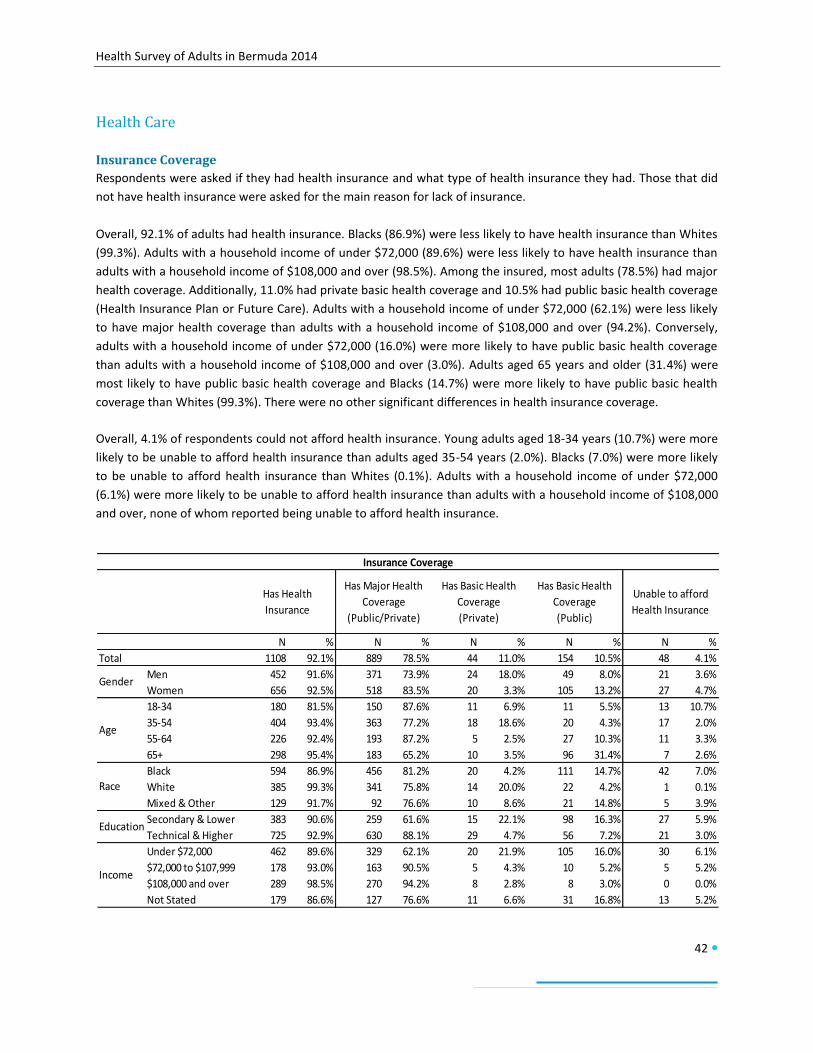
Health Care
Insurance Coverage
Respondents were asked if they had health insurance and what type of health insurance they had. Those that did
not have health insurance were asked for the main reason for lack of insurance.
Overall, 92.1% of adults had health insurance. Blacks (86.9%) were less likely to have health insurance than Whites
(99.3%). Adults with a household income of under $72,000 (89.6%) were less likely to have health insurance than
adults with a household income of $108,000 and over (98.5%). Among the insured, most adults (78.5%) had major
health coverage. Additionally, 11.0% had private basic health coverage and 10.5% had public basic health coverage
(Health Insurance Plan or Future Care). Adults with a household income of under $72,000 (62.1%) were less likely
to have major health coverage than adults with a household income of $108,000 and over (94.2%). Conversely,
adults with a household income of under $72,000 (16.0%) were more likely to have public basic health coverage
than adults with a household income of $108,000 and over (3.0%). Adults aged 65 years and older (31.4%) were
most likely to have public basic health coverage and Blacks (14.7%) were more likely to have public basic health
coverage than Whites (99.3%). There were no other significant differences in health insurance coverage.
Overall, 4.1% of respondents could not afford health insurance. Young adults aged 18-34 years (10.7%) were more
likely to be unable to afford health insurance than adults aged 35-54 years (2.0%). Blacks (7.0%) were more likely
to be unable to afford health insurance than Whites (0.1%). Adults with a household income of under $72,000
(6.1%) were more likely to be unable to afford health insurance than adults with a household income of $108,000
and over, none of whom reported being unable to afford health insurance.
N % N % N % N % N %
Total 1108 92.1% 889 78.5% 44 11.0% 154 10.5% 48 4.1%
Men 452 91.6% 371 73.9% 24 18.0% 49 8.0% 21 3.6%
Women 656 92.5% 518 83.5% 20 3.3% 105 13.2% 27 4.7%
18-34 180 81.5% 150 87.6% 11 6.9% 11 5.5% 13 10.7%
35-54 404 93.4% 363 77.2% 18 18.6% 20 4.3% 17 2.0%
55-64 226 92.4% 193 87.2% 5 2.5% 27 10.3% 11 3.3%
65+ 298 95.4% 183 65.2% 10 3.5% 96 31.4% 7 2.6%
Black 594 86.9% 456 81.2% 20 4.2% 111 14.7% 42 7.0%
White 385 99.3% 341 75.8% 14 20.0% 22 4.2% 1 0.1%
Mixed & Other 129 91.7% 92 76.6% 10 8.6% 21 14.8% 5 3.9%
Secondary & Lower 383 90.6% 259 61.6% 15 22.1% 98 16.3% 27 5.9%
Technical & Higher 725 92.9% 630 88.1% 29 4.7% 56 7.2% 21 3.0%
Under $72,000 462 89.6% 329 62.1% 20 21.9% 105 16.0% 30 6.1%
$72,000 to $107,999 178 93.0% 163 90.5% 5 4.3% 10 5.2% 5 5.2%
$108,000 and over 289 98.5% 270 94.2% 8 2.8% 8 3.0% 0 0.0%
Not Stated 179 86.6% 127 76.6% 11 6.6% 31 16.8% 13 5.2%
Insurance Coverage
Has Health
Insurance
Has Major Health
Coverage
(Public/Private)
Has Basic Health
Coverage
(Private)
Has Basic Health
Coverage
(Public)
Unable to afford
Health Insurance
Gender
Age
Race
Education
Income
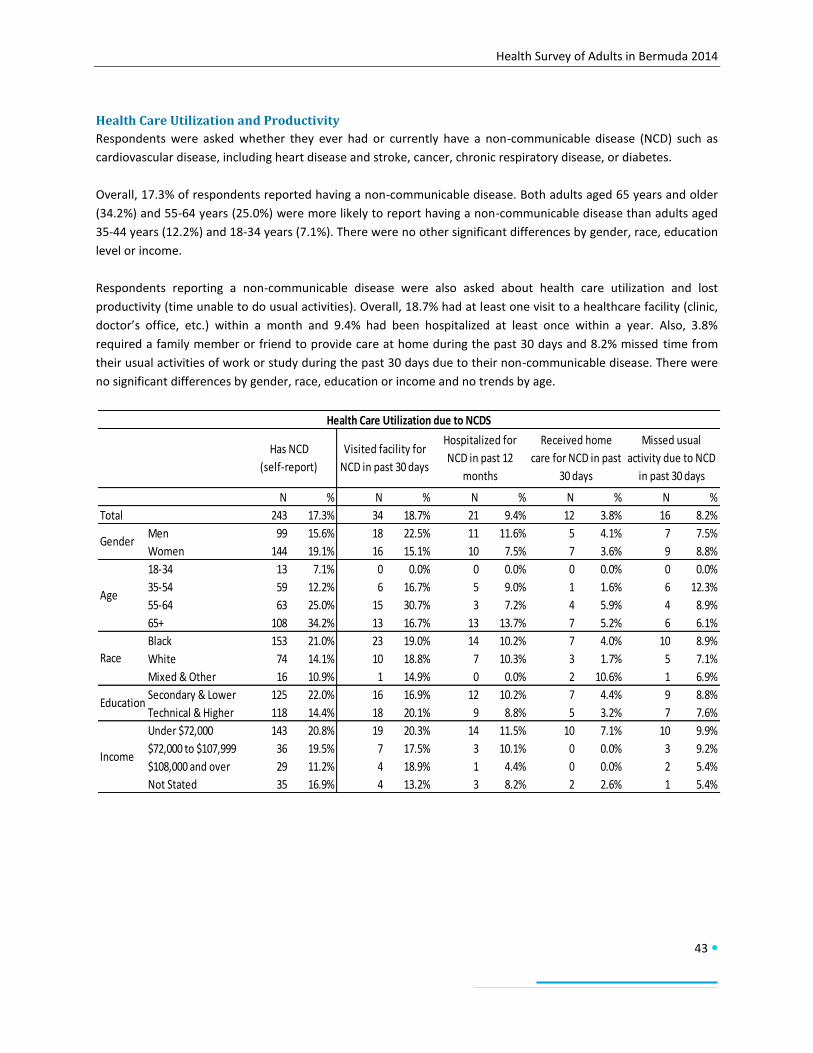
Health Survey of Adults in Bermuda 2014
43
Health Care Utilization and Productivity
Respondents were asked whether they ever had or currently have a non-communicable disease (NCD) such as
cardiovascular disease, including heart disease and stroke, cancer, chronic respiratory disease, or diabetes.
Overall, 17.3% of respondents reported having a non-communicable disease. Both adults aged 65 years and older
(34.2%) and 55-64 years (25.0%) were more likely to report having a non-communicable disease than adults aged
35-44 years (12.2%) and 18-34 years (7.1%). There were no other significant differences by gender, race, education
level or income.
Respondents reporting a non-communicable disease were also asked about health care utilization and lost
productivity (time unable to do usual activities). Overall, 18.7% had at least one visit to a healthcare facility (clinic,
doctor’s office, etc.) within a month and 9.4% had been hospitalized at least once within a year. Also, 3.8%
required a family member or friend to provide care at home during the past 30 days and 8.2% missed time from
their usual activities of work or study during the past 30 days due to their non-communicable disease. There were
no significant differences by gender, race, education or income and no trends by age.
N % N % N % N % N %
Total 243 17.3% 34 18.7% 21 9.4% 12 3.8% 16 8.2%
Men 99 15.6% 18 22.5% 11 11.6% 5 4.1% 7 7.5%
Women 144 19.1% 16 15.1% 10 7.5% 7 3.6% 9 8.8%
18-34 13 7.1% 0 0.0% 0 0.0% 0 0.0% 0 0.0%
35-54 59 12.2% 6 16.7% 5 9.0% 1 1.6% 6 12.3%
55-64 63 25.0% 15 30.7% 3 7.2% 4 5.9% 4 8.9%
65+ 108 34.2% 13 16.7% 13 13.7% 7 5.2% 6 6.1%
Black 153 21.0% 23 19.0% 14 10.2% 7 4.0% 10 8.9%
White 74 14.1% 10 18.8% 7 10.3% 3 1.7% 5 7.1%
Mixed & Other 16 10.9% 1 14.9% 0 0.0% 2 10.6% 1 6.9%
Secondary & Lower 125 22.0% 16 16.9% 12 10.2% 7 4.4% 9 8.8%
Technical & Higher 118 14.4% 18 20.1% 9 8.8% 5 3.2% 7 7.6%
Under $72,000 143 20.8% 19 20.3% 14 11.5% 10 7.1% 10 9.9%
$72,000 to $107,999 36 19.5% 7 17.5% 3 10.1% 0 0.0% 3 9.2%
$108,000 and over 29 11.2% 4 18.9% 1 4.4% 0 0.0% 2 5.4%
Not Stated 35 16.9% 4 13.2% 3 8.2% 2 2.6% 1 5.4%
Health Care Utilization due to NCDS
Has NCD
(self-report)
Visited facility for
NCD in past 30 days
Hospitalized for
NCD in past 12
months
Received home
care for NCD in past
30 days
Missed usual
activity due to NCD
in past 30 days
Gender
Age
Race
Education
Income
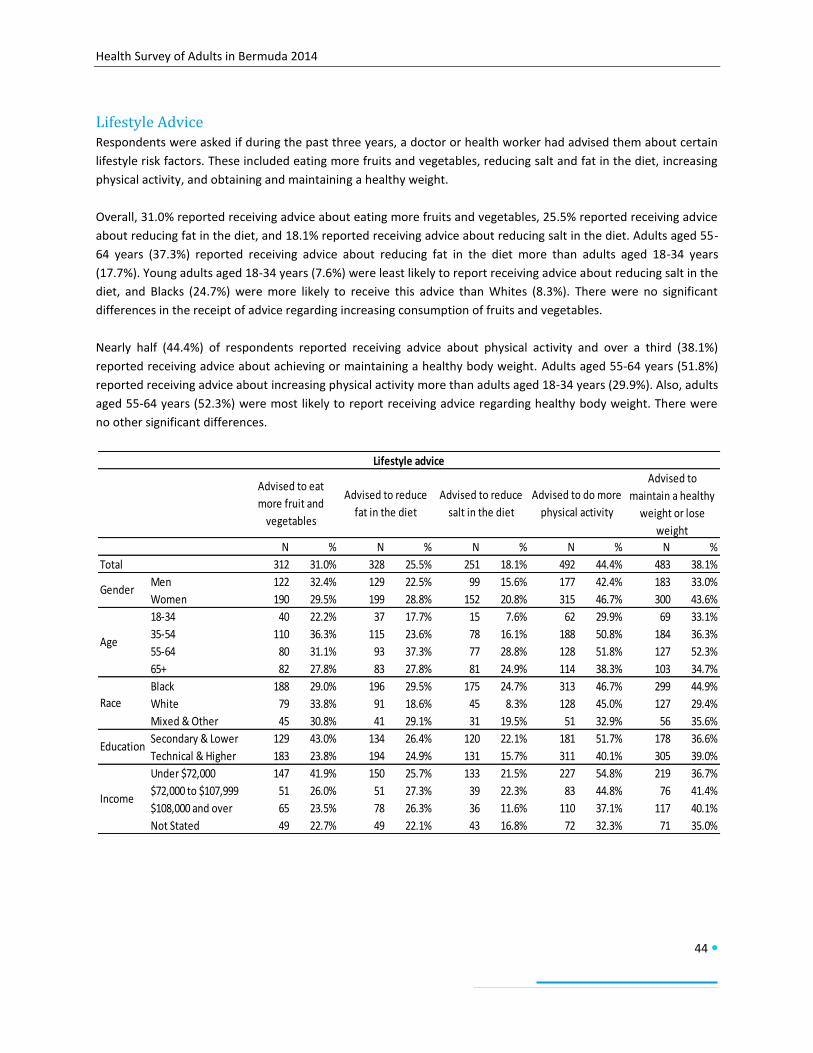
Health Survey of Adults in Bermuda 2014
44
Lifestyle Advice Respondents were asked if during the past three years, a doctor or health worker had advised them about certain
lifestyle risk factors. These included eating more fruits and vegetables, reducing salt and fat in the diet, increasing
physical activity, and obtaining and maintaining a healthy weight.
Overall, 31.0% reported receiving advice about eating more fruits and vegetables, 25.5% reported receiving advice
about reducing fat in the diet, and 18.1% reported receiving advice about reducing salt in the diet. Adults aged 55-
64 years (37.3%) reported receiving advice about reducing fat in the diet more than adults aged 18-34 years
(17.7%). Young adults aged 18-34 years (7.6%) were least likely to report receiving advice about reducing salt in the
diet, and Blacks (24.7%) were more likely to receive this advice than Whites (8.3%). There were no significant
differences in the receipt of advice regarding increasing consumption of fruits and vegetables.
Nearly half (44.4%) of respondents reported receiving advice about physical activity and over a third (38.1%)
reported receiving advice about achieving or maintaining a healthy body weight. Adults aged 55-64 years (51.8%)
reported receiving advice about increasing physical activity more than adults aged 18-34 years (29.9%). Also, adults
aged 55-64 years (52.3%) were most likely to report receiving advice regarding healthy body weight. There were
no other significant differences.
N % N % N % N % N %
Total 312 31.0% 328 25.5% 251 18.1% 492 44.4% 483 38.1%
Men 122 32.4% 129 22.5% 99 15.6% 177 42.4% 183 33.0%
Women 190 29.5% 199 28.8% 152 20.8% 315 46.7% 300 43.6%
18-34 40 22.2% 37 17.7% 15 7.6% 62 29.9% 69 33.1%
35-54 110 36.3% 115 23.6% 78 16.1% 188 50.8% 184 36.3%
55-64 80 31.1% 93 37.3% 77 28.8% 128 51.8% 127 52.3%
65+ 82 27.8% 83 27.8% 81 24.9% 114 38.3% 103 34.7%
Black 188 29.0% 196 29.5% 175 24.7% 313 46.7% 299 44.9%
White 79 33.8% 91 18.6% 45 8.3% 128 45.0% 127 29.4%
Mixed & Other 45 30.8% 41 29.1% 31 19.5% 51 32.9% 56 35.6%
Secondary & Lower 129 43.0% 134 26.4% 120 22.1% 181 51.7% 178 36.6%
Technical & Higher 183 23.8% 194 24.9% 131 15.7% 311 40.1% 305 39.0%
Under $72,000 147 41.9% 150 25.7% 133 21.5% 227 54.8% 219 36.7%
$72,000 to $107,999 51 26.0% 51 27.3% 39 22.3% 83 44.8% 76 41.4%
$108,000 and over 65 23.5% 78 26.3% 36 11.6% 110 37.1% 117 40.1%
Not Stated 49 22.7% 49 22.1% 43 16.8% 72 32.3% 71 35.0%
Gender
Age
Race
Education
Income
Lifestyle advice
Advised to eat
more fruit and
vegetables
Advised to reduce
fat in the diet
Advised to reduce
salt in the diet
Advised to do more
physical activity
Advised to
maintain a healthy
weight or lose
weight
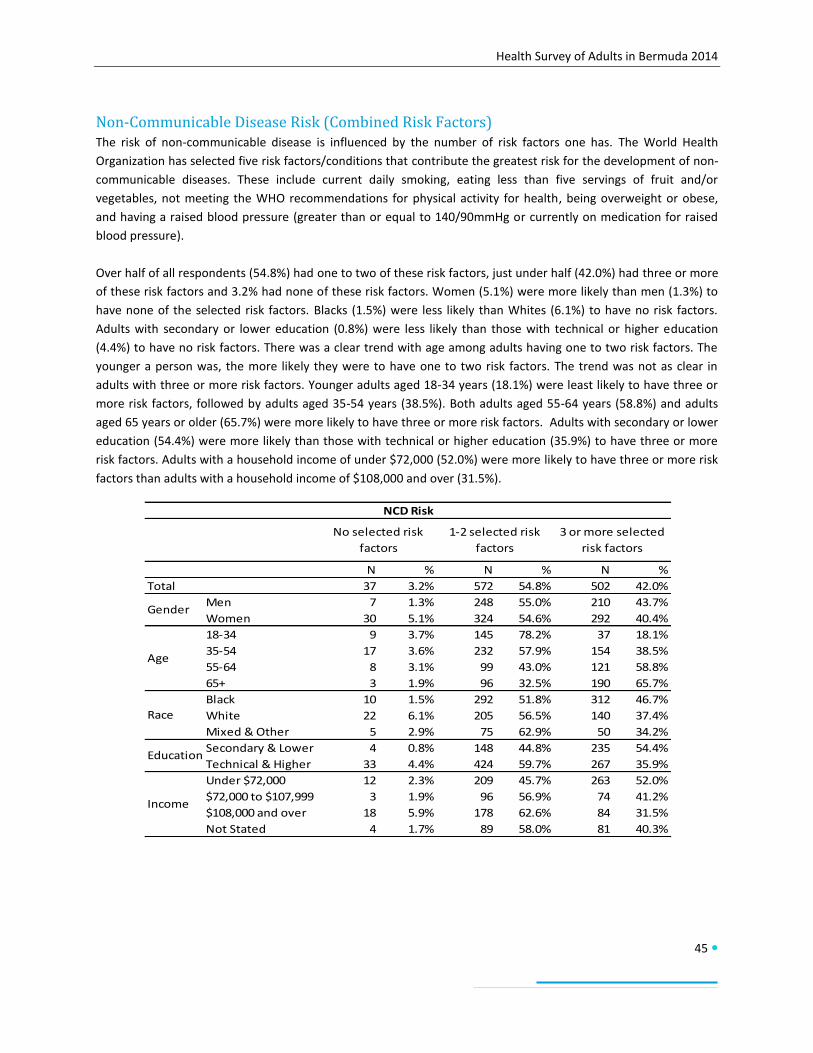
Health Survey of Adults in Bermuda 2014
45
Non-Communicable Disease Risk (Combined Risk Factors) The risk of non-communicable disease is influenced by the number of risk factors one has. The World Health
Organization has selected five risk factors/conditions that contribute the greatest risk for the development of non-
communicable diseases. These include current daily smoking, eating less than five servings of fruit and/or
vegetables, not meeting the WHO recommendations for physical activity for health, being overweight or obese,
and having a raised blood pressure (greater than or equal to 140/90mmHg or currently on medication for raised
blood pressure).
Over half of all respondents (54.8%) had one to two of these risk factors, just under half (42.0%) had three or more
of these risk factors and 3.2% had none of these risk factors. Women (5.1%) were more likely than men (1.3%) to
have none of the selected risk factors. Blacks (1.5%) were less likely than Whites (6.1%) to have no risk factors.
Adults with secondary or lower education (0.8%) were less likely than those with technical or higher education
(4.4%) to have no risk factors. There was a clear trend with age among adults having one to two risk factors. The
younger a person was, the more likely they were to have one to two risk factors. The trend was not as clear in
adults with three or more risk factors. Younger adults aged 18-34 years (18.1%) were least likely to have three or
more risk factors, followed by adults aged 35-54 years (38.5%). Both adults aged 55-64 years (58.8%) and adults
aged 65 years or older (65.7%) were more likely to have three or more risk factors. Adults with secondary or lower
education (54.4%) were more likely than those with technical or higher education (35.9%) to have three or more
risk factors. Adults with a household income of under $72,000 (52.0%) were more likely to have three or more risk
factors than adults with a household income of $108,000 and over (31.5%).
N % N % N %
Total 37 3.2% 572 54.8% 502 42.0%
Men 7 1.3% 248 55.0% 210 43.7%
Women 30 5.1% 324 54.6% 292 40.4%
18-34 9 3.7% 145 78.2% 37 18.1%
35-54 17 3.6% 232 57.9% 154 38.5%
55-64 8 3.1% 99 43.0% 121 58.8%
65+ 3 1.9% 96 32.5% 190 65.7%
Black 10 1.5% 292 51.8% 312 46.7%
White 22 6.1% 205 56.5% 140 37.4%
Mixed & Other 5 2.9% 75 62.9% 50 34.2%
Secondary & Lower 4 0.8% 148 44.8% 235 54.4%
Technical & Higher 33 4.4% 424 59.7% 267 35.9%
Under $72,000 12 2.3% 209 45.7% 263 52.0%
$72,000 to $107,999 3 1.9% 96 56.9% 74 41.2%
$108,000 and over 18 5.9% 178 62.6% 84 31.5%
Not Stated 4 1.7% 89 58.0% 81 40.3%
Race
Education
Income
NCD Risk
No selected risk
factors
1-2 selected risk
factors
3 or more selected
risk factors
Gender
Age
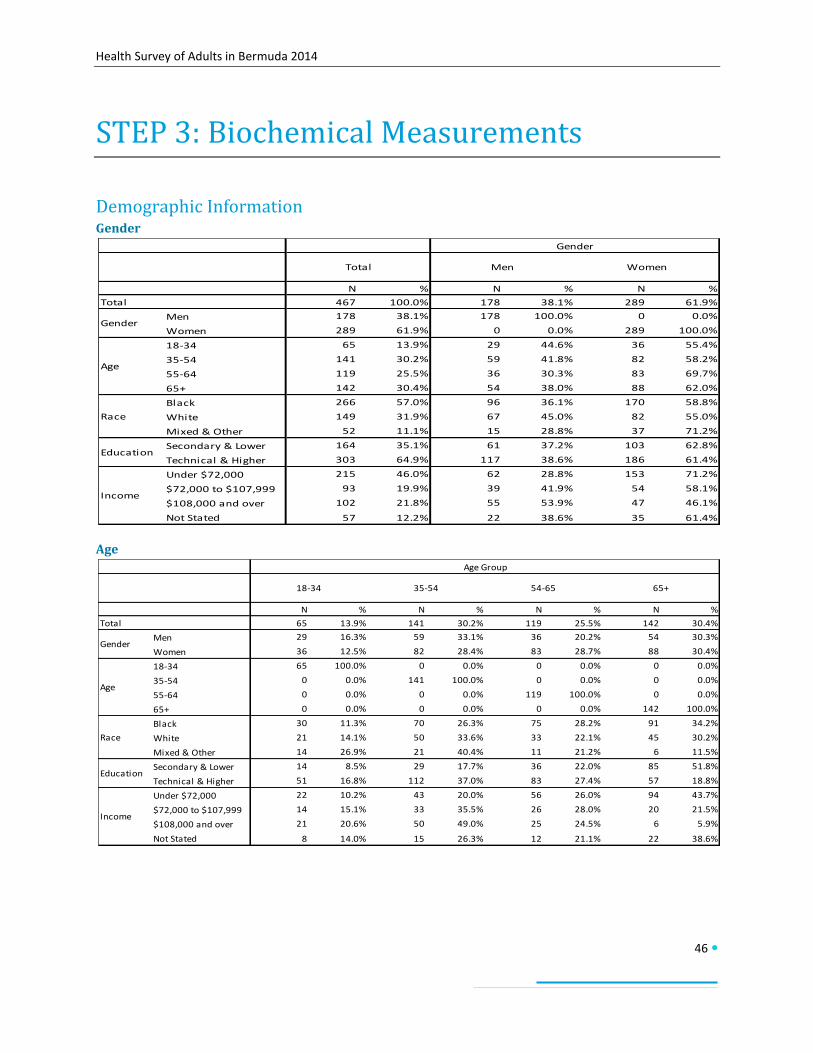
Health Survey of Adults in Bermuda 2014
46
STEP 3: Biochemical Measurements
Demographic Information Gender
Age
N % N % N %
467 100.0% 178 38.1% 289 61.9%
Men 178 38.1% 178 100.0% 0 0.0%
Women 289 61.9% 0 0.0% 289 100.0%
18-34 65 13.9% 29 44.6% 36 55.4%
35-54 141 30.2% 59 41.8% 82 58.2%
55-64 119 25.5% 36 30.3% 83 69.7%
65+ 142 30.4% 54 38.0% 88 62.0%
Black 266 57.0% 96 36.1% 170 58.8%
White 149 31.9% 67 45.0% 82 55.0%
Mixed & Other 52 11.1% 15 28.8% 37 71.2%
Secondary & Lower 164 35.1% 61 37.2% 103 62.8%
Technical & Higher 303 64.9% 117 38.6% 186 61.4%
Under $72,000 215 46.0% 62 28.8% 153 71.2%
$72,000 to $107,999 93 19.9% 39 41.9% 54 58.1%
$108,000 and over 102 21.8% 55 53.9% 47 46.1%
Not Stated 57 12.2% 22 38.6% 35 61.4%
Total Men Women
Gender
Total
Gender
Age
Race
Education
Income
N % N % N % N %
65 13.9% 141 30.2% 119 25.5% 142 30.4%
Men 29 16.3% 59 33.1% 36 20.2% 54 30.3%
Women 36 12.5% 82 28.4% 83 28.7% 88 30.4%
18-34 65 100.0% 0 0.0% 0 0.0% 0 0.0%
35-54 0 0.0% 141 100.0% 0 0.0% 0 0.0%
55-64 0 0.0% 0 0.0% 119 100.0% 0 0.0%
65+ 0 0.0% 0 0.0% 0 0.0% 142 100.0%
Black 30 11.3% 70 26.3% 75 28.2% 91 34.2%
White 21 14.1% 50 33.6% 33 22.1% 45 30.2%
Mixed & Other 14 26.9% 21 40.4% 11 21.2% 6 11.5%
Secondary & Lower 14 8.5% 29 17.7% 36 22.0% 85 51.8%
Technical & Higher 51 16.8% 112 37.0% 83 27.4% 57 18.8%
Under $72,000 22 10.2% 43 20.0% 56 26.0% 94 43.7%
$72,000 to $107,999 14 15.1% 33 35.5% 26 28.0% 20 21.5%
$108,000 and over 21 20.6% 50 49.0% 25 24.5% 6 5.9%
Not Stated 8 14.0% 15 26.3% 12 21.1% 22 38.6%
Race
Education
Income
Total
Gender
65+54-6518-34 35-54
Age
Age Group
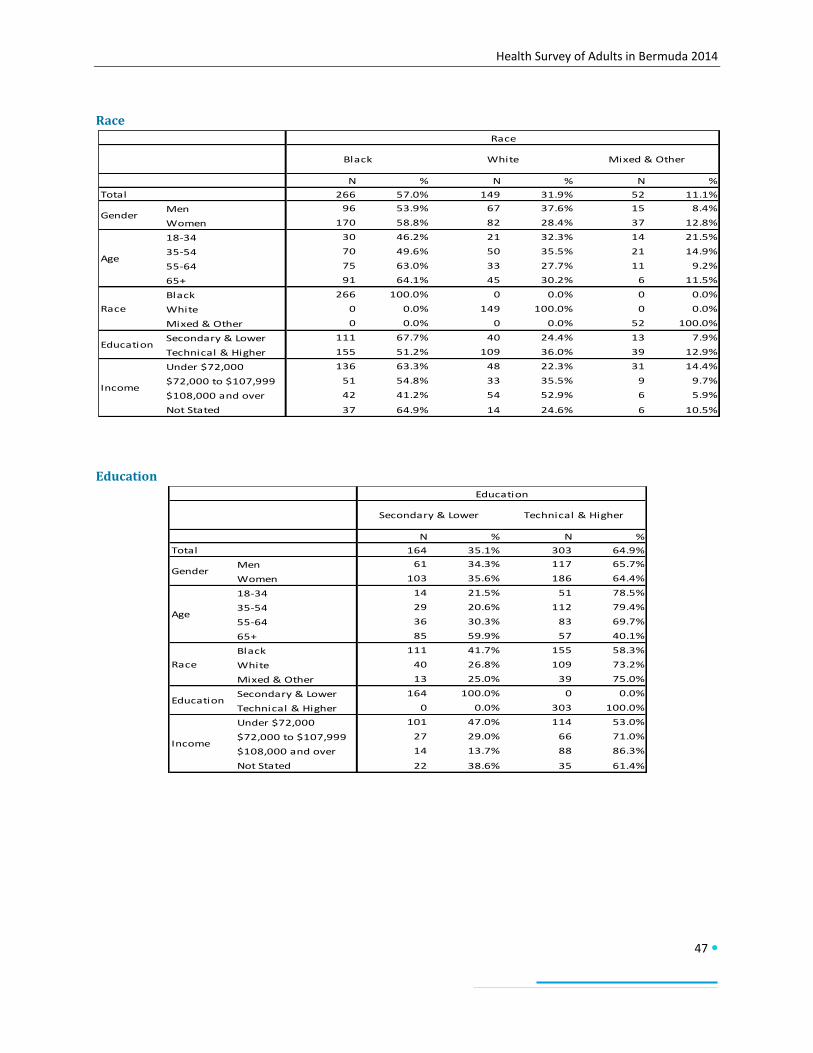
Health Survey of Adults in Bermuda 2014
47
Race
Education
N % N % N %
266 57.0% 149 31.9% 52 11.1%
Men 96 53.9% 67 37.6% 15 8.4%
Women 170 58.8% 82 28.4% 37 12.8%
18-34 30 46.2% 21 32.3% 14 21.5%
35-54 70 49.6% 50 35.5% 21 14.9%
55-64 75 63.0% 33 27.7% 11 9.2%
65+ 91 64.1% 45 30.2% 6 11.5%
Black 266 100.0% 0 0.0% 0 0.0%
White 0 0.0% 149 100.0% 0 0.0%
Mixed & Other 0 0.0% 0 0.0% 52 100.0%
Secondary & Lower 111 67.7% 40 24.4% 13 7.9%
Technical & Higher 155 51.2% 109 36.0% 39 12.9%
Under $72,000 136 63.3% 48 22.3% 31 14.4%
$72,000 to $107,999 51 54.8% 33 35.5% 9 9.7%
$108,000 and over 42 41.2% 54 52.9% 6 5.9%
Not Stated 37 64.9% 14 24.6% 6 10.5%
Race
Total
Gender
Black White Mixed & Other
Age
Race
Education
Income
N % N %
164 35.1% 303 64.9%
Men 61 34.3% 117 65.7%
Women 103 35.6% 186 64.4%
18-34 14 21.5% 51 78.5%
35-54 29 20.6% 112 79.4%
55-64 36 30.3% 83 69.7%
65+ 85 59.9% 57 40.1%
Black 111 41.7% 155 58.3%
White 40 26.8% 109 73.2%
Mixed & Other 13 25.0% 39 75.0%
Secondary & Lower 164 100.0% 0 0.0%
Technical & Higher 0 0.0% 303 100.0%
Under $72,000 101 47.0% 114 53.0%
$72,000 to $107,999 27 29.0% 66 71.0%
$108,000 and over 14 13.7% 88 86.3%
Not Stated 22 38.6% 35 61.4%
Education
Total
Gender
Secondary & Lower Technical & Higher
Age
Race
Education
Income
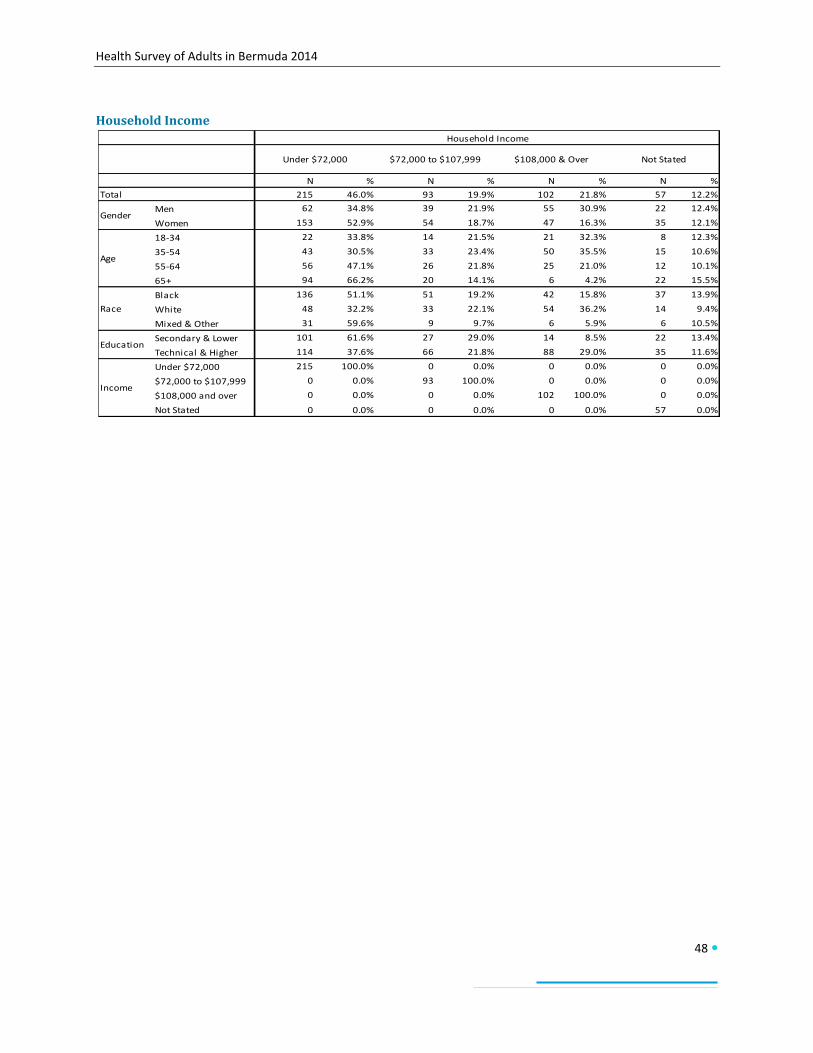
Health Survey of Adults in Bermuda 2014
48
Household Income
N % N % N % N %
215 46.0% 93 19.9% 102 21.8% 57 12.2%
Men 62 34.8% 39 21.9% 55 30.9% 22 12.4%
Women 153 52.9% 54 18.7% 47 16.3% 35 12.1%
18-34 22 33.8% 14 21.5% 21 32.3% 8 12.3%
35-54 43 30.5% 33 23.4% 50 35.5% 15 10.6%
55-64 56 47.1% 26 21.8% 25 21.0% 12 10.1%
65+ 94 66.2% 20 14.1% 6 4.2% 22 15.5%
Black 136 51.1% 51 19.2% 42 15.8% 37 13.9%
White 48 32.2% 33 22.1% 54 36.2% 14 9.4%
Mixed & Other 31 59.6% 9 9.7% 6 5.9% 6 10.5%
Secondary & Lower 101 61.6% 27 29.0% 14 8.5% 22 13.4%
Technical & Higher 114 37.6% 66 21.8% 88 29.0% 35 11.6%
Under $72,000 215 100.0% 0 0.0% 0 0.0% 0 0.0%
$72,000 to $107,999 0 0.0% 93 100.0% 0 0.0% 0 0.0%
$108,000 and over 0 0.0% 0 0.0% 102 100.0% 0 0.0%
Not Stated 0 0.0% 0 0.0% 0 0.0% 57 0.0%
Household Income
$72,000 to $107,999 $108,000 & Over Not Stated
Total
Gender
Age
Race
Education
Income
Under $72,000
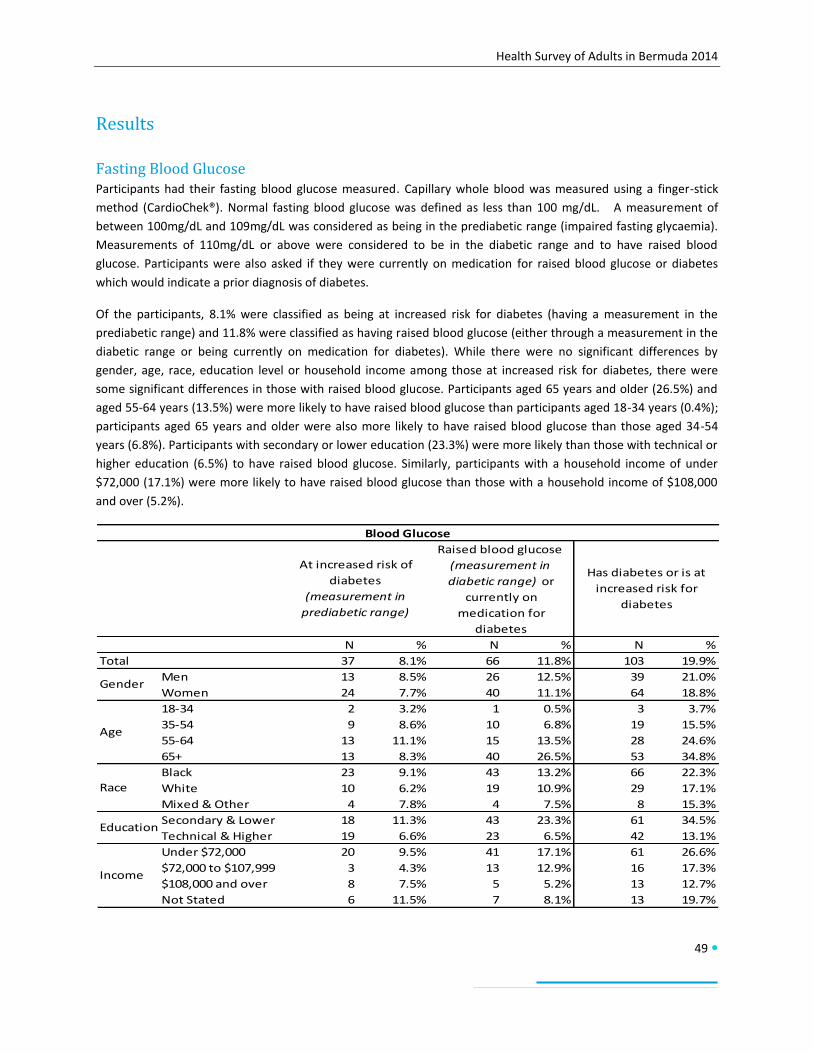
Health Survey of Adults in Bermuda 2014
49
Results
Fasting Blood Glucose Participants had their fasting blood glucose measured. Capillary whole blood was measured using a finger-stick
method (CardioChek®). Normal fasting blood glucose was defined as less than 100 mg/dL. A measurement of
between 100mg/dL and 109mg/dL was considered as being in the prediabetic range (impaired fasting glycaemia).
Measurements of 110mg/dL or above were considered to be in the diabetic range and to have raised blood
glucose. Participants were also asked if they were currently on medication for raised blood glucose or diabetes
which would indicate a prior diagnosis of diabetes.
Of the participants, 8.1% were classified as being at increased risk for diabetes (having a measurement in the
prediabetic range) and 11.8% were classified as having raised blood glucose (either through a measurement in the
diabetic range or being currently on medication for diabetes). While there were no significant differences by
gender, age, race, education level or household income among those at increased risk for diabetes, there were
some significant differences in those with raised blood glucose. Participants aged 65 years and older (26.5%) and
aged 55-64 years (13.5%) were more likely to have raised blood glucose than participants aged 18-34 years (0.4%);
participants aged 65 years and older were also more likely to have raised blood glucose than those aged 34-54
years (6.8%). Participants with secondary or lower education (23.3%) were more likely than those with technical or
higher education (6.5%) to have raised blood glucose. Similarly, participants with a household income of under
$72,000 (17.1%) were more likely to have raised blood glucose than those with a household income of $108,000
and over (5.2%).
N % N % N %
Total 37 8.1% 66 11.8% 103 19.9%
Men 13 8.5% 26 12.5% 39 21.0%
Women 24 7.7% 40 11.1% 64 18.8%
18-34 2 3.2% 1 0.5% 3 3.7%
35-54 9 8.6% 10 6.8% 19 15.5%
55-64 13 11.1% 15 13.5% 28 24.6%
65+ 13 8.3% 40 26.5% 53 34.8%
Black 23 9.1% 43 13.2% 66 22.3%
White 10 6.2% 19 10.9% 29 17.1%
Mixed & Other 4 7.8% 4 7.5% 8 15.3%
Secondary & Lower 18 11.3% 43 23.3% 61 34.5%
Technical & Higher 19 6.6% 23 6.5% 42 13.1%
Under $72,000 20 9.5% 41 17.1% 61 26.6%
$72,000 to $107,999 3 4.3% 13 12.9% 16 17.3%
$108,000 and over 8 7.5% 5 5.2% 13 12.7%
Not Stated 6 11.5% 7 8.1% 13 19.7%
Blood Glucose
Age
Race
Education
Income
Has diabetes or is at
increased risk for
diabetes
At increased risk of
diabetes
(measurement in
prediabetic range)
Raised blood glucose
(measurement in
diabetic range) or
currently on
medication for
diabetes
Gender
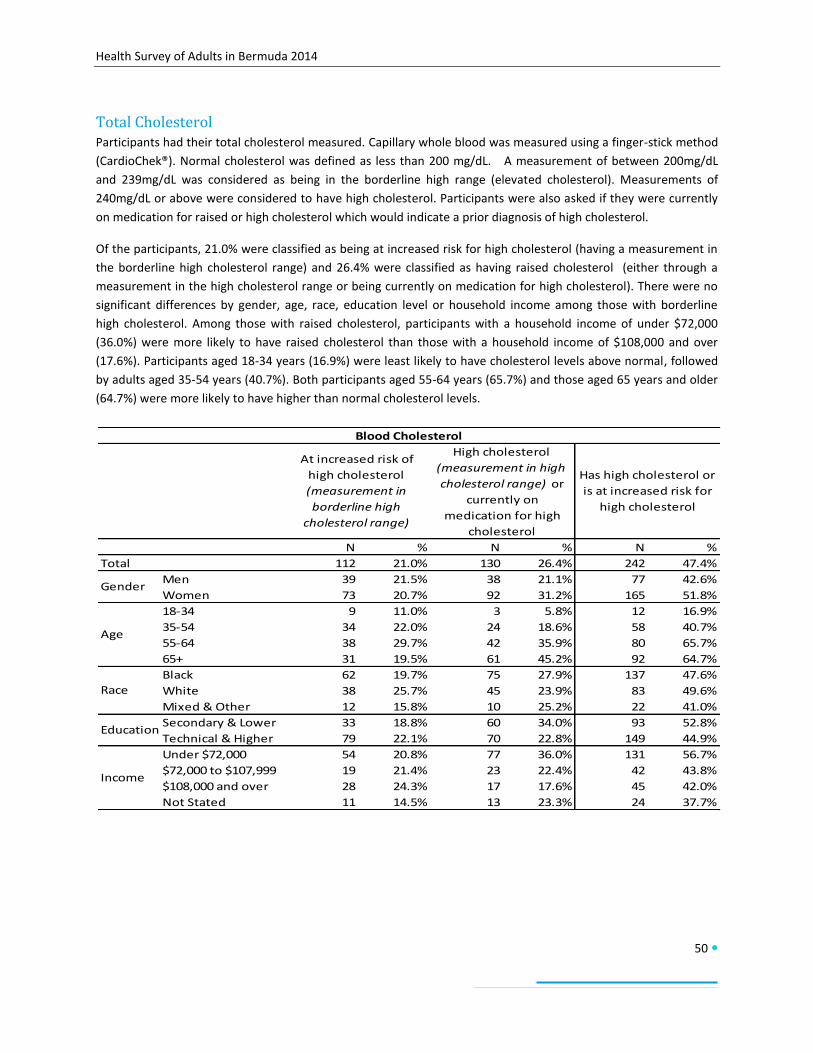
Health Survey of Adults in Bermuda 2014
50
Total Cholesterol Participants had their total cholesterol measured. Capillary whole blood was measured using a finger-stick method
(CardioChek®). Normal cholesterol was defined as less than 200 mg/dL. A measurement of between 200mg/dL
and 239mg/dL was considered as being in the borderline high range (elevated cholesterol). Measurements of
240mg/dL or above were considered to have high cholesterol. Participants were also asked if they were currently
on medication for raised or high cholesterol which would indicate a prior diagnosis of high cholesterol.
Of the participants, 21.0% were classified as being at increased risk for high cholesterol (having a measurement in
the borderline high cholesterol range) and 26.4% were classified as having raised cholesterol (either through a
measurement in the high cholesterol range or being currently on medication for high cholesterol). There were no
significant differences by gender, age, race, education level or household income among those with borderline
high cholesterol. Among those with raised cholesterol, participants with a household income of under $72,000
(36.0%) were more likely to have raised cholesterol than those with a household income of $108,000 and over
(17.6%). Participants aged 18-34 years (16.9%) were least likely to have cholesterol levels above normal, followed
by adults aged 35-54 years (40.7%). Both participants aged 55-64 years (65.7%) and those aged 65 years and older
(64.7%) were more likely to have higher than normal cholesterol levels.
N % N % N %
Total 112 21.0% 130 26.4% 242 47.4%
Men 39 21.5% 38 21.1% 77 42.6%
Women 73 20.7% 92 31.2% 165 51.8%
18-34 9 11.0% 3 5.8% 12 16.9%
35-54 34 22.0% 24 18.6% 58 40.7%
55-64 38 29.7% 42 35.9% 80 65.7%
65+ 31 19.5% 61 45.2% 92 64.7%
Black 62 19.7% 75 27.9% 137 47.6%
White 38 25.7% 45 23.9% 83 49.6%
Mixed & Other 12 15.8% 10 25.2% 22 41.0%
Secondary & Lower 33 18.8% 60 34.0% 93 52.8%
Technical & Higher 79 22.1% 70 22.8% 149 44.9%
Under $72,000 54 20.8% 77 36.0% 131 56.7%
$72,000 to $107,999 19 21.4% 23 22.4% 42 43.8%
$108,000 and over 28 24.3% 17 17.6% 45 42.0%
Not Stated 11 14.5% 13 23.3% 24 37.7%
Race
Education
Income
Blood Cholesterol
At increased risk of
high cholesterol
(measurement in
borderline high
cholesterol range)
High cholesterol
(measurement in high
cholesterol range) or
currently on
medication for high
cholesterol
Has high cholesterol or
is at increased risk for
high cholesterol
Gender
Age
Health Survey of Adults in Bermuda 2014
51
Discussion STEPS to a Well Bermuda is the first population study of its type conducted in Bermuda. Unlike prior studies, it
included both subjective self-reported information and objective measurements of height, weight, blood pressure,
blood glucose and total cholesterol. In addition, it offered greater opportunity for clarification through the use of
show cards. While these features presented some challenges, they added a new dimension to health surveying in
Bermuda.
Of the findings, most notable was the documented prevalence of overweight and obesity. The objective
measurement indicated the three in four persons are overweight or obese. As overweight and obesity is a health
condition in and of itself and a risk factor for other non-communicable diseases, this further emphasizes that it is a
public health priority. Given the high prevalence of other risk factors that contribute to overweight and obesity,
and other chronic non-communicable diseases, these risk factors must be addressed. For example, less than one in
five adults consume the recommended number of servings of fruits and vegetables and over a quarter of adults do
not meet the World Health Organization recommendation for physical activity.
Also of note are the socioeconomic disparities and age distribution differences seen in some of the key risk factors.
Adults with higher education and/or higher income were more likely to eat the recommended number of servings
of fruits and vegetables and to engage in recreational physical activity. They were also more likely to have major
health coverage and less likely to have three or more non-communicable disease risk factors. Risk factors and non-
communicable diseases that have historically been more commonly seen in seniors (aged 65 years and older) are
now being seen at similar rates in older working-aged adults (aged 55-64 years). These include similar rates of high
blood pressure, high cholesterol, and cardiovascular disease and nearing similar rates of diabetes. On the other
end of the spectrum, younger adults are more likely to drink alcohol, binge drink and use tobacco. These age shifts
and differences have implications for the future productivity of the workforce.
Overall, the results of STEPS to a Well Bermuda indicate that the principles of health promotion as set out in the
Ottawa Charter for Health Promotion must continue to be used:
Build healthy public policy
Create supportive environments
Strengthen community actions
Develop personal skills
Reorient health services
Build alliances
Through effective and collaborative health promotion, the prevalence of these risk factors and associated chronic
non-communicable diseases can be halted and reduced and the inequalities can be narrowed allowing for
achievement of a Well Bermuda for all.
Health Survey of Adults in Bermuda 2014
52
Conclusion
STEPS to a Well Bermuda: Health Survey of Adults in Bermuda 2014 clearly shows that the common non-
communicable disease risk factors of poor dietary habits, physical inactivity and overweight and obesity are indeed
all too common in our population. This is concerning as the risk factors of today are the diseases of tomorrow. As
with all public health problems, these risk factors and their associated chronic non-communicable diseases, such as
heart disease, diabetes, and cancer, threaten the wellbeing of Bermuda’s community and economy. As stated in
Well Bermuda: A National Health Promotion Strategy (2008), “health has a value in itself as it is essential to ensure
quality of life for children, adults and seniors but, additionally, a healthy population is fundamental to ensure a
capable workforce and future capacity”. It is therefore essential that through Well Bermuda partnerships these risk
factors are addressed in alignment with the vision of the Department of Health: “Healthy people in healthy
communities”. Additionally, all residents have a responsibility to join with the efforts of public health by taking
charge of their individual health. We all must work together to make steps to a Well Bermuda.
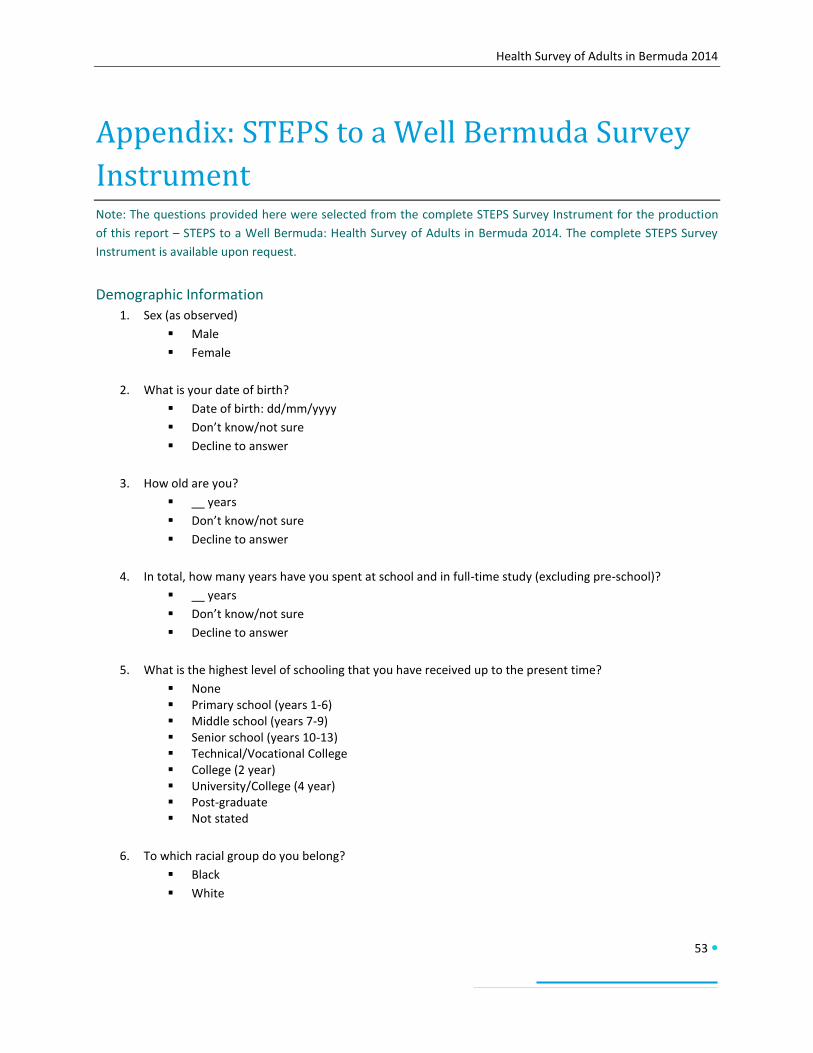
Health Survey of Adults in Bermuda 2014
53
Appendix: STEPS to a Well Bermuda Survey
Instrument Note: The questions provided here were selected from the complete STEPS Survey Instrument for the production
of this report – STEPS to a Well Bermuda: Health Survey of Adults in Bermuda 2014. The complete STEPS Survey
Instrument is available upon request.
Demographic Information 1. Sex (as observed)
Male
Female
2. What is your date of birth?
Date of birth: dd/mm/yyyy
Don’t know/not sure
Decline to answer
3. How old are you?
__ years
Don’t know/not sure
Decline to answer
4. In total, how many years have you spent at school and in full-time study (excluding pre-school)?
__ years
Don’t know/not sure
Decline to answer
5. What is the highest level of schooling that you have received up to the present time?
None Primary school (years 1-6) Middle school (years 7-9) Senior school (years 10-13) Technical/Vocational College College (2 year) University/College (4 year) Post-graduate Not stated
6. To which racial group do you belong?
Black
White
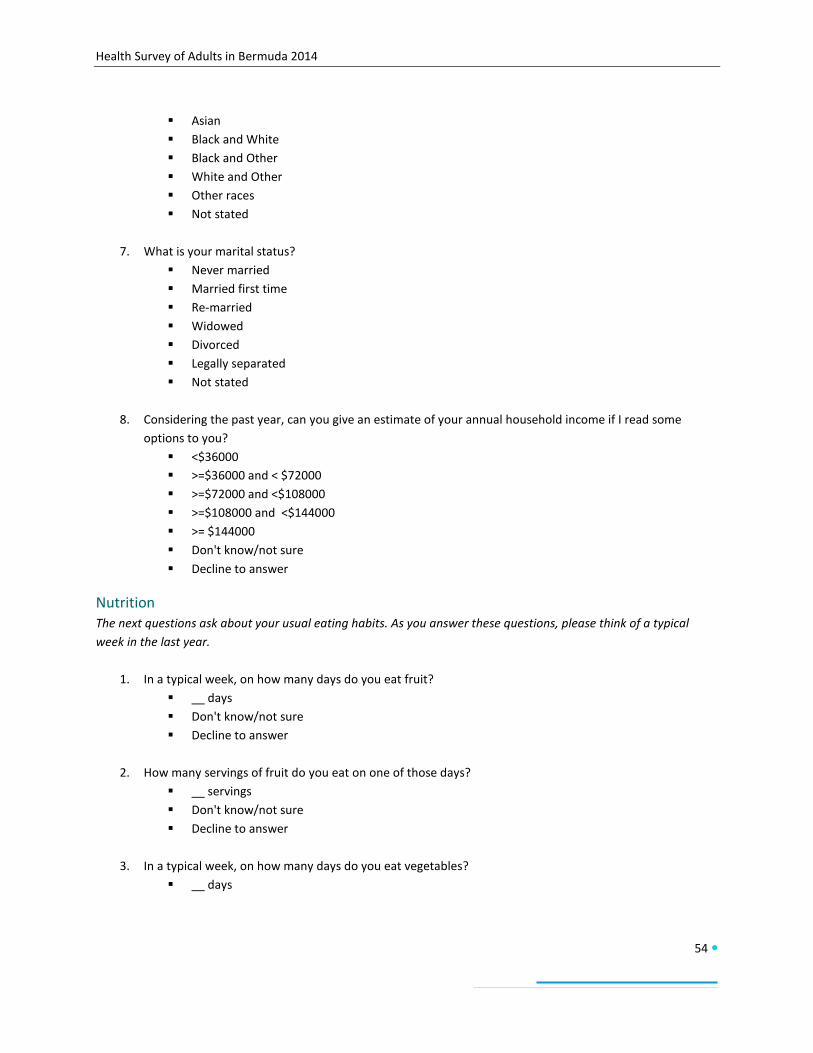
Health Survey of Adults in Bermuda 2014
54
Asian
Black and White
Black and Other
White and Other
Other races
Not stated
7. What is your marital status?
Never married
Married first time
Re-married
Widowed
Divorced
Legally separated
Not stated
8. Considering the past year, can you give an estimate of your annual household income if I read some
options to you?
<$36000
>=$36000 and < $72000
>=$72000 and <$108000
>=$108000 and <$144000
>= $144000
Don't know/not sure
Decline to answer
Nutrition The next questions ask about your usual eating habits. As you answer these questions, please think of a typical
week in the last year.
1. In a typical week, on how many days do you eat fruit?
__ days
Don't know/not sure
Decline to answer
2. How many servings of fruit do you eat on one of those days?
__ servings
Don't know/not sure
Decline to answer
3. In a typical week, on how many days do you eat vegetables?
__ days
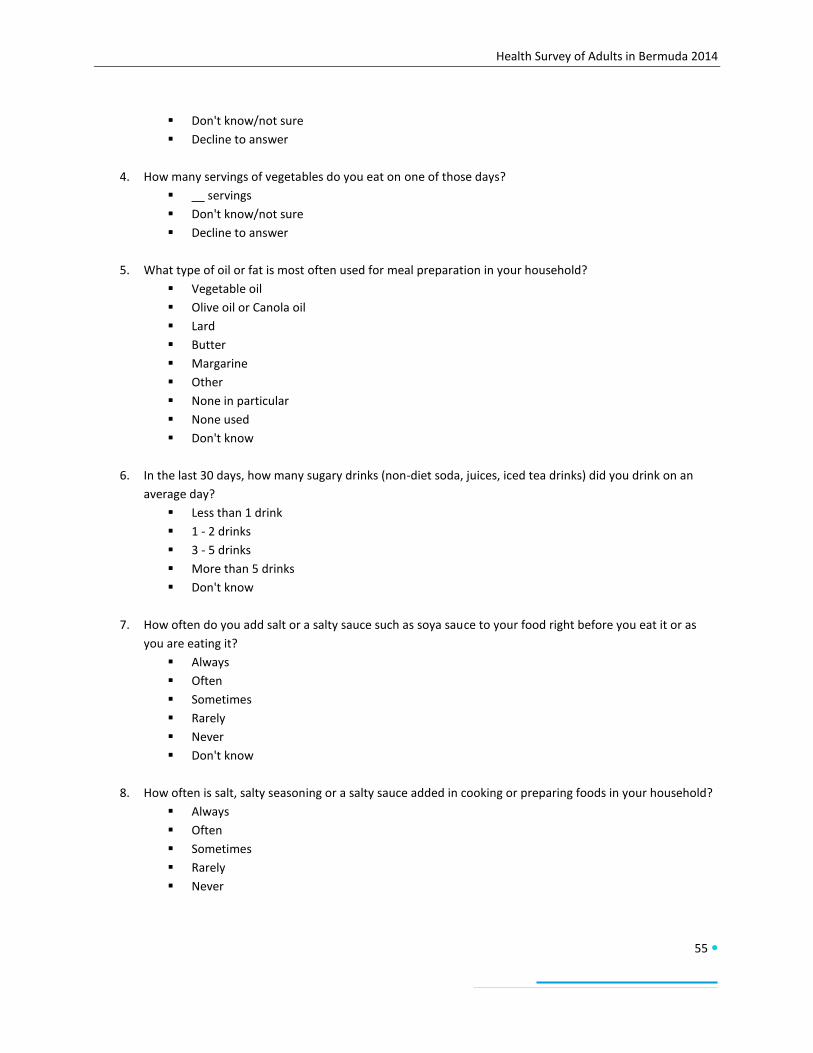
Health Survey of Adults in Bermuda 2014
55
Don't know/not sure
Decline to answer
4. How many servings of vegetables do you eat on one of those days?
__ servings
Don't know/not sure
Decline to answer
5. What type of oil or fat is most often used for meal preparation in your household?
Vegetable oil
Olive oil or Canola oil
Lard
Butter
Margarine
Other
None in particular
None used
Don't know
6. In the last 30 days, how many sugary drinks (non-diet soda, juices, iced tea drinks) did you drink on an
average day?
Less than 1 drink
1 - 2 drinks
3 - 5 drinks
More than 5 drinks
Don't know
7. How often do you add salt or a salty sauce such as soya sauce to your food right before you eat it or as
you are eating it?
Always
Often
Sometimes
Rarely
Never
Don't know
8. How often is salt, salty seasoning or a salty sauce added in cooking or preparing foods in your household?
Always
Often
Sometimes
Rarely
Never
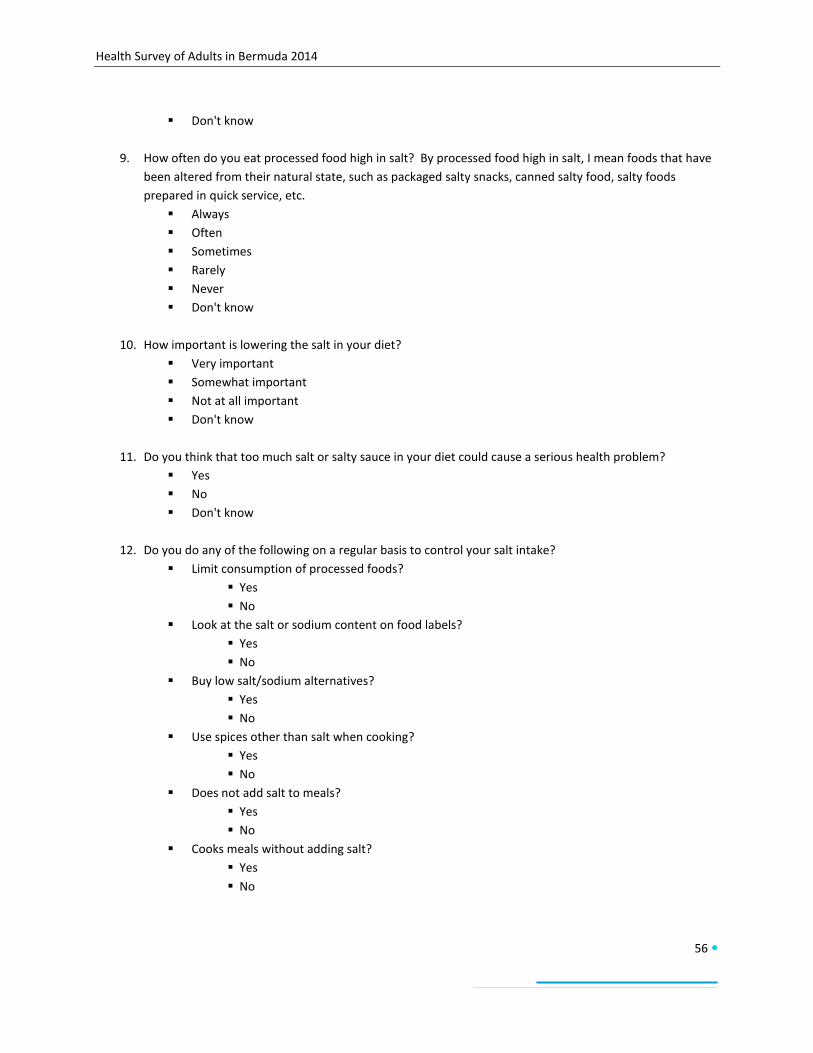
Health Survey of Adults in Bermuda 2014
56
Don't know
9. How often do you eat processed food high in salt? By processed food high in salt, I mean foods that have
been altered from their natural state, such as packaged salty snacks, canned salty food, salty foods
prepared in quick service, etc.
Always
Often
Sometimes
Rarely
Never
Don't know
10. How important is lowering the salt in your diet?
Very important
Somewhat important
Not at all important
Don't know
11. Do you think that too much salt or salty sauce in your diet could cause a serious health problem?
Yes
No
Don't know
12. Do you do any of the following on a regular basis to control your salt intake?
Limit consumption of processed foods?
Yes
No
Look at the salt or sodium content on food labels?
Yes
No
Buy low salt/sodium alternatives?
Yes
No
Use spices other than salt when cooking?
Yes
No
Does not add salt to meals?
Yes
No
Cooks meals without adding salt?
Yes
No
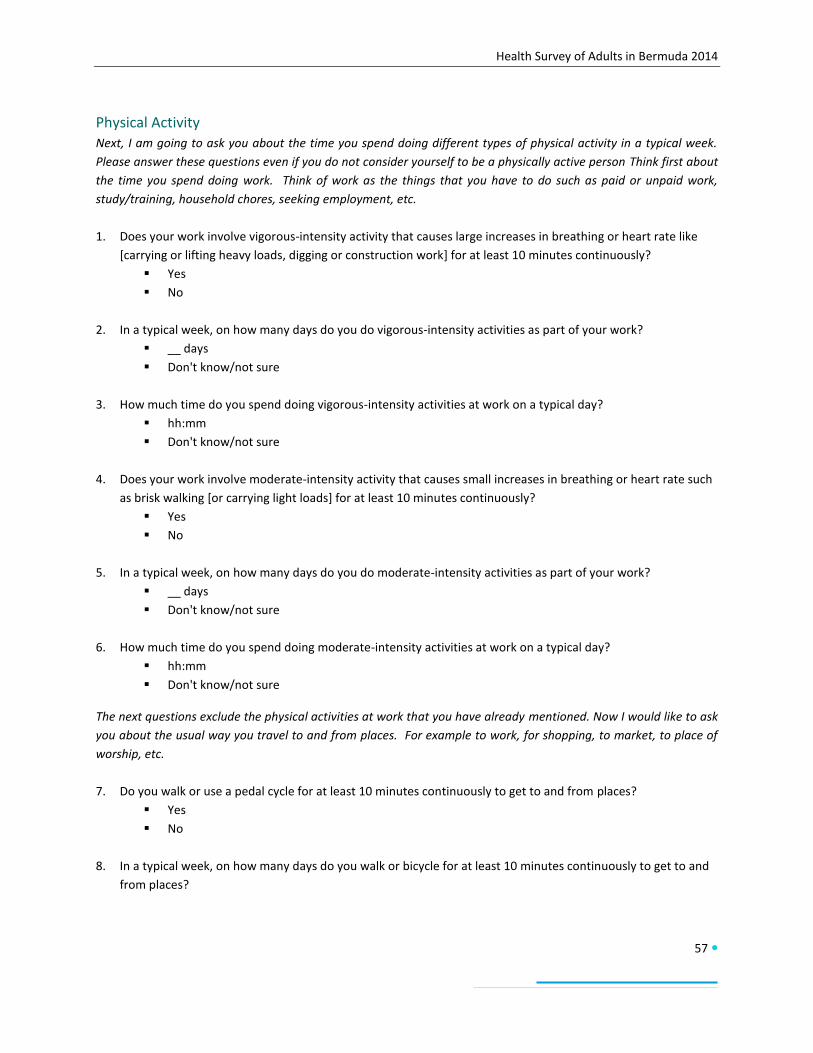
Health Survey of Adults in Bermuda 2014
57
Physical Activity Next, I am going to ask you about the time you spend doing different types of physical activity in a typical week.
Please answer these questions even if you do not consider yourself to be a physically active person Think first about
the time you spend doing work. Think of work as the things that you have to do such as paid or unpaid work,
study/training, household chores, seeking employment, etc.
1. Does your work involve vigorous-intensity activity that causes large increases in breathing or heart rate like
[carrying or lifting heavy loads, digging or construction work] for at least 10 minutes continuously?
Yes
No
2. In a typical week, on how many days do you do vigorous-intensity activities as part of your work?
__ days
Don't know/not sure
3. How much time do you spend doing vigorous-intensity activities at work on a typical day?
hh:mm
Don't know/not sure
4. Does your work involve moderate-intensity activity that causes small increases in breathing or heart rate such
as brisk walking [or carrying light loads] for at least 10 minutes continuously?
Yes
No
5. In a typical week, on how many days do you do moderate-intensity activities as part of your work?
__ days
Don't know/not sure
6. How much time do you spend doing moderate-intensity activities at work on a typical day?
hh:mm
Don't know/not sure
The next questions exclude the physical activities at work that you have already mentioned. Now I would like to ask
you about the usual way you travel to and from places. For example to work, for shopping, to market, to place of
worship, etc.
7. Do you walk or use a pedal cycle for at least 10 minutes continuously to get to and from places?
Yes
No
8. In a typical week, on how many days do you walk or bicycle for at least 10 minutes continuously to get to and
from places?
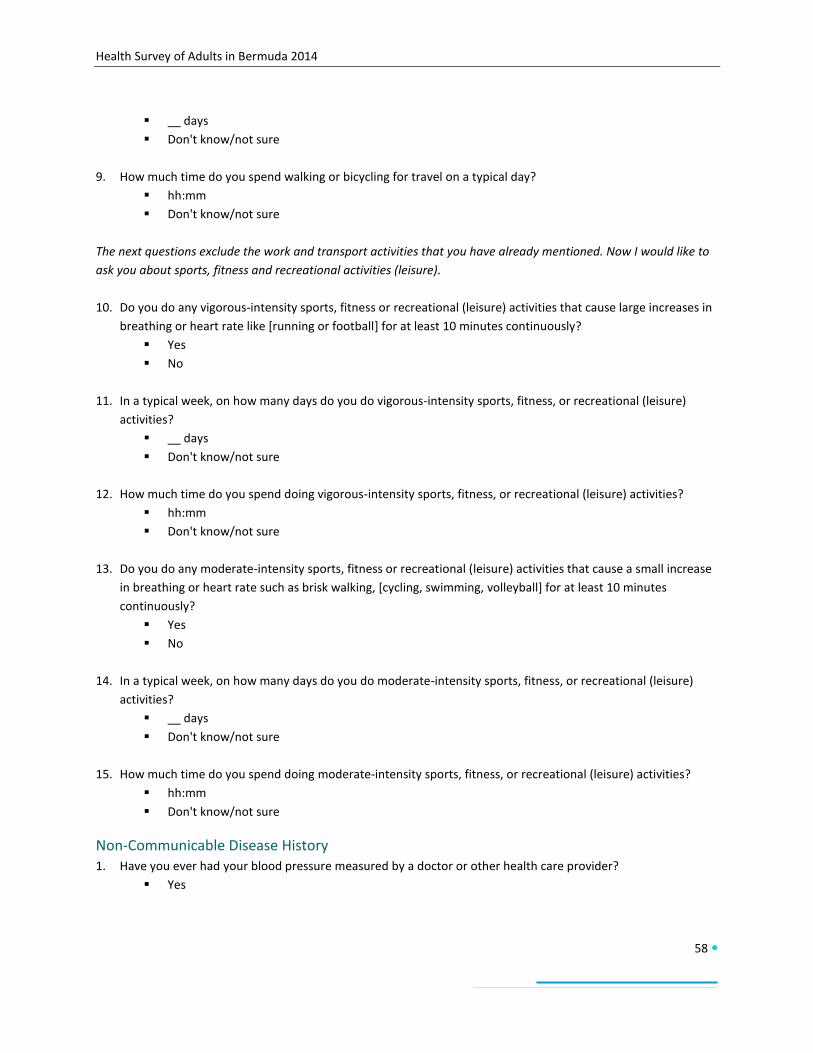
Health Survey of Adults in Bermuda 2014
58
__ days
Don't know/not sure
9. How much time do you spend walking or bicycling for travel on a typical day?
hh:mm
Don't know/not sure
The next questions exclude the work and transport activities that you have already mentioned. Now I would like to
ask you about sports, fitness and recreational activities (leisure).
10. Do you do any vigorous-intensity sports, fitness or recreational (leisure) activities that cause large increases in
breathing or heart rate like [running or football] for at least 10 minutes continuously?
Yes
No
11. In a typical week, on how many days do you do vigorous-intensity sports, fitness, or recreational (leisure)
activities?
__ days
Don't know/not sure
12. How much time do you spend doing vigorous-intensity sports, fitness, or recreational (leisure) activities?
hh:mm
Don't know/not sure
13. Do you do any moderate-intensity sports, fitness or recreational (leisure) activities that cause a small increase
in breathing or heart rate such as brisk walking, [cycling, swimming, volleyball] for at least 10 minutes
continuously?
Yes
No
14. In a typical week, on how many days do you do moderate-intensity sports, fitness, or recreational (leisure)
activities?
__ days
Don't know/not sure
15. How much time do you spend doing moderate-intensity sports, fitness, or recreational (leisure) activities?
hh:mm
Don't know/not sure
Non-Communicable Disease History 1. Have you ever had your blood pressure measured by a doctor or other health care provider?
Yes
Health Survey of Adults in Bermuda 2014
59
No
2. Have you ever been told by a doctor or other health care provider that you have raised blood pressure or
hypertension?
Yes
No
3. In the past two weeks, have you taken any medication for raised blood pressure prescribed by a doctor or
other health care provider?
Yes
No
4. Have you ever had your blood sugar measured by a doctor or other health care provider?
Yes
No
5. Have you ever been told by a doctor or other health care provider that you have raised blood sugar or
diabetes?
Yes
No
6. In the past two weeks, have you taken any medication diabetes prescribed by a doctor or other health care
provider?
Yes
No
7. Are you currently taking insulin for diabetes prescribed by a doctor or other health worker?
Yes
No
8. When was the last time your eyes were examined as part of your diabetes control?
Within the past 2 years
More than 2 years ago
Never
Don’t know
9. When was the last time your feet were examined as part of your diabetes control?
Within the past year
More than 1 year ago
Never
Don’t know
Health Survey of Adults in Bermuda 2014
60
10. Have you ever had your cholesterol (fat levels in your blood) measured by a doctor or other health care
provider?
Yes
No
11. Have you ever been told by a doctor or other health care provider that you have raised cholesterol?
Yes
No
12. In the past two weeks, have you taken any medication for raised total cholesterol prescribed by a doctor or
other health care provider?
Yes
No
13. Have you ever had a heart attack or chest pain from heart disease (angina) or a stroke (cerebrovascular
accident or incident)?
Yes
No
14. Are you currently taking aspirin regularly to prevent or treat heart disease?
Yes
No
15. Are you currently taking statins (Lovastatin/Simvastatin/Atorvastatin or any other statin) regularly to prevent
or treat heart disease?
Yes
No
16. During the past three years, has a doctor or other health care provider advised you to do any of the following?
Quit using tobacco or don't start?
Yes
No
Reduce salt in your diet?
Yes
No
Eat at least five servings of fruit and/or vegetables each day?
Yes
No
Reduce fat in your diet?
Yes
No
Start or do more physical activity?
Health Survey of Adults in Bermuda 2014
61
Yes
No
Maintain a healthy body weight or lose weight?
Yes
No
17. Have any of your immediate family members been diagnosed with the following diseases?
Diabetes or raised blood sugar?
Yes
No
Raised blood pressure?
Yes
No
Stroke?
Yes
No
Cancer or malignant tumour?
Yes
No
Raised cholesterol?
Yes
No
Early heart attack (below age 55 for men and below age 65 for women)?
Yes
No
Alcohol Consumption 1. Have you ever consumed an alcoholic drink such as beer, wine, spirits, coolers, etc.? USE SHOWCARD. If
necessary, ask the participant to think of any drinks that contain alcohol, with the exception of alcohol-based
medication that is taken due to health reasons.
Yes
No
2. Have you consumed any alcohol within the past 30 days?
Yes
No
3. During the past 30 days, on how many occasions did you have at least one standard alcoholic drink?
__ days
Don't know/not sure
Health Survey of Adults in Bermuda 2014
62
4. During the past 30 days, when you drank alcohol, how many standard drinks on average did you have during
one drinking occasion?
__ drinks
Don't know/not sure
5. During the past 30 days, what was the largest number of standard drinks you had on a single occasion,
counting all types of alcoholic drinks together?
__ drinks
Don't know/not sure
Tobacco Use 1. Do you currently smoke any tobacco products, such as cigarettes, cigars or pipes?
Yes
No
2. Do you currently smoke tobacco products daily?
Yes
No
3. During the past 12 months, have you tried to stop smoking?
Yes
No
4. During any visit to a doctor or other health care provider in the past 12 months, were advised to quit smoking
tobacco?
Yes
No
5. In the past, did you ever smoke any tobacco products?
Yes
No
6. During the past 7 days, did someone smoke in your home?
Yes
No
7. During the past 7 days, did someone smoke in closed areas in your workplace (in the building, in a work area
or a specific office)?
Yes
No
Health Survey of Adults in Bermuda 2014
63
Health Care Next, I am going to ask you about your health insurance coverage and your use of health services in relation to any
non-communicable disease (NCD) you may have. NCDs include cardiovascular diseases (such as heart diseases,
cerebrovascular disease and stroke, peripheral arterial disease, and deep vein thrombosis and pulmonary
embolism), cancers, chronic respiratory diseases (such as asthma, chronic obstructive pulmonary disease,
occupational lung diseases or pulmonary hypertension) and diabetes. Please provide information about your
current health insurance coverage. Health insurance coverage means being enrolled with an organization that pays
for health care costs if you get sick or injured.
1. Do you currently have health insurance?
Yes
No (Go to Q3)
2. Which response best describes your health insurance coverage by a Government or private plan?
Major Health Coverage (Private or GEHI)
Only Private Basic Health Coverage
Only Government's HIP
Only FutureCare
Has insurance but doesn't know what type
Not stated
3. What is the main reason that you do not have health insurance?
Unable to afford it
Don't need it
Employer does not provide it
Other
4. Have you ever had or do you currently have a non-communicable disease (NCD) such as cardiovascular disease
including heart disease and stroke, cancer, chronic respiratory disease, or diabetes?
Yes
No
5. During the past 30 days, have you visited any health care facility due to an NCD you have? Please exclude any
hospitalization.
Yes
No
6. During the past 12 months, have you been hospitalized due to an NCD?
Yes
No
7. During the past 30 days, has a family member or friend provided care for you at home due to your NCD?
Health Survey of Adults in Bermuda 2014
64
Yes
No
8. During the past 30 days, have you missed any time of your usual activity (work, work at home, study) due to
an NCD?
Yes
No
Physical Measurements [Record first measurement after the participant has rested for 15 minutes. Ask the participant to rest for 3 minutes
before taking second measurement. Ask the participant to rest for another 3 minutes before taking the third
measurement.]
1. Blood pressure reading 1:
___ systolic
___ diastolic
2. Blood pressure reading 2:
___ systolic
___ diastolic
3. Blood pressure reading 3:
___ systolic
___ diastolic
4. For women of reproductive age: Are you pregnant?
Yes
No
5. Height:
___ inches
6. Weight:
___ pounds
[Provide Participant Feedback Form with results.]
Biochemical Measurements 1. During the past 12 hours, have you had anything to eat or drink, other than water?
Yes (If yes, reschedule and explain fasting procedure.)
No
Health Survey of Adults in Bermuda 2014
65
2. Fasting blood glucose
___ mg/dL
3. Total cholesterol
___ mg/dL
[Provide Participant Feedback Form with results.]
Health Survey of Adults in Bermuda 2014
66
References
Attride-Stirling, J. (2008) Well Bermuda: A National Health Promotion Strategy (2nd Ed.). Government of Bermuda:
Department of Health.
Department of Health (2007) Health Survey of Adults and Children in Bermuda 2006. Government of Bermuda.
Department of Health (2007) Well Bermuda Study 2007. Government of Bermuda.
Department of Statistics (2014) Bermuda’s Population Projections 2010 – 2020. Government of Bermuda.
Department of Statistics (2012)Report on the 2010 Census on Population and Housing. Government of Bermuda.
Mindmaps Ltd. (2011) Health Survey of Adults in Bermuda 2011. Bermuda Health Council and Ministry of Health:
Bermuda
World Health Organization (1986). Ottawa Charter for Health Promotion. Geneva, World Health Organization.
World Health Organization (2005). WHO STEPS Surveillance Manual: The WHO STEPwise approach to chronic
disease risk factor surveillance. Geneva, World Health Organization.


Design and Prepress: Department of Communication and InformationPrinted in Bermuda by: Bermuda Blueprinting – January 2016