STEP File Analyzer User's Guide (Version 2) STEP File Analyzer might not be up-to-date with the most...
43
NISTIR 7999 STEP File Analyzer User’s Guide (Version 2) Robert R. Lipman http://dx.doi.org/10.6028/NIST.IR.7999
Transcript of STEP File Analyzer User's Guide (Version 2) STEP File Analyzer might not be up-to-date with the most...

NISTIR 7999
STEP File Analyzer User’s Guide (Version 2)
Robert R. Lipman
http://dx.doi.org/10.6028/NIST.IR.7999

NISTIR 7999
STEP File Analyzer User’s Guide (Version 2)
Robert R. Lipman
Systems Integration Division Engineering Laboratory
http://dx.doi.org/10.6028/NIST.IR.7999
April 2014
U.S. Department of Commerce Penny Pritzker, Secretary
National Institute of Standards and Technology
Patrick D. Gallagher, Under Secretary of Commerce for Standards and Technology and Director

ii
PREFACE This guide describes how to use the STEP File Analyzer, a software tool that analyzes and generates a spreadsheet from a STEP (STandard for the Exchange of Product model data) file. The spreadsheets simplify inspecting information in the STEP file at an entity and attribute level. STEP files can also be checked for conformance to recommended practices for semantic PMI, graphical PMI, and validation properties. More information about the STEP File Analyzer and supplemental documentation can be found at http://www.nist.gov/el/msid/infotest/step-file-analyzer.cfm. The STEP File Analyzer was developed as part of the Model-Based Engineering (MBE) project in the Engineering Laboratory’s former Systems Integration for Manufacturing and Construction Applications Program (SIMCA) and was first released in 2012. DISCLAIMERS The STEP File Analyzer might not be up-to-date with the most recent recommended practices specified by the CAx Implementor’s Forum. The software might also not check STEP files for conformance to every aspect of a recommended practice. Any mention of commercial products in the STEP File Analyzer and this user’s guide is for information purposes only; it does not imply recommendation or endorsement by NIST. For any of the web links in the software and this user’s guide, NIST does not necessarily endorse the views expressed, or concur with the facts presented on those web sites. This software was developed at the National Institute of Standards and Technology by employees of the Federal Government in the course of their official duties. Pursuant to Title 17 Section 105 of the United States Code this software is not subject to copyright protection and is in the public domain. This software is an experimental system. NIST assumes no responsibility whatsoever for its use by other parties, and makes no guarantees, expressed or implied, about its quality, reliability, or any other characteristic. This software can be redistributed and/or modified freely provided that any derivative works bear some notice that they are derived from it, and any modified versions bear some notice that they have been modified. We would appreciate acknowledgement if the software is used. ACKNOWLEDGEMENTS The author thanks Dr. Kent Reed, former leader of the NIST Computer Integrated Building Process Group, for his guidance in the development of the IFC File Analyzer (http://www.nist.gov/el/msid/infotest/ifc-file-analyzer.cfm) on which the STEP File Analyzer is based. The author also acknowledges the many software vendors and users who have provided invaluable feedback, suggestions, and bug reports about the software and supplied sample STEP files that were used to test and improve the capabilities of the software. Cover image: Part with PMI annotations.
iii
TABLE OF CONTENTS
1 INTRODUCTION ............................................................................................................................... 1
2 GETTING STARTED ......................................................................................................................... 2
2.1 INSTALLING THE STEP FILE ANALYZER ........................................................................................ 2 2.2 RUNNING THE STEP FILE ANALYZER ............................................................................................ 2
2.2.1 Installing the IFCsvr toolkit .................................................................................................... 3 2.3 GENERATING A SPREADSHEET FROM A STEP FILE ......................................................................... 4 2.4 RECOVERING FROM A CRASH OF THE STEP FILE ANALYZER ........................................................ 4 2.5 UNINSTALLING THE STEP FILE ANALYZER ................................................................................... 4
3 USER INTERFACE ............................................................................................................................ 5
3.1 MENU BAR ...................................................................................................................................... 6 3.1.1 File Menu ................................................................................................................................ 6 3.1.2 Websites Menu ........................................................................................................................ 7 3.1.3 Help Menu ............................................................................................................................... 7
3.2 TABS BAR ....................................................................................................................................... 8 3.3 STATUS TAB (FEEDBACK) .............................................................................................................. 8
4 SAMPLE WORKSHEETS ................................................................................................................. 9
4.1 SUMMARY WORKSHEET ................................................................................................................. 9 4.2 ENTITY WORKSHEETS .................................................................................................................. 10
5 OPTIONS TAB .................................................................................................................................. 11
5.1 SELECTIVELY PROCESS ENTITY TYPES ........................................................................................ 11 5.2 RECOMMENDED PRACTICE REPORTS ........................................................................................... 12
5.2.1 Semantic PMI Representation ............................................................................................... 12 5.2.1.1 Limitations of Reconstructing the Visual Presentation of Semantic PMI ........................................................ 19
5.2.2 Graphical PMI Presentation ................................................................................................. 19 5.2.3 Validation Properties ............................................................................................................ 21
5.3 INVERSE RELATIONSHIPS AND USED IN ....................................................................................... 24 5.4 DISPLAY A STEP FILE IN OTHER APPLICATIONS ......................................................................... 26
5.4.1 Indent STEP File ................................................................................................................... 26
6 SPREADSHEET TAB ....................................................................................................................... 27
6.1 GENERATING TABLES ................................................................................................................... 28 6.2 ROUNDING NUMBERS ................................................................................................................... 28 6.3 MAXIMUM ROWS .......................................................................................................................... 29 6.4 OTHER OPTIONS ........................................................................................................................... 29
7 PROCESSING MULTIPLE STEP FILES...................................................................................... 30
7.1 SUMMARY WORKSHEET ............................................................................................................... 30 7.2 COVERAGE ANALYSIS WORKSHEETS ........................................................................................... 32
8 CRASH RECOVERY ....................................................................................................................... 34
9 COMMAND-LINE VERSION ......................................................................................................... 36
10 REFERENCES ............................................................................................................................... 38
iv
LIST OF FIGURES Figure 1: IFCsvr installation dialogs ............................................................................................................. 3 Figure 2: What to do if the STEP File Analyzer crashes .............................................................................. 4 Figure 3: STEP File Analyzer user interface ................................................................................................ 5 Figure 4: File menu ....................................................................................................................................... 6 Figure 5: Websites menu .............................................................................................................................. 7 Figure 6: Help menu ..................................................................................................................................... 7 Figure 7: Tooltip help ................................................................................................................................... 8 Figure 8: Summary worksheet ...................................................................................................................... 9 Figure 9: Entity worksheet (datum_system) ............................................................................................... 10 Figure 10: Entity worksheet (draughting_model) ....................................................................................... 10 Figure 11: Entity worksheet (b_spline_surface_with_knots) ..................................................................... 10 Figure 12: Options tab ................................................................................................................................ 11 Figure 13: Tooltip help for GD&T entities ................................................................................................. 12 Figure 14: Part with typical PMI annotations ............................................................................................. 13 Figure 15: Summary worksheet showing highlighted entities with semantic PMI ..................................... 14 Figure 16: Semantic PMI example (dimensional_characteristic_representation) for dimensional tolerance .................................................................................................................................................................... 16 Figure 17: Semantic PMI example (datum_system) for datum reference frames ....................................... 17 Figure 18: Semantic PMI example for a flatness tolerance with reference to a datum feature ................... 17 Figure 19: Semantic PMI example for position tolerance with reference to datum feature and dimensional tolerance ...................................................................................................................................................... 17 Figure 20: Semantic PMI Summary worksheet .......................................................................................... 18 Figure 21: Flatness tolerance and datum feature......................................................................................... 19 Figure 22: Graphical PMI example (annotation_occurrence) ..................................................................... 20 Figure 23: VRML generated from graphical PMI ...................................................................................... 21 Figure 24: Validation properties example (property_definition) ................................................................ 22 Figure 25: Validation properties example with expanded columns ............................................................ 22 Figure 26: More validation property examples ........................................................................................... 23 Figure 27: Entity worksheet (shape_aspect_relationship) .......................................................................... 24 Figure 28: Inverse Relationships and Used In example .............................................................................. 25 Figure 29: Display STEP File in Other Applications.................................................................................. 26 Figure 30: Indented STEP file .................................................................................................................... 26 Figure 31: Spreadsheet tab .......................................................................................................................... 27 Figure 32: Entity worksheet (shape_aspect_relationship) with tables ........................................................ 28 Figure 33: Circle entity worksheet, with rounding (left) and without rounding (right) .............................. 28 Figure 34: Maximum rows example (cartesian_point) ............................................................................... 29 Figure 35: File Summary worksheet when processing multiple STEP files ............................................... 31 Figure 36: Graphical PMI Coverage Analysis worksheet........................................................................... 32 Figure 37: Semantic PMI Coverage Analysis worksheet ........................................................................... 33 Figure 38: Dialogs that might be displayed when the STEP File Analyzer crashes ................................... 34 Figure 39: Determining which entity in the STEP File Analyzer caused a crash ....................................... 35 Figure 40: Feedback when running the command-line version .................................................................. 37

1
1 Introduction This guide describes how to use the STEP File Analyzer, a software tool that analyzes and generates a spreadsheet from a STEP (ISO 10303 – informally known as the STandard for Exchange of Product model data) [1,2,3] file. The spreadsheets simplify inspecting information from the STEP file at an entity and attribute level. In this report a “STEP file” refers to a file that is exported by CAD (Computer-Aided Design) software in a format described by ISO 10303-21 [4] and typically known as a Part 21 file. Typical STEP file viewers show a 3D visualization of the part or model represented by the STEP file. The viewers usually have a high-level hierarchical display of the information in the STEP file where the user can drill down to individual attributes of parts. However, there is no way to view all of the actual STEP entities and their attributes at once. The STEP File Analyzer provides this capability by creating a spreadsheet from the STEP file (section 4). The STEP File Analyzer also checks for conformance to recommended practices for semantic PMI (Product and Manufacturing Information), graphical PMI, and validation properties (section 5.2) [5]. Recommended practices are defined by the CAx Implementor Forum (CAx-IF). The objective of the CAx-IF is to advance CAx (mainly Computer-Aided Design, Engineering, and Manufacturing) software system translator development and to ensure that user requirements for interoperability are satisfied [6]. Semantic PMI includes all information necessary to represent GD&T without any graphical presentation elements, although an importing CAD system can attempt to recreate the visual presentation of the annotation. Product and manufacturing information may include geometric dimensions and tolerances (GD&T), 3D text annotations, surface finish, and material specifications. Graphical PMI presents GD&T annotations as a visual representation of geometric elements such as lines and arcs as part of the CAD model. The validation properties include geometric, PMI, assembly, annotation, attribute, and tessellated validation properties. The STEP File Analyzer supports current and many older versions of the following STEP Application Protocols (AP). An AP is the implementable part of ISO 10303 on which translators are based on in a particular engineering domain.
• AP203 – Configuration Controlled 3D Design of Mechanical Parts and Assemblies [7] • AP209 – Structural Analysis Design [8] • AP210 – Electronic Assembly Interconnect and Packaging Design [9] • AP214 – Automotive Design [10] • AP242 – Managed Model Based 3D Engineering [11, 12, 13]
2
2 Getting Started
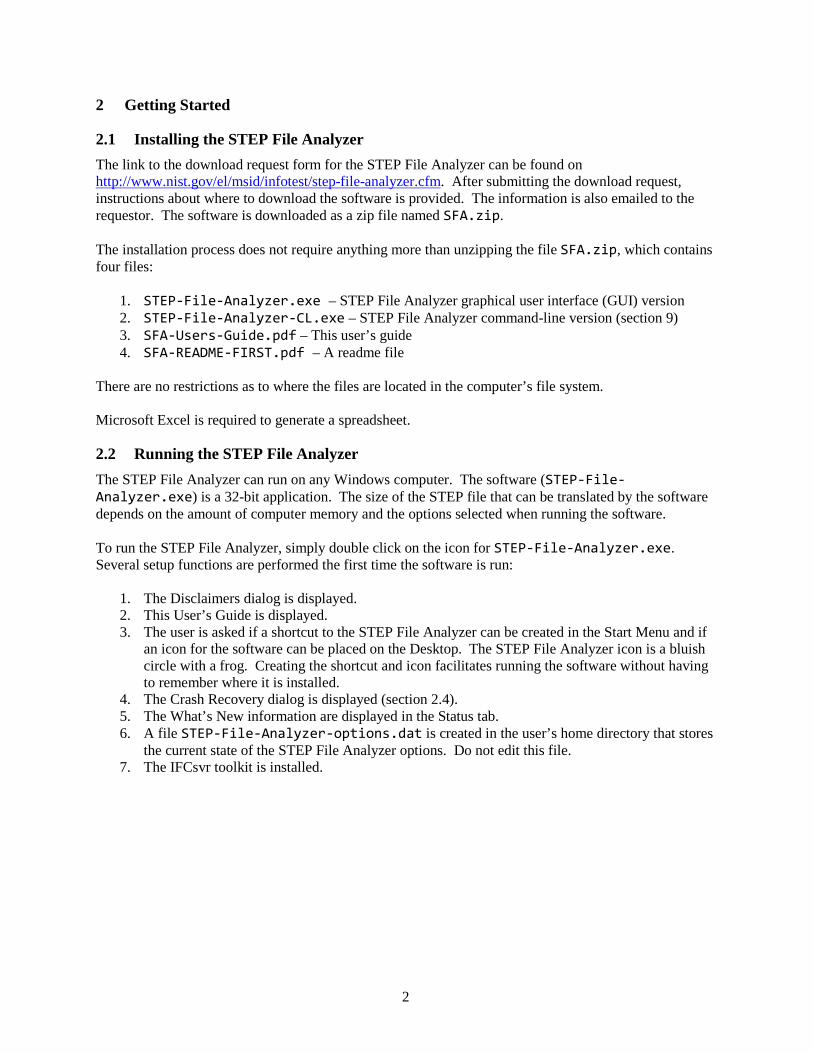
2.1 Installing the STEP File Analyzer The link to the download request form for the STEP File Analyzer can be found on http://www.nist.gov/el/msid/infotest/step-file-analyzer.cfm. After submitting the download request, instructions about where to download the software is provided. The information is also emailed to the requestor. The software is downloaded as a zip file named SFA.zip. The installation process does not require anything more than unzipping the file SFA.zip, which contains four files:
1. STEP-File-Analyzer.exe – STEP File Analyzer graphical user interface (GUI) version 2. STEP-File-Analyzer-CL.exe – STEP File Analyzer command-line version (section 9) 3. SFA-Users-Guide.pdf – This user’s guide 4. SFA-README-FIRST.pdf – A readme file
There are no restrictions as to where the files are located in the computer’s file system. Microsoft Excel is required to generate a spreadsheet.
2.2 Running the STEP File Analyzer The STEP File Analyzer can run on any Windows computer. The software (STEP-File-Analyzer.exe) is a 32-bit application. The size of the STEP file that can be translated by the software depends on the amount of computer memory and the options selected when running the software. To run the STEP File Analyzer, simply double click on the icon for STEP-File-Analyzer.exe. Several setup functions are performed the first time the software is run:
1. The Disclaimers dialog is displayed. 2. This User’s Guide is displayed. 3. The user is asked if a shortcut to the STEP File Analyzer can be created in the Start Menu and if
an icon for the software can be placed on the Desktop. The STEP File Analyzer icon is a bluish circle with a frog. Creating the shortcut and icon facilitates running the software without having to remember where it is installed.
4. The Crash Recovery dialog is displayed (section 2.4). 5. The What’s New information are displayed in the Status tab. 6. A file STEP-File-Analyzer-options.dat is created in the user’s home directory that stores
the current state of the STEP File Analyzer options. Do not edit this file. 7. The IFCsvr toolkit is installed.

3
2.2.1 Installing the IFCsvr toolkit The IFCsvr toolkit [14] is used to read and process STEP files1. The installation of the IFCsvr toolkit is simple and straightforward. Two of the installation dialogs are shown in Figure 1. The default installation folder should be used as shown in the second dialog. It is important to let the installation process complete before processing any STEP files with the STEP File Analyzer.
Figure 1: IFCsvr installation dialogs
1 Although the toolkit was originally written to work with IFC (Industry Foundation Classes) data exchange files [15], used in the building and construction industry, it has been adapted to work with STEP files.
4
2.3 Generating a spreadsheet from a STEP file After the IFCsvr toolkit is installed, a spreadsheet can be generated from a STEP file that uses a supported AP. Go to the File menu, select ‘Open STEP File(s)’, select a STEP file on your computer, click Open in the dialog, and then click on the ‘Generate Spreadsheet’ button. Feedback will appear in the Status tab indicating the progress of processing the STEP file. The spreadsheet will be opened after it has been generated.
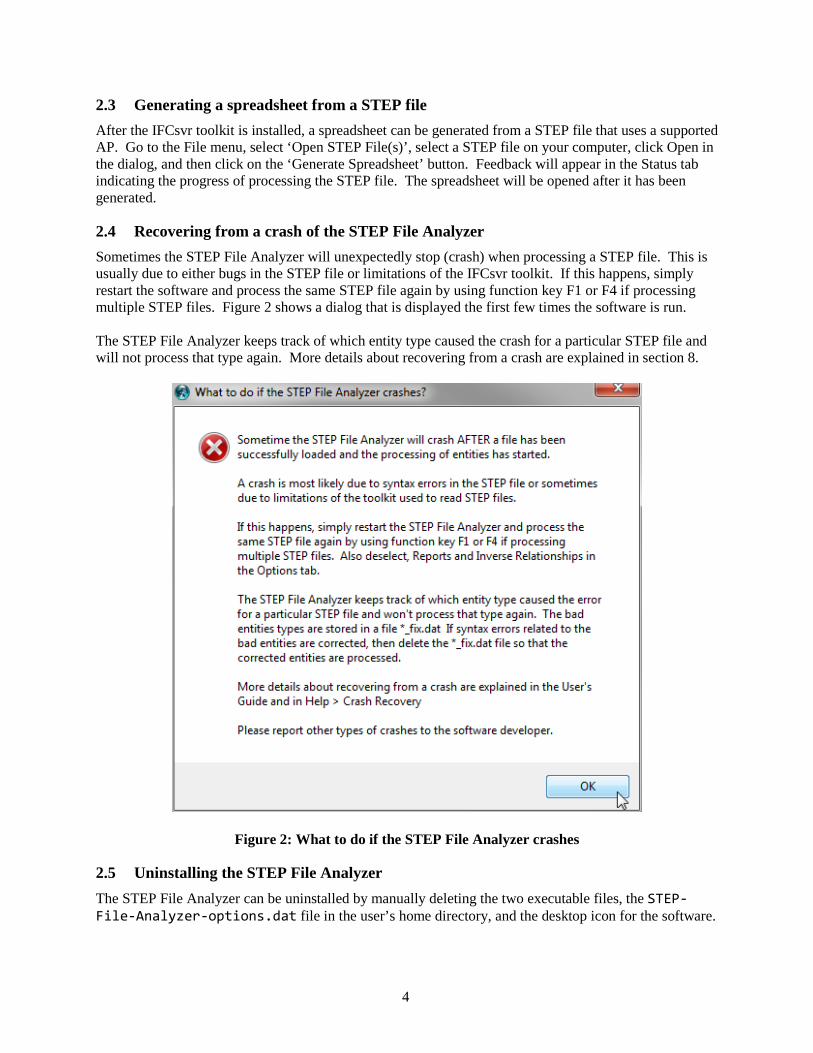
2.4 Recovering from a crash of the STEP File Analyzer Sometimes the STEP File Analyzer will unexpectedly stop (crash) when processing a STEP file. This is usually due to either bugs in the STEP file or limitations of the IFCsvr toolkit. If this happens, simply restart the software and process the same STEP file again by using function key F1 or F4 if processing multiple STEP files. Figure 2 shows a dialog that is displayed the first few times the software is run. The STEP File Analyzer keeps track of which entity type caused the crash for a particular STEP file and will not process that type again. More details about recovering from a crash are explained in section 8.
Figure 2: What to do if the STEP File Analyzer crashes
2.5 Uninstalling the STEP File Analyzer The STEP File Analyzer can be uninstalled by manually deleting the two executable files, the STEP-File-Analyzer-options.dat file in the user’s home directory, and the desktop icon for the software.
5
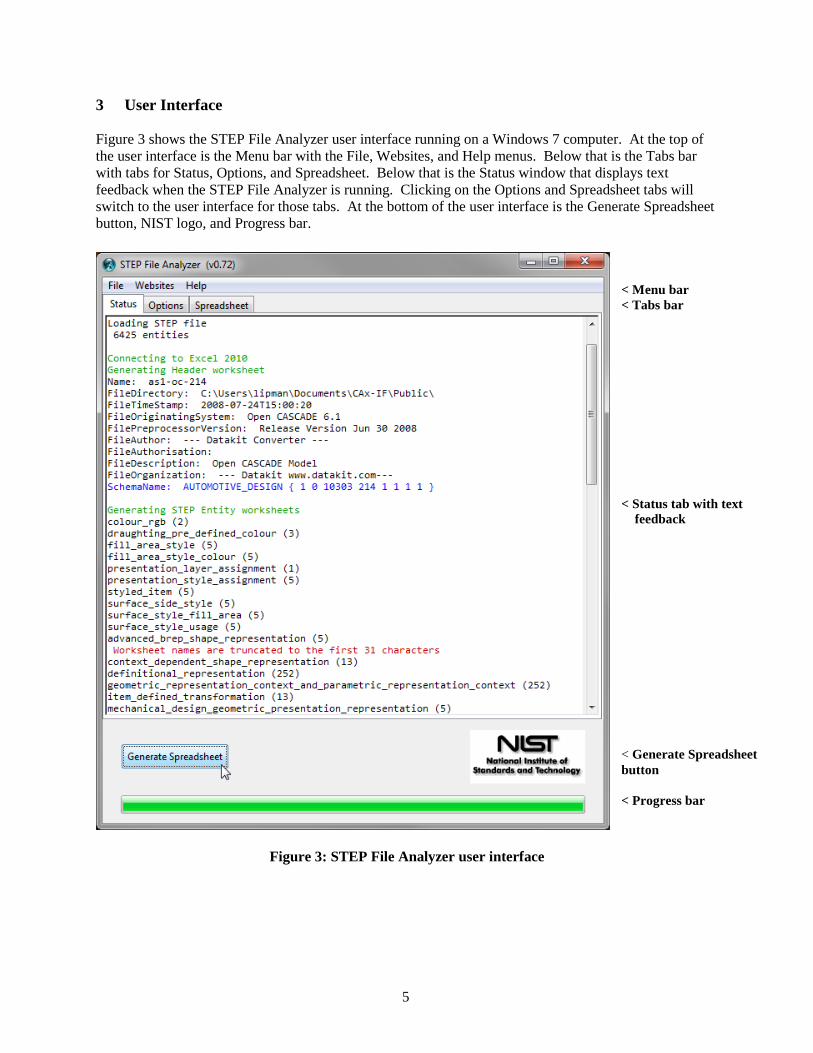
3 User Interface Figure 3 shows the STEP File Analyzer user interface running on a Windows 7 computer. At the top of the user interface is the Menu bar with the File, Websites, and Help menus. Below that is the Tabs bar with tabs for Status, Options, and Spreadsheet. Below that is the Status window that displays text feedback when the STEP File Analyzer is running. Clicking on the Options and Spreadsheet tabs will switch to the user interface for those tabs. At the bottom of the user interface is the Generate Spreadsheet button, NIST logo, and Progress bar.
Figure 3: STEP File Analyzer user interface
< Menu bar < Tabs bar < Status tab with text feedback < Generate Spreadsheet button < Progress bar
6
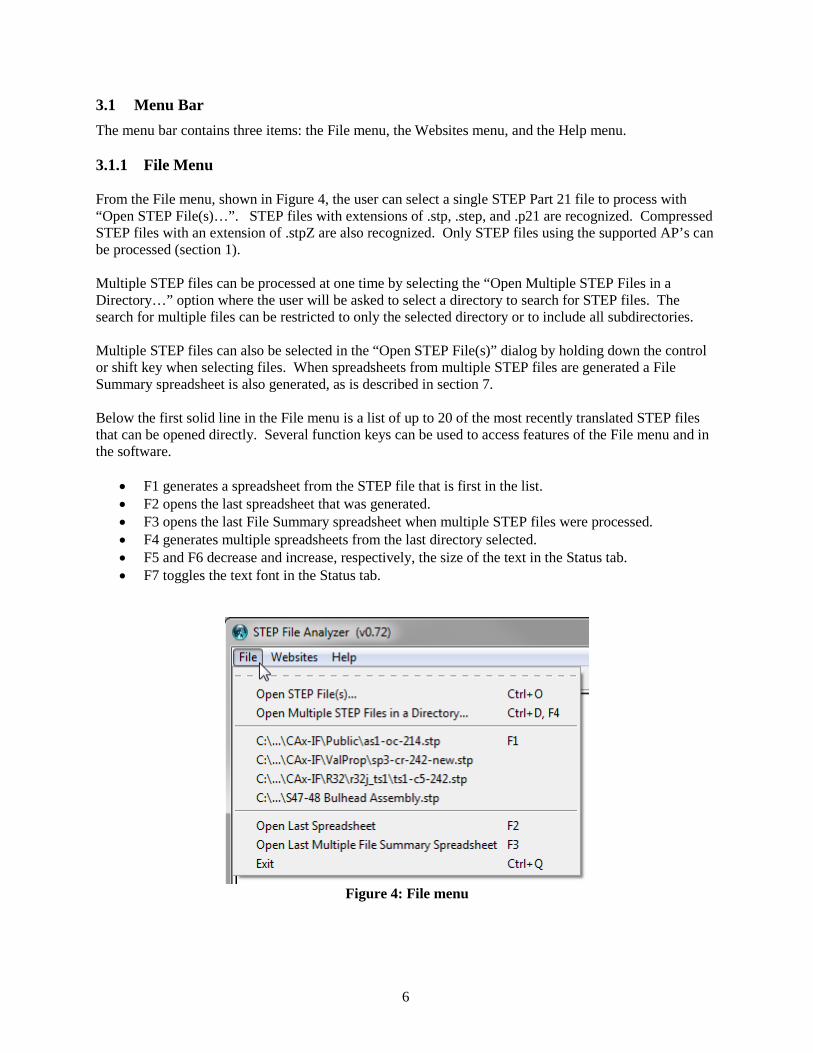
3.1 Menu Bar The menu bar contains three items: the File menu, the Websites menu, and the Help menu. 3.1.1 File Menu From the File menu, shown in Figure 4, the user can select a single STEP Part 21 file to process with “Open STEP File(s)…”. STEP files with extensions of .stp, .step, and .p21 are recognized. Compressed STEP files with an extension of .stpZ are also recognized. Only STEP files using the supported AP’s can be processed (section 1). Multiple STEP files can be processed at one time by selecting the “Open Multiple STEP Files in a Directory…” option where the user will be asked to select a directory to search for STEP files. The search for multiple files can be restricted to only the selected directory or to include all subdirectories. Multiple STEP files can also be selected in the “Open STEP File(s)” dialog by holding down the control or shift key when selecting files. When spreadsheets from multiple STEP files are generated a File Summary spreadsheet is also generated, as is described in section 7. Below the first solid line in the File menu is a list of up to 20 of the most recently translated STEP files that can be opened directly. Several function keys can be used to access features of the File menu and in the software.
• F1 generates a spreadsheet from the STEP file that is first in the list. • F2 opens the last spreadsheet that was generated. • F3 opens the last File Summary spreadsheet when multiple STEP files were processed. • F4 generates multiple spreadsheets from the last directory selected. • F5 and F6 decrease and increase, respectively, the size of the text in the Status tab. • F7 toggles the text font in the Status tab.
Figure 4: File menu

7
3.1.2 Websites Menu The Websites menu, shown in Figure 5, provides links to useful resources related to the STEP File Analyzer, CAx-IF, NIST research, utility programs, organizations that are programmatically related to STEP, and to several websites with documentation for entities in STEP AP203, AP214, and AP242. 3.1.3 Help Menu The Help Menu, shown in Figure 6, has five sections. In the first section,
• “User’s Guide (pdf)” is a link to this document. • “What’s New” displays information in the Status tab about new features in the software. This
information is automatically displayed every time a new version of the software is run. • “Check for Update” opens up a web page that checks for the latest version of the STEP File
Analyzer. Follow the instructions on that web page to download a new version of the software if one is available. This feature runs automatically if an update hasn’t been checked for in the last 30 days.
The other topics in the Help menu display information in the Status tab and are similar to most information in this User’s Guide.
Figure 5: Websites menu
Figure 6: Help menu
8
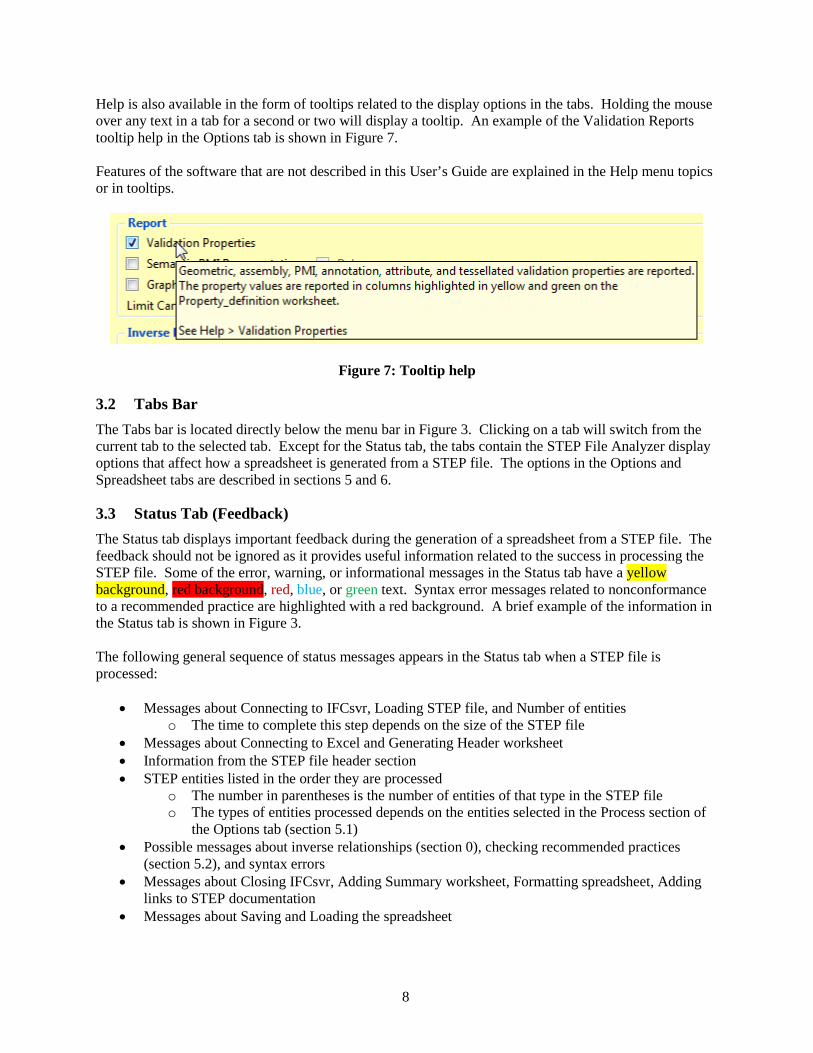
Help is also available in the form of tooltips related to the display options in the tabs. Holding the mouse over any text in a tab for a second or two will display a tooltip. An example of the Validation Reports tooltip help in the Options tab is shown in Figure 7. Features of the software that are not described in this User’s Guide are explained in the Help menu topics or in tooltips.
Figure 7: Tooltip help
3.2 Tabs Bar The Tabs bar is located directly below the menu bar in Figure 3. Clicking on a tab will switch from the current tab to the selected tab. Except for the Status tab, the tabs contain the STEP File Analyzer display options that affect how a spreadsheet is generated from a STEP file. The options in the Options and Spreadsheet tabs are described in sections 5 and 6.
3.3 Status Tab (Feedback) The Status tab displays important feedback during the generation of a spreadsheet from a STEP file. The feedback should not be ignored as it provides useful information related to the success in processing the STEP file. Some of the error, warning, or informational messages in the Status tab have a yellow background, red background, red, blue, or green text. Syntax error messages related to nonconformance to a recommended practice are highlighted with a red background. A brief example of the information in the Status tab is shown in Figure 3. The following general sequence of status messages appears in the Status tab when a STEP file is processed:
• Messages about Connecting to IFCsvr, Loading STEP file, and Number of entities o The time to complete this step depends on the size of the STEP file
• Messages about Connecting to Excel and Generating Header worksheet • Information from the STEP file header section • STEP entities listed in the order they are processed
o The number in parentheses is the number of entities of that type in the STEP file o The types of entities processed depends on the entities selected in the Process section of
the Options tab (section 5.1) • Possible messages about inverse relationships (section 0), checking recommended practices
(section 5.2), and syntax errors • Messages about Closing IFCsvr, Adding Summary worksheet, Formatting spreadsheet, Adding
links to STEP documentation • Messages about Saving and Loading the spreadsheet
9
4 Sample Worksheets The spreadsheet generated by the STEP File Analyzer contains several worksheets. There are Summary and Header worksheets, along with a worksheet for each entity type that was processed from the STEP file. The type of entities processed depends on the entities selected in the Process section of the Options tab.
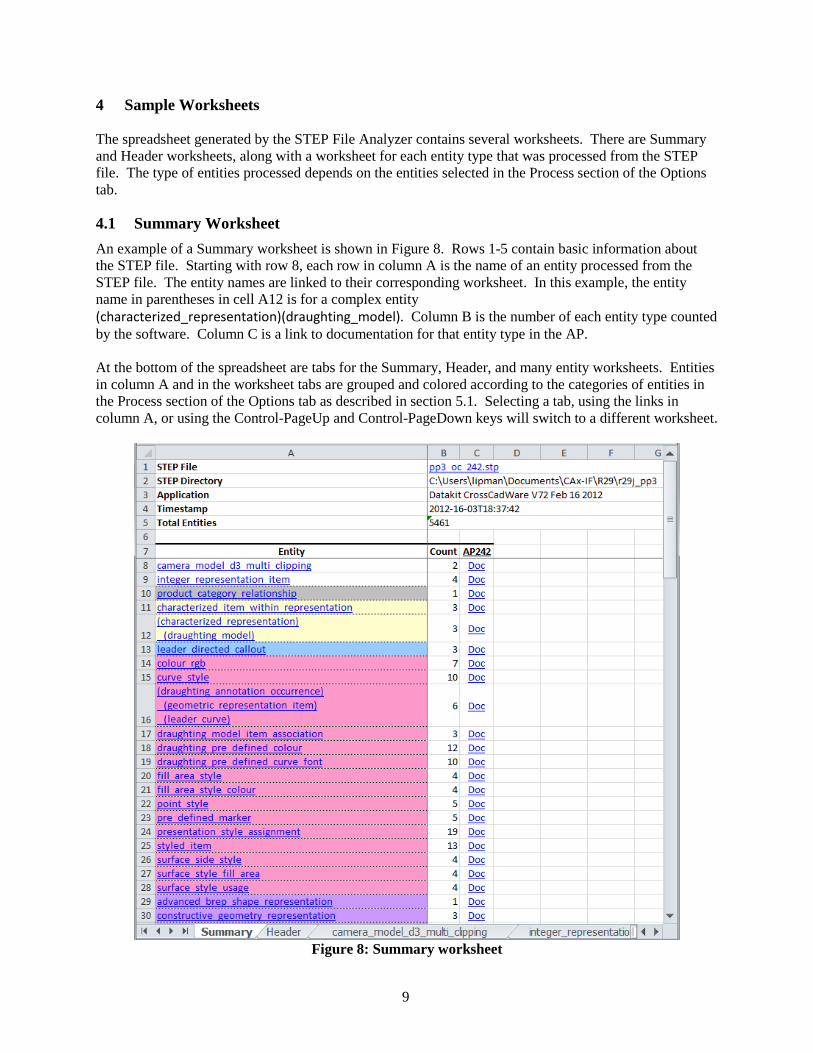
4.1 Summary Worksheet An example of a Summary worksheet is shown in Figure 8. Rows 1-5 contain basic information about the STEP file. Starting with row 8, each row in column A is the name of an entity processed from the STEP file. The entity names are linked to their corresponding worksheet. In this example, the entity name in parentheses in cell A12 is for a complex entity (characterized_representation)(draughting_model). Column B is the number of each entity type counted by the software. Column C is a link to documentation for that entity type in the AP. At the bottom of the spreadsheet are tabs for the Summary, Header, and many entity worksheets. Entities in column A and in the worksheet tabs are grouped and colored according to the categories of entities in the Process section of the Options tab as described in section 5.1. Selecting a tab, using the links in column A, or using the Control-PageUp and Control-PageDown keys will switch to a different worksheet.
Figure 8: Summary worksheet
10
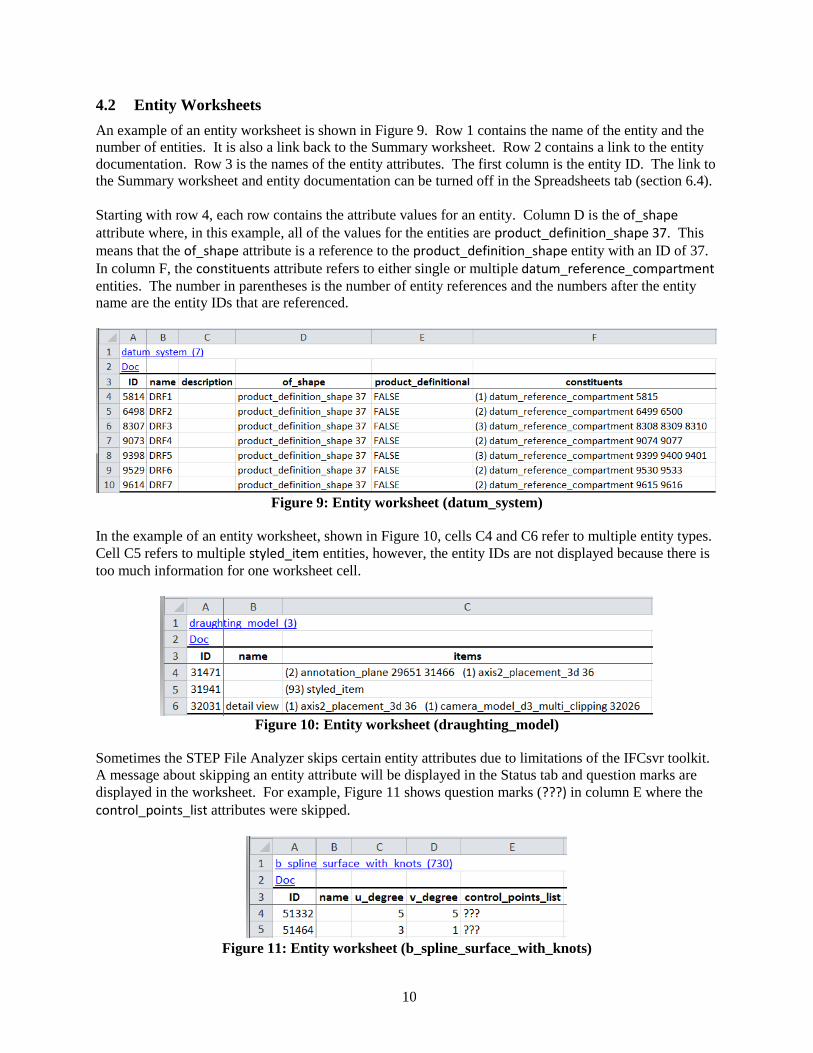
4.2 Entity Worksheets An example of an entity worksheet is shown in Figure 9. Row 1 contains the name of the entity and the number of entities. It is also a link back to the Summary worksheet. Row 2 contains a link to the entity documentation. Row 3 is the names of the entity attributes. The first column is the entity ID. The link to the Summary worksheet and entity documentation can be turned off in the Spreadsheets tab (section 6.4). Starting with row 4, each row contains the attribute values for an entity. Column D is the of_shape attribute where, in this example, all of the values for the entities are product_definition_shape 37. This means that the of_shape attribute is a reference to the product_definition_shape entity with an ID of 37. In column F, the constituents attribute refers to either single or multiple datum_reference_compartment entities. The number in parentheses is the number of entity references and the numbers after the entity name are the entity IDs that are referenced.
Figure 9: Entity worksheet (datum_system)
In the example of an entity worksheet, shown in Figure 10, cells C4 and C6 refer to multiple entity types. Cell C5 refers to multiple styled_item entities, however, the entity IDs are not displayed because there is too much information for one worksheet cell.
Figure 10: Entity worksheet (draughting_model)
Sometimes the STEP File Analyzer skips certain entity attributes due to limitations of the IFCsvr toolkit. A message about skipping an entity attribute will be displayed in the Status tab and question marks are displayed in the worksheet. For example, Figure 11 shows question marks (???) in column E where the control_points_list attributes were skipped.
Figure 11: Entity worksheet (b_spline_surface_with_knots)
11
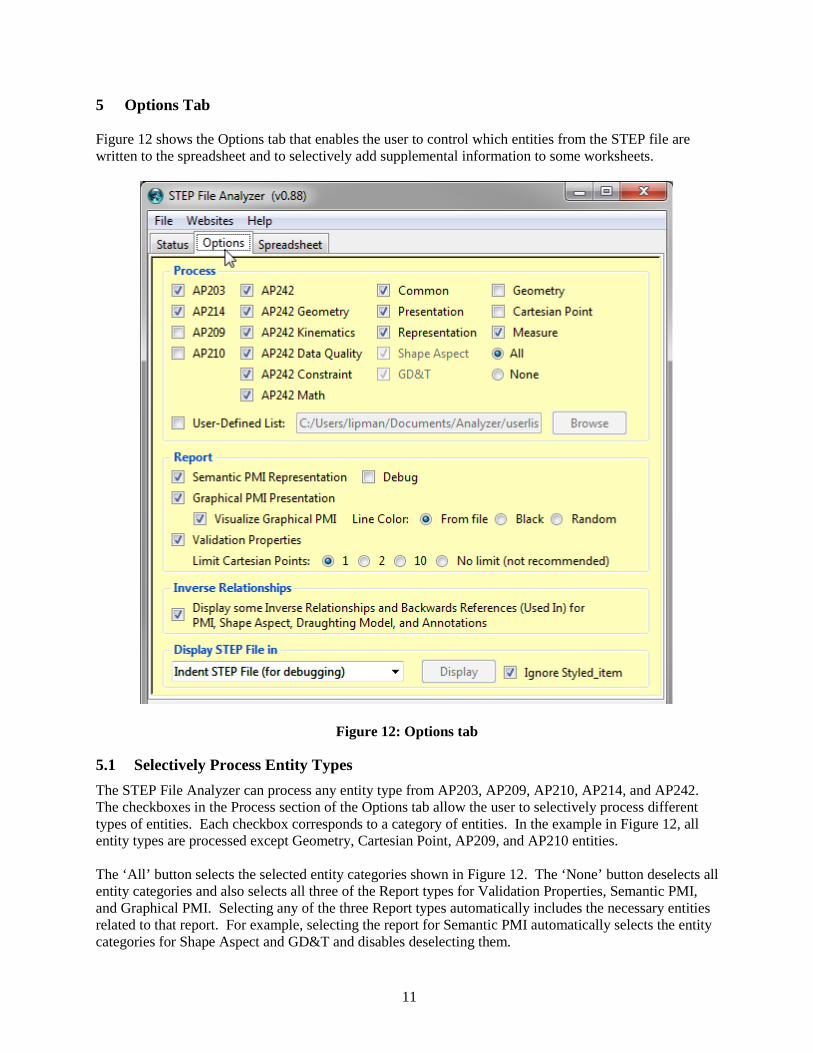
5 Options Tab Figure 12 shows the Options tab that enables the user to control which entities from the STEP file are written to the spreadsheet and to selectively add supplemental information to some worksheets.
Figure 12: Options tab
5.1 Selectively Process Entity Types The STEP File Analyzer can process any entity type from AP203, AP209, AP210, AP214, and AP242. The checkboxes in the Process section of the Options tab allow the user to selectively process different types of entities. Each checkbox corresponds to a category of entities. In the example in Figure 12, all entity types are processed except Geometry, Cartesian Point, AP209, and AP210 entities. The ‘All’ button selects the selected entity categories shown in Figure 12. The ‘None’ button deselects all entity categories and also selects all three of the Report types for Validation Properties, Semantic PMI, and Graphical PMI. Selecting any of the three Report types automatically includes the necessary entities related to that report. For example, selecting the report for Semantic PMI automatically selects the entity categories for Shape Aspect and GD&T and disables deselecting them.
12
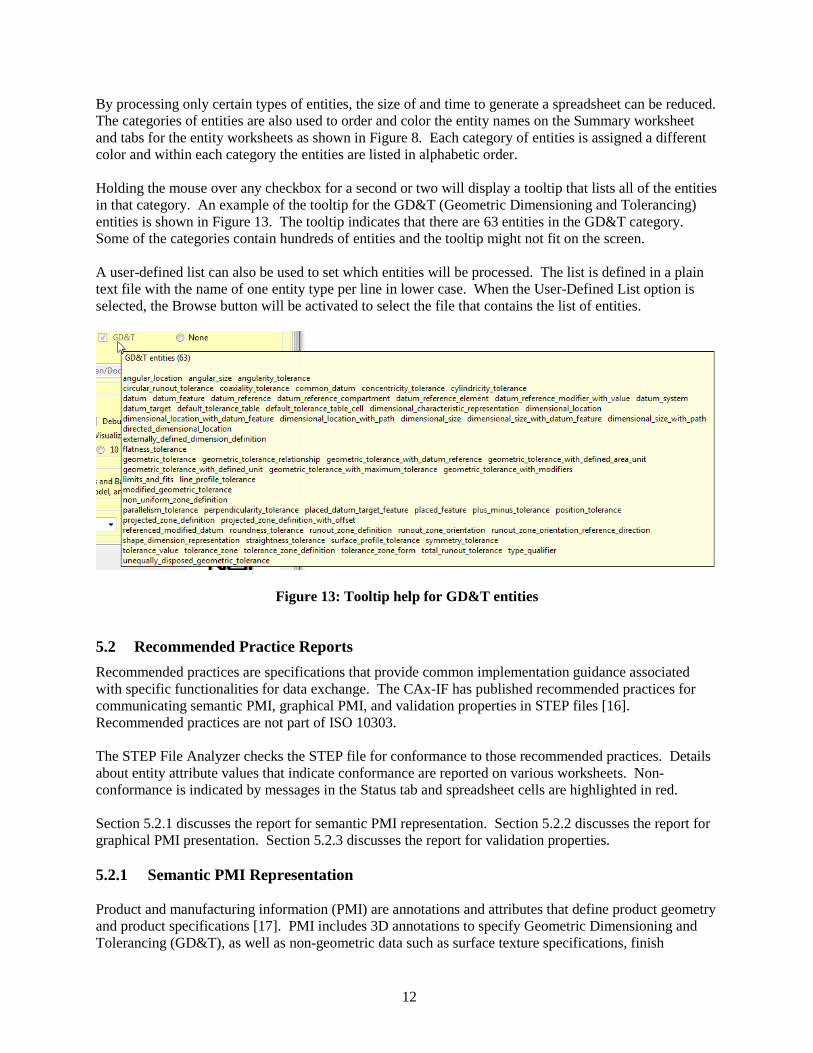
By processing only certain types of entities, the size of and time to generate a spreadsheet can be reduced. The categories of entities are also used to order and color the entity names on the Summary worksheet and tabs for the entity worksheets as shown in Figure 8. Each category of entities is assigned a different color and within each category the entities are listed in alphabetic order. Holding the mouse over any checkbox for a second or two will display a tooltip that lists all of the entities in that category. An example of the tooltip for the GD&T (Geometric Dimensioning and Tolerancing) entities is shown in Figure 13. The tooltip indicates that there are 63 entities in the GD&T category. Some of the categories contain hundreds of entities and the tooltip might not fit on the screen. A user-defined list can also be used to set which entities will be processed. The list is defined in a plain text file with the name of one entity type per line in lower case. When the User-Defined List option is selected, the Browse button will be activated to select the file that contains the list of entities.
Figure 13: Tooltip help for GD&T entities
5.2 Recommended Practice Reports Recommended practices are specifications that provide common implementation guidance associated with specific functionalities for data exchange. The CAx-IF has published recommended practices for communicating semantic PMI, graphical PMI, and validation properties in STEP files [16]. Recommended practices are not part of ISO 10303. The STEP File Analyzer checks the STEP file for conformance to those recommended practices. Details about entity attribute values that indicate conformance are reported on various worksheets. Non-conformance is indicated by messages in the Status tab and spreadsheet cells are highlighted in red. Section 5.2.1 discusses the report for semantic PMI representation. Section 5.2.2 discusses the report for graphical PMI presentation. Section 5.2.3 discusses the report for validation properties. 5.2.1 Semantic PMI Representation Product and manufacturing information (PMI) are annotations and attributes that define product geometry and product specifications [17]. PMI includes 3D annotations to specify Geometric Dimensioning and Tolerancing (GD&T), as well as non-geometric data such as surface texture specifications, finish

13
requirements, process notes, material specifications, and welding symbols. GD&T is a symbolic language used to communicate tolerances on manufactured parts. The industry standards for presentation of GD&T in axonometric views in 3D space are ASME Y14.41-2003 [18] and ISO 16792:2006 [19]. Some common tolerances include dimensional tolerances on length and diameter, and geometric tolerances on flatness, position, surface profile, and circular runout. Figure 14 shows a part with typical graphical PMI annotations including dimensions, geometric and dimensional tolerances, datum features, and datum targets. All of these types of PMI annotations are processed by the STEP File Analyzer.
Figure 14: Part with typical PMI annotations
14
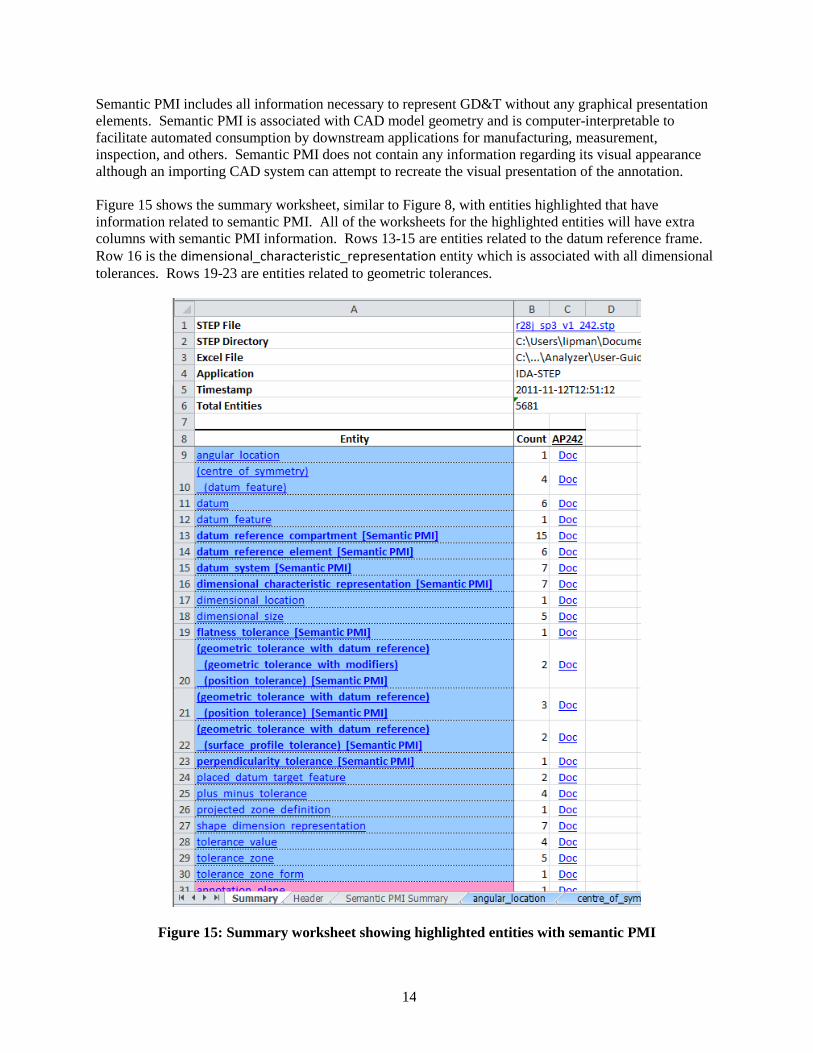
Semantic PMI includes all information necessary to represent GD&T without any graphical presentation elements. Semantic PMI is associated with CAD model geometry and is computer-interpretable to facilitate automated consumption by downstream applications for manufacturing, measurement, inspection, and others. Semantic PMI does not contain any information regarding its visual appearance although an importing CAD system can attempt to recreate the visual presentation of the annotation. Figure 15 shows the summary worksheet, similar to Figure 8, with entities highlighted that have information related to semantic PMI. All of the worksheets for the highlighted entities will have extra columns with semantic PMI information. Rows 13-15 are entities related to the datum reference frame. Row 16 is the dimensional_characteristic_representation entity which is associated with all dimensional tolerances. Rows 19-23 are entities related to geometric tolerances.
Figure 15: Summary worksheet showing highlighted entities with semantic PMI

15
Figure 16 shows the dimensional_characteristic_representation worksheet with the semantic PMI, shown in columns D through J, for dimensional tolerances. In row 3, the parenthetic notation indicates the section number in the CAx-IF recommended practice for semantic PMI related to that piece of information. For example, sections 5.1.1 (column D) and 5.2.1 (column E) in the recommended practice specify allowable attribute values shown in those columns.
• Column D shows the name attribute of the entity type shown in column B. • Column E shows the name attribute of the entity type shown in column C. • Column F shows the length or angle value associated with the shape_dimension_representation
entity in column C. • Column G shows the name value associated with the length or angle value in column F. • Column H shows the plus-minus bounds associated with the dimensional tolerance. • Column I shows the reference of the dimensional tolerance to associated geometric entities. In
this case, the association is through shape_aspect entities which refer to advanced_face entities. • Column J shows the reconstructed visual presentation of the semantic PMI for the dimensional
tolerance. o Cell J4 shows an angular tolerance with plus-minus bounds. o Cell J5 shows a length tolerance with plus-minus bounds o Cells J6 through J10 show dimensional tolerances for the diameter of holes, some with
plus-minus bounds. The dimensional tolerances in column J correspond to the PMI annotations in Figure 14.

16
Figure 16: Semantic PMI example (dimensional_characteristic_representation) for dimensional tolerance
17
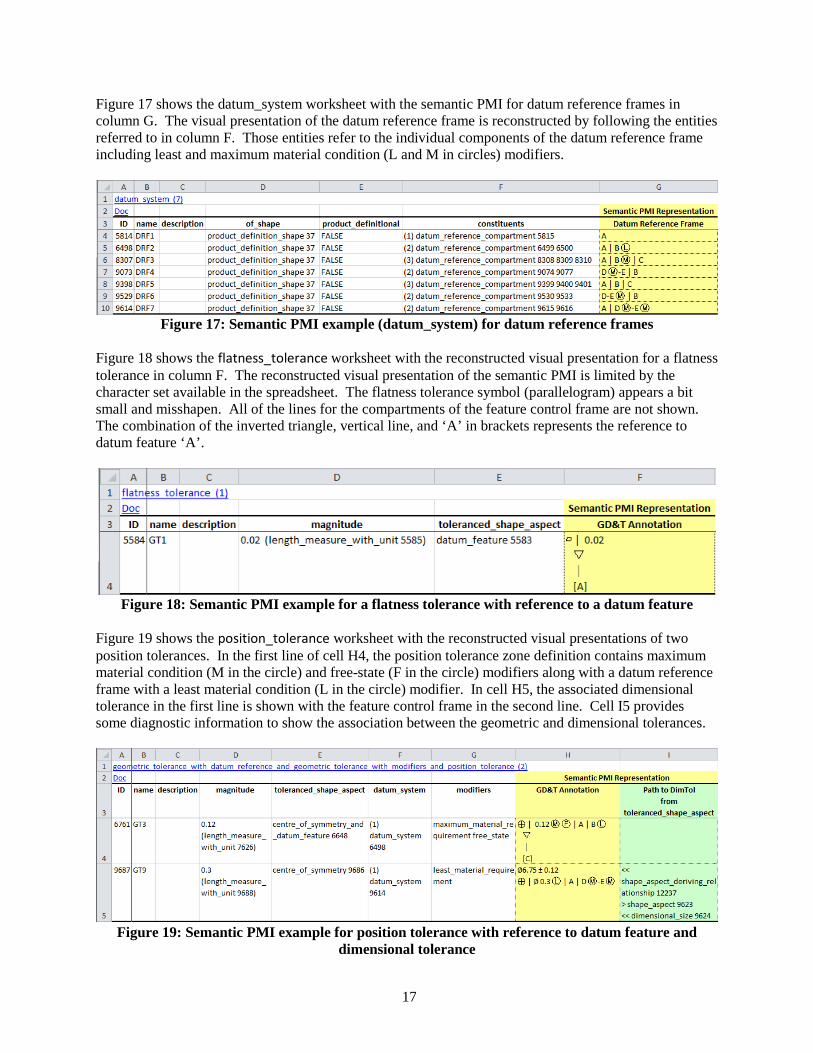
Figure 17 shows the datum_system worksheet with the semantic PMI for datum reference frames in column G. The visual presentation of the datum reference frame is reconstructed by following the entities referred to in column F. Those entities refer to the individual components of the datum reference frame including least and maximum material condition (L and M in circles) modifiers.
Figure 17: Semantic PMI example (datum_system) for datum reference frames
Figure 18 shows the flatness_tolerance worksheet with the reconstructed visual presentation for a flatness tolerance in column F. The reconstructed visual presentation of the semantic PMI is limited by the character set available in the spreadsheet. The flatness tolerance symbol (parallelogram) appears a bit small and misshapen. All of the lines for the compartments of the feature control frame are not shown. The combination of the inverted triangle, vertical line, and ‘A’ in brackets represents the reference to datum feature ‘A’.
Figure 18: Semantic PMI example for a flatness tolerance with reference to a datum feature
Figure 19 shows the position_tolerance worksheet with the reconstructed visual presentations of two position tolerances. In the first line of cell H4, the position tolerance zone definition contains maximum material condition (M in the circle) and free-state (F in the circle) modifiers along with a datum reference frame with a least material condition (L in the circle) modifier. In cell H5, the associated dimensional tolerance in the first line is shown with the feature control frame in the second line. Cell I5 provides some diagnostic information to show the association between the geometric and dimensional tolerances.
Figure 19: Semantic PMI example for position tolerance with reference to datum feature and
dimensional tolerance

18
As a convenience, all of the GD&T annotations in column H from worksheets similar to Figure 19 are collected on the Semantic PMI Summary worksheet. Figure 20 shows an example of the Semantic PMI Summary worksheet. The GD&T annotations in column H in Figure 19 are in rows 3 and 4 of Figure 20. The semantic PMI in column C corresponds to the PMI annotations in Figure 14.
Figure 20: Semantic PMI Summary worksheet

19
5.2.1.1 Limitations of Reconstructing the Visual Presentation of Semantic PMI The reporting of semantic PMI representation in the spreadsheet is still under development at NIST and depends on updates to CAx-IF recommended practices. The results presented here might change with future versions of the software. The reconstruction of the visual presentation of semantic PMI might not correspond exactly to the modeled graphical PMI. The semantic association of the datum feature with a geometric tolerance is based on each referring to the same geometric face in the STEP file. The graphical PMI for this annotation might show it as two separate annotations, the geometric tolerance and datum feature, each with leader lines to the same geometric face as shown in Figure 21. Leader lines are a graphical PMI element and there is no semantic representation of them in the STEP file. Therefore the semantic PMI shown in cells C2, C3, C5, and C9 in Figure 20 might actually appear graphically without the datum features attached to the feature control frame.
Figure 21: Flatness tolerance and datum feature Cell C7 in Figure 20 contains the feature count modifier ‘8X’. This is not necessary for the reconstruction of the visual presentation because the all-around symbol (tiny circle with a bent line through it) is used in the feature control frame. The software errs on the side of showing a feature count modifier even though one might not appear in the graphical PMI. The feature count modifier is determined by counting how many geometric faces a tolerance is associated with. Sometimes the software does not find an expected association between a dimensional tolerance and a geometric tolerance. The association is found by each tolerance referencing the same geometric face. In that case, the dimensional tolerance will not be displayed above the geometric tolerance. 5.2.2 Graphical PMI Presentation Graphical PMI presents GD&T annotations as a visual representation of geometric elements such as lines and arcs as part of the CAD model, i.e., how the annotation is drawn on the model. Graphical PMI is not intended to be computer-interpretable and does not carry any semantic representation information although it can be linked to its corresponding semantic representation. Figure 22 shows an example of how graphical PMI is reported in the spreadsheet. The report for graphical PMI only contains information about the graphical elements (points, lines, colors) needed to display graphical PMI annotations.

20
The information is always reported on the annotation_occurrence (as in this example) or annotation_curve_occurrence worksheets. Columns B, C, and D show the entity attributes. Columns E through I show the values associated with the graphical PMI.
• Column E shows the name attribute of the geometric_curve_set in column D. • Column F shows the element attributes of the geometric_curve_set. In this case, the elements
refer to polyline entities. • Column G shows the cartesian_point entities that make up the polyline entities. • Column H shows the curve_style associated with the presentation_style_assignment in column
B. • Column I shows the color associated with the curve_style in column H. • Other columns not shown may contain saved views the annotation is associated with, PMI
validation properties, and geometry entities that are associated with the annotation.
Figure 22: Graphical PMI example (annotation_occurrence)
A VRML (Virtual Reality Modeling Language) file of the graphical PMI can also be generated. VRML is a standard file format for 3D models that can be displayed with VRML software or web browser plugins [20]. The VRML file only contains the line segments that make up the graphical PMI and not the part geometry to which it is applied. Figure 23 is a screenshot from a viewer of the VRML file generated from the graphical PMI. The PMI corresponds to some of annotations shown in Figure 14.

21
Figure 23: VRML generated from graphical PMI
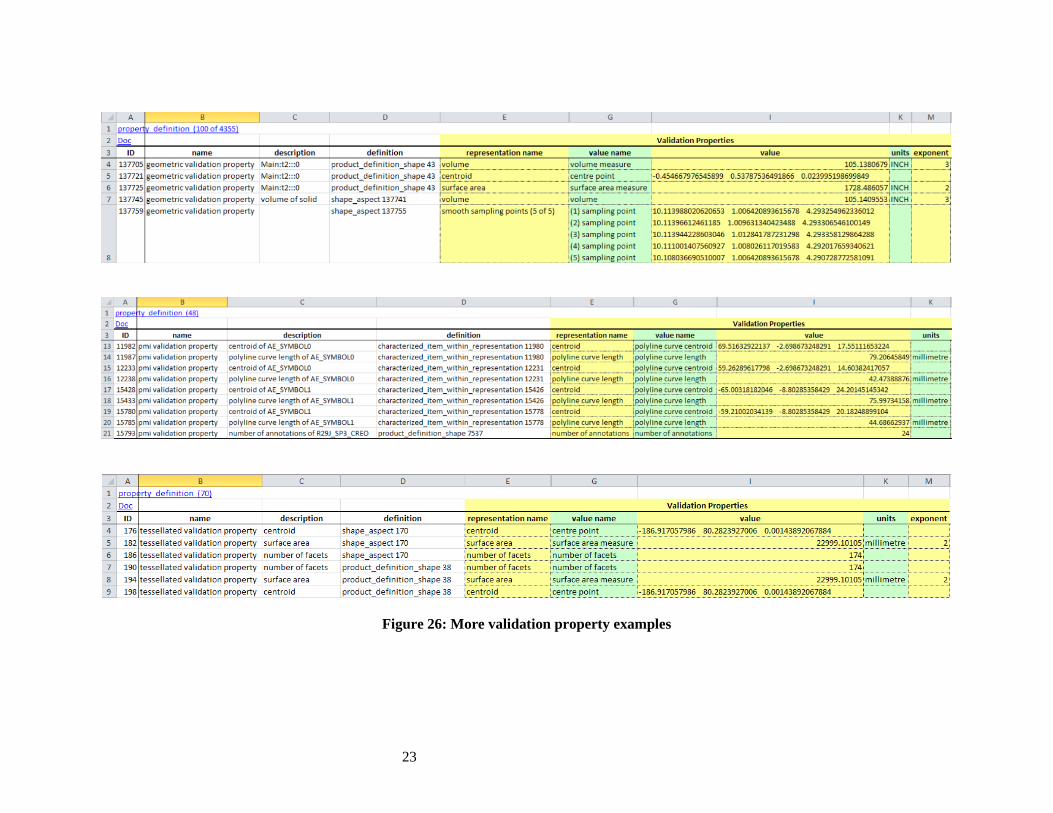
5.2.3 Validation Properties Validation properties are an important tool to verify the information in a STEP file [21]. For example, geometric validation properties are characteristics of solid and surface models, such as area, volume, and centroid. Geometric validation properties could be written to a STEP file when it is exported from a CAD system. When the STEP file is imported to a receiving CAD system, that system can compute the same validation properties and compare them to the values from the originating system in the STEP file. If the computed validation properties are within an agreed tolerance to the original validation properties, then the exchange of geometric information has been validated. Figure 24 shows an example of a validation properties report. The report is always on the property_definition worksheet. The validation properties are shown in the yellow and green columns E, G, I, K, and M. Row 3 contains the names of the type of value in those columns. The values in cells I6, I9, and I15 are cartesian coordinates. Empty cells E12 and E13 indicate that values for those attributes were not specified in the STEP file. If no values for units and exponent appear in rows K and M, then none are required based on the type of value in row I. To see the hidden columns F, H, J, L, and N, click on the plus (+) signs above the columns or the “2” in the upper left corner as highlighted in red in Figure 24. Those columns contain the entity attribute name and ID for the corresponding validation property value in the column to the left. Displaying the hidden columns shows where the validation property values come from in the STEP file. The hidden columns F, H, J, and L are shown in Figure 25. Columns M and N are not shown. For example, the value in cell G4 “surface area measure” comes from the measure_representation_item name attribute of entity ID 393. The expanded columns can be hidden again by clicking on the minus (-) signs above the columns or the “1” in the upper left corner. Figure 26 shows more examples of geometric, PMI, and tessellated validation properties

22
Figure 24: Validation properties example (property_definition)
Figure 25: Validation properties example with expanded columns
23
Figure 26: More validation property examples
24
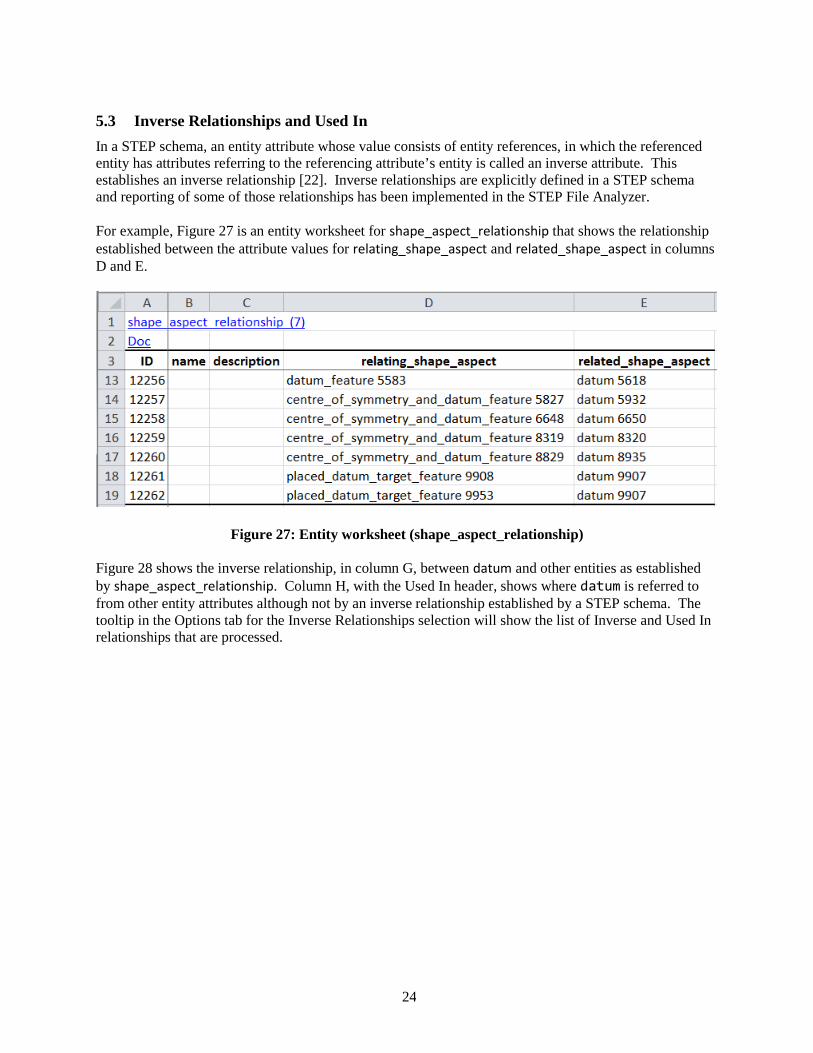
5.3 Inverse Relationships and Used In In a STEP schema, an entity attribute whose value consists of entity references, in which the referenced entity has attributes referring to the referencing attribute’s entity is called an inverse attribute. This establishes an inverse relationship [22]. Inverse relationships are explicitly defined in a STEP schema and reporting of some of those relationships has been implemented in the STEP File Analyzer. For example, Figure 27 is an entity worksheet for shape_aspect_relationship that shows the relationship established between the attribute values for relating_shape_aspect and related_shape_aspect in columns D and E.
Figure 27: Entity worksheet (shape_aspect_relationship) Figure 28 shows the inverse relationship, in column G, between datum and other entities as established by shape_aspect_relationship. Column H, with the Used In header, shows where datum is referred to from other entity attributes although not by an inverse relationship established by a STEP schema. The tooltip in the Options tab for the Inverse Relationships selection will show the list of Inverse and Used In relationships that are processed.

25
Figure 28: Inverse Relationships and Used In example
26
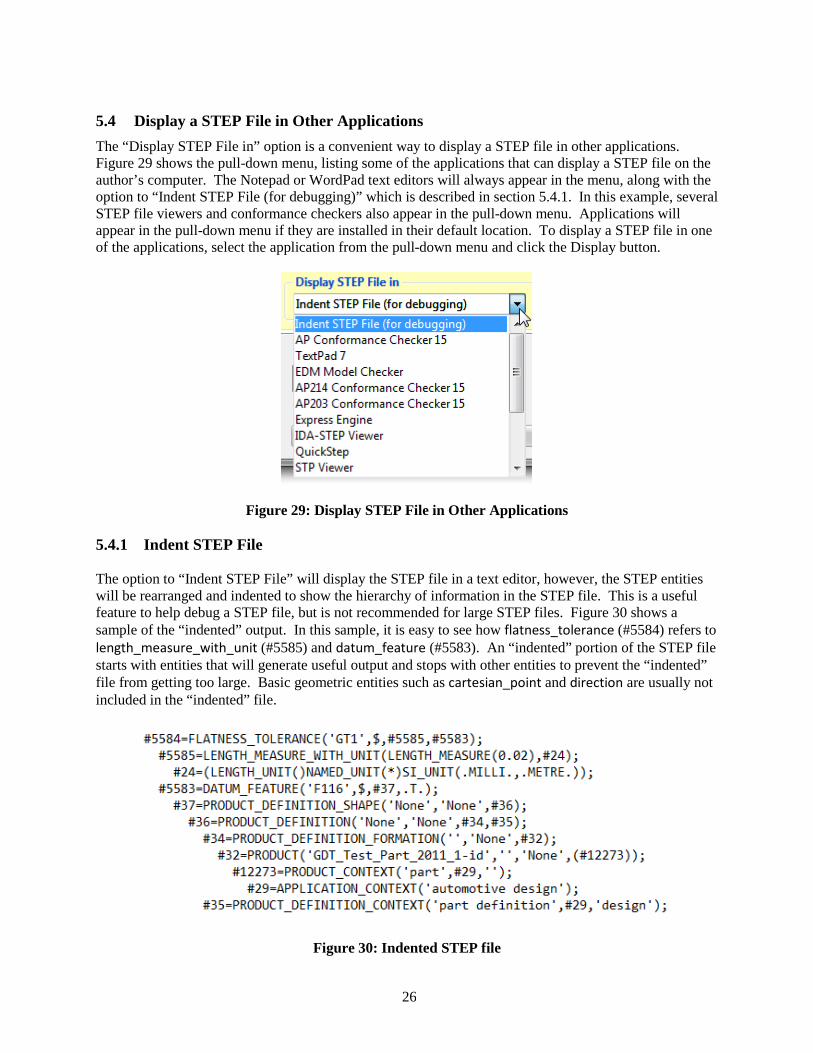
5.4 Display a STEP File in Other Applications The “Display STEP File in” option is a convenient way to display a STEP file in other applications. Figure 29 shows the pull-down menu, listing some of the applications that can display a STEP file on the author’s computer. The Notepad or WordPad text editors will always appear in the menu, along with the option to “Indent STEP File (for debugging)” which is described in section 5.4.1. In this example, several STEP file viewers and conformance checkers also appear in the pull-down menu. Applications will appear in the pull-down menu if they are installed in their default location. To display a STEP file in one of the applications, select the application from the pull-down menu and click the Display button.
Figure 29: Display STEP File in Other Applications 5.4.1 Indent STEP File The option to “Indent STEP File” will display the STEP file in a text editor, however, the STEP entities will be rearranged and indented to show the hierarchy of information in the STEP file. This is a useful feature to help debug a STEP file, but is not recommended for large STEP files. Figure 30 shows a sample of the “indented” output. In this sample, it is easy to see how flatness_tolerance (#5584) refers to length_measure_with_unit (#5585) and datum_feature (#5583). An “indented” portion of the STEP file starts with entities that will generate useful output and stops with other entities to prevent the “indented” file from getting too large. Basic geometric entities such as cartesian_point and direction are usually not included in the “indented” file.
Figure 30: Indented STEP file
27
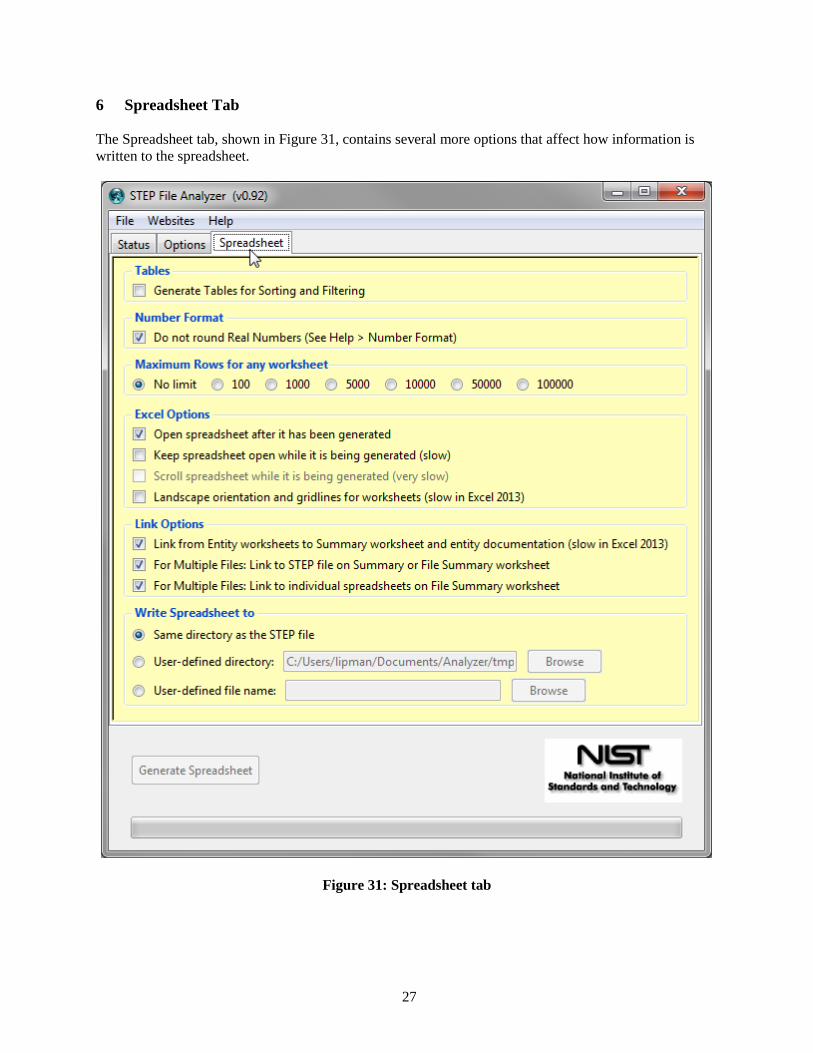
6 Spreadsheet Tab The Spreadsheet tab, shown in Figure 31, contains several more options that affect how information is written to the spreadsheet.
Figure 31: Spreadsheet tab
28
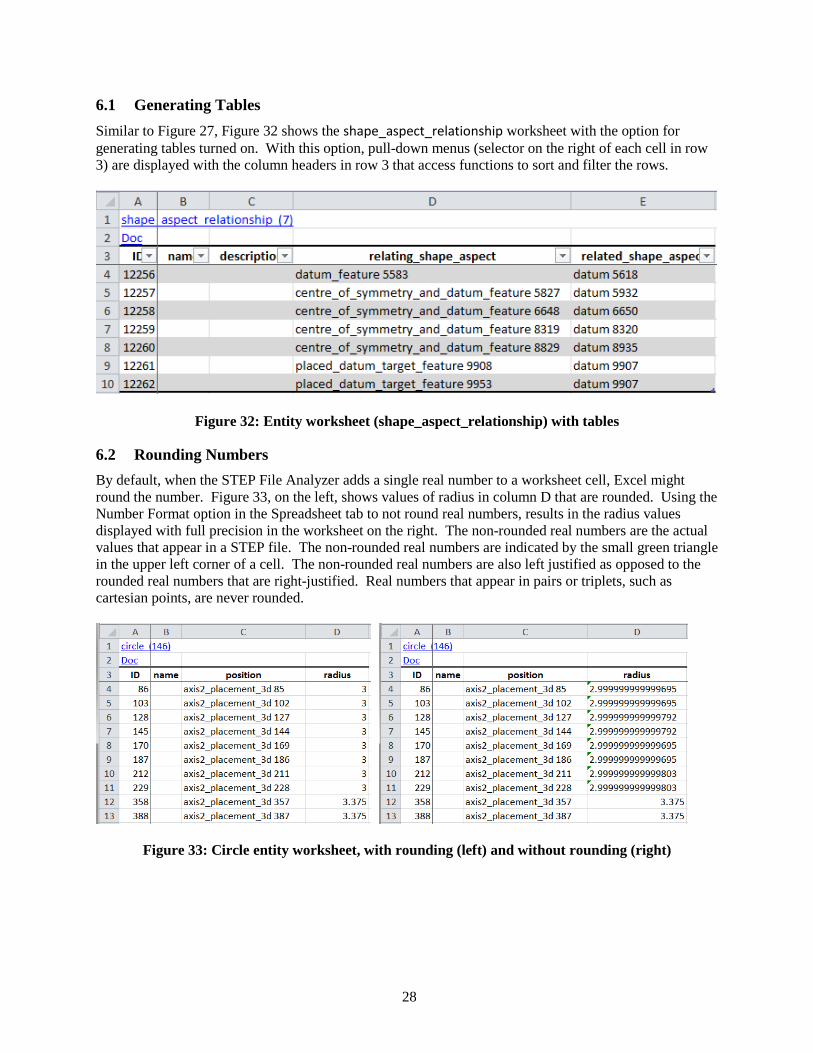
6.1 Generating Tables Similar to Figure 27, Figure 32 shows the shape_aspect_relationship worksheet with the option for generating tables turned on. With this option, pull-down menus (selector on the right of each cell in row 3) are displayed with the column headers in row 3 that access functions to sort and filter the rows.
Figure 32: Entity worksheet (shape_aspect_relationship) with tables
6.2 Rounding Numbers By default, when the STEP File Analyzer adds a single real number to a worksheet cell, Excel might round the number. Figure 33, on the left, shows values of radius in column D that are rounded. Using the Number Format option in the Spreadsheet tab to not round real numbers, results in the radius values displayed with full precision in the worksheet on the right. The non-rounded real numbers are the actual values that appear in a STEP file. The non-rounded real numbers are indicated by the small green triangle in the upper left corner of a cell. The non-rounded real numbers are also left justified as opposed to the rounded real numbers that are right-justified. Real numbers that appear in pairs or triplets, such as cartesian points, are never rounded.
Figure 33: Circle entity worksheet, with rounding (left) and without rounding (right)
29
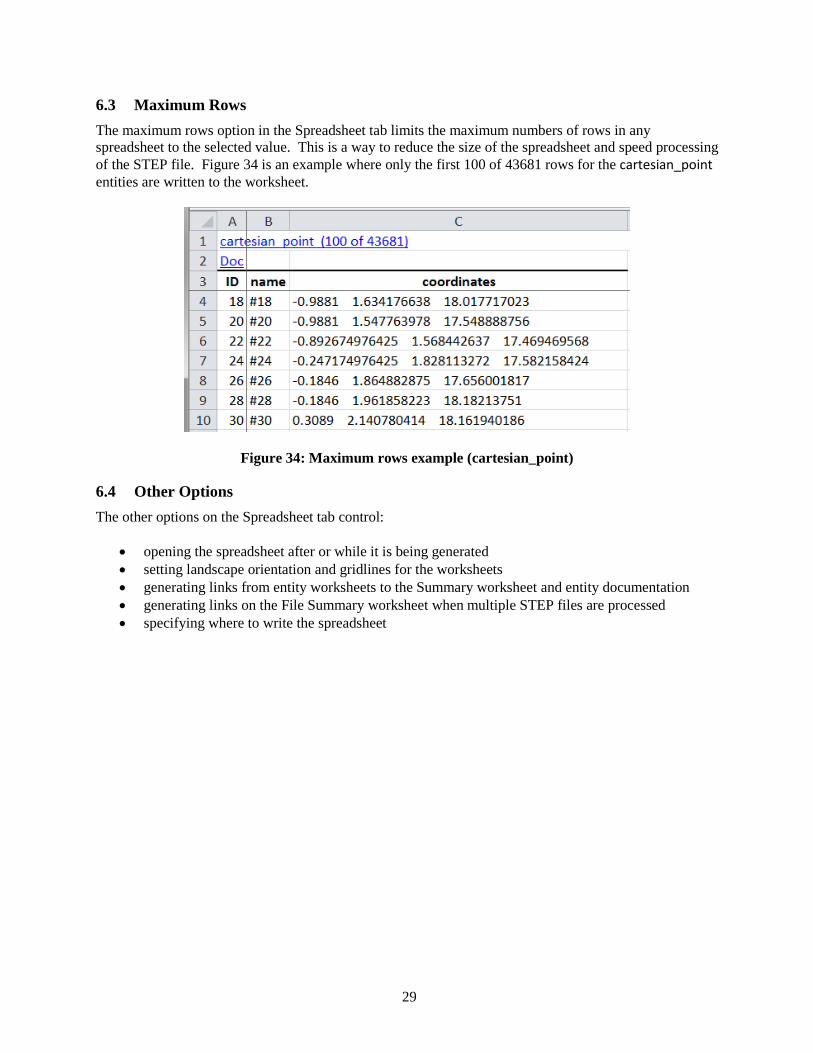
6.3 Maximum Rows The maximum rows option in the Spreadsheet tab limits the maximum numbers of rows in any spreadsheet to the selected value. This is a way to reduce the size of the spreadsheet and speed processing of the STEP file. Figure 34 is an example where only the first 100 of 43681 rows for the cartesian_point entities are written to the worksheet.
Figure 34: Maximum rows example (cartesian_point)
6.4 Other Options The other options on the Spreadsheet tab control:
• opening the spreadsheet after or while it is being generated • setting landscape orientation and gridlines for the worksheets • generating links from entity worksheets to the Summary worksheet and entity documentation • generating links on the File Summary worksheet when multiple STEP files are processed • specifying where to write the spreadsheet
30
7 Processing Multiple STEP Files The capability to process multiple STEP files at once is an easy way to process many STEP files with only a few mouse clicks and to compare entity usage across multiple STEP files. There are two ways to select multiple STEP files. The first is to use the “Open Multiple STEP Files in a Directory” option from the File menu as shown in Figure 4. The user can select a directory in which all STEP files in that directory will be processed. Subdirectories of the selected directory can also be searched. The other way is to select multiple individual STEP files when using the “Open STEP File(s)” option from the File menu. Multiple STEP files can be selected in the Open File(s) dialog by holding down the control or shift key when selecting files.
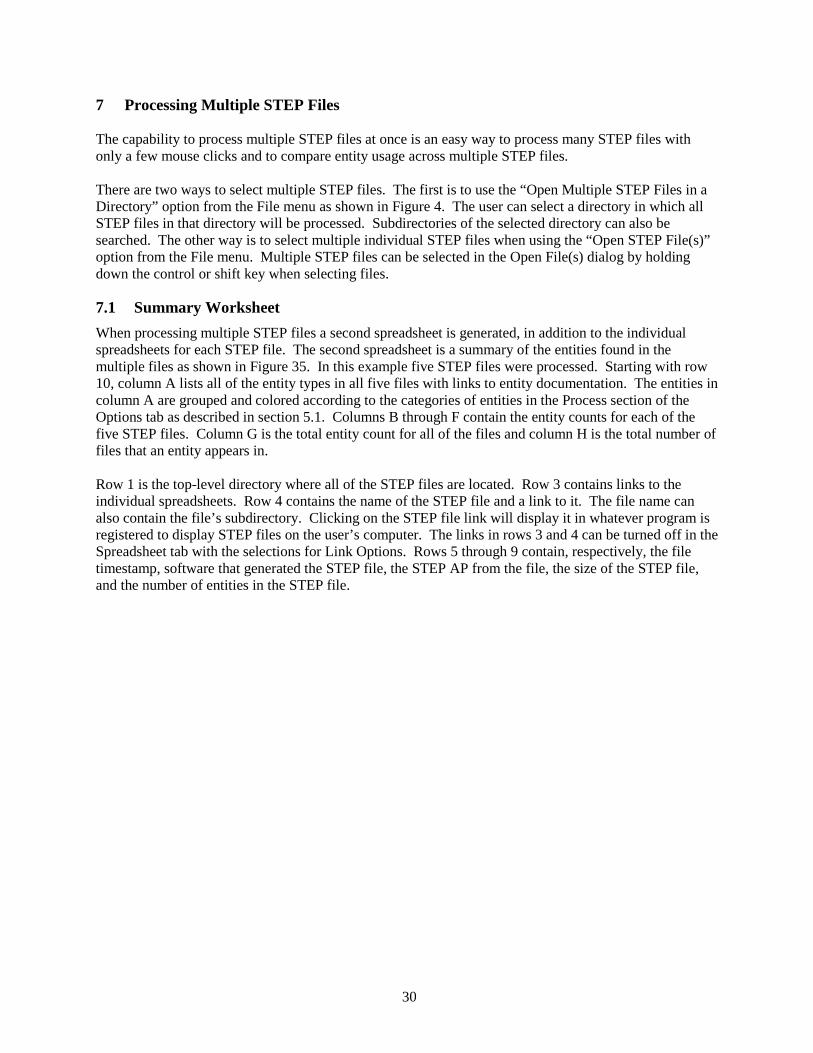
7.1 Summary Worksheet When processing multiple STEP files a second spreadsheet is generated, in addition to the individual spreadsheets for each STEP file. The second spreadsheet is a summary of the entities found in the multiple files as shown in Figure 35. In this example five STEP files were processed. Starting with row 10, column A lists all of the entity types in all five files with links to entity documentation. The entities in column A are grouped and colored according to the categories of entities in the Process section of the Options tab as described in section 5.1. Columns B through F contain the entity counts for each of the five STEP files. Column G is the total entity count for all of the files and column H is the total number of files that an entity appears in. Row 1 is the top-level directory where all of the STEP files are located. Row 3 contains links to the individual spreadsheets. Row 4 contains the name of the STEP file and a link to it. The file name can also contain the file’s subdirectory. Clicking on the STEP file link will display it in whatever program is registered to display STEP files on the user’s computer. The links in rows 3 and 4 can be turned off in the Spreadsheet tab with the selections for Link Options. Rows 5 through 9 contain, respectively, the file timestamp, software that generated the STEP file, the STEP AP from the file, the size of the STEP file, and the number of entities in the STEP file.
31
Figure 35: File Summary worksheet when processing multiple STEP files

32
7.2 Coverage Analysis Worksheets Coverage analysis worksheets for graphical and semantic PMI are generated when multiple STEP files are processed. Figure 36 shows the worksheet that is generated for coverage analysis of graphical PMI. Column A in rows 4 through 29 are the names of the types of graphical PMI that are related to tolerances, dimensions, and datums. The names are from a table in the CAx-IF recommended practice for the presentation of PMI [23]. Columns B through E refer to four STEP files. When there is an ‘X’ in those columns, then that file contains graphical PMI with that name. Column F counts the total number of STEP files that contain that type of graphical PMI.
Figure 36: Graphical PMI Coverage Analysis worksheet
33
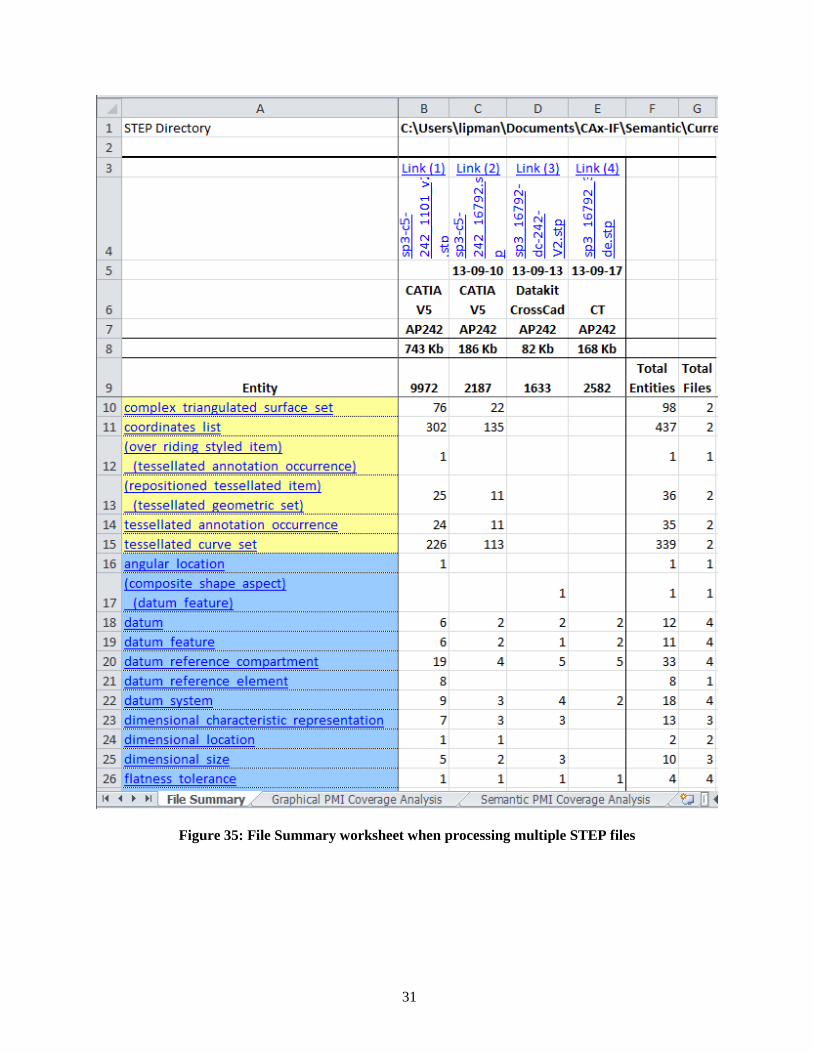
Figure 37 shows the worksheet that is generated for coverage analysis of semantic PMI. Column A in rows 4 through 36 contain different types of GD&T related to geometric and dimensional tolerances. Rows 37 through 117 are not shown and contain more types of GD&T and associated modifiers. The numbers in parentheses refer to the sections in the CAx-IF recommended practice for the representation of PMI [23] where there is implementation guidance for that type of GD&T. Columns B through E refer to four STEP files and contain the number of occurrences of that type of GD&T in the file. Column F counts the total number of occurrences for all STEP files that contain that type of GD&T. Counting the number of occurrences of a type of GD&T is useful when comparing STEP files generated by different CAD systems of the same model with the same GD&T.
Figure 37: Semantic PMI Coverage Analysis worksheet
34
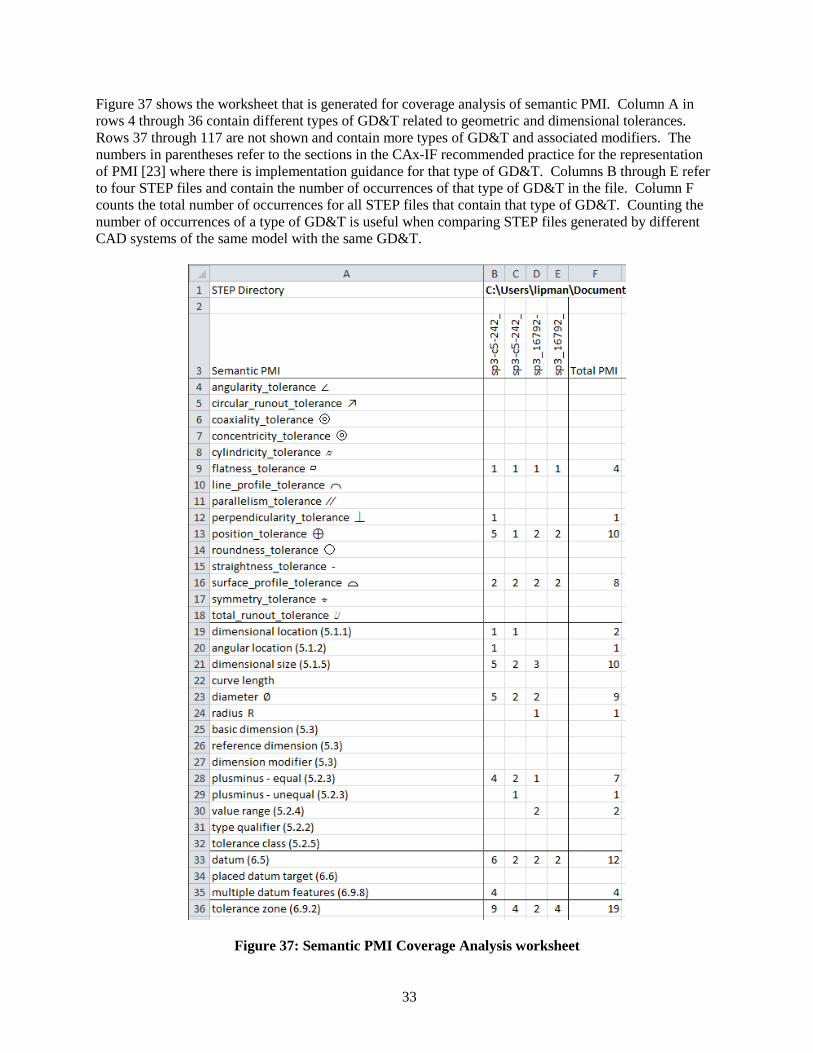
8 Crash Recovery As explained in section 2.4, sometimes the STEP File Analyzer will crash when processing a STEP file. This is most likey due to either syntax errors in the STEP file or due to limitations of the IFCsvr toolkit (section 2.2.1). If a crash occurs, one or more of the dialogs in Figure 38 might be displayed in Windows 7. If this happens, simply close the dialog(s), restart the software, and process the same STEP file again by using function key F1 or F4 if processing multiple files. The software keeps track of which entity type caused the crash for a particular STEP file and won’t process that type again. A message will be displayed in the Status tab if a particular type of entity won’t be processed. The entity types that won’t be processed again are stored in a file *_fix.dat where ‘*’ is the name of the STEP file. No matter what the reason is for the crash, that file will always be generated. Even if the user stops the STEP File Analyzer in the middle of processing a STEP file, the file *_fix.dat will be generated. Therefore, the next time the software is run, the entity type that was being processed when the user stopped the software will not be processed. In this case, or if the syntax errors related to the bad entity are corrected, the *_fix.dat file can be deleted or edited.
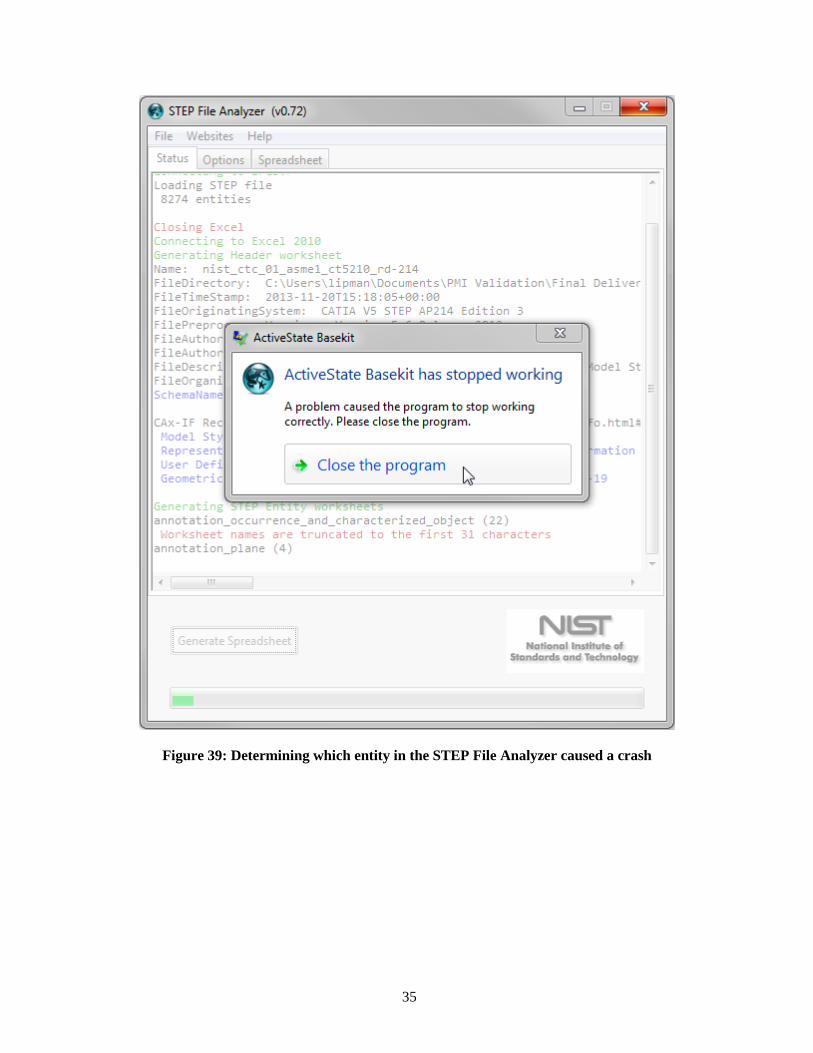
Figure 38: Dialogs that might be displayed when the STEP File Analyzer crashes If the STEP File Analyzer crashes, the user can also see which entity type caused the crash. Figure 39 shows that the software crashed when processing an annotation_plane entity. Another way to prevent that entity type from being processed is to deselect, in the Process section of the Options tab, the category of entity that contains the entity that caused the crash. That will prevent that entity from being processed along with all other entities of that category.
35
Figure 39: Determining which entity in the STEP File Analyzer caused a crash

36
9 Command-line Version A command-line (console) version of the STEP File Analyzer is available. STEP-File-Analyzer-CL.exe can be run from a Windows command prompt by going to the Windows start menu, selecting Run, and entering “cmd”. This will open up the command prompt window. To run the command-line version, change to the directory where the program is located. Then enter the name of the program and the name of the STEP file to translate as shown in Figure 40. To facilitate running the command-line version, the PATH environment variable can be set to include the directory where the command-line executables are located. A batch file can also be created to run the command-line executable. If the STEP file is not located in the same directory as the command-line executable, then the STEP file name should also include the directory pathname for the file. Entering the name of the program without a STEP file name will display the command-line options. The program will use whatever options were last used when the GUI version was run. When the command-line version is run, feedback is provided that is similar to what is displayed in the Status tab (section 3.3) as shown in Figure 40.

37
Figure 40: Feedback when running the command-line version
38
10 References All websites were successfully accessed in April 2014. [1] Pratt, M.J., “Introduction to ISO 10303 – the STEP Standard for Product Data Exchange,” ASME
Journal of Computing and Information Science in Engineering, vol. 1, no. 1, March 2001. [2] “STEP Application Handbook – ISO 10303 – Version 3,” SCRA, June 2006,
http://www.engen.org.au/index_htm_files/STEP_application_hdbk_63006_BF.pdf. [3] Kemmerer, S. (ed.), “STEP The Grand Experience,” NIST Special Publication 939, July 1999. [4] ISO 10303-21:2002, Industrial automation systems and integration - Product data representation and
exchange – Part 21: Implementation methods: Clear text encoding of the change structure. [5] Lipman, R., Lubell, J., ”Conformance Checking of Recommended Practices for Semantic PMI in
STEP Data Exchange Files”, to appear. [6] CAx Implementor Forum, http://www.cax-if.org/. [7] ISO 10303-203:2011, Industrial automation systems and integration -- Product data representation and
exchange - Part 203: Application protocol: Configuration controlled 3D design of mechanical parts and assemblies.
[8] ISO 10303-209:2001, Industrial automation systems and integration -- Product data representation and exchange -- Part 209: Application protocol: Composite and metallic structural analysis and related design.
[9] ISO 10303-210:2011, Industrial automation systems and integration -- Product data representation and exchange -- Part 210: Application module: Application protocol: Electronic assembly, interconnect, and packaging design.
[10] ISO 10303-214:2010, Industrial automation systems and integration -- Product data representation and exchange - Part 214: Application protocol: Core data for automotive mechanical design processes.
[11] ISO/DIS 10303-242, Industrial automation systems and integration -- Product data representation and exchange - Part 242: Application protocol: Managed Model-based 3D Engineering.
[12] STEP AP242 Project, http://www.ap242.org/. [13] Barnard-Feeney, A., Frechette, S., Srinivasan, V., ”A portrait of an ISO STEP tolerancing standard
as an enabler of smart manufacturing systems,” 13th CIRP Conference on Computer Aided Tolerancing, May 2014, Hangzhou, China.
[14] IFCsvr ActiveX Component, https://groups.yahoo.com/neo/groups/ifcsvr-users/info. [15] Industry Foundation Classes, http://www.buildingsmart-tech.org/. [16] CAx-IF Recommended Practices, http://www.cax-if.org/joint_testing_info.html#recpracs. [17] Frechette, S., Jones, A., Fischer, B., “A strategy for testing product conformance to geometric
dimensioning & tolerancing standards: Technical notes”, 12th CIRP Conference on Computer Aided Tolerancing, April 2012, Huddersfield, U.K.
[18] ASME Y14.41-2003, Digital Product Definition Data Practices. [19] ISO 16792:2006, Technical product documentation -- Digital product definition data practices. [20] VRML Plugin and Browser Detector, http://cic.nist.gov/vrml/vbdetect.html. [21] “Recommended Practices for Geometric and Assembly Validation Properties – Release 3.1,” CAx
Implementor Forum, October 2011, http://www.cax-if.org/documents/rec_prac_gvp_v31.pdf. [22] Lubell, J., “From Model to Markup: XML Representation of Markup Data,” XML 2002, Baltimore,
Maryland, December 2002. [23] “Recommended Practices for the Representation and Presentation of Product Manufacturing
Information (PMI) – Version 3.8,” CAx Implementor Forum, February 2014.