Stellar Orbits Around the Galactic Center Black Hole · Stellar Orbits Around the Galactic Center...
38
arXiv:astro-ph/0306130v2 2 Nov 2004 Stellar Orbits Around the Galactic Center Black Hole A. M. Ghez 1 , S. Salim, S. D. Hornstein, A. Tanner, J. R. Lu, M. Morris, E. E. Becklin, G. Duchˆ ene UCLA Division of Astronomy and Astrophysics, Los Angeles, CA 90095-1574 ghez, samir, seth, tanner, jlu, morris, becklin, [email protected] ABSTRACT We present new diffraction-limited images of the Galactic Center, obtained with the W. M. Keck I 10-meter telescope. Within 0. ′′ 4 of the Galaxy’s central dark mass, 17 proper motion stars, with K magnitudes ranging from 14.0 to 16.8, are identified and 10 of these are new detections (6 were also independently discovered by Sch¨odel et al. 2003). In this sample, three newly identified (S0-16, S0-19, and S0-20) and four previously known (S0-1, S0-2, S0-4, and S0-5) sources have measured proper motions that reveal orbital solutions. Orbits are derived simultaneously so that they jointly constrain the central dark object’s properties: its mass, its position, and, for the first time using orbits, its motion on the plane of the sky. This analysis pinpoints the Galaxy’s central dark mass to within 1.3 mas (10 AU) and limits its proper motion to 1.5 ± 0.5 mas y −1 (or equivalently 60 ± 20 km s −1 ) with respect to the central stellar cluster. This localization of the central dark mass is consistent with our derivation of the position of the radio source Sgr A* in the infrared reference frame (± 10 mas), but with an uncertainty that is a factor 8 times smaller, which greatly facilitates searches for near-infrared counterparts to the central black hole. Consequently, one previous claim for such a counterpart can now be ascribed to a close stellar passage in 1996. Furthermore, we can place a conservative upper limit of 15.5 mag on any steady-state counter-part emission. The estimated central dark mass from orbital motions is 3.7(±0.2) × 10 6 ( Ro 8kpc ) 3 M ⊙ ; this is a more direct measure of mass than those obtained from velocity dispersion measurements, which are as much as a factor of two smaller. The Galactic Center’s distance, which adds an additional 19% uncertainty in the estimated mass, is now the limiting source of uncertainty in the absolute mass. For stars in this sample, the closest approach is achieved by S0-16, which came within a mere 45 AU (= 0.0002 pc = 600 R s ) 1 Institute of Geophysics and Planetary Physics, University of California, Los Angeles, CA 90095-1565
Transcript of Stellar Orbits Around the Galactic Center Black Hole · Stellar Orbits Around the Galactic Center...

arX
iv:a
stro
-ph/
0306
130v
2 2
Nov
200
4
Stellar Orbits Around the Galactic Center Black Hole
A. M. Ghez1, S. Salim, S. D. Hornstein, A. Tanner, J. R. Lu, M. Morris, E. E. Becklin, G.
Duchene
UCLA Division of Astronomy and Astrophysics, Los Angeles, CA 90095-1574
ghez, samir, seth, tanner, jlu, morris, becklin, [email protected]
ABSTRACT
We present new diffraction-limited images of the Galactic Center, obtained
with the W. M. Keck I 10-meter telescope. Within 0.′′4 of the Galaxy’s central
dark mass, 17 proper motion stars, with K magnitudes ranging from 14.0 to
16.8, are identified and 10 of these are new detections (6 were also independently
discovered by Schodel et al. 2003). In this sample, three newly identified (S0-16,
S0-19, and S0-20) and four previously known (S0-1, S0-2, S0-4, and S0-5) sources
have measured proper motions that reveal orbital solutions.
Orbits are derived simultaneously so that they jointly constrain the central
dark object’s properties: its mass, its position, and, for the first time using orbits,
its motion on the plane of the sky. This analysis pinpoints the Galaxy’s central
dark mass to within 1.3 mas (10 AU) and limits its proper motion to 1.5± 0.5 mas
y−1 (or equivalently 60 ± 20 km s−1) with respect to the central stellar cluster.
This localization of the central dark mass is consistent with our derivation of the
position of the radio source Sgr A* in the infrared reference frame (± 10 mas),
but with an uncertainty that is a factor 8 times smaller, which greatly facilitates
searches for near-infrared counterparts to the central black hole. Consequently,
one previous claim for such a counterpart can now be ascribed to a close stellar
passage in 1996. Furthermore, we can place a conservative upper limit of 15.5
mag on any steady-state counter-part emission. The estimated central dark mass
from orbital motions is 3.7(±0.2)× 106( Ro
8kpc)3M⊙; this is a more direct measure
of mass than those obtained from velocity dispersion measurements, which are as
much as a factor of two smaller. The Galactic Center’s distance, which adds an
additional 19% uncertainty in the estimated mass, is now the limiting source of
uncertainty in the absolute mass. For stars in this sample, the closest approach
is achieved by S0-16, which came within a mere 45 AU (= 0.0002 pc = 600 Rs)
1Institute of Geophysics and Planetary Physics, University of California, Los Angeles, CA 90095-1565

– 2 –
at a velocity of 12,000 km s−1. This increases the inferred dark mass density
by four orders of magnitude compared to earlier analyses based on velocity and
acceleration vectors, making the Milky Way the strongest existing case for a
supermassive black hole at the center of a normal type galaxy.
Well determined orbital parameters for these seven Sgr A* cluster stars pro-
vide new constraints on how these apparently massive, young (<10 Myr) stars
formed in a region that seems to be hostile to star formation. Unlike the more
distant He-I emission line stars - another population of young stars in the Galac-
tic Center - that appear to have co-planar orbits, the Sgr A* cluster stars have
orbital properties (eccentricities, angular momentum vectors, and apoapse di-
rections) that are consistent with an isotropic distribution. Therefore many of
the mechanisms proposed for the formation of the He-I stars, such as forma-
tion from a pre-existing disk, are unlikely solutions for the Sgr A* cluster stars.
Unfortunately, alternative theories for producing young stars, or old stars that
look young, in close proximity to a central supermassive black hole, are all also
somewhat problematic. Understanding the apparent youth of stars in the Sgr A*
cluster, as well as the more distant He I emission line stars, has now become one
of the major outstanding issues in the study of the Galactic Center.
Subject headings: black hole physics – Galaxy:center — Galaxy:kinematics and
dynamics — infrared:stars – techniques:high angular resolution
1. Introduction
The proximity of our Galaxy’s center (8 kpc, Reid 1993) presents an opportunity to
build a case for a supermassive black hole and to study the black hole’s environment and
its effects thereon with much higher spatial resolution than can be brought to bear on any
other galaxy. The first hint of a central concentration of dark matter in the Milky Way
came from radial velocity measurements of ionized gas located in a three-armed structure
known as the mini-spiral, which extends from the center out to ∼1-3 pc (Lacy et al. 1980).
Concerns that the measured gas motions were not tracing the gravitational potential were
quickly allayed by radial velocity measurements of stars, which are not susceptible to non-
gravitational forces (McGinn et al. 1989; Sellgren et al. 1990; Haller et al. 1996; Genzel
et al. 1997). These early, low angular resolution, dynamical measurements of the gas and
stars at the center of the Milky Way suggested the presence of ∼ 3× 10⁶M⊙ of dark matter
and confined it to within a radius of ∼0.1 pc. The implied minimum dark matter density
of ∼ 3 × 10⁹M⊙pc−3, however, still allowed a cluster of dark objects, such as neutron stars

– 3 –
or stellar mass black holes, as one of the alternatives to a single supermassive black hole,
because the measurements did not force the cluster’s lifetime to be shorter than the age of
the Galaxy (Maoz et al. 1998).
Significant progress has been made recently with diffraction-limited near-infrared studies
of the central stellar cluster. The first phase of these experiments yielded proper motion
velocities (Eckart & Genzel 1997; Ghez et al. 1998), which suggested that 2.6(±0.6)×106M⊙
of dark matter is confined to within 0.015 pc. This increased the implied minimum dark
matter density by 3 orders of magnitude to 1012M⊙pc−3 and eliminated a cluster of dark
objects as a possible explanation of the Galaxy’s central dark mass concentration (Maoz et al.
1998), but still left the fermion ball hypothesis (e.g., Tsiklauri & Viollier 1998; Munyaneza &
Viollier 2002) as an alternative to a single supermassive black hole. The velocity dispersion
measurements also localized the dark matter’s centroid to within 100 mas and at a position
consistent with the nominal location of the unusual radio source Sgr A* (Ghez et al. 1998),
whose emission is posited to arise from accretion onto a central supermassive black hole
(e.g., Lo et al. 1985). The detection of acceleration for three stars – S0-1, S0-2, and S0-4 –
localized the dark mass to within 30 mas, increased the dark matter’s minimum density to
1013M⊙pc−3, and thereby further strengthened both the case for a supermassive black hole
and its association with Sgr A* (Ghez et al. 2000; Eckart et al. 2002).
Deviations from linear motions also initiated a new phase for these proper motion ex-
periments, that of direct orbital studies. By making a number of assumptions, including
fixing the central mass to the value obtained from the velocity dispersion analysis and its
location to that inferred for Sgr A* by Menten et al. (1997), Ghez et al. (2000) and Eckart et
al. (2002) obtained the first crude orbital solutions; these experiments revealed that orbital
periods for S0-2 and S0-1 could be as short as 15 and 35 years, respectively. With a larger
fraction of the orbit being traced, more precise orbital analyses have been carried out for
S0-2 by Schodel et al. (2002), who dropped the mass assumption, and by Ghez et al. (2003),
who dropped both the mass and center of attraction assumptions and added radial velocity
measurements. These orbital solutions suggested that S0-2 made a closest approach of 0.0006
pc (120 AU) in 2002 and that its orbit encloses a central mass of 3.7(±1.5)×106M⊙ (Schodel
et al. 2002) or 4.0(±0.6)× 106M⊙ (Ghez et al. 2003)1, which is somewhat higher than that
found from the velocity dispersion measurements. Possible causes of this discrepancy in-
clude (1) inaccuracies in the assumptions made in the use of the velocity-dispersion-based
1The uncertainties in the estimated mass in Ghez et al. (2003) are a factor of 2.5 smaller than that in
Schodel et al. (2002), despite the two additional free model parameters introduced by fitting for the center
of attraction and the shorter time baseline. This is primarily due to the higher astrometric accuracy of the
Keck data set, rather than the inclusion of radial velocity measurements.

– 4 –
projected mass estimators about the stellar cluster’s number density distribution and/or the
level of anisotropy (Genzel et al. 2000; Figer et al. 2003), (2) inaccuracies in the orbital
fit assumptions, such as the central mass distribution being point-like and at rest with re-
spect to the central stellar cluster, and (3) systematic errors in either the overall velocity
dispersion measurement for the central stellar cluster or S0-2’s individual positional mea-
surements. Further measurements are necessary to determine whether this 2 σ difference in
the estimates of the central dark mass produced by the two methods is real and, if so, what
its origin is.
While the detection of spectral lines in S0-2 provided full dynamical information, it also
offered insight, for the first time, into the nature of this star that is orbiting in such close
proximity to the central dark mass. S0-2’s spectral features are consistent with those of an
O8-B0 dwarf, suggesting that it is a massive (∼15 M⊙), young (<10 Myr), main sequence
star (Ghez et al. 2003). Less direct measurements of other stars within the central 1′′ × 1′′,
which are known collectively as the Sgr A* stellar cluster, imply that these stars might be
similarly young; specifically, their similar 2 µm luminosities and the lack of CO absorption
in spectra of individual stars (Genzel et al. 1997; Gezari et al. 2002) or in integrated spectra
of the Sgr A* stellar cluster (Eckart, Ott, & Genzel 1999; Figer et al. 2000) lead to the
conclusion that they, like S0-2, have hot photospheres consistent with massive young stars.
While the presence of young stars in close proximity to our Galaxy’s supermassive black
hole has long been recognized as a problem in the context of the young He I emission-line
stars (Sanders 1992; Morris 1993), this problem is much worse for the Sgr A* cluster stars,
whose distances from the black hole are an order of magnitude smaller. At S0-2’s apoapse
distance of 0.01 pc, inferred from the orbital solutions, the Roche density is 1014 cm−3,
whereas the maximum density determined for even the nearby circumnuclear disk, located
at radii of ∼ 1-3 pc, is only about 105 - 106 cm−3 (e.g., Jackson et al. 1993; Christopher
& Scoville 2003). Furthermore, at present, the region over which S0-2 is currently orbiting
contains only a very low-density plasma, as evidenced by weak Br-γ line emission (Figer et
al. 2000; Gezari et al. 2002). Several ideas proposed to account for the apparently young
He I emission-line stars may be applicable to the Sgr A* cluster stars and they fall into the
following three broad categories: (1) the stars are indeed young and formed in-situ, which
requires much higher local gas densities in the recent past in order to enable star formation
to proceed in the black hole’s strong tidal field (e.g., Levin & Beloborodov 2003), (2) the
stars are young and formed at larger radii, where the black hole’s tidal effects are small,
and underwent rapid orbital migration inwards (e.g. Gerhard 2001; Kim & Morris 2003;
Hansen & Miloslavjevic 2003), and (3) the stars are old (initially formed long ago), but their
appearance has been altered, due to interactions with the local environment, such that they
appear young but have had sufficient time to migrate inwards from their original birth place

– 5 –
(e.g., Morris 1993; Genzel et al. 2003a). Stellar kinematics produced by these mechanisms
are likely to differ. Well constrained orbits for a set of stars in the Sgr A* cluster would
allow a direct examination of the cluster’s kinematics and therefore would provide important
insight into how these stars formed and came to be on their present orbits.
This paper reports new proper motion measurements obtained with the W. M. Keck
10-meter telescope for 4 previously known stars (S0-1, S0-2, S0-4, S0-5) and for 3 newly
identified stars (S0-16, S0-19, S0-20). The trajectories of all of these stars show significant
curvature or linear acceleration, thus allowing the first simultaneous orbital analysis for
multiple stars making their closest approaches to the central dark mass. Section 2 describes
the observations, which now cover an 8-year time baseline. Section 3 provides the details
and results for source identification, astrometry, and the orbital fits, which, for the first time,
allow for the dark mass’ motion on the plane of the sky. Section 4.1 discusses the constraints
that the orbital parameters offer on the nature of the central dark mass distribution, which
has become the best case yet for a supermassive black hole at the center of any normal type
galaxy and whose mass, position and motion in the infrared reference frame are determined
with unprecedented accuracy. Finally, Section 4.2 explores how the direct measurements of
orbital dynamics impact the question of the origin of the central stellar cluster.
2. Observations
New K[2.2 µm]-band speckle imaging observations of the Galaxy’s central stellar cluster
were obtained with the W. M Keck I 10-meter telescope using the facility near-infrared
camera, NIRC (Matthews & Soifer 1994; Matthews et al. 1996) on the nights of 2000 April
21, 2000 May 19-20, 2000 July 19-20, 2000 Oct 18, 2001 May 7-9, 2001 July 28-29, 2002
April 23-24, 2002 May 23-24 & 28-29, 2002 June 2, 2002 July 19-20, 2003 April 21-22, 2003
July 22-23, and 2003 September 7-8. These data sets were collected and analyzed similarly
to the data sets obtained between 1995 and 1999 for this project (see Ghez et al. 1998, 2000
for details). In summary, short (texp = 0.1 sec) exposures were obtained in sets of ∼200,
resulting in a total of ∼7,000 exposures per observing run. Each frame, with a scale of
20.396 ± 0.042 mas pixel−1 (see Appendix B) and a corresponding field of view of 5.′′22 x
5.′′22, was sky-subtracted, flat fielded, bad-pixel-corrected, corrected for distortion effects,
and magnified by a factor of two. In sets of 200, the frames were shifted to the location of
the brightest speckle of IRS 16C (K = 9.8 mag) and combined to create intermediate shift-
and-add (SAA) maps, which have point spread functions (PSF) that can be described as
containing a diffraction-limited core on top of a seeing halo. These were then combined after
applying a seeing cut, which required that the seeing halo FWHM be less than ∼-0.′′4 - 0.′′6,

– 6 –
depending on the overall quality of the night. Final SAA maps have point spread functions
composed of a diffraction-limited core (θ ∼ 0.′′05), containing ∼ 4% of the radiation, on
top of a halo that has a FWHM of ∼0.′′4. In addition to averaging all the data from each
run to produce a final SAA map, these data were divided into three sub-sets to construct
“sub-maps”, which were used to determine positional and brightness uncertainties.
3. Data Analysis & Results
3.1. Source Identification
Sources are identified using the same procedure described by Ghez et al. (1998), with
a few minor modifications. As in Ghez et al. (1998), a “match filter” is applied to each
image, by cross-correlating the image with the core of its PSF, out to a radius of 0.′′06 (see
Figure 1). In a first pass at source identification, correlation peaks larger than a threshold
value are flagged as stars. Once stars are identified, a second lower threshold value is used to
track these stars in images in which they were not identified with the first threshold value;
this second pass search is limited to within a specified radius of the predicted position.
Positions of sources found in either the first or second pass search are estimated based on
the correlation map peak and only sources that are identified in at least 3 epochs are included
in our final proper motion sample. While in Ghez et al. (1998) the predicted position for
the second pass source search was simply the position found in the first pass, here we use
any kinematic information available from the first pass to define this predicted position.
Two other modifications change only the values used in the algorithm. We lowered the first
pass threshold correlation value for source identification from 0.7 to 0.5, which allows fainter
sources to be identified, and we have decreased the second pass search area radius from
0.′′07 to the uncertainty in the predicted position (with the constraint that it must be at
least 0.′′01 and no more than 0.′′07), due to the increased number of sources that are being
tracked. Positions are now estimated using gaussian fits, as opposed to a simple centroiding
algorithm. The final modification requires that each source be detected in all three sub-maps
(see §2); first and second pass sources had sub-map correlation thresholds of 0.3 and 0.2,
respectively.
Photometric values are estimated using two methods. First, simple aperture photome-
try, as described in Ghez et al. (1998), is applied to help track the sources through the data
set. Second, PSF fitting with StarFinder (Diolaiti et al. 2000) is implemented and these
are the values (average and rms) reported in Table 1. StarFinder and aperture photometry
produce the same results for bright (K . 15.2) sources, but, for the fainter sources, the
StarFinder results are somewhat fainter (∼ 0.2 mag) and more precise, due to the stellar

– 7 –
confusion. In this study, the zero points are established based on Blum et al. (1996) mea-
surements of IRS 16C (K=9.83 mag), IRS 16NW (K=10.03 mag), and IRS 16NE (K=9.00
mag), which results in magnitudes that are ∼ 0.2 mag fainter than than those reported in
Ghez et al. 1998, which relied on IRS16NE only for a zero point estimate.
While many sources are identified and tracked over our entire ∼5′′×5′′ field of view, this
study is limited to sources within a radius of 0.′′4 of the infrared position for Sgr A* (see
Appendix B); the radius is set by the criterion that all stars with accelerations of 2 mas y−2
or greater should reside within this region, assuming a mass, M , of 3.7× 10⁶M⊙ (see §4.1),
or equivalently r2max = GM/amin.
This procedure identifies 17 proper motion sources (K . 16.8), of which 10 are newly
discovered in this study2 and all of which are shown in Figure 1. The new sources are
fainter than the sources in this study that were previously published (Knew & 15.1 mag),
with only one exception (S0-8, which is located at the largest projected separation). Among
the original proper motion sample reported in Ghez et al. (1998), there are many other
sources comparably faint to the newly discovered proper motion sources, but at larger radii;
the reason for this is that at the center of the maps source confusion lowers the correlation
values and reduces the sensitivity to faint sources using our source identification technique.
The new source detections are therefore a consequence of our lower correlation thresholds
and, as can be seen in Figure 1, these thresholds are still fairly conservative, since a number
of additional sources are seen in the cross-correlation maps. While the previously known
sources are detected in all the maps, the new sources are not, due to the variation in the maps’
sensitivities and, occasionally, confusion with a brighter source (see footnotes in Table 1).
Nonetheless, sources as faint as ∼ 16.7 are detected in the majority of maps in the second
pass for source detections and sources brighter than ∼ 15.5 mag are detected in all maps
in the first pass. Table 1 lists the properties of all the detected sources in our sample; the
new sources are named according to the convention introduced in Ghez et al. 1998 and
summarized in Appendix A.
3.2. Astrometry
Stellar astrometry is derived in three separate steps. First, centroid positions on the
correlation peaks provide estimates of the stars’ locations in each of the maps. Uncertainties
in these locations are estimated based on the rms of their locations in the 3 sub-maps created
2We note that after this paper was submitted for publication, 6 of the 10 new sources were also reported
by Schodel et al. (2003).

– 8 –
for each map (see §2) and have an unweighted average value of ∼2 mas for the brightest stars
(K < 15 mag) and ∼5 mas for the K∼ 15.5 - 15.7 mag stars. Second, the coordinate system
for each map is transformed, with the application of a net translation and rotation, to a
common local reference frame. As in Ghez et al. (1998), this transformation is determined
by minimizing the net motion of the measured stars, but with the three modifications: (1)
rather than using all stars detected in the central ∼5′′×5′′, we now exclude those stars within
0.′′5 of Sgr A* as well as those that have correlation values less than 0.7, (2) the common
local reference frame is now chosen to be the map obtained at the middle epoch, 1999 July,
instead of the 1995 June map, in order to minimize the uncertainty in the coordinate trans-
formations, which increase with the temporal distance from the reference epoch, and (3) a
second pass through the minimization process is applied using initial estimates of the proper
motions from the first pass. As described in Ghez et al. (2000), positional uncertainties as-
sociated with this transformation of the relative positions of stars into a common coordinate
system are estimated by a half-sample bootstrap method. These uncertainties are minimized
at the center of the field of view, which is where the stars reported here were always observed,
and that decrease with both the number of stars included in estimating the transformation
(48 - 104 stars) and the closer in time the epoch is to the reference epoch. The values of
these uncertainties for the stars in this study range from zero, for the reference epoch of 1999
July, to 0.44, for epochs close to 1999 July, and up to 2.5 mas, for data sets at the extrema
in time of our experiment. Compared to the centroiding uncertainties, the transformation
uncertainties are negligible for the faintest stars and are, in some epochs, comparable to that
of the brightest stars in our sample. The uncertainties from the centroiding and transforma-
tion processes are added in quadrature to produce the final relative position uncertainties.
It is these relative positions that are used in the orbital analysis presented in §3.3.1 and
their weighted averages are presented in column 10 of Table 1. The third and final aspect
of the astrometric measurements is transforming the relative positions and orbital solutions
from the 1999 July map’s coordinate system to an absolute coordinate system using mea-
surements of sources with known absolute astrometry, as described in Appendix B; this final
transformation has been applied to the orbital solutions presented in §3.3.2.
Stellar confusion not only prevents faint sources from being detected (as discussed
above), but can also generate astrometric biases. Fortunately, the sources’ high proper
motions easily reveal the underlying biasing sources at later or earlier times, so that these
biases can be recognized. We exclude the biased points in a three step procedure. First,
measurements of stars during epochs in which they are obscuring other stars are temporarily
excluded; at this point, stars with remaining measurements in less than three years (S0-3 and
S0-21) are removed from further dynamical analysis due to our inability to assess the possi-
ble effects of astrometric biases. Second, with this vetted data set, we carry out preliminary

– 9 –
linear or orbit model fits, in which no parameters are constrained (see §3.3.1). Third, we
return to the original data set and remove those points that are offset by more than 3σ from
the preliminary best fit model. Column 5 of Table 1 summarizes the number of remaining
points that are used in the fits described in §3.3.2.
3.3. Orbital Analysis
Significant curvature or linear acceleration in the plane of the sky is detected for 7 of the
17 sources listed in Table 1, using the criterion defined by Ghez et al. (2000), but accounting
for the differing number of epochs by considering χ2tot instead of χ2
dof (see column 11 in
Table 1). Stars are considered to show significant deviations from linear proper motion, if
they have ∆χ2tot, which is the difference between the total χ2 value resulting from the best
linear fit and the total χ2 from the best second order polynomial fit, greater than 15. S0-1,
S0-2, S0-4, S0-5, S0-16, S0-19, and, S0-20, satisfy this criterion and have accelerations in
the plane of the sky of at least 2 mas y−2 and as much as 1500 mas y−2 and, of these, S0-2,
S0-16, and S0-19 have measurable higher order positional derivatives. We therefore carry
out orbital fits for these 7 stars with a model described in §3.3.1 and with resulting orbital
parameters given in §3.3.2.
3.3.1. Model & Method
We assume a model in which the gravitational potential arises from a single dominant
point mass, which allows multiple stars to contribute simultaneously to the solution for the
following properties of the central object:
• Mass (M)
• Location (rRA, rDEC)
• Linear motion on the plane of the sky (vRA, vDEC).
In this analysis, the point source’s distance (Ro) and its linear motion along the line of sight
(vz) are not solved for; to get M , Ro is assumed to be 8 kpc (Reid 1993), while vz is set to
0. Setting vz equal to 0 km s−1 is reasonable given that the resulting limits on the values
of vRA and vDEC (.76 km s−1) are comparable to the uncertainties on the radial velocity
measurements for S0-2 (∼40 km s−1, Ghez et al. 2003), which are the only radial velocities
used in this analysis; furthermore, Figer et al. (2003) find an average vz for a set of cool

– 10 –
stars at the Galactic Center consistent with 0 to within 11 km s−1. In addition to these 5
common free parameters, there are the following 6 free parameters for each star:
• Period (P ), which, when combined with the estimate of the central dark mass, yields
the angular semi-major axis (A)
• Eccentricity (e)
• Time of periapse passage (To), which is when the star comes closest to the central dark
mass
• Inclination (i), which is the angle between the normal to the orbital plane and the line
of sight and has values ranging from 0 to 180, with values less than 90 corresponding
to direct motion (position angles increasing with time) and values greater than 90
corresponding to retrograde motion,
• Position angle of the nodal point (Ω), which is the position angle, measured Eastward
of North, of the line of intersection between the plane of the sky through the central
dark mass and the orbital plane. In the absence of radial velocity measurements (e.g.,
all stars except S0-2), it is not possible to distinguish between the ascending and
descending nodes, which correspond to the nodal points where the star is moving away
from and towards us, respectively, and, by convention, the value less than 180 is taken;
this ambiguity generates a similar 180 ambiguity in the longitude of periapse. With
radial velocity measurements (e.g., S0-2, Ghez et al. 2003; Eisenhauer et al. 2004),
these ambiguities are removed and the ascending node is given for Ω, with permitted
values ranging from 0 to 360.
• Longitude of periapse (ω), which is the angle in the plane of the orbit, in the direction
of motion, from node to periastron, with permitted values ranging from 0 to 360.
In total, this model contains 5+N × 6 parameters, where N is the number of stars included
in the simultaneous fit. This is a more powerful approach than simply averaging the results
of N independent orbital analyses, since each star in a simultaneous solution contributes to
the determination of the common parameters, which in turn leads to a better definition of
each star’s orbital parameters.
The orbital fits, shown in Figure 2, are carried out by minimizing the chi-squared value
between the data and the model and the reported uncertainties are obtained from the co-
variance matrix, which corresponds roughly to changing the total chi-squared values by 1.
In total, the data set consists of 254 measurements - 126 positional measurements, each of

– 11 –
which provides two independent data points (one for the East-West position and the other
for the North-South position), and 2 radial velocity measurements of S0-2 from a single year,
reported by Ghez et al. (2003). While the final orbital parameters reported in Tables 2 & 3
come from a simultaneous fit, which is described in detail below, we first carry out a number
of independent and semi-independent orbital solutions to check the validity of using common
values for the central dark mass as well as to check our estimates of the positional uncer-
tainties. In these preliminary fits, the central dark mass is not allowed to move and we scale
all the estimated relative position uncertainties by a scale factor, which produces a χ2dof of 1
for the best independent fits; these scale factors modify the astrometric uncertainties by at
most only 30% and on average by only 10%. The fully independent solutions yield locations
for the central dark mass that are consistent to within 2σ, with individual uncertainties of
∼1, 4, and 25 mas for S0-2, S0-16 and S0-19, respectively, and larger uncertainties for the
remaining stars. Consistency for the central dark mass is checked by carrying out a semi-
independent fit in which the central dark object’s location is treated as a common parameter,
but its mass is not. This fit is carried out with the 3 stars - S0-2, S0-16, and S0-19 - that
yield meaningful independent mass estimates (M/δM > 3), which are consistent to within
2σ, with uncertainties of 0.2, 0.6, 1.5 (×106) M⊙, respectively. It therefore appears to be
well justified to simultaneously fit the data with a model in which the central dark object’s
properties (M, rRA, rDEC, vRA, and vDEC) are common to all the stars. Using an algorithm
described by Salim & Gould (1999), we solve for the orbital parameters simultaneously with
the inclusion of the central dark object’s linear motion on the plane of the sky as a free
parameter. Since S0-2, S0-16, and S0-19 are the only stars that have any significant implica-
tions for the central dark object’s properties, we divide the problem into two. A three-star
simultaneous fit with S0-2, S0-16, and S0-19 provides the orbital parameters for these three
stars as well as the central dark objects properties. The orbital parameters for each of the
remaining stars are obtained from a four-star simultaneous fit, which includes the star in
question plus S0-2, S0-16, and S0-19; this was done to appropriately include the effects of
the uncertainties in the central dark object’s parameters in estimates of the remaining stars’
orbital parameters. The resulting χ2dof for all the simultaneous fits are comparable to 1,
again supporting the use of a point mass potential model.
3.3.2. Orbital Fit Results
Estimates of the central dark mass’ properties from the three-star simultaneous fit are
reported in Table 2. The central dark mass is estimated to be 3.7(±0.2) × 106( Ro
8kpc)3M⊙.
While this is consistent with that inferred from the orbit of S0-2 alone (Ghez et al. 2003;
Schodel et al. 2003), its uncertainty is a factor of 3-4 times smaller due, primarily, to the

– 12 –
longer time baseline for the measurements, and, in part, to the additional information offered
by S0-16 and S0-19. This makes distance, which is fixed in all the orbital analyses reported
thus far, the limiting uncertainty for the first time (see also Eisenhauer et al. 2004); the
0.5 kpc uncertainty in the Galactic center distance (Reid 1993) contributes an additional
19% uncertainty in the estimated mass, beyond that reported in Table 2. Similarly to the
mass, the inferred center of attraction agrees well with the results from the analysis of S0-2’s
orbit by Ghez et al. (2003). The location is only modestly improved in the simultaneous fit,
because the black hole’s proper motion is treated as an unknown variable only in the multiple
star orbit model, which increases the formal uncertainties in the black hole’s location. The
estimate of the dark mass’s motion on the plane of the sky is the first such estimate derived
from orbital fits. While a single star’s orbital trajectory can, in principle, constrain this
motion, in this solution it is primarily constrained by the closest approaches of S0-2, S0-16,
and S0-19 and their span of periapse passage times of 5 years. The inferred proper motion of
the dark mass, with respect to the central stellar cluster, is 1.4± 0.5 mas yr−1, statistically
consistent with no motion. Overall, simultaneously fitting the stellar orbital motion has
allowed significant improvements in the derivation of the central dark object’s properties.
With the central parameters constrained simultaneously by multiple stars, the precision
with which each star’s orbital elements can be determined is also greatly improved compared
to that obtained from an independent orbit analysis. Table 3 lists the parameters specific to
the individual stars from the simultaneous fit. Over the course of this study (1995 - 2003),
these stars have either undergone periapse passage or are remarkably close to periapse. The
smallest periapse distance is achieved by S0-16, which comes within 45 AU with a velocity
of 12,000 ± 2,000 km s−1.
There are clear selection effects in this study that must be understood and accounted for
before the ensemble properties of the sample can be studied. Since a star has to experience
acceleration in the plane of the sky of greater than 2 mas y−2 to be included in the orbital
analysis, there is an observational bias towards detecting stars in eccentric orbits at periapse,
in spite of the fact that a star spends most of its time away from periapse. Stars experience
their largest acceleration near periapse, at a projected distance which scales as q = A(1− e).
For a given semi-major axis above ∼3200 AU, this allows stars in highly-eccentric orbits
to have detectable accelerations near their closest approach, while stars on low-eccentricity
orbits will be below the detection threshold in all parts of their orbits. Figure 3 quantifies
these effects based on the fraction of time a face-on orbit experiences accelerations larger
than our threshold value. Four stars – S0-2, S0-16, S0-19, and S0-20 – lie in the parameter
space that is unbiased, 1 star – S0-1 – resides in a region that is mildly biased (∼50% effect),
and the last 2 stars – S0-4 and S0-5 – are detected only because they are on eccentric orbits
and remarkably close to periapse passage. The excess of high eccentricity orbits in our sample

– 13 –
is therefore a consequence of an observational bias; restricting the analysis to the 5 stars for
which the bias is .50% effect, we find 2 stars with eccentricities .0.70, which is statistically
consistent with isotropy, if we assume that an isotropic system has a cumulative probability
distribution ∝ e2 (Binney & Tremaine 1987).
The distribution of semi-major axes is also noteworthy. While there are no observational
selection effects against it, there is a distinct lack of stars as bright as those tracked in this
study (K. 15.5) having semi-major axes .1000 AU, and likewise apoapse distances of.1800
AU. The other end of these distributions, however, are not seen due to selection effects.
In contrast to the shape of the orbit, its orientation should be unaffected by observational
bias. To fully describe the orientations of the orbits, it is necessary to specify the directions
of two vectors, one normal to the orbital plane, such as the angular momentum vector, and
one along the semi-major axis, such as the direction to apoapse. For S0-2, which has both
astrometric and radial velocity measurements, the full three-dimensional orbit is unambigu-
ously determined. For the stars with only astrometric measurements available, however, a
degeneracy exists from a possible reflection about the plane of the sky; we therefore assume
that these orbits are oriented such that the unit angular momentum and apoapse direction
vectors are in the same hemisphere as those quantities derived for S0-2. Figures 4 and 5
show the directions for these unit vectors. The directions of neither the angular momentum
nor apoapse vectors show any clear preferred direction or co-planarity, and are statistically
consistent with a random distribution of orbits.
4. Discussion
4.1. The Case for and Properties of the Central Supermassive Black Hole
Stellar orbits provide the most direct measure of the amount of dark matter concentrated
at the center of the Galaxy. Compared to masses inferred from the velocity dispersion
measurements, the mass derived from multiple orbits, 3.7(±0.2) × 106M⊙, is a factor of 2
higher than that estimated by a non-parametric approach presented by Chakrabarty & Saha
(2001), which is supposed to be the most robust approach, and is somewhat less discrepant
with the parametric approaches (e.g., Ghez et al. 1998; Genzel et al. 2000; Schodel et al.
2003). Since the mass estimates from the velocity dispersion measurements and orbital fits
have all assumed the same distance and all depend on distance as Ro3, the assumptions
about distance are not the source of this mass discrepancy. By simultaneously solving for
multiple orbits, we now have only one more parameter left out of the fit for a Keplerian
orbit model, that of the black hole’s motion along the line of sight. Given the small values

– 14 –
for its motion on the plane of the sky, this last parameter is unlikely to have any significant
effect on the estimated mass. The two possibilities therefore lie in problems with the mass
estimates from the velocity dispersions. First, the mass estimates could be biased by the
weighting schemes used to calculate the velocity dispersions. While roughly 100 stars have
reported proper motion values in the earlier works of Ghez et al. 1998 and Genzel et al.
2000, only 18 of these have S/N > 5 and half of them have S/N < 3, making the velocity
dispersion bias term non-negligible. Second, the projected mass estimators could be biased
by the properties of the central stellar cluster. Specifically, both the level of anisotropy and
the slope of the stellar density distribution can significantly alter the values inferred from
standard projected mass estimators (Genzel et al. 2000; Figer et al. 2003). Different results
have been reported both for the presence of anisotropy (Ghez et al. 1998; Genzel et al. 2000;
Schodel et al. 2003) and the radial distribution of stars (Scoville et al. 2003; Genzel et al.
2003a; Figer et al.). While a full exploration of these effects is outside the scope of this
paper, here we emphasize that the orbital mass is more robust and should be used in all
future characterizations of the Galaxy’s central dark mass concentration.
Stellar orbits confine the central dark mass of 3.7(±0.2)×106( Ro
8kpc)3M⊙ to within 45 AU,
the closest approach of S0-16, implying a minimum density of 8×10¹⁶M⊙/pc3 for the central
dark mass. This confines the mass to a volume that is a factor of 20 smaller than that inferred
from S0-2 (Schodel et al. 2002; Ghez et al. 2003) and increases the inferred density by four
orders of magnitude compared to estimates from measurements of acceleration vectors (Ghez
et al. 2000; Eckart et al. 2002). At this density, the two existing alternative explanations
to a supermassive black hole for the compact dark object found at the center of the Galaxy
become significantly less tenable (see also Schodel et al. 2002). Any cluster of dark objects,
such as those considered by Maoz (1998), would have a lifetime of a mere ∼105 years, owing
to gravitational instability, which is significantly shorter than the age of the Galaxy, making
this a highly unlikely explanation for the central dark mass concentration. For the fermion
ball hypothesis (Viollier et al. 1993), the mass of the constituent particles is now required
to be 74keV c−2(0.3R)3/8(2
g)1/4(3.7×106
M)1/8, where R and M are the radius in milli-pc and mass
in M⊙ of the fermion ball, respectively, and g is the spin degeneracy factor of the fermion;
this is 5 orders of magnitude larger than the current limits on degenerate neutrino species
(Spergel et al. 2003), rendering the fermion ball hypothesis also highly unlikely (see also
discussion in Schodel et al. 2002). With the Galaxy’s central dark mass now confined to a
radius equivalent to 600 × the Schwarzchild radius of a 3.7×10⁶M⊙ black hole, the multiple
stellar orbits present the strongest case yet for a supermassive black hole at the center of the
Milky Way galaxy.
The measured linear velocity of the central black hole on the plane of the sky limits
the mass of any possible companion black hole, through the assumption that any velocity

– 15 –
is due to reflex motion. With a 1 σ upper limit of 2 mas y−1, the mass of any possible
companion black hole is constrained to be less than ∼ 5 × 10⁵(R/16, 000AU)1/2M⊙, where
R is the distance of the companion black hole from the central black hole; the generalization
of this limit to other radii works as long as the black hole companion lies outside the orbits
that contribute to the determination of the central dark object’s properties (Table 3) and
that the orbital period is long compared to the duration of the study, 8 years. A related
measurement comes from upper limits inferred for the motion of the radio source Sgr A*,
which is assumed to be associated with the central black hole (see discussion in §4.2). In
the plane of the Galaxy, the upper limit is ∼ 20-25 km s−1 (Backer & Sramek 1999; Reid
et al. 1999; Reid & Brunthaler 2004, which is comparable to our limits. Perpendicular to
the Galaxy, Reid & Brunthaler (2004) derive a more constraining upper limit of ∼1 km
s−1. Nonetheless, the infrared and radio measurements are fundamentally different. In the
infrared, the black hole’s motion is measured with respect to the central stellar cluster, which
traces the local barycenter, while in the radio, Sgr A*’s motion is derived with respect to
background quasars, so motions of the black hole along with the central stellar cluster as
well as the solar parallax show up in this measurement. Therefore, while the radio upper
limit on the motion of Sgr A* is smaller than the infrared upper limit on the motion of the
black hole, the latter is a more direct measure of the upper limit for the reflex motion from
a possible black hole companion.
In the context of other galaxies, the Milky Way’s central dark mass concentration distin-
guishes itself in terms of both its inferred density and mass. The Galaxy’s central minimum
dark mass density now exceeds the minimum dark matter density inferred for NGC 4258
(Greenhill et al. 1995; Miyoshi et al. 1995) by five orders of magnitude, reinforcing the Milky
Way as the strongest case for a black hole at the center of any normal type galaxy.
It is also possible to use the observed dark mass concentration in the Milky Way to
further explore the fermion ball hypothesis as a universal alternative explanation for su-
permassive compact objects in all galaxies as has been proposed in the past. For objects
composed of the minimum mass particles imposed by the stellar orbits in the Galactic center,
the maximum mass is 1 × 10⁸M⊙(76keVmc2
)2(2g)1/2, from the Oppenheimer-Volkoff limit (Mun-
yaneza & Viollier 2002). This is less massive than half of the supermassive compact objects
that have been identified thus far (cf., for example, the compilation in Tremaine et al. 2002),
thereby eliminating an all-encompassing fermion ball hypothesis.
In contrast to its high minimum central dark mass density, the Milky Way appears to
harbor the least known massive supermassive black hole, as inferred directly from dynamical
measurements. It therefore potentially has an important role to play in assessing the Mbh vs.
σ relations (e.g., Ferrarese & Merritt 2000; Gebhardt et al. 2000). However, the current

– 16 –
impact of the Milky Way on the Mbh vs. σ relation is limited by uncertainties in the
determination of its bulge velocity dispersion (Tremaine et al. 2002). Nonetheless, the higher
mass value from the orbits brings our Galaxy into better agreement with the Mbh vs. σ
relationship derived from a large sample of galaxies (e.g., Tremaine et al. 2002; Merritt &
Ferrarese 2001).
4.2. Sgr A* and other Possible Counterparts to the Central Black Hole
The orbits provide very precise information on the location and kinematics of the central
supermassive black hole, allowing us to explore its association with the radio source Sgr A*
and any possible near-infrared counterparts. In Appendix B, we derive the infrared position
of the radio source Sgr A*. Relative to the dynamically determined position of the central
dark mass, which is known to within 1.3 mas (1 σ), the inferred infrared position of Sgr A*,
which is less accurately known - is offset by a mere 0.5 ± 6.4 mas W; and 9 ± 14 mas S;
the two positions therefore appear to be consistent to within 1σ. Furthermore, using the
kinematics of S0-2 from Ghez et al. (2003) and the upper limit on the motion of Sgr A*,
Reid et al. (2004) argue that Sgr A* has a minimum mass of 4× 10⁵M⊙, consistent with the
black hole mass estimated from orbital motion. Given the agreement in position, velocity
(discussed in §4.1), and mass, it appears that Sgr A* is indeed associated with the black
hole at the Galaxy’s center.
Identifying near-infrared counterparts to the central black hole is a difficult task, given
the high stellar densities, velocities, and accelerations at that location. S0-19 serves as a good
illustration of these challenges. Its large proper motion and strong curvature in a crowded
region makes it challenging to track and led Genzel et al. (1997) to propose their 1996.43
detection of this source (their label S12) as the best candidate for the infrared emission from
the central black hole; at that time, this source was coincident to within 1σ (30 mas) of
the relatively crude position of Sgr A* reported by Menten et al. (1997). With the newly
determined location of the black hole based on orbits, it is now clear that this source is offset
by 54 mas, or 41σ, from Sgr A* and that it is simply one data point in the trajectory of the
high velocity star S0-19 that, in 1996, was near the black hole3.
The search for infrared counterparts to the central black hole is greatly facilitated by the
3S0-19 was detected by Ghez et al. (1998) in 1995 with two possible counterparts identified in 1996.
With limited time coverage, Ghez et al. (1998) were not able to definitively identify either as the correct
counterpart to either S0-19’s 1995 position or Sgr A* and therefore did not include this source in their proper
motion sample.

– 17 –
use of stellar orbital motions to refine its location by a factor of 20 compared to Menten et al.
(1997) and a factor of 8 compared to Reid et al. (2003). During 4 of the 9 years of this study,
a star with measurable proper motions is detected within 54 mas of this location preventing a
faint counterpart from being easily detected (S0-19 in 1995, S0-16 in 2000, and S0-2 in 2001-
2002). S0-21 (K=16.1 mag) is the only source in this study without unambiguous proper
motion and its 3 measurements are all within 3σ of the black hole’s location; with only a 1
year time baseline (1998.25-1999.56) its proper motion is less than 22 mas y−1 (1σ). While
this could be a counterpart, we believe that it is not. There are 2003 correlation peaks that do
not pass our 3-submap requirement, but, if real, indicate that S0-21 has measurable proper
motion over this longer time baseline. In the remaining 3 years, 1996-1997 and 2003, there
is no source detected by the relatively conservative source identification criteria set forth
in §3.1 within 3 σ of the dynamically determined location of the black hole. We therefore
infer that no steady source brighter than ∼15.5, the magnitude of the faintest star we were
able to identify in this region in all epochs without any a priori-information (see §3.1), was
coincident with our inferred black hole position during our observations (see also Hornstein
et al. 2002, 2003)4.
4.3. The Origin of the Central Stellar Cluster
The orbital parameters derived here provide important clues for understanding the
origin of the Sgr A* cluster stars, which appear to have hot photospheres similar to those
of massive young stars (Genzel et al. 1997; Eckart et al. 1999; Figer et al. 2000; Gezari et
al. 2002; Ghez et al. 2003). In the context of the luminous He I emission line stars, which
are located an order of magnitude further from the black hole than the Sgr A* cluster stars,
several ideas have been proposed to account for apparently young stars in a region whose
current conditions seem to be inhospitable to star formation: 1) that these are old stars
masquerading as youths, 2) that they were formed more or less in-situ by a cataclysmic
compression of an already dense cloud or disk, and 3) that they were formed elsewhere as
part of a massive cluster, but migrated inwards rapidly by dynamical friction. Here, we
briefly examine each of these hypotheses in the context of the Sgr A* cluster stars.
4We note that after submission of this paper, a variable source coincident with Sgr A* was detected at
near-infrared wavelengths (Genzel et al. 2003b; Ghez et al. 2004); its characteristics are consistent with our
non-detection of a steady source brighter than 15.5 mag

– 18 –
4.3.1. Old Stars Masquerading as Youths
Stellar mergers of relatively old stars can, if the stellar density is sufficiently large,
produce stars massive enough to appear as main-sequence OB stars. This scenario is likely
to produce stars whose orbits are isotropically distributed, consistent with our observations.
However, there are several challenges to this hypothesis for the stars in the Sgr A* cluster.
First, several successive mergers of stars of increasing mass are required to produce a star
resembling S0-2 (∼O9.5, M ∼ 15M⊙; Ghez et al. 2003), unless the mass segregation in this
region has been so strong that only stars ≫ 1M⊙ are left. Second, as the merger products
become more massive, their nuclear lifetimes decrease, so that there is less time available
for the next merger event in the sequence. Using a Fokker-Planck approach, Lee (1996)
investigated the stellar merger hypothesis for the massive emission-line stars in the central
parsec, and concluded that an insufficient number of them is likely to be present. The
Sgr A* cluster stars, however, are much more concentrated toward the center where the
stellar density is maximized (Genzel et al. 2003a) and the collision time is correspondingly
shorter, so in this respect, merger events may be relatively favored there. However, the third
challenge is that the velocity dispersion of stars near the supermassive black hole, 400 km s−1
at 0.01 pc (e.g., Ghez et al. 1998), is comparable to the escape velocity from the surface of a
main-sequence O9.5 star, ∼1000 km s−1, so collisions in the volume occupied by the Sgr A*
cluster stars are therefore less likely to lead to mergers and mergers that do occur are likely
to be accompanied by significant mass loss (Freitag & Benz 2002). A fourth consideration
which may disfavor the collisional mechanism is the relatively normal rotation rate of S0-2
(Ghez et al. 2003). Alexander & Kumar (2001) have found that tidal encounters between
main-sequence stars in the central cluster can eventually spin up those stars to near break-
up speed. Colliding stars effectively represent an extreme example of this phenomenon,
so merger products should be much more rapidly rotating than S0-2 appears to be. Of
course, the apparent rotation rate of S0-2 can be attributed to a particular, low-probability
orientation, so the measurement of absorption-line widths in just one additional member of
the cluster should clarify this point. While further calculations are clearly required to assess
the importance of this complex mechanism, at present it appears to be quite unlikely.
Another suggestion to account for the Sgr A* cluster stars without invoking star for-
mation is that they may be exotic objects. This catch-all category includes a number of
possibilities. For example, it is reasonable to expect that stellar remnants such as neutron
stars and black holes sink into the central few milli-parsec as a result of dynamical mass
segregation (Morris 1993; Lee 1996; Miralda-Escude & Gould 2000). Mergers of these rem-
nants with normal stars could produce Thorne-Zytkow objects, or, in the case of black hole
remnants, something with dubious long-term stability. However, Thorne-Zytkow objects are
expected to appear as red giants or supergiants rather than massive blue stars, and may be

– 19 –
unstable; likewise, stable stellar objects with black hole cores have yet to be described. If the
stellar remnant that undergoes a merger is a white dwarf, then a “reborn star” results, and
it could be suitably luminous. However, such an object would probably be a red giant rather
than an early-type star, and in any case, the white dwarf precursor is likely to have migrated
out of the central region because of its low mass. Another, slightly less exotic possibility for
the Sgr A* cluster stars is that they be the exposed, hot cores of tidally stripped red giant
stars. Indeed, there appears to be a paucity of red giants in the inner 0.2 pc of the Galaxy
(Sellgren et al. 1990; Genzel et al. 1996), suggesting that red giant atmospheres are collision-
ally removed there, possibly by collisions with binaries (Davies et al. 1998). However, the
luminosity of the exposed stellar cores may be too small to account for the Sgr A* cluster
stars (e.g., Schonberner 1981, 1983).
4.3.2. Recent In-Situ Star Formation
The second category of hypotheses is that the early-type stars really did form recently
in situ. To do this, the parent cloud would have to have undergone violent compression
to densities exceeding the limiting Roche density.5 This hypothesis warrants consideration
because the mechanism for violent compression of any cloud passing close to the black hole
is innate to the model. A dense cloud brought within 0.02 parsecs of the supermassive black
hole would unavoidably lead to a high rate of accretion onto the black hole. If the onset of
this accretion is rapid, the resultant release of accretion energy would be powerful enough to
compress the cloud. Morris, Ghez & Becklin (1999) proposed that this process can manifest
itself as part of a limit cycle involving the circumnuclear disk (CND). This disk currently
has a central cavity of 1 parsec radius, presumably because of the outgoing ram pressure
of the winds from the cluster of luminous, early-type stars in the central parsec. However,
as the lifetimes of these stars is ∼107 years, and because the CND itself undergoes viscous
evolution on times more comparable to the orbital time at the inner radius, ∼ 5 × 10⁴
years, the inner edge of the CND will migrate toward the central black hole on a time scale
comparable to the stellar evolution time. When the first portions of the CND reach the
central black hole, the outgoing shock resulting from the accretion event provokes massive
5Tidal compression may be a contributor: a cloud moving toward the center on a purely radial trajectory
will experience a compression in two-dimensions, although this would be partially counteracted by distension
in the radial dimension, so that the net compression would not be a strong function of radius, and is not
likely, by itself, to be able to raise the density by the many orders of magnitude necessary. In addition, any
non-radial motion would imply a tidal shear in the azimuthal direction which would also counteract the tidal
compression.

– 20 –
star formation in the now nearby disk by strong compression. The strong winds from these
stars cause the inner disk boundary to recede and the cycle begins anew. A weakness of this
hypothesis is the magnitude of the required compression. While the density of a cloud which
has migrated close to the black hole might be substantially larger than the densities so far
inferred for any of the gas in the region, it is difficult to see how even the most effective
compressive event can bring gas up to the limiting Roche density.
4.3.3. Recent Star Formation at Large Galactic Center Distance Accompanied by Rapid
Orbital Migration
The third hypothesis which has been considered is that the early-type stars in the
central parsec formed well outside the central parsec, but migrated inward under the action
of dynamical friction on time scales substantially less than their nuclear time scale, ∼107
years. This is not possible for individual stars (Morris 1993), but Gerhard (2001) has pointed
out that, because the dynamical friction time scale is inversely proportional to an object’s
mass, sufficiently massive clusters can migrate to the central parsec from radii of tens of
parsecs within the required time, especially if they remain bound to their parent cloud. This
hypothesis has been investigated numerically by Kim & Morris (2003) and Portegies-Zwart,
McMillian & Gerhard (2003), who clarify that very massive clusters are required – 105−6 M⊙,
far more massive than even the extreme (for our Galaxy) Arches and Quintuplet clusters (e.g.,
Figer, McLean, & Morris 1999; Figer et al. 2002). Core collapse is inevitable in the massive,
dense clusters required for the cluster inspiral hypothesis. This process helps ensure that, in
spite of tidal stripping of stars outside the cluster core as the cluster migrates inward, there
remains a tightly bound, cluster core that survives intact into the central parsec. However,
Kim & Morris find that the mass of stars reaching the central parsec, for any feasible initial
cluster mass, substantially exceeds the mass of early-type stars in the central parsec cluster.
More recently, Portegies-Zwart and McMillan (2002, see also Rasio, Freitag, & Gurkan
2004) have raised the possibility that core collapse in sufficiently massive clusters proceeds
all the way to the formation of an intermediate-mass black hole (IBH), which can carry
cluster stars in with it as it spirals inward by dynamical friction. The implications of such
a cluster-produced IBH for the distribution of early-type stars in the central parsec have
recently been investigated by Hansen & Milosavljevic (2003). They argue that the HeI
emission-line stars in the central parsec have been tidally stripped from the IBH during
successive passages near the supermassive black hole, but that they retain a memory of the
IBH orbit. Furthermore, cluster evaporation during the inspiralling process leads to a marked
decrease in the effectiveness of this process; a remnant core of an initially globular-cluster-

– 21 –
mass cluster can reach the central parsec only by distributing a large number of early-type
stars at all radii, whereas there is currently no evidence for a young population beyond the
central parsec. In addition, Kim, Figer, & Morris (2004) find that an IBH helps deliver stars
to the central parsec only if it contains at least 10% of the cluster mass, far larger than
masses obtained in simulations of successive merger (Portegies-Zwart & McMillan). Further
investigations of this hypothesis are warranted, though it currently appears to suffer from a
number of difficulties.
Both the in situ formation mechanism and the evaporating, inspiralling cluster mecha-
nism will lead primarily to a disk of stars, the first because the inwardly migrating reservoir
of gas inevitably forms a disk by virtue of its angular momentum, and the second because
the stars lost from the cluster will retain a memory of the direction of the cluster angular
momentum. While most of the early-type emission-line stars in the central parsec appear
to orbit in or near a well-defined plane (Levin & Beloborodov 2003), the stars in the SgrA*
cluster do not. Levin & Beloborodov argue that the SgrA* cluster stars and the more dis-
tant emission-line stars all formed at about the same time in a starburst taking place in a
thick accretion disk around SgrA* (see also Nayakshin & Cuadra 2004). Unlike the He-I
emission line stars, the orbits of the SgrA* cluster stars are likely to have been altered by
Lens-Thirring precession caused by the massive central black hole, so that their orbital an-
gular momenta vectors should form a plane, which is inconsistent with the observations (see
Figure 3). This suggests that the Sgr A* cluster stars were not formed by these mechanisms,
which produce an initial common direction for the angular momentum vector.
One alternative hypothesis for the tight orbits of the SgrA* cluster stars is that they
have resulted from the tidal disruption of massive star binaries as stars presumably related
to the HeI emission-line stars undergo relatively close passages by the supermassive black
hole (Gould & Quillen 2003). These authors estimate that a sufficient number of single stars
resembling S0-2 can be scattered onto orbits similar to those of the SgrA* cluster stars to
explain that cluster, if they originate in binary systems undergoing close passage by the black
hole. Multiple encounters with other stars in this region are required to bring the apoapse
distances down to the range of values exhibited by the SgrA* cluster stars, i.e., far smaller
than the typical orbital radii of the more massive emission-line stars. It remains to be seen
whether this hypothesis can account for the SgrA* cluster stars.
In sum, there are serious difficulties or open questions associated with all of these hy-
potheses, although few of them can be definitively ruled out. While the stars with known
orbits offer modest support for hypotheses that produce isotropic distributions, this is based
on a very small sample. Additional orbits for stars in the vicinity of the central black hole
may ultimately provide a sufficiently strong constraint to cull this list of possibilities. In the

– 22 –
meantime, we are left with an interesting conundrum.
5. Conclusions
After almost a decade of diffraction-limited imaging at the W. M. Keck I 10-meter tele-
scope, we have obtained orbital solutions for multiple stars. This orbital analysis has the
advantage of simultaneously solving for a common set of properties for the central dark ob-
ject, which not only reduces the uncertainties in the black hole’s mass and location compared
to an analysis that treats each star independently, but also provides the first direct measure
of the black hole’s velocity with respect to the central stellar cluster. Together, the stellar
motions reveal a central dark mass of 3.7(±0.2) × 106( Ro
8kpc)3M⊙ and confine it to within a
radius of a mere 45 AU or equivalently 600 Rsh, dramatically strengthening the case for a
supermassive black hole, the location of which is now determined to within ± 1.3 mas (10
AU). Consequently, the dark mass at the center of the Milky Way has become the most
ironclad case of a supermassive black hole at the center of any normal type galaxy.
The precision of the proper motion and radial velocity measurements opens up additional
new realms for dynamical studies in the Galactic Center. First is the possibility of doing a
full orbital model, which also solves for the distance to the central black hole as well as its
motion along the line of sight (Salim & Gould 1999; Ghez et al. 2003). While solving for
the motion along the line of sight will require several more years of radial velocity data on
preferably several stars, only one more year of both astrometric measurements and radial
velocity measurements for S0-2 alone should provide the most direct and precise estimate of
the distance to the Galactic Center (see, e.g., Eisenhauer et al. 2003). A second opportunity
is the possibility of detecting deviations from a Keplerian orbit. These might arise from
precession of the periapse distance due to general relativistic effects (Jaroszynski 1998; Fragile
& Matthews 2000), which would require the discovery of a star with a significantly smaller
periapse passage than has been found so far, or, more likely, an extended mass distribution
(Rubilar & Eckart 2001), in the form of either an entourage of stellar remnants surrounding
the central supermassive black hole, a spike of dark matter particles (Gondolo & Silk 1999;
Ullio et al. 2001; Gnedin & Primack 2004) or a binary black hole.
The stars that have been the tracers of the gravitational potential are themselves quite
interesting. Their spectral features suggest that they are young (<10 Myr). Since these
stars currently reside in a region that is inhospitable to star formation, they are either old
stars whose appearance has been significantly altered or they are young stars formed by a
mechanism that is able to circumvent the challenges presented by the central black hole.
This study, for the first time, uses the kinematics of stars in the Sgr A* cluster to shed

– 23 –
light on this paradox. Among the notable properties are eccentricity, angular momentum,
and apoapse distributions that show no statistically significant departures from an isotropic
distribution. This differs significantly from the He-I emission line stars, which appear to be
co-planar. It therefore appears that the two populations of young stars in the vicinity of
the Galactic Center black hole - the Sgr A* cluster stars and the He-I emission line stars -
formed by different mechanisms. In particular, it is unlikely that the Sgr A* cluster stars
formed from a disk. Additional orbits will help to clarify the ensemble kinematics of this
unusual group of stars, which reside in a particular complex region.
The authors thank Joel Aycock, Randy Campbell, Bob Goodrich, David LeMignant,
Chuck Sorensen, and Peter Wizinowich at the Keck Observatory for their help in obtaining
the new observations, Gary Chanan for making it possible to phase the Keck Telescope on
NIRC, Mark Reid for advance information on IRS 9 and 12N, Mike Jura, Brad Hansen, Raoul
Viollier, and Shelley Wright for helpful conversations, and an anonymous referee for a helpful
review. Support for this work was provided by the National Science Foundation grant AST-
9988397 and the National Science Foundation Science and Technology Center for Adaptive
Optics, managed by the University of California at Santa Cruz under cooperative agreement
No. AST-9876783, and the Packard Foundation. The W.M. Keck Observatory is operated
as a scientific partnership among the California Institute of Technology, the University of
California and the National Aeronautics and Space Administration. The Observatory was
made possible by the generous financial support of the W.M. Keck Foundation. The authors
also wish to recognize and acknowledge the very significant cultural role and reverence that
the summit of Mauna Kea has always had within the indigenous Hawaiian community. We
are most fortunate to have the opportunity to conduct observations from this mountain.
A. Source Naming
Newly identified sources are named here using the convention introduced by Ghez et al.
(1998), which was designed to directly convey relevant information about the location of the
source relative to the position of Sgr A∗. Originally, the Sgr A∗ position given by Menten et
al. (1997) was adopted and the surrounding field was divided into concentric arcsecond-wide
annuli centered on this position. Stars lying within the central circle, which has a radius of
1 arcsecond, were given names S0-1, S0-2, S0-3, etc. Stars lying in the annulus between radii
of 1 to 2 arcseconds were given the names S1-1, S1-2, and so on. The number immediately
following ”S” thus refers to the inner radius of the annulus in which the star lies. The number
following the hyphen was ordered in the sense of increasing distance from Sgr A* within each
annulus at the time of its naming. In this scheme, newly identified sources are named by

– 24 –
incrementing the number following the hyphen within each annulus and ordered in the sense
of increasing distance from Sgr A∗ at the time of discovery. Since the original list within
1 arcsecond ended at 15, the newly identified stars begin with 16. S0-16, S0-17, and S0-18
were labeled by us in a recent spectroscopic paper (Gezari et al. 2001) and S0-19 and S0-20
were first presented at the Rees Symposium “Making Light of Gravity,” held in Cambridge,
England (July 2002). Due to the motions of stars, and refinements in the location of Sgr
A*, the current distance rank does not necessarily match the one at the time of discovery.
B. Absolute Astrometry
Estimates of the camera’s pixel scale and orientation, as well the position of Sgr A*,
require tying the relative measurements to an absolute reference frame. This was done by
obtaining multiple telescope pointings that allow the construction of mosaics covering the
positions of Sgr A* and two SiO masers, IRS 7 and IRS 10EE in 1998 May, 1998 Aug, 1999
May, 1999 July, 2000 May, 2000 July, 2001 May, 2001 July. In 1999 July, a somewhat larger
region was covered to include the positions of two additional masers, IRS 9 and 12N. By
combining our infrared astrometry with radio astrometry from Reid et al. (2003), we derive
a pixel scale, 20.396 ± 0.042 mas pix−1, a position angle of North with respect to NIRC
columns in 1999 July, 0.80 ± 0.14 degrees, and a location of Sgr A*, which is located to
within ±6.4 (E-W) mas and 14 (N-S) mas; Table 4 lists the positions, with respect to Sgr
A*, of IRS 16NW and IRS 16C.
The infrared positional uncertainties obtained in this procedure are larger than can be
explained by uncertainties in the infrared centroids of these bright stars or the alignment of
the map to a common epoch. This, most likely, reflects a small residual distortion in the
NIRC camera 6. The effects of distortion are minimized in our measurements of the Sgr
A* cluster stars by always positioning them at the center of the field of view and carrying
out the observations over similar ranges of parallactic angle during every observing run 7.
In contrast, the masers not only occupied different camera positions, but were measured at
different times during the night, resulting in non-constant relative position vectors on the
camera between each maser and Sgr A* from run to run. This, unlike the measurements
6A known distortion in the NIRC optics is corrected for in the individual exposures before the SAA maps
are made, however any distortion introduced by the reimager (Matthews et al. 1996) has not been accounted
for and is the likely source of additional measurement error.
7The rotator was turned off during this experiment so the direction of North with respect to the camera,
the parallactic angle, changes throughout the night.

– 25 –
of the stars within the Sgr A* cluster, maximally sampled the effects of distortion, which
amount to a ∼0.3 pixel offset from the center of the field of view to the edge (a 0.2% effect).
This distortion is what dominates our uncertainties in the inferred infrared position of Sgr
A* (±6 mas), which are nonetheless almost a factor of two smaller that that obtained by
Reid et al. (2003, ±10 mas) in their infrared reference frame. In contrast, the distortion
is not a significant effect for the relative stellar position measurements of stars in Table 1,
which have a maximum displacement of ∼0.′′3 over the course of this study and therefore
experience at most a ∼0.6 mas offset from distortion.
REFERENCES
Alexander, T. & Kumar, P. 2001, ApJ, 549, 948
Backer, D. C., & Sramek, R. A. 1999, ApJ, 524, 805
Binney, J. & Tremaine, S. 1987, Princeton, NJ, Princeton University Press, 1987, 747
Chakrabarty, D., & Sarah, P. 2001, AJ, 122, 232
Christopher, M. H. & Scoville, N. Z. 2003, ASP Conf. Ser. 290: Active Galactic Nuclei: From
Central Engine to Host Galaxy, 389
Davies, M. B., Blackwell, R., Bailey, V. C., Sigurdsson, S. 1998, MNRAS, 301, 745
Diolaiti, E., Bendinelli, O., Bonaccini, D., Close, L., Currie, D., & Parmeggiani, G. 2000,
A&AS, 147, 335
Eckart, A., & Genzel, R. 1997, MNRAS, 284, 576
Eckart, A., Genzel, R., Ott, T., & Schodel, R. 2002, MNRAS, 331, 917
Eckart, A., Ott, T., & Genzel, R. 1999, A&A, 352, L22
Eisenhauer, F., Schodel, R., Genzel, R., Ott, T., Tecza, M., Abuter, R., Eckart, A., &
Alexander, T. 2003, ApJ, 597, L121
Ferrarese, L., & Merritt, D. 2000, ApJ, 539, L9
Fragile, P. C., & Mathews, J. 2000, ApJ, 542, 328
Freitag, M., & Benz, W. 2002, A&A, 394, 345
Figer, D. F. et al. 2000, ApJ, 533, L49

– 26 –
Figer, D. F., McLean, I. S., & Morris, M. 1999, ApJ, 514, 202
Figer, D. F., et al. 2002, ApJ, 581, 258
Figer, D. F., et al. 2003, ApJ, 599, 1139
Figer, D. 1995, Ph.D. Thesis, University of California, Los Angeles
Gebhardt, K. et al. 2000, ApJ, 539, L13.
Genzel, R., Eckart, A., Ott, T., & Eisenhauer, F. 1997, MNRAS, 2 91, 219
Genzel, R., Pichon, C., Eckart, A., Gerhard, O. E., Ott, T., 2000, MNRAS, 317, 348
Genzel, R. et al. 2003a, ApJ, 594, 812
Genzel, R. Schodel, R., Ott, T., Eckart, A., Alexander, T., Lacombe, F., Rouan, D., &
Aschenbach, B. 2003b, Nature, 425, 934
Genzel, R., Thatte, M., Krabbe, Kroker, H., & Tacconi-Garman, L. E. 1996, ApJ, 472, 153
Gerhard, O. 2001, ApJ, 546, L39
Gezari, S., Ghez, A. M., Becklin, E. E., Larkin, J., McLean, I. S., Morris, M. 2002, ApJ,
576, 790
Ghez, A. M., Duchene, G., Matthews, K., Hornstein, S. D., Tanner, A., Larkin, J., Morris,
M., Becklin, E. E., Salim, S., Kremenek, T., Thompson, D., Soifer, B.T., Neugebauer,
G., McLean, I. 2003, ApJ, 586, L127
Ghez, A. M., Klein, B. C., Morris, M., & Becklin, E. E. 1998, ApJ, 509, 678
Ghez, A. M., Morris, M., Becklin, E. E., Tanner, A., & Kremenek, T. 2000, Nature, 407, 349
Ghez, A.M., Wright, S.A., Matthews, K., Thompson, D., LeMignant, D., Tanner, A., Horn-
stein, S.D., Morris, M., Becklin, & Soifer, B. T. 2004 ApJ, 601, L159
Gondolo, P., & Silk, J. 1999, Phys. Rev. Lett., 83, 1719
Gould, A., & Quillen, A. C. 2003, ApJ, 592, 935
Gnedin, O. Y. & Primack, J. R. 2004, Physical Review Letters, 93, 061302
Greenhill, L. J., Jiang, D. R., Moran, J. M., Reid, M. J., Lo, K. Y., Claussen, M. J. 1995,
ApJ, 440, 619

– 27 –
Haller, J. W., Rieke, M. J., Rieke, G. H., Tamblyn, P., Close, L., & Melia, F. 1996, ApJ,
456, 194
Hansen, B. M. S., & Milosavljevic, M. 2003, ApJ, 593, L77
Hornstein, S. D., Ghez, A. M., Tanner, A., Morris, M., Becklin, E. E., Wizinowich, P, 2002,
ApJ, 577, L9
Hornstein, S. D., Ghez, A. M., Tanner, A., Morris, M., & Becklin, E. E. 2003, “Limits on
the Short Term Variability of Sagittarius A* in the Near Infrared,” Astron. Nachr.,
Vol. 324, No. S1, Special Supplement ”The central 300 parsecs of the Milky Way”,
Eds. A. Cotera, H. Falcke, T. R. Geballe, S. Markoff
Jackson, J. M., Geis, N., Genzel, R., Harris, A. I., Madden, S., Poglitsch, A., Stacey, G. J.,
Townes, C. H. 1993, ApJ, 402, 173
Jaroszynski, M. 1998, Acta Astronomica, 48, 653.
Kim, S. S., Figer, D. F., & Morris, M. 2004, ApJ, 607, L123.
Kim, S. S., & Morris, M. 2003, ApJ, 597, 312
Lacy, J. H., Townes, C. H., Geballe, T. R., & Hollenbach, D. J., 1980, ApJ, 241, 132
Lee, H.M., 1996, IAU 169, 215
Levin, Y., & Beloborodov 2003, ApJ, 590, L33
Lo, K. Y., Backer, D. C., Ekers, R. D., Kellermann, K. I., Reid, M., & Moran, J. M. 1985,
Nature, 315, 124
Maoz, E. 1998, ApJ, 494, L181
Matthews, K., Ghez, A. M., Weinberger, A. J., and Neugebauer, G. 1996, PASP, 108, 615
Matthews, K. and Soifer, B. T. 1994, Astronomy with Infrared Arrays: The Next Generation,
ed. I. McLean, Kluwer Academic Publications (Astrophysics and Space Science, v.
190, p. 239)
McGinn, M. T., Sellgren, K., Becklin, E. E., & Hall, D. N. B., 1989, ApJ, 338, 82
Menten, K. M., Reid, M. J., Eckart, A., & Genzel, R. 1997, ApJ, 475, L111
Merritt, D., Ferrarese, L. 2001, ApJ, 547, 140

– 28 –
Miralda-Escude, J., & Gould, A. 2000, ApJ, 545, 847
Morris, M., 1993, ApJ, 408, 496
Morris, M., Ghez, A. M., Becklin, E. E. 1999, Adv. Spa. Res., 23, 959
Miyoshi, M., Moran, J. M., Hernstein, J., Greenhill, L., Nakai, N., Diamond, P., & Inoue,
M. 1995, Nature, 373, 127
Munyaneza, F. & Viollier, R. D. 2002, ApJ, 564, 274.
Nayaksin, S. & Cuadra, J. 2004, A&A, submitted (astro-ph/0409541)
Portegies Zwart, S. F., & McMillian, S. L. W. 2002, ApJ, 576, 899
Portegies Zwart, S. F., McMillian, S. L. W., Gerhard, O. 2003, ApJ, 593, 352.
Rasio, F. A., Freitag, M., & Gurkan, M. A. 2004, Coevolution of Black Holes and Galaxies,
138
Reid, M. J. 1993, ARA&A, 31, 345
Ried, M. J. & Brunthaler, A. 2004, ApJ, accepted (astro-ph/0408107)
Reid, M. J., Menten, K. M., Genzel, R., Ott, T., Schodel, R., & Eckart, A. 2003, ApJ, 587,
208
Reid, M. J., Readhead, A. C. S., Vermeulen, R. C., Treuhaft, R. N. 1999, ApJ, 524, 816
Rubilar, G. F., & Eckart, A. 2001, A&A, 2001, 372, 95
Salim, S., & Gould, A. 1999, ApJ, 523, 633
Sanders, R. H. 1992, Nature, 359, 131
Schonberner, D. 1981, A&A, 103, 119
Schonberner, D. 1983, ApJ, 272, 708
Schodel, R. et al. 2002, Nature, 419, 694
Schodel, R., Ott, T., Genzel, R., Eckart, A., Mouawad, N., & Alexander, T. 2003, ApJ, 596,
1015
Scoville, N. Z., Stolovy, S. R., Rieke, M., Christopher, M. H., Yusef-Zadeh, F. 2003, ApJ,
594, 294

– 29 –
Sellgren, K., McGinn, M. T., Becklin, E. E., & Hall, D. N. B. 1990, ApJ, 359, 112
Spergel, D. N. et al. 2003, ApJ, submitted
Tanner, A. 2004, PhD UCLA
Tremaine, S.. et al. 2002, ApJ, 574, 740
Tsiklauri, D., & Viollier, R. D. 1998, ApJ, 500, 591
Ullio, P., Zhao, H., Kamionkowski, M. 2001, Phys. Rev. D, 64, 1302
Viollier, R. 2003, Astron. Nachr., Vol. 324, No. S1, Special Supplement ”The central 300
parsecs of the Milky Way”, Eds. A. Cotera, H. Falcke, T. R. Geballe, S. Markoff
This preprint was prepared with the AAS LATEX macros v5.2.
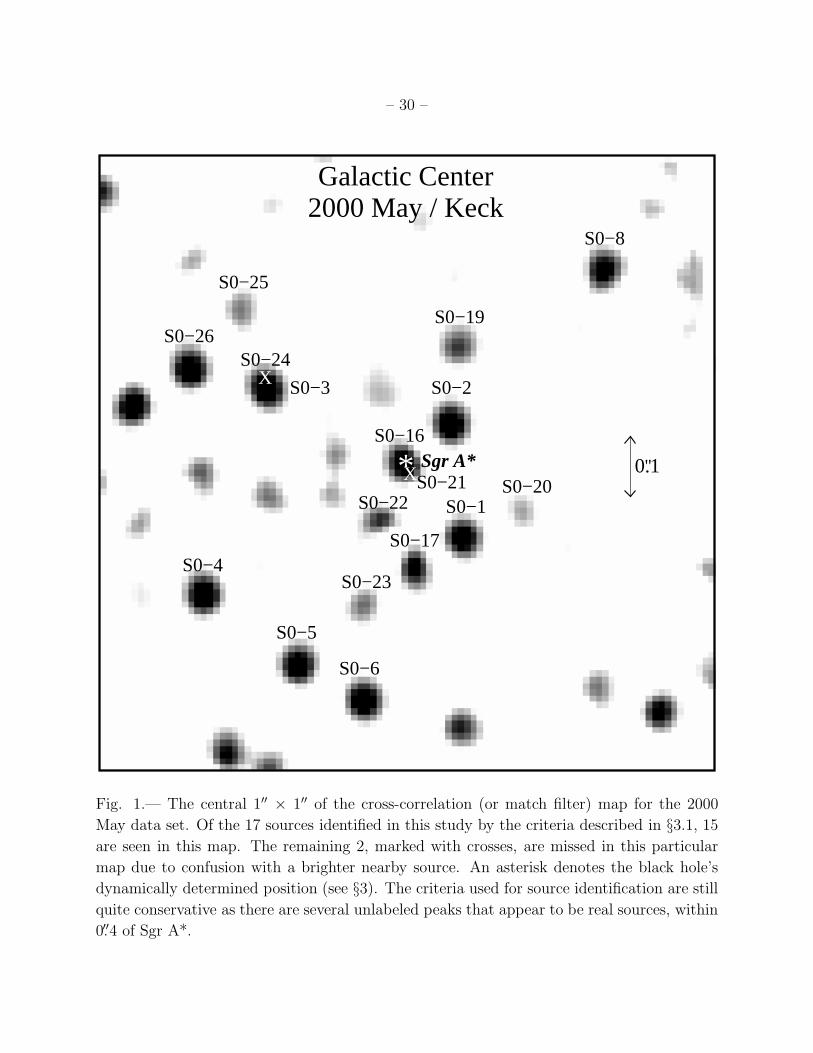
– 30 –
S0−16
S0−21
S0−25
X*
S0−3
S0−24X
S0−23
S0−22 S0−1S0−20
S0−2
S0−26
S0−5
S0−6
S0−19
S0−17S0−4
S0−8
2000 May / KeckGalactic Center
Sgr A* "0.1
Fig. 1.— The central 1′′ × 1′′ of the cross-correlation (or match filter) map for the 2000
May data set. Of the 17 sources identified in this study by the criteria described in §3.1, 15
are seen in this map. The remaining 2, marked with crosses, are missed in this particular
map due to confusion with a brighter nearby source. An asterisk denotes the black hole’s
dynamically determined position (see §3). The criteria used for source identification are still
quite conservative as there are several unlabeled peaks that appear to be real sources, within
0.′′4 of Sgr A*.

– 31 –
Fig. 2.— Astrometric positions and orbital fits for the 7 stars that show significant deviation
from linear motion. The proper motion measurements were obtained between 1995 and 2003
at the Keck telescopes, have uncertainties that are comparable to or smaller than the size of
the points, and are plotted in the reference frame in which the central dark mass’ is at rest.
On the plane of the sky, three of these stars show orbital motion in the clockwise direction
(S0-1, S0-2, and S0-16) and four of these stars have counterclockwise motion (S0-4, S0-5,
S0-19, and S0-20). Overlaid are the best fitting simultaneous orbital solutions, which assume
that all the stars are orbiting the same central point mass. The orbital solutions for the three
stars that constrain the properties of the central dark object are delineated by solid lines
and the joint orbital solutions for the remaining stars are shown with dashed lines.

– 32 –
Fig. 3.— Eccentricity vs. Semi-Major Axis for the 7 stars included in this study. The
observational selection effects are quantified by the fraction of time a face-on orbit experiences
acceleration larger than our threshold value of 2 mas y−2, with the cases of 100% of the
orbit (long dashed - dotted line), 50% of the orbit (short dashed line), and only periapse
passage (dotted line) shown. The region to the left of the long dashed - dotted line is free of
observational selection effects and therefore should not be missing any stars that are brighter
than ∼15.5.

– 33 –
Fig. 4.— Positions of the angular momentum vectors for an observer at the center of the
Galaxy. Only one hemisphere is shown (East as seen from the Earth), since the degeneracy
of the inclination sign makes it impossible to know which hemisphere a vector points, except
for S0-2. The large uncertainties for S0-4 have been omitted for clarity. If the orbits were to
be co-planar the angular momentum vectors would cluster, which we do not see. The normal
to the plane of the He I stars found by Levin & Beloborodov (2003) is also indicated.

– 34 –
Fig. 5.— The directions of the apoapse vectors, as seen from an observer at the Galactic
center, for the hemisphere containing S0-2. The He I star plane of Levin & Beloborodov
(2003) is shown as a 20 wide band (dotted lines). These vectors are consistent with an
isotropic distribution, even when the degeneracy of the inclination sign is taken into account.

– 35 –
Table 1. Summary of Sources Identified within 0.′′4 of the Central Dark Mass
Star Other < K > # Epochs Closest Measured Positionb < σpos > ∆χ2 c Notes
Name Namea Ndet Nfit Date R ∆RA ∆Dec
(mag) (year) (arcsec) (arcsec) (arcsec) (arcsec)
S0-2 S2 14.0 ± 0.2 22 18f 2000.309 0.012 -0.065 0.059 0.001 6132
S0-16 S14 15.5 ± 0.3 18d 17f 2000.305 0.006 0.005 -0.001 0.002 3570 Newg
S0-19 S12 15.5 ± 0.2 13d,e 12f 1995.439 0.036 0.015 -0.033 0.002 936 Newg
S0-20 S13 15.7 ± 0.2 15e 15 2003.682 0.147 -0.136 0.057 0.004 286 Newg
S0-1 S1 14.6 ± 0.1 22 22 1998.505 0.131 -0.117 -0.060 0.001 281
S0-4 S8 14.4 ± 0.1 22 21f 1995.439 0.290 0.255 -0.137 0.001 53
S0-5 S9 15.1 ± 0.2 21e 20f 1995.439 0.316 0.169 -0.267 0.002 35
S0-23 ID7 16.7 ± 0.2 9d,e 9 1996.485 0.157 -0.024 -0.155 0.005 14 Newg
S0-25 ID9 16.4 ± 0.3 11e 11 1998.771 0.364 0.262 0.253 0.006 10 Newg
S0-8 ID14 15.7 ± 0.2 20e 20 2003.303 0.390 -0.296 0.253 0.003 7 New
S0-17 · · · 15.8 ± 0.2 16e 6f 2003.682 0.115 0.028 -0.112 0.004 6 New
S0-26 ID12 15.1 ± 0.2 19d,e 19 1997.367 0.385 0.366 0.120 0.002 6 Newg
S0-22 · · · 16.8 ± 0.4 7d,e 7 2001.572 0.093 0.031 -0.088 0.01 5 New
S0-24 · · · 15.7 ± 0.2 5d 5 1998.505 0.283 0.244 0.142 0.008 2 New
S0-6 S10 14.2 ± 0.1 22 22 2003.682 0.378 0.058 -0.374 0.001 0
S0-21 · · · 16.1 ± 0.3 3h · · · 1999.560 0.009 -0.007 -0.006 0.006 · · · New
S0-3 S4 14.4 ± 0.2 22 · · · f 1995.439 0.180 0.149 0.101 0.001 · · ·
aOther names taken from Eckart & Genzel (1997) and Schodel et al. (2003).
bMinimum measured projected separation (1995 - 2003) from the dynamical center, whose location is reported in §3.3 and
Table 2.
c∆χ2 is the difference between the total χ2 value resulting from the best linear fit and the total χ2 from the best second order
polynomial fit. Sources with ∆χ2 greater than 15 are considered to have significant proper motions accelerations.
dThe following stars have missing measurements due to stellar confusion: S0-16 (1995 June - 1997 May) due to S0-3, S0-19
(1998 April - 1999 May) due to S0-2, S0-22 (2002 July - 2003 September) due to S0-17, S0-23 (1997 May - 1998 October ) due
to S0-17, S0-24 (1998 May, 1998 August - 2003 September) due to S0-3, and S0-26 (1995 June - 19996 June) due to S0-7.
eThe following stars have missing measurements that are likely due to insufficient map sensitivity (either in the main map or
in at least one of the sub-maps; see §2): S0-5 (1996 June), S0-19 (1996 June, 2000 April, 2003 April), S0-20 (1996 June, 1998
April, May, 1999 May, 2000 July, October 2003 July), S0-8 (1996 June & 1998 April), S0-17 (1995 June, 1997 May, 2000 October,
2001 July, 2002 April, May [2001-2002 points may be missed in our analysis due to confusion with S0-22, causing both their
correlations to be below our detection threshhold]), S0-22 (1995 June, 1996 June, 1997 May, 1998 July, August, October, 1999
May, 2000 October, 2001 July, 2002 April, May [see note on S0-17]), S0-23 (1995 June, 2000 April, 2002 April, 2002 July - 2003
September), S0-25 (1995 June, 1996 June, 1998 April, July, 2000 July - 2001 May, 2002 April, 2002 July, 2003 April, September),
and S0-26 (2000 April).
fMeasurements are dropped from the final proper motion fits as a result of significant astrometric biases due to nearby stars,
as detailed in table footnote d (except S0-2 in 1998 April and 1999 May) as well as measurements of S0-16 in 1998 August and
S0-19 in 1999 July) or underestimated uncertainties (S0-4 in 1998 October and S0-5 in 2000 May). The procedure for identifying
measurements to exclude is described in §3.2; both S0-3 and S0-21 have too few (<3) points free from potential biases to carry
out this procedure.
gThese stars are independently identified in Schodel et al. (2003).
hIt is difficult to assess explicitly why other measurements of S0-21 were not made, because of the lack of orbital information
from only three measurement and the significant stellar confusion at its location.

– 36 –
Table 2. Central Dark Mass Properties from Simultaneous Orbital Fit to Multiple Stars
Parameter Estimated Value
Mass (106( Ro
8kpc)3M⊙) 3.67 ± 0.19
Position with Respect to S0-2 in 2003.0 (mas):
∆rRA -36.5 ± 1.6
∆rDEC -53.34 ± 0.95
Proper Motion Relative to Central Cluster (mas y−1):
VRA 0.87 ± 0.46
VDEC 1.16 ± 0.57

–37
–
Table 3. Stellar Orbital Parameters from Simultaneous Orbital Fit
Star P Aa To e i Ωb ω qa Qa
(yrs) (AU) (yrs) (deg) (deg) (deg) (AU) (×103 AU)
S0-2 14.53 (0.65) 919 (23) 2002.308 (0.013) 0.8670 (0.0046) 135.2 (1.2) 44.0 (1.3) 242.8 (2.1) 122.2 (2.7) 1.715 (0.047)
S0-16 36 (17) 1680 (510) 2000.201 (0.025) 0.974 (0.016) 102.7 (2.2) 44.8 (1.9) 155.9 (3.8) 45 (16) 3.3 (1.0)
S0-19 37.3 (3.8) 1720 (110) 1995.758 (0.050) 0.833 (0.018) 37.0 (4.1) 10.0 (8.5) 173.8 (8.5) 287 (25) 3.15 (.22)
S0-20 43 (45) 1900 (1400) 2005.4 (3.6) 0.40 (0.21) 23 (38) 66 (49) 260 (100) 1160 (490) 2.7 (2.3)
S0-1 190 (180) 5100 (3200) 1994.04 (0.52) 0.70 (0.21) 121.8 (1.3) 137.4 (7.6) 204 (13) 1530 (180) 8.7 (6.5)
S0-4 2600 (130,000) 30,000 (950,000) 1987.1 (7.5) 1.00 (0.15) 47 (63) 40 (360) 280 (300) 140 (270) 60 (1,900)
S0-5 9,900 (430,000) 70,000 (2,100,000) 2004.5 (4.7) 1.0 (1.3) 84.0 (2.2) 153.7 (1.1) 356 (11) 3206 (79) 100 (4,200)
Note. — The first 3 stars represent a single joint solution. Each star below the line represents a four-star solution with the first 3 stars (see §3.3.1). Values
in parentheses are 1σ uncertainties from the covariance matrix that takes into account the measurement uncertainties.
aThe semi-major axis (A), periapse distance (q), and apoapse distance (Q) are not independent variables; they are reported here for convenience and to
provide a proper accounting of their uncertainties. These quantities assume a distance of 8 kpc and their uncertainties do not include the uncertainty associated
with this distance.
bThe position angle of the nodal point is given for the node lying in the Eastern quadrants, except for S0-2 where it is the ascending node.
– 38 –
Table 4. Absolute Astrometry of a Few Bright Sources Relative to Sgr A*- Radio
Source to R ∆RA ∆DEC vRA vDEC
(year) (arcsec) (arcsec) (arcsec) (mas y−1) (mas y−1)
IRS 16NW 2000.126 1.21 0.0183 ± 0.0071 1.212 ± 0.014 6.37 ± 0.18 1.47 ± 0.12
IRS 16C 2000.126 1.23 1.132 ± 0.0069 0.484 ± 0.015 -8.679 ± 0.095 7.32 ± 0.12