Stefano Tarantola, William Castaings - JRC Publications...
22
- 1 - EUR 23770 EN - 2009 The 2008 European e-Business Readiness Index Stefano Tarantola, William Castaings
Transcript of Stefano Tarantola, William Castaings - JRC Publications...

- 1 -
EUR 23770 EN - 2009
The 2008 European e-Business Readiness Index
Stefano Tarantola William Castaings
- 2 -
The mission of the IPSC is to provide research results and to support EU policy-makers in their effort towards global security and towards protection of European citizens from accidents deliberate attacks fraud and illegal actions against EU policies European Commission Joint Research Centre Institute for the Protection and Security of the Citizen Contact information AddressVia EFermi 2749 21027 Ispra (VA) Italy E-mail stefanotarantolajrcit Tel +39 0332 789928 Fax +39 0332 785733 httpipscjrceceuropaeu httpwwwjrceceuropaeu Legal Notice Neither the European Commission nor any person acting on behalf of the Commission is responsible for the use which might be made of this publication
Europe Direct is a service to help you find answers to your questions about the European Union
Freephone number ()
00 800 6 7 8 9 10 11
() Certain mobile telephone operators do not allow access to 00 800 numbers or these calls may be billed
A great deal of additional information on the European Union is available on the Internet It can be accessed through the Europa server httpeuropaeu JRC 50478 EUR 23770 EN ISSN 1018-5593 Luxembourg Office for Official Publications of the European Communities copy European Communities 2009 Reproduction is authorised provided the source is acknowledged Printed in Italy
The 2008 European e-Business Readiness Index
- 3 -
Stefano Tarantola and William Castaings Abstract This report shows the scores of the 2008 e-business readiness index for European enterprises The 2008 e-business readiness index evaluated using data from the 2007 ICT enterprise survey carried out by Eurostat is a useful mechanism for comparing e-business adoption and use by firms in the various European countries The e-business readiness index measures the ICT adoption by enterprises using 6 indicators and measures ICT use by enterprises using another 6 indicators The report describes the 12 benchmark indicators and the data coverage The index obtained with the 2007 data is compared with the index calculated from previous years The trends of the benchmark indicators are analysed and the robustness of the index scores among countries is tested to assess the significance of country rankings Further information httpeceuropaeuenterpriseictpolicyebiindex_enhtm) Keywords ICT e-business enterprises benchmark indicators eEurope2005 i2010 ____________ DG Joint Research Centre Institute for the Protection and Security of the Citizen (IPSC) Econometrics and Applied Statistics Unit Ispra Italy Table of Contents
- 4 -
1 INTRODUCTION 6
BASIC INDICATORS AND DATA COVERAGE 7
11 Data sources and component indicators 7 12 The data set 8
2 MAIN FINDINGS 10
21 Country scores and rankings 10 22 Relation between ICT Adoption and Use 11
3 TREND IN ICT ADOPTION AND USE 13
31 Analysis of the overall trend 13 32 Analysis of the overall trend for specific indicators 14
4 ROBUSTNESS ANALYSIS 16
CONCLUSIONS 18
5 REFERENCES 19
- 5 -
Executive Summary This report describes the results of the e-business readiness index for European firms using data from the 2007 European enterprise survey on Information Society Statistics as collected by National Statistical Institutes and verified by Eurostat The index is made of two core dimensions adoption of ICT by business and use of ICT by business Since the 2004 pilot exercise the index has proven to be a useful tool for gauging sectoral and country progress and a useful mechanism for benchmarking e-business readiness Enterprises in many countries have made significant progress during the observation period ranging from 2004 to 2007 Although quantitatively the country scores are much lower for use of ICT than adoption of ICT the pattern of country performance for the category use of ICT is globally similar to that of adoption Denmark confirms its leading position and the top ranks are still occupied by other Nordic countries (Sweden Finland Norway) together with the Netherlands Germany and Belgium Together with the Mediterranean Member States most of the states from Eastern Europe which joined the EU recently (2004 and 2007) are still in the developing stage of their e-business environment On the other hand Malta Slovenia Slovakia Czech Republic and Estonia who joined the EU in 2004 reach a relatively fair level of adoption and use Due to lack of resources we could not quantify the e-business index for the various industry sectors and company sizes We refer to the 2007 report for the latest figures available
- 6 -
1 INTRODUCTION
Information and communication technologies (ICT) are a powerful driver for economy-wide productivity growth and jobs ICT adoption and use by enterprises has an important impact on the business processes organisations performance and competitiveness of enterprises The benchmarking of the readiness to take up e-business is an important issue This is well reflected in the yearly Economist Intelligence Units (EIU) e-readiness studies1 and in the global reports of the Bridges ndash organisation2 This is the fifth yearly report on the e-business readiness index The previous reports were conducted in 2004 2005 2006 and 2007 (Nardo et al 2004 Pennoni et al 2005 Castaings et al 2007 Castaings et al 2008) In this report the index (we will refer to it as composite indicator (CI) from now on) is used to track progress of European enterprises in adoption and use of ICT tools One CI for adoption and one for use of ICT are calculated CIs are aggregate measures that are obtained as weighted combinations of selected indicators They are increasingly used by media and policy makers to communicate information on the progress of countries or regions in various policy fields The CI obtained with the 2007 data is compared with the CIs calculated from previous years The trends of the benchmark indicators are analysed and the robustness of the index scores among countries is tested to assess the significance of country rankings This document contains an introductory section (section 2) with a description of the component indicators and the data coverage Section 3 describes the main findings for the categories adoption and use of ICT A detailed analysis of the results and the examination of the trends with respect to previous years are given in section 4 Finally in section 5 the robustness of the CI scores is tested to assess the significance of country rankings
1 Please see EIU amp IBM 2007 report httpwwweiucomsite_infoaspinfo_name=eiu_2007_e_readiness_rankingsamprf=0
2 Bridges ndash organisation httpwwwbridgesorg
- 7 -
BASIC INDICATORS AND DATA COVERAGE
11 Data sources and component indicators
The e-business readiness index is one of the policy indicators selected by the Council Resolution of 28 January 2003 (519703) of the European Union to monitor progress in the implementation of the eEurope 2005 Action Plan (COM(2002) 263 final) The European enterprise survey on Information Society Statistics aims to produce harmonised and comparable yearly statistics on adoption and use of ICT by European enterprises The indicators for the CI are grouped into two categories six indicators in the group adoption of ICT by business and six indicators in the group use of ICT by business The raw data for the twelve indicators are expressed as percentages eleven indicators are percentages of enterprises and one indicator (a4) is percentage of employees (see Tables 1Table and 2)
Table 1 2008 e-business readiness index list of indicators for adoption of ICT
Adoption of ICT basic indicators Code
Percentage of enterprises that use Internet a1
Percentage of enterprises that have webhome page a2
Percentage of enterprises that use at least two 2 security facilities at the time of the survey
a3
Percentage of total number of persons employees using computer with their normal work routine
a4
Percentage of enterprises having broadband connection to internet a5
Percentage of enterprises with LAN and using an Intranet and Extranet a6
Table 2 2008 e-business readiness index list of indicators for use of ICT
Use of ICT basic indicators Code
Percentage of enterprises that have purchased products services via the internet EDI3 or any other computer mediated network where these are gt1 of total purchases
b1
Percentage of enterprises that have received orders via the internet EDI or any other computer mediated network where these are gt1 of total turnover
b2
Percentage of enterprises whose IT systems for managing orders or purchases are linked automatically with other internal IT systems
b3
Percentage enterprises whose IT systems are linked automatically to IT systems of suppliers or customers outside their enterprise group
b4
3 Electronic Data Interchange
- 8 -
Percentage of enterprises with Internet access using the internet for banking and financial services
b5
Percentage of enterprises that have sold products to other enterprises via a presence on specialised internet market places
b6
For a thorough description of the steps underlying the development of a CI the reader is referred to the OECDJRC handbook (Nardo et al 2008) Here the component indicators are aggregated using a participatory weighing scheme involving a panel of national representatives Weights were assigned to the indicators according to the ldquobudget allocation schemerdquo which consists in asking each expert in the panel to distribute 100 points proportionally to the relevance of the indicator for measuring e-readiness The set of weights given in Table 3 represents the average of weights provided by twelve national representatives of the e-BSN4 Although the table presents rounded values (which do not sum up to one) all available digits were used for the calculations
Table 3 Average budget allocation weights for the different index components
a1 a2 a3 a4 a5 a6 018 016 010 016 021 020 b1 b2 b3 b4 b5 b6
017 017 021 021 012 013 Using the nc basic indicators (denoted by Ik k=1hellipnc) and the corresponding weights (denoted by wk k=1hellipnc) for the aggregation the value of the composite indicator CI (either adoption or use) is given by a linear aggregation rule
k
nc
kk IwCI sum
=
=1
The explanatory power of the index depends on the availability and quality of the data (this year only a few missing values are present) The index is a valuable tool to identify the progress made by enterprises and consequently should guide policy-makers to help European enterprises
12 The data set
The data used throughout the analysis5 refer to the European businesses of different sizes and sectors of economic activity covered by the 2007 Community Survey on ICT Usage and e-Commerce in Enterprises The survey includes indicators for the EU27 as well as Norway (member of the European Free Trade Association - EFTA) The model survey was developed by Eurostat in close collaboration with Member States From the results obtained aggregates (mostly binomial proportions) were compiled by the National Statistical Institutes (NSI) of the Member States for the total population and for different breakdowns defined by 2 background variables the main economic activity of the enterprise (NACE groupings) and the number of persons employed (size categories) 4 The European e-Business Support Network is a network of decision-makers and public policy experts established by the
European Commission httpeceuropaeuenterprisee-bsnindex_enhtml
5 as available from Eurostat in October 2008 at URL httpeppeurostateceuropaeuportalpage_pageid=2973645490692973_64554066amp_dad=portalamp_schema=PORTAL
- 9 -
Table 4 provides an overview of the percentage of available data from 2003 to 2007 at the country level To give an idea a single indicator missing for a given country represents a drop of approximately 8 in data availability The measure is highlighted in red for countries that did not participate in the community survey in orange when the data sets were not delivered on time The provided values reflect data availability during the various JRC e-business readiness analyses Since some values were provided afterwards or removed for inconsistency this does not exactly reflect the current state of the Eurostat database All EU27 countries are considered in the current analysis Iceland did not provide data and therefore is not included in the calculation of the CI this year Denmark France Greece and Luxembourg did not provide a complete dataset but the missing values were imputed using multi-linear regression Only the explaining variables featuring important correlations with the missing component were considered The obtained results lead to a consistent temporal trend
Table 4 Data availability (in ) for 2003 2004 2005 2006 and 2007 survey
Member state Code 2003 2004 2005 2006 2007 Austria AT 100 100 100 100 100 Belgium BE 100 100 100 100 100 Bulgaria BG 0 100 0 100 100 Cyprus CY 0 100 100 100 100 Czech republic CZ 75 83 100 100 100 Denmark DK 100 100 100 100 92 Estonia EE 0 92 100 100 100 Finland FI 100 100 100 100 100 France FR 50 0 0 100 83 Germany DE 75 100 100 100 100 Greece EL 100 100 100 100 83 Hungary HU 0 92 92 100 100 Iceland IS 100 0 0 100 0 Ireland IE 100 100 100 100 100 Italy IT 100 92 100 92 100 Latvia LV 0 100 100 100 100 Lithuania LT 0 100 100 100 100 Luxembourg LU 100 100 92 92 92 Malta MT 67 0 92 0 100 Netherlands NL 100 100 100 100 100 Norway NO 100 100 100 100 100 Poland PL 0 100 100 100 100 Portugal PT 100 100 92 83 100 Romania RO 0 83 0 100 100 Slovakia SK 0 100 100 83 100 Slovenia SI 0 100 100 100 100 Spain ES 100 100 100 100 100 Sweden SE 100 92 100 100 100 United Kingdom UK 67 75 100 100 100 Total 29 15 26 25 28 28
- 10 -
2 MAIN FINDINGS
The e-business index is presented as a weighted average of the component indicators by considering the budget allocation weights This report is about the ICT Adoption and Use of enterprises Therefore whenever only the name of a country is used in the report this should always be interpreted as referring to a survey sample of enterprises of that country
21 Country scores and rankings
The scores and rankings the adoption and use of ICT (see Table 5) provide a relative gauge of e-business progress in 28 countries (27 European Union Member States and Norway)
Table 5 2008 e-Business Readiness ICT Adoption and Use ndash Scores and rankings according to the budget allocation weights
ICT Adoption Score Rank ICT Use Score Rank
Finland 7950 1 Denmark 4079 1Sweden 7710 2 Netherlands 3781 2Denmark 7518 3 Germany 3739 3Germany 7392 4 Norway 3600 4Belgium 7323 5 Luxembourg 3539 5Netherlands 7256 6 Belgium 3509 6Norway 7247 7 Austria 3454 7Luxembourg 6961 8 Sweden 3449 8France 6844 9 Ireland 3427 9United Kingdom 6835 10 United Kingdom 3364 10Austria 6826 11 Finland 3126 11Malta 6749 12 Malta 2937 12Slovakia 6656 13 France 2718 13Ireland 6652 14 Greece 2631 14Slovenia 6620 15 Slovenia 2622 15Czech Republic 6449 16 Italy 2586 16Spain 6424 17 Portugal 2563 17Estonia 6178 18 Czech Republic 2405 18Italy 6168 19 Slovakia 2362 19Greece 5919 20 Spain 2267 20Portugal 5816 21 Lithuania 2254 21Cyprus 5491 22 Estonia 2219 22Poland 5419 23 Cyprus 2029 23Hungary 5381 24 Poland 1932 24Lithuania 5236 25 Romania 1452 25Latvia 4745 26 Latvia 1435 26Bulgaria 4291 27 Hungary 1408 27Romania 3679 28 Bulgaria 1067 28EU27 6522 EU27 2852
- 11 -
Although quantitatively the country scores are much lower for use than adoption the patterns of country performance for the two categories are globally similar Northern European countries steadily occupy the top ranks and have consistently done so for the last 3 years The leading position of Denmark for use of ICT is really outstanding Small differences in scores are observed among groups of countries and this stresses the need for a robustness analysis (see section 4) Together with the Mediterranean Member States most of the states from Eastern Europe are still in the developing stage of their e-business environment An appraisal of the variability of the scores calculated over all countries for adoption and use is given by the probability density estimates in Figure 1 The obtained curves estimated using Gaussian kernels represent non-parametric smooth estimates of CI country scores These curves are not truncated therefore some values can fall outside the [0 1] range and are not necessarily symmetric This asymmetry is more pronounced for adoption of ICT for which the distributions are characterised by a negative skew (elongated tail at the left) This means that there is an important group of countries lagging behind for Adoption of ICT while the performances are quite balanced across countries for Use of ICT
Figure 1 Probability density estimates for CI country scores
22 Relation between ICT Adoption and Use
A graphical representation of adoption versus use of ICT scores for the 28 countries and for the EU27 aggregate is provided in Figure 2 The correspondence between country codes and country names is given by Table 4 With respect to the EU27 aggregate the plane is split in 4 zones that categorize the performances of the countries with respect to the EU27 average Since the correlation between adoption and use scores is relevant (r = 088) most of the countries lie along the diagonal depicting a positive correlation Most of the time good performances in adoption are coming along with a satisfactory level of use With respect to the EU27 average Greece and Portugal can be distinguished for their efficiency in using ICT infrastructures given the investments made (still below the EU average yet) Together with Spain and Italy they are the only countries from the former EU15 which are still below the European average for both adoption and use The countries were visually grouped in 4 clusters (see Figure 2) depending on their relative position with respect to the EU27 aggregate We
- 12 -
did not apply methods of cluster analysis as the outcomes are critically sensitive to the key features of the clustering algorithms (such as distance measure and predefined thresholds) Apart from the Netherlands Germany and Belgium the group of leading countries (cluster 1) is essentially composed of Nordic countries The second cluster contains countries that are consistently above the European average for both adoption and use The third group of average performing countries includes some members of the former EU15 (France Spain Greece Italy and Portugal) and the most advanced new member states like Malta Slovenia Slovakia Check Republic and Estonia The fourth cluster is made of new member states which are doing strong investments efforts in order to catch up With respect to last year (see Figure 2b for comparison) Portugal has moved from the fourth to the third cluster and Belgium has moved up from the second to the first cluster On the contrary France has moved down from the second to the third group passing from above European average to below average for use of ICT Note that Slovakia has invested considerably and is now above European average for adoption
Figure 2 2008 dataset Adoption vs use scores using the budget allocation weighting scheme The
red diamond indicates the EU27 aggregate
- 13 -
Figure 2b 2007 dataset Adoption vs use scores using the budget allocation weighting scheme
The red diamond indicates the EU27 aggregate
3 TREND IN ICT ADOPTION AND USE
In order to analyse the trend in adoption and use the results of the previous ICT enterprise surveys were used Since some changes in the database for earlier surveys can be identified only when new data become available the e-business index for 2003 2004 2005 and 2006 were re-calculated using the latest updated version of the Eurostat database (instead of using the values published in previous JRC e-business readiness reports) The imputation of missing values for 2003 2004 2005 and 2006 is also carried out using multi-linear regression In case of inconsistent temporal trend for a given country an additional correction was made using the values observed for the other surveys
31 Analysis of the overall trend
The temporal shift of the distributions toward larger scores (Figure 3) is very clear for adoption yet still moderate for use The analysis of the distribution of adoption scores shows that in spite of a few countries that keep investing at the same pace of 2006 those who were lagging behind in 2006 are now progressively catching up In other words the variance of the distribution is getting narrower though the level of asymmetry is growing with respect to previous years
- 14 -
Note how the variance of the distribution of use is growing with respect to previous years due to a shift towards larger scores of its right tail while the left tail remains essentially at the same scores This means that in spite of countries improving their usage of ICT tools other countries persist at low performance levels In other words it seems that the progress made in adoption by low performing countries does not yet come along with the reduction of inequalities as regard to use
Figure 3 Probability density estimates (using normal kernel functions) for the country scores in 2004 2005 2006 and 2007
32 Analysis of the overall trend for specific indicators
The overall trend for the e-business index is mainly driven by the temporal evolution of some of its component indicators which is examined in this section The temporal evolutions are examined in terms of the probability densities for the country scores As indicated by the consensus budget allocations weights the component a5 (percentage of enterprises having broadband connection to internet) is a very important driver for e-business readiness The analysis of Figure 4 reveals a positive remarkable trend for the probability density function of a5 This trend is also characterised by a reduction in inequalities (reduction of the variance)
- 15 -
Figure 4 Evolution of the probability density function for indicator a5 (percentage of enterprises
having broadband connection to internet) This is a perfect illustration showing that both growth and cohesion can be achieved for specific aspects of e-business Unfortunately this ideal evolution is not generalized yet often progress is achieved by a small group of leaders Figure 5 shows indicator a3 percentage of enterprises that use at least two security facilities Note that in spite of the progress made by most countries till 2006 during the latest year the performance has not improved at all This is not a good sign especially for countries with low scores which should show a constant improvement One would expect the distribution in Figure 5 to shrink with time towards larger scores yet no cohesion has been attained between 2006 and 2007 in such case
Figure 5 Evolution of the probability density function for the indicator a3 (percentage of enterprises that use at least two security facilities) Figure 6 shows indicator b5 percentage of enterprises with Internet access using the internet for banking and financial services Contrarily to indicator a3 this indicator shows a continuous positive trend since 2004 Between 2006 and 2007 the dynamics is good The bimodal distribution in 2007
- 16 -
indicates the formation of a group of lagging countries which have made not enough progress in this indicator The other countries have progressed at a difference pace
Figure 6 Evolution of the probability density function for the indicator b5 (percentage of
enterprises with Internet access using the internet for banking and financial services)
4 ROBUSTNESS ANALYSIS
The e-business index scores are affected by uncertainty which is partly due to the experts preferences in the assignment of weights and partly to the imputation process for some missing values In order to quantify the uncertainty due to weights we select the experts at random and evaluate the index using the average sets of weights obtained The uncertainty due to the imputation of missing values is not addressed in the current paper In the robustness analysis (Saisana et al 2005) each country is characterised by a cloud of points in the adoption vs use plane The results obtained for the four clusters are given in Figures 7-10 In each cluster there is substantial amount of overlapping between country scores This overlapping is more pronounced in the second and third clusters for which country scores lie in similar intervals
Figure 7 Uncertainty analysis for the countries of cluster 1
- 17 -
Figure 8 Uncertainty analysis for the countries of cluster 2
Figure 9 Uncertainty analysis for the countries of cluster 3
- 18 -
Figure 10 Uncertainty analysis for the countries of cluster 4
The analysis within the cluster of the top performing countries shows that for adoption in the presence of uncertainty in the weights Finland is more advanced than Belgium Denmark Germany and The Netherlands as the projections of the clouds on the adoption axis do not overlap On the other hand the same projections for Finland and Sweden partially overlap on the adoption axis so in spite of the results of Table 5 the presence of uncertainty in the weights does not allow us to conclude that Finland performs better than Sweden in adoption The leading position of Denmark in use can be shared with The Netherlands and Germany given that the projections of the clouds on the y-axis for these three countries partially overlap Similar conclusions can be obtained by analysing the projections onto the y-axis for other selected countries and clusters in Figures 8 9 and 10
CONCLUSIONS
The 2008 European e-business readiness index evaluated using data from the 2007 European enterprise survey is a useful mechanism for comparing e-business adoption and use by firms in the various European countries We used statistical techniques (i) to impute missing data from the Enterprise survey (ii) to investigate the performance and trends of European countries on the e-business index and (iii) to test the robustness of the index to the weights proposed by the e-BSN experts In particular the analysis of the probability density function across countries has proven useful to assess variability and trends Although quantitatively the country scores are much lower for use of ICT than adoption of ICT the pattern of country performance for the category use of ICT is globally similar to that of adoption Denmark confirms its leading position and the top ranks are still occupied by other Nordic countries (Sweden Finland Norway) together with the Netherlands Germany and Belgium Together with the Mediterranean Member States most of the states from Eastern Europe which joined the EU recently (2004 and 2007) are still in the developing stage of their e-business environment On the other hand Malta Slovenia Slovakia Czech Republic and Estonia who joined the EU in 2004 reach a relatively fair level of adoption and use The components of the e-business readiness index could be revised in the future as some important elements in the category adoption and use are currently missing
- 19 -
5 REFERENCES
Castaings W Tarantola S (2008) The 2007 European e-Business Readiness Index JRC Scientific report EUR 23254
Castaings W Tarantola S Latvala A (2007) The 2006 European e-Business Readiness Index JRC Scientific report EUR 22803 European Commission (2002) Communication from the Commission e-Europe 2005 Action Plan COM (2002) 263 httpeur-lexeuropaeuLexUriServLexUriServdouri=COM20020263FINENPDF
Nardo M S Tarantola A Saltelli C Andropoulos R Buescher G Karageorgos A Latvala and F Noel (2004) The e-business readiness composite indicator for 2003 a pilot study EUR 21294 Nardo M M Saisana A Saltelli S Tarantola A Hoffman and E Giovannini (2008) Handbook on Constructing Composite Indicators Methodology and User Guide httpcomposite-indicatorsjrceceuropaeuHandbookhtm
Pennoni F S Tarantola and A Latvala (2005) The 2005 European e-Business Readiness Index EUR 22155 EN
Saisana M Saltelli A and Tarantola S (2005) Uncertainty and sensitivity techniques as tools for the analysis and validation of composite indicators Journal of the Royal Statistical Society A 168 307-323
- 20 -
European Commission EUR 23770 EN Joint Research Centre ndash Institute for the Protection and Security of the Citizen Title The 2008 European e-Business Readiness Index Authors Stefano Tarantola and William Castaings Luxembourg Office for Official Publications of the European Communities 2009ndash 22 pp EUR ndash Scientific and Technical Research series ndash ISSN 1018-5593 Abstract This report shows the scores of the 2008 e-business readiness index for European enterprises The 2008 e-business readiness index evaluated using data from the 2007 ICT enterprise survey carried out by Eurostat is a useful mechanism for comparing e-business adoption and use by firms in the various European countries The e-business readiness index measures the ICT adoption by enterprises using 6 indicators and measures ICT use by enterprises using another 6 indicators The report describes the 12 benchmark indicators and the data coverage The index obtained with the 2007 data is compared with the index calculated from previous years The trends of the benchmark indicators are analysed and the robustness of the index scores among countries is tested to assess the significance of country rankings
- 21 -
How to obtain EU publications Our priced publications are available from EU Bookshop (httpbookshopeuropaeu) where you can place an order with the sales agent of your choice The Publications Office has a worldwide network of sales agents You can obtain their contact details by sending a fax to (352) 29 29-42758
- 22 -
The mission of the JRC is to provide customer-driven scientific and technical support for the conception development implementation and monitoring of EU policies As a service of the European Commission the JRC functions as a reference centre of science and technology for the Union Close to the policy-making process it serves the common interest of the Member States while being independent of special interests whether private or national
- 1 Introduction
- Basic indicators and data coverage
-
- 11 Data sources and component indicators
- 12 The data set
-
- 2 Main findings
-
- 21 Country scores and rankings
- 22 Relation between ICT Adoption and Use
-
- 3 Trend in ICT Adoption and Use
-
- 31 Analysis of the overall trend
- 32 Analysis of the overall trend for specific indicators
-
- 4 Robustness analysis
- Conclusions
- 5 References
-
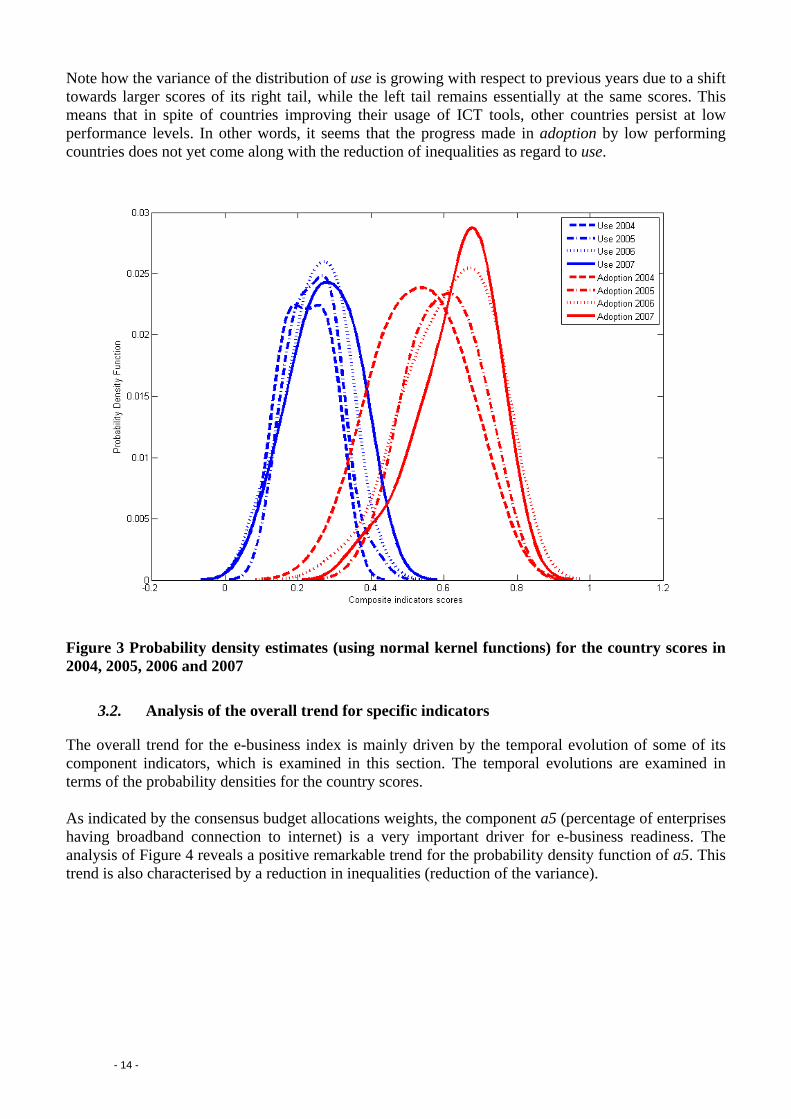