Steel & Scrap Market Overview. International Ferrous Scrap Trade Million Metric Tons Year.
20
Steel & Scrap Market Overview
-
Upload
philip-mosley -
Category
Documents
-
view
222 -
download
0
Transcript of Steel & Scrap Market Overview. International Ferrous Scrap Trade Million Metric Tons Year.
Steel & Scrap Market Overview
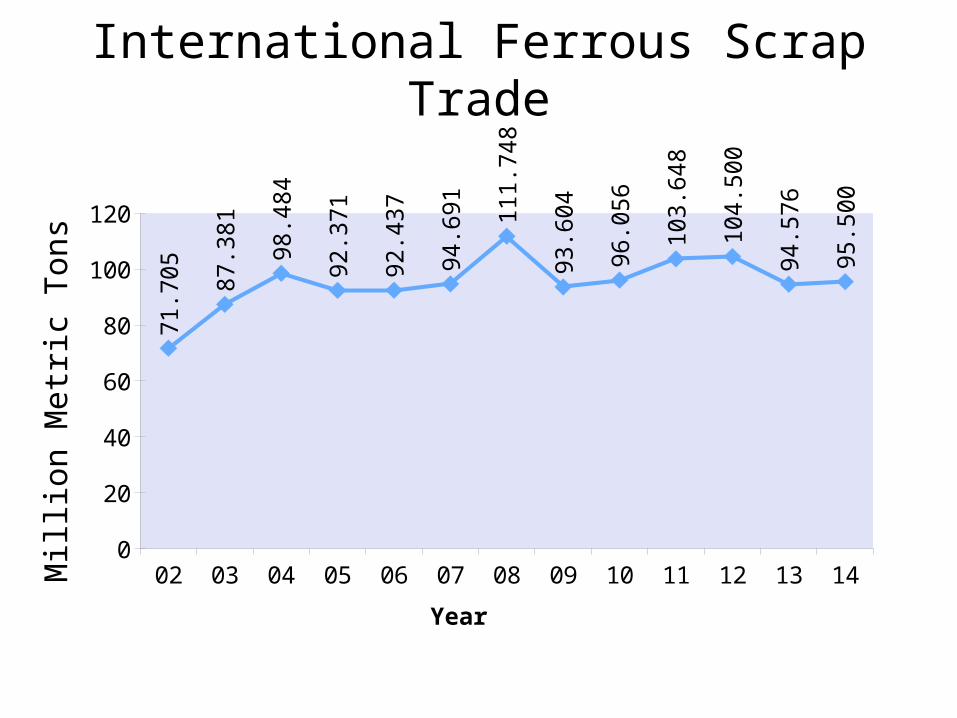
International Ferrous Scrap Trade
02 03 04 05 06 07 08 09 10 11 12 13 140
20
40
60
80
100
120
71.7
05 87.3
81 98.4
84
92.3
71
92.4
37
94.6
91 111.
748
93.6
04
96.0
56
103.
648
104.
500
94.5
76
95.5
00
Mill
ion
Met
ric T
ons
Year
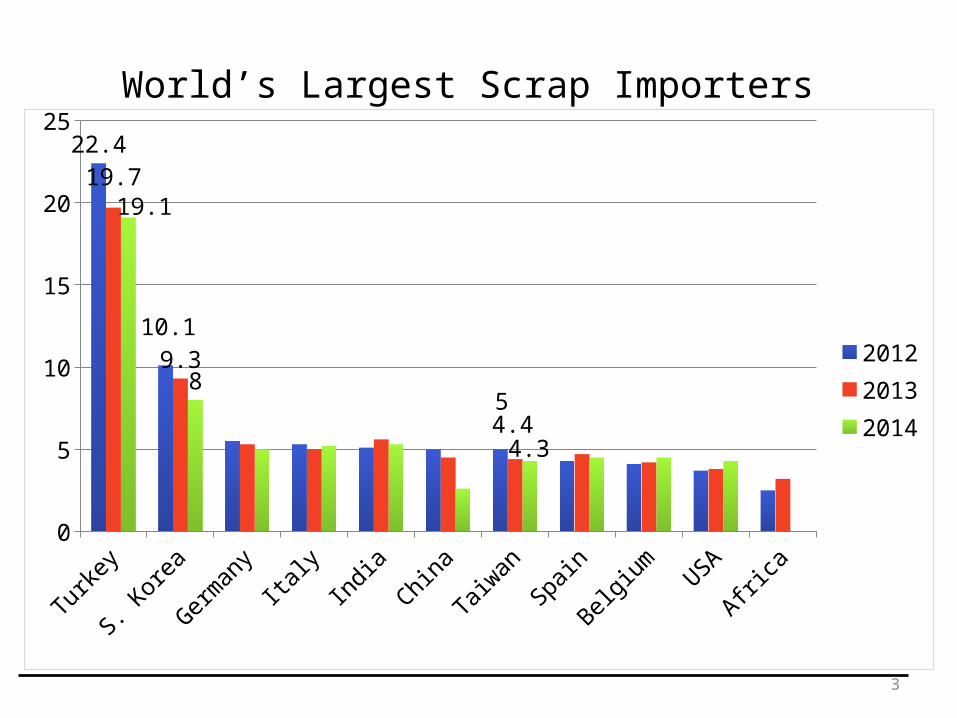
World’s Largest Scrap Importers
3
Turkey
S. Korea
German
yIta
lyIndia
China
Taiwan
Spain
Belgium
USAAfri
ca0
5
10
15
20
2522.4
10.1
5
19.7
9.3
4.4
19.1
8
4.3
201220132014
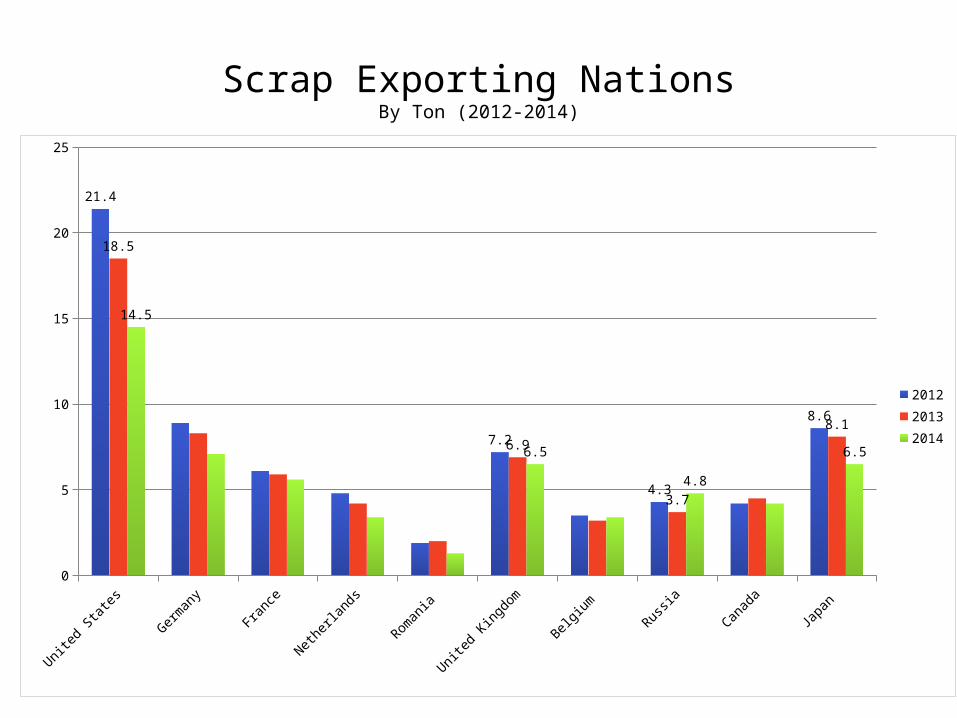
Scrap Exporting NationsBy Ton (2012-2014)
United States Germany France Netherlands Romania United Kingdom
Belgium Russia Canada Japan 0
5
10
15
20
25
21.4
7.2
4.3
8.6
18.5
6.9
3.7
8.1
14.5
6.5
4.8
6.5
201220132014
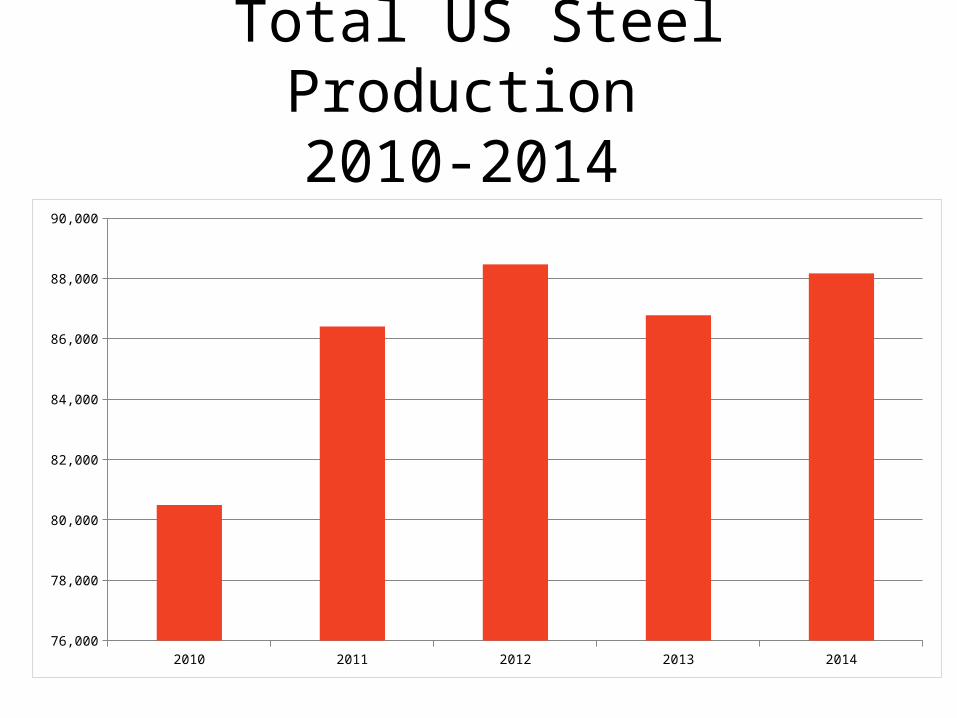
Total US Steel Production 2010-2014
2010 2011 2012 2013 201476,000
78,000
80,000
82,000
84,000
86,000
88,000
90,000
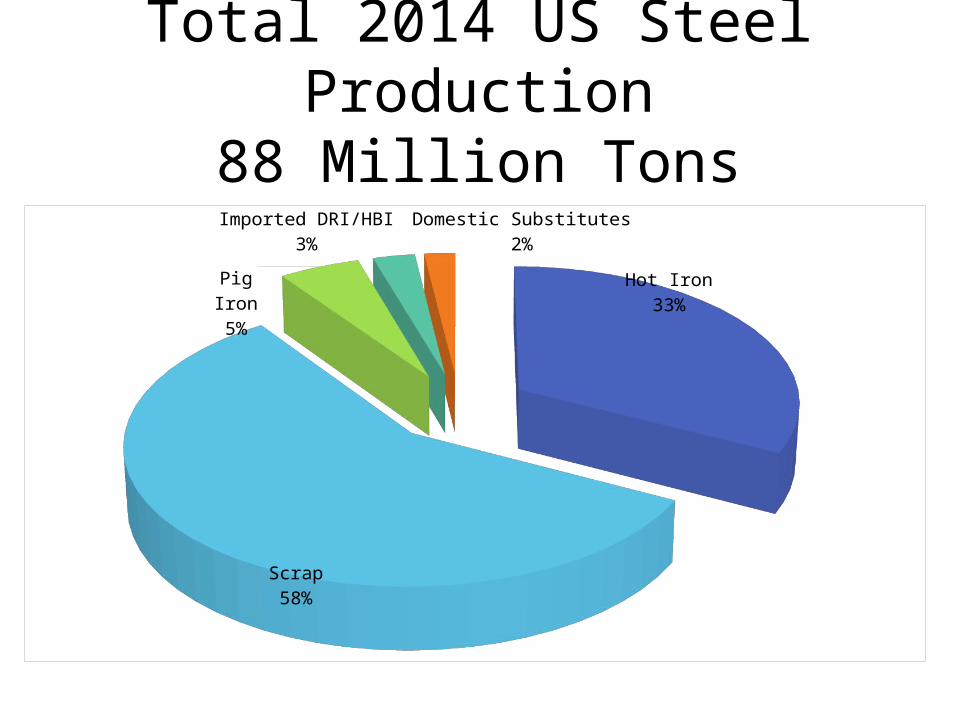
Total 2014 US Steel Production88 Million Tons
Hot Iron33%
Scrap58%
Pig Iron5%
Imported DRI/HBI3%
Domestic Substitutes2%
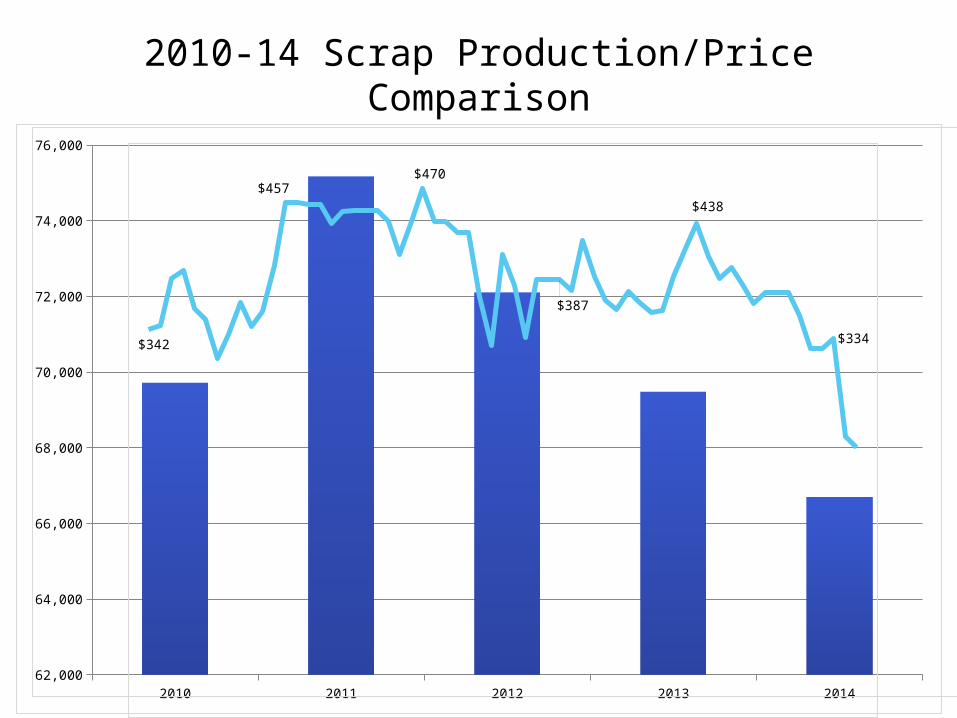
2010-14 Scrap Production/Price Comparison
2010 2011 2012 2013 201462,000
64,000
66,000
68,000
70,000
72,000
74,000
76,000
$342
$457$470
$387
$438
$334
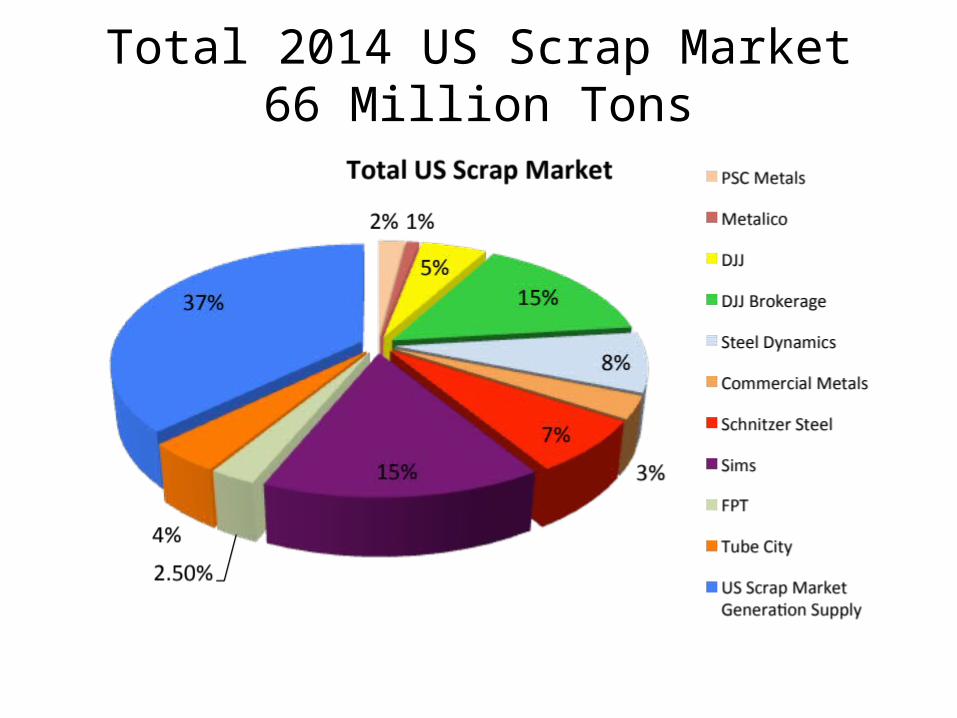
Total 2014 US Scrap Market66 Million Tons
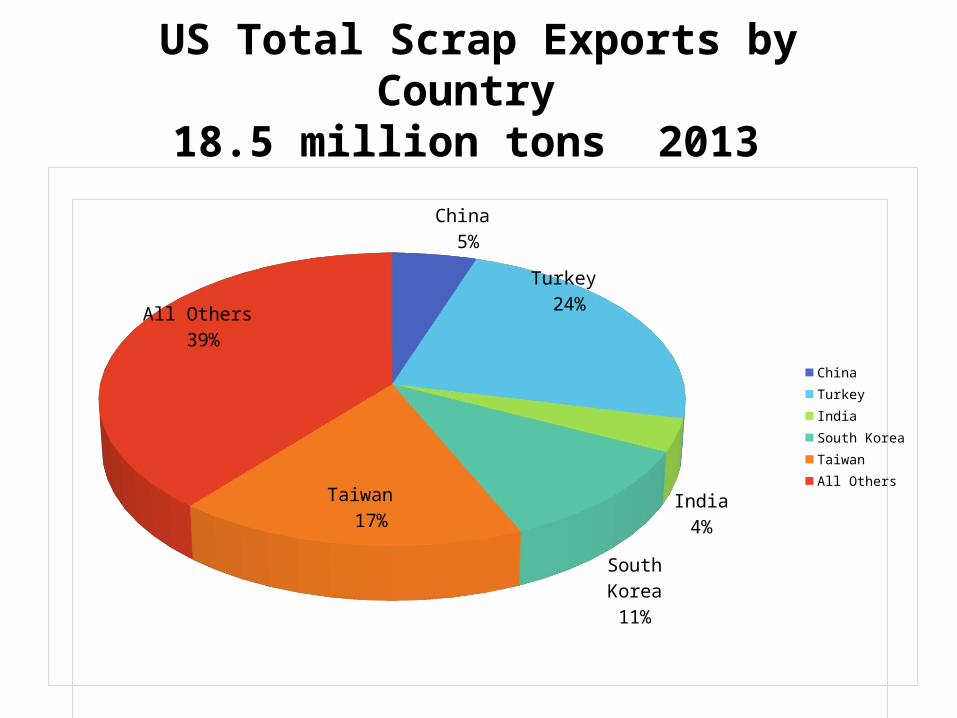
US Total Scrap Exports by Country 18.5 million tons 2013
China 5%
Turkey 24%
India4%
South Korea11%Taiwan
17%
All Others 39%
China Turkey IndiaSouth KoreaTaiwan All Others
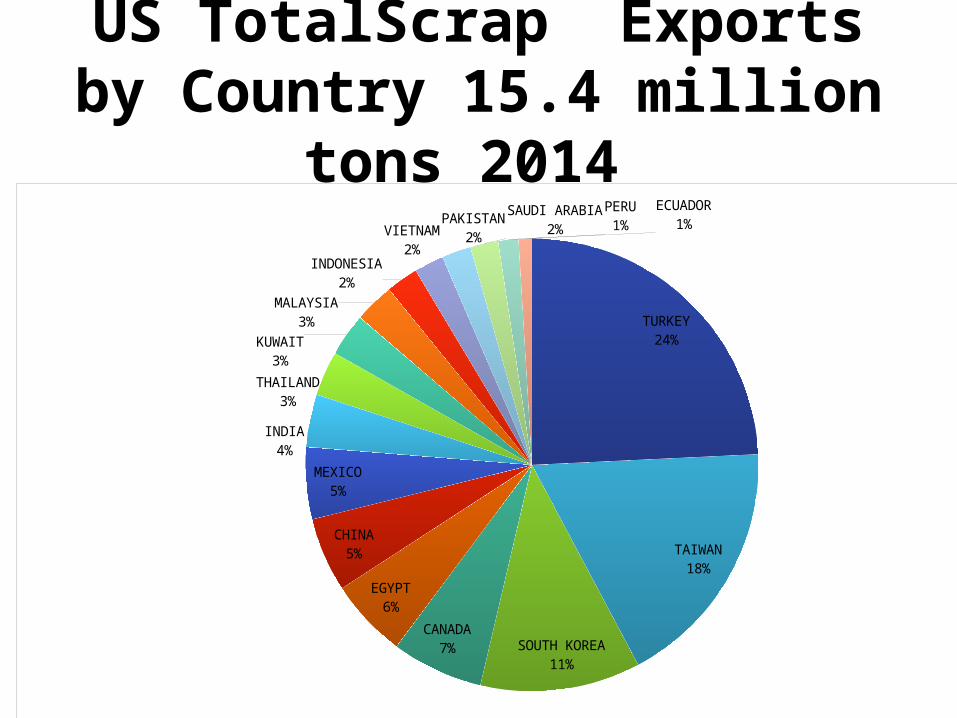
US TotalScrap Exports by Country 15.4 million tons 2014
TURKEY24%
TAIWAN18%
SOUTH KOREA11%
CANADA7%
EGYPT6%
CHINA5%
MEXICO5%
INDIA4%
THAILAND3%
KUWAIT3%
MALAYSIA3%
INDONESIA2%
VIETNAM2%
PAKISTAN2%
SAUDI ARABIA2%
PERU1%
ECUADOR1%
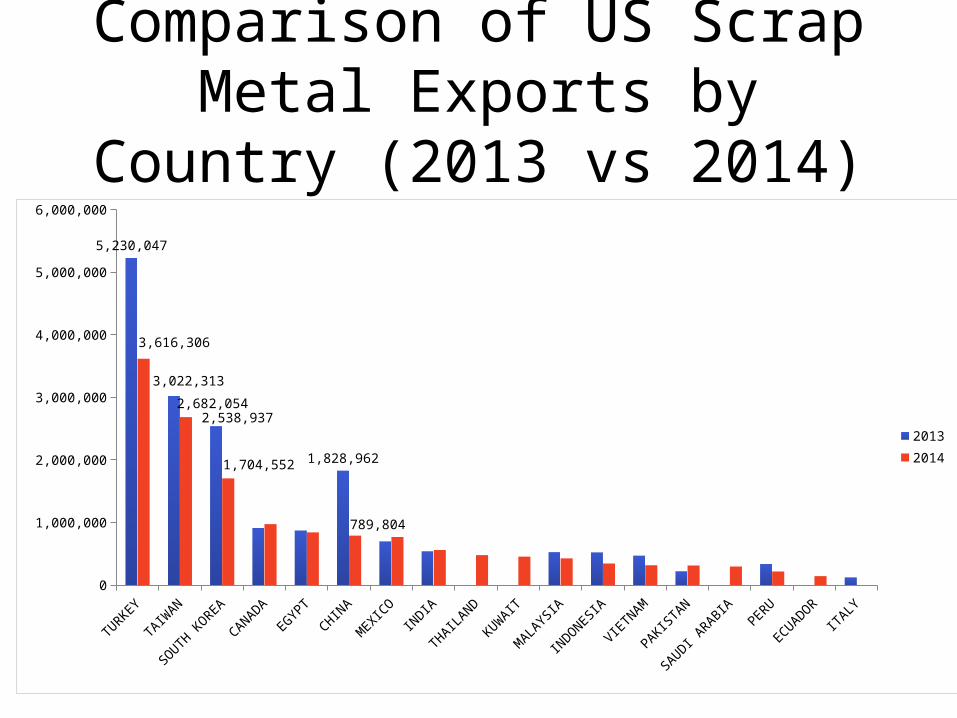
Comparison of US Scrap Metal Exports by Country (2013 vs 2014)
TURKEY
TAIW
AN
SOUTH
KOREA
CANADAEG
YPT
CHINA
MEXICO
INDIA
THAILA
ND
KUWAIT
MALAYS
IA
INDONESIA
VIETNAM
PAKISTAN
SAUDI A
RABIAPER
U
ECUADOR
ITALY
0
1,000,000
2,000,000
3,000,000
4,000,000
5,000,000
6,000,000
5,230,047
3,022,313
2,538,937
1,828,962
3,616,306
2,682,054
1,704,552
789,804
20132014
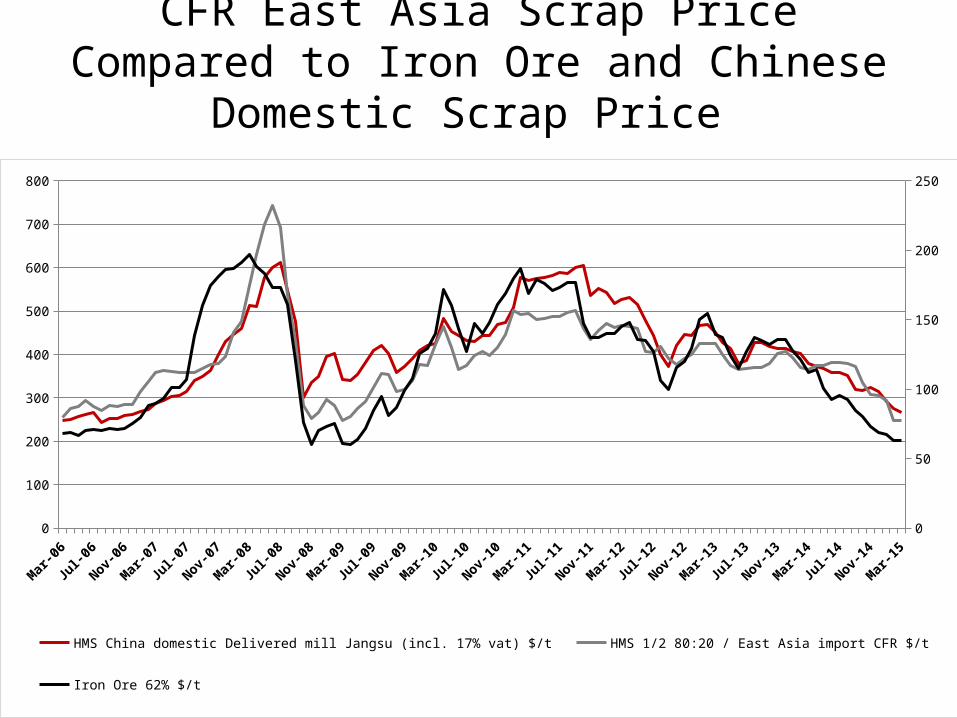
CFR East Asia Scrap Price Compared to Iron Ore and Chinese Domestic Scrap Price
Mar-06
Jun-06
Sep-06
Dec-06
Mar-07
Jun-07
Sep-07
Dec-07
Mar-08
Jun-08
Sep-08
Dec-08
Mar-09
Jun-09
Sep-09
Dec-09
Mar-10
Jun-10
Sep-10
Dec-10
Mar-11
Jun-11
Sep-11
Dec-11
Mar-12
Jun-12
Sep-12
Dec-12
Mar-13
Jun-13
Sep-13
Dec-13
Mar-14
Jun-14
Sep-14
Dec-14
Mar-15
0
100
200
300
400
500
600
700
800
0
50
100
150
200
250
HMS China domestic Delivered mill Jangsu (incl. 17% vat) $/t HMS 1/2 80:20 / East Asia import CFR $/t Iron Ore 62% $/t
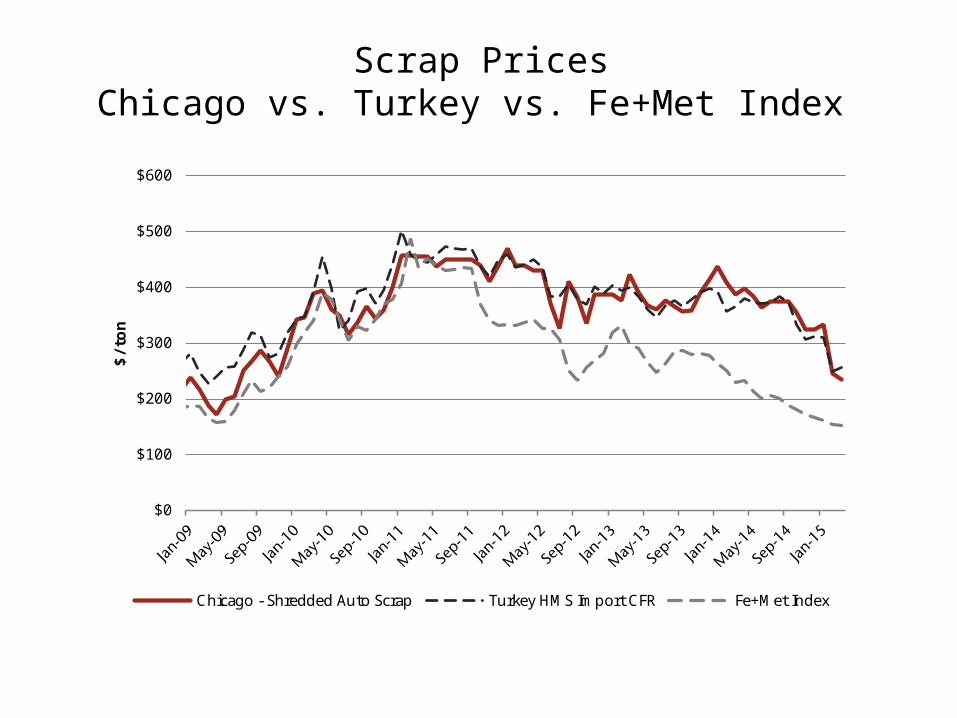
Scrap PricesChicago vs. Turkey vs. Fe+Met Index
$0
$100
$200
$300
$400
$500
$600
$/ton
Chicago - Shredded Auto Scrap Turkey HMS Import CFR Fe+Met Index
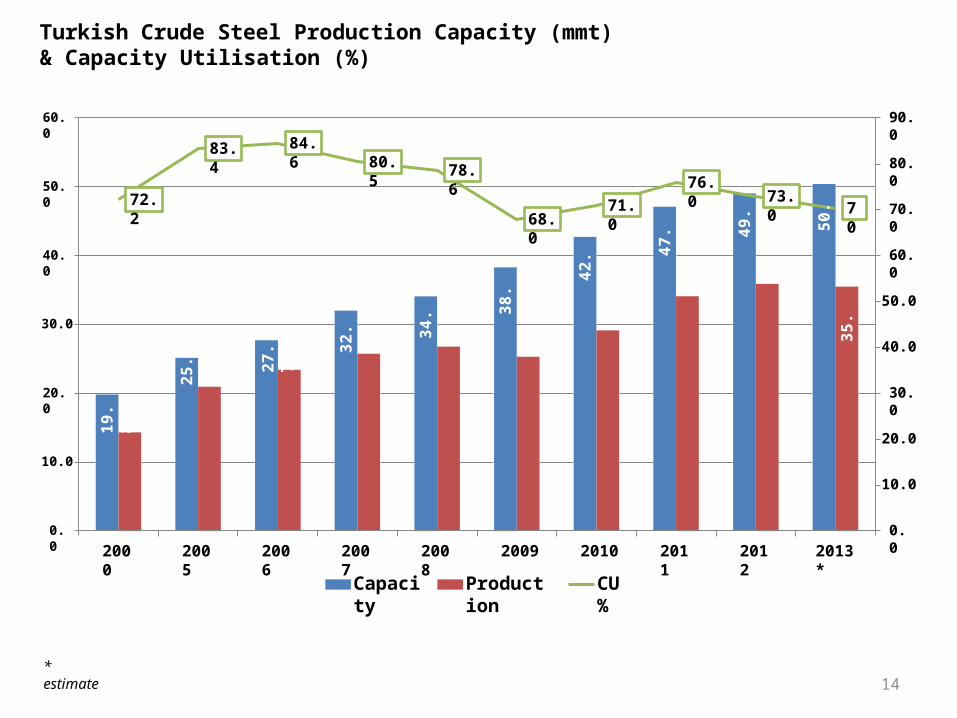
Turkish Crude Steel Production Capacity (mmt) & Capacity Utilisation (%)
19.8
25.1 27
.7 32.0 34
.1 38.3
42.7 47
.1 49.0
50.4
35.5
72.2
83.4 84.680.5 78.6
68.071.0
76.073.0
70
0.0
20.0
10.0
10.0
30.0
50.0
30.0
40.0
60.0
70.0
80.0
90.0
0.0
20.0
40.0
50.0
60.0
2000 2005 2006 2007 2008 2009
Production
2010
CU %
* estimate14
2011 2012 2013*
Capacity
15
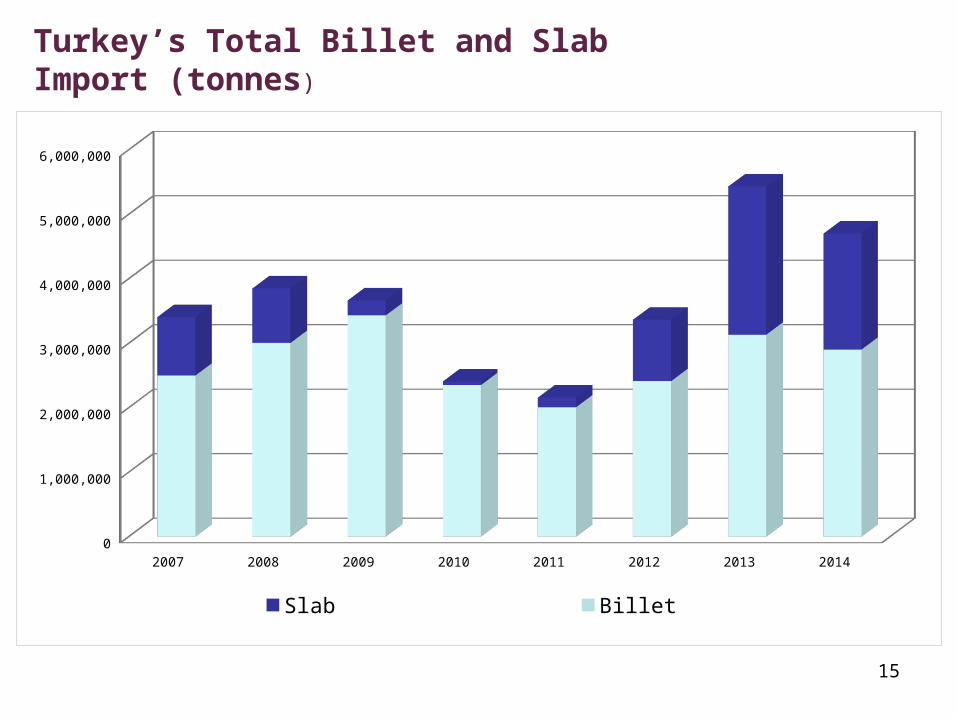
Turkey’s Total Billet and Slab Import (tonnes)
2007 2008 2009 2010 2011 2012 2013 20140
1,000,000
2,000,000
3,000,000
4,000,000
5,000,000
6,000,000
Slab Billet
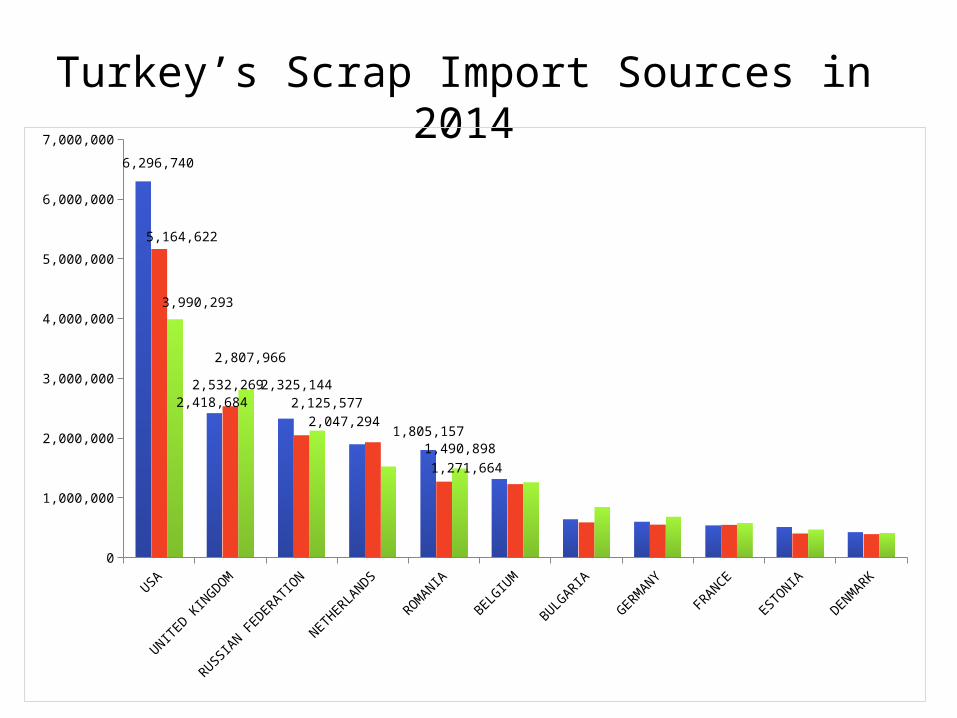
Turkey’s Scrap Import Sources in 2014
USA
UNITED KINGDOM
RUSSIAN FE
DERATIO
N
NETHER
LANDS
ROMANIA
BELGIUM
BULGARIA
GERMANY
FRANCE
ESTO
NIA
DENMARK
0
1,000,000
2,000,000
3,000,000
4,000,000
5,000,000
6,000,000
7,000,000
6,296,740
2,418,6842,325,144
1,805,157
5,164,622
2,532,269
2,047,294
1,271,664
3,990,293
2,807,966
2,125,577
1,490,898
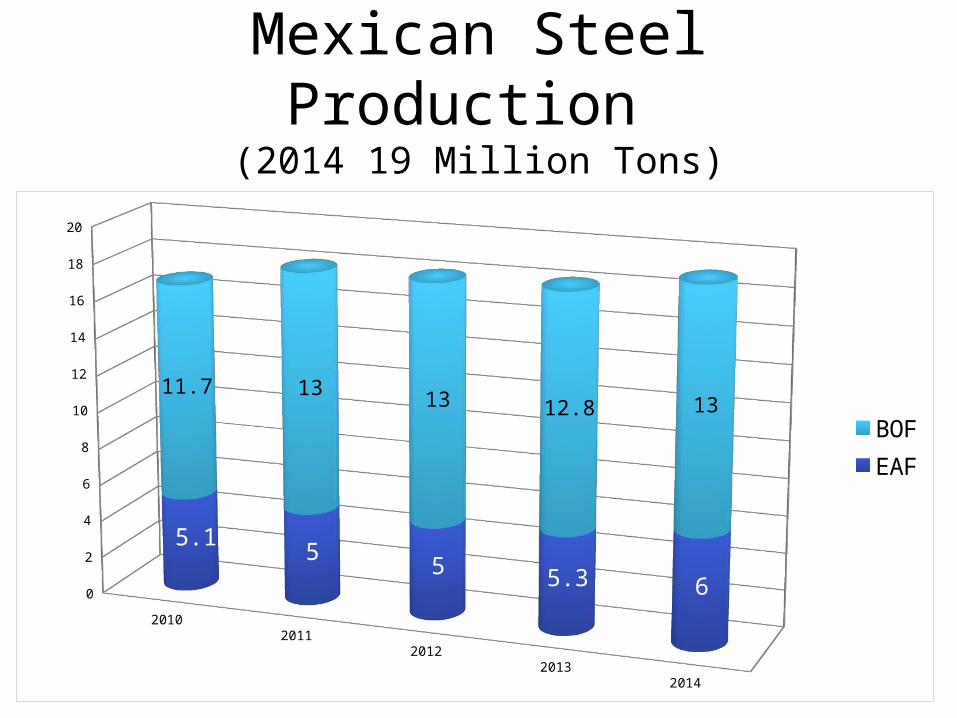
Mexican Steel Production (2014 19 Million Tons)
20102011
20122013
2014
0
2
4
6
8
10
12
14
16
18
20
5.15 5 5.3 6
11.7 13 13 12.8 13BOFEAF
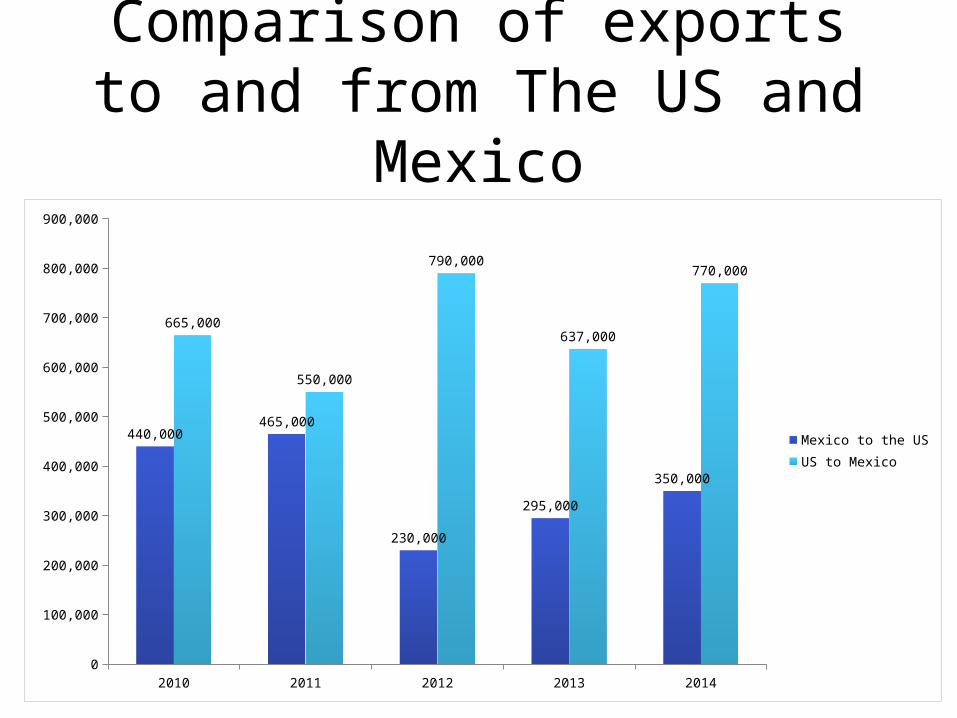
Comparison of exports to and from The US and Mexico
2010 2011 2012 2013 20140
100,000
200,000
300,000
400,000
500,000
600,000
700,000
800,000
900,000
440,000465,000
230,000
295,000
350,000
665,000
550,000
790,000
637,000
770,000
Mexico to the USUS to Mexico
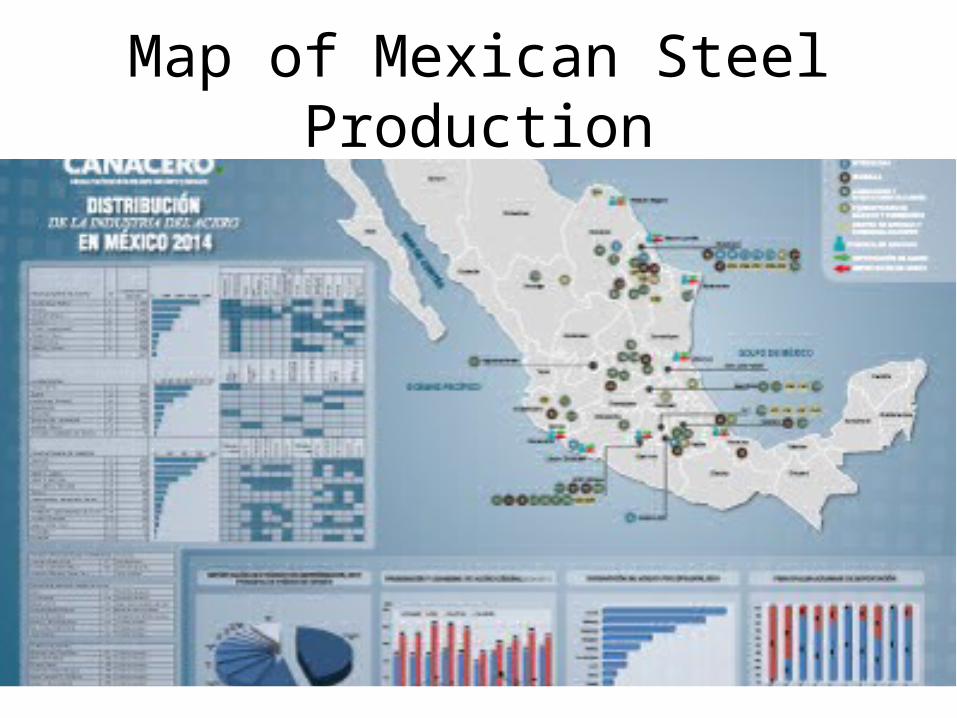
Map of Mexican Steel Production
Thank you!
Hoffman Iron and Steel