Steel-rolling Mill Lubricant Selection
4
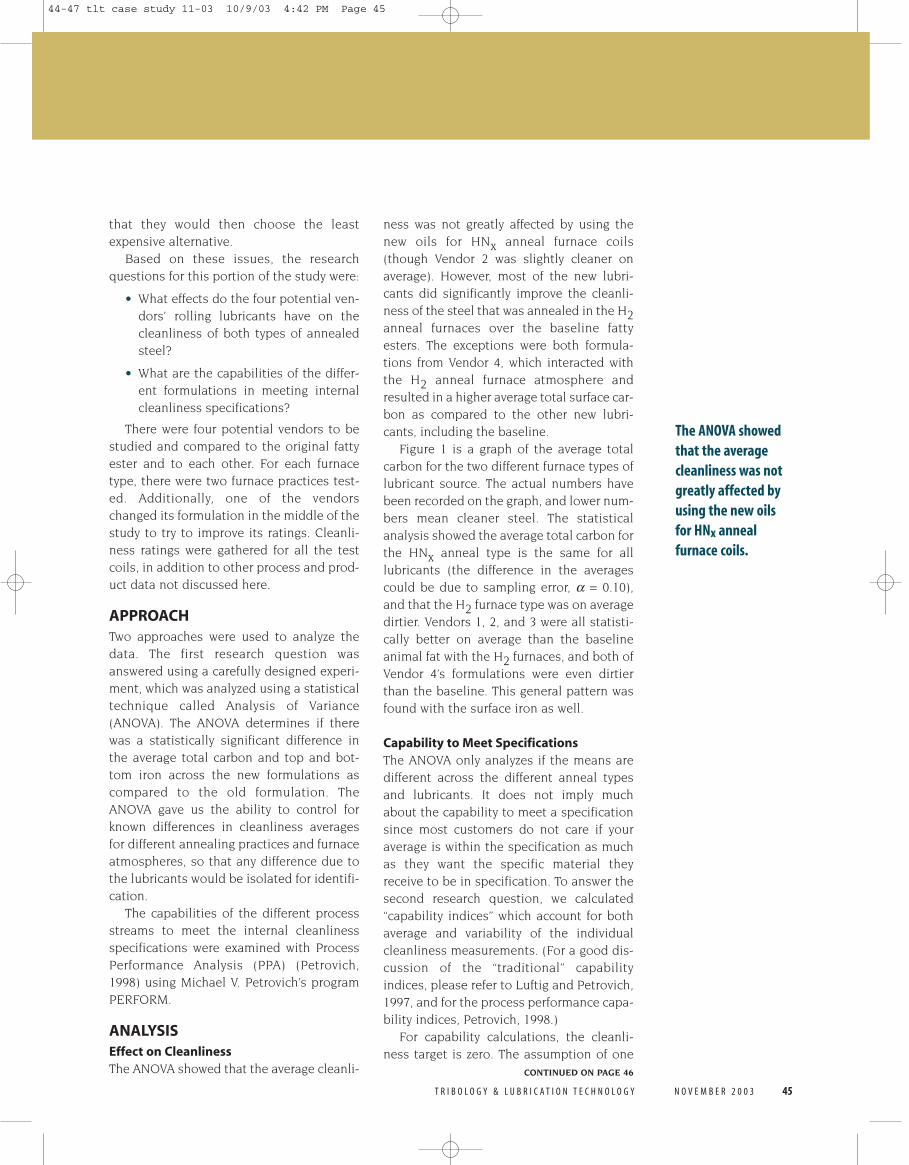
44 NOVEMBER 2003 TRIBOLOGY & LUBRICATION TECHNOLOGY INTRODUCTION The East Chicago, Ill., plant of the former Inland Steel Co. (now Ispat Inland) was con- sidering changing the type of rolling mill lubricant used on a temper mill. Mill lubri- cants are critical to a variety of product and process characteristics in rolled product since they transmit the force of the mill rolls to the surface of the material being rolled, in this case varieties of steels. Rolling lubri- cants can affect mill reduction efficiencies and speeds, as well as the surface quality and roughness and metal fine generation. PROBLEM DESCRIPTION Inland had been using a fatty ester-based lubricant for years, but since the fatty esters were themselves harvested from animal fats, there was little ability to control a number of critical lubricant parameters. It was thought that moving to a synthetic lubricant would allow for lower variability in these parame- ters, as well as increase productivity, surface quality and steel cleanliness. Four vendors were vying for this business and were willing to supply their lubricants for production trials. These production trials required fully replacing the lubricant on the mill and the remaining processing steps, so the sample size was limited. There were also two different types of annealing furnaces in use, a mixed hydrogen and nitrogen gas atmosphere, called HN x , and newer pure hydrogen atmosphere furnaces, called H 2 . Previous work during the start-up of the new hydrogen furnaces indicated that a lubricant might very well respond differently to the two types of furnace atmospheres. While the new furnaces had huge improvements in productivity, they had also been shown to result in a dirtier surface, as measured by the total residual carbon and top and bot- tom iron residuals after annealing. At this point, process tuning had improved the cleanliness of the H 2 annealed steel, but it still was dirtier than comparable HN x - annealed steel. A critical requirement of the lubricant to be chosen was sheet cleanliness at the end of the process as defined by total carbon and top and bottom surface iron residuals. Sur- face cleanliness affected a number of product performance issues for Inland’s customers. Procurement had agreed to the test, anticipating that they would only need to show that all of the vendors were capable of making the cleanliness requirements and Steel-rolling Mill Lubricant Selection By Steven M. Ouellette The ROI Alliance, LLC Longmont, Colorado Case Study Figure 1 – Profile Plot for Total Carbon -1.0 -.8 -.6 -.4 -2. 0.0 .2 .4 HN H Vendor 4 Formula 2 Vendor 4 Formula 1 Vendor 3 Vendor 2 Vendor 1 Animal Fat 2 x Means Anneal Type Lube Total Carbon 44-47 tlt case study 11-03 10/9/03 4:42 PM Page 44
Transcript of Steel-rolling Mill Lubricant Selection
44 N O V E M B E R 2 0 0 3 T R I B O L O G Y & L U B R I C A T I O N T E C H N O L O G Y
INTRODUCTIONThe East Chicago, Ill., plant of the formerInland Steel Co. (now Ispat Inland) was con-sidering changing the type of rolling milllubricant used on a temper mill. Mill lubri-cants are critical to a variety of product andprocess characteristics in rolled productsince they transmit the force of the mill rollsto the surface of the material being rolled, inthis case varieties of steels. Rolling lubri-cants can affect mill reduction efficienciesand speeds, as well as the surface qualityand roughness and metal fine generation.
PROBLEM DESCRIPTIONInland had been using a fatty ester-basedlubricant for years, but since the fatty esterswere themselves harvested from animal fats,there was little ability to control a number ofcritical lubricant parameters. It was thought
that moving to a synthetic lubricant wouldallow for lower variability in these parame-ters, as well as increase productivity, surfacequality and steel cleanliness.
Four vendors were vying for this businessand were willing to supply their lubricantsfor production trials. These production trialsrequired fully replacing the lubricant on themill and the remaining processing steps, sothe sample size was limited. There were alsotwo different types of annealing furnaces inuse, a mixed hydrogen and nitrogen gasatmosphere, called HNx, and newer purehydrogen atmosphere furnaces, called H2.Previous work during the start-up of the newhydrogen furnaces indicated that a lubricantmight very well respond differently to thetwo types of furnace atmospheres. While thenew furnaces had huge improvements inproductivity, they had also been shown toresult in a dirtier surface, as measured bythe total residual carbon and top and bot-tom iron residuals after annealing. At thispoint, process tuning had improved thecleanliness of the H2 annealed steel, but itstill was dirtier than comparable HNx-annealed steel.
A critical requirement of the lubricant tobe chosen was sheet cleanliness at the end ofthe process as defined by total carbon andtop and bottom surface iron residuals. Sur-face cleanliness affected a number of productperformance issues for Inland’s customers.
Procurement had agreed to the test,anticipating that they would only need toshow that all of the vendors were capable ofmaking the cleanliness requirements and
Steel-rolling Mill Lubricant SelectionBy Steven M. OuelletteThe ROI Alliance, LLCLongmont, Colorado
C a s e S t u d y
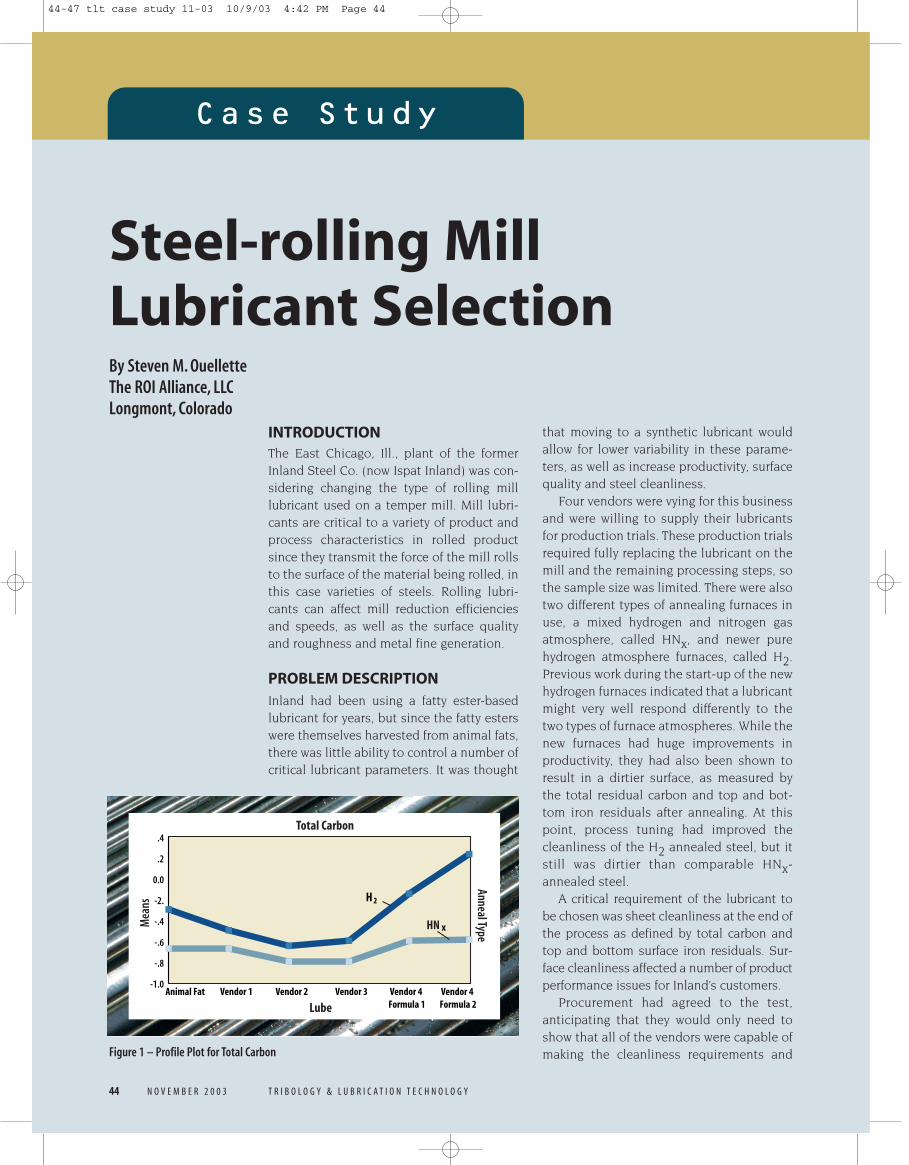
Figure 1 – Profile Plot for Total Carbon
-1.0
-.8
-.6
-.4
-2.
0.0
.2
.4
HN
H
Vendor 4 Formula 2
Vendor 4 Formula 1
Vendor 3Vendor 2Vendor 1Animal Fat
2
xMea
ns
Anneal Type
Lube
Total Carbon
44-47 tlt case study 11-03 10/9/03 4:42 PM Page 44
T R I B O L O G Y & L U B R I C A T I O N T E C H N O L O G Y N O V E M B E R 2 0 0 3 45
that they would then choose the leastexpensive alternative.
Based on these issues, the researchquestions for this portion of the study were:
• What effects do the four potential ven-dors’ rolling lubricants have on thecleanliness of both types of annealedsteel?
• What are the capabilities of the differ-ent formulations in meeting internalcleanliness specifications?
There were four potential vendors to bestudied and compared to the original fattyester and to each other. For each furnacetype, there were two furnace practices test-ed. Additionally, one of the vendorschanged its formulation in the middle of thestudy to try to improve its ratings. Cleanli-ness ratings were gathered for all the testcoils, in addition to other process and prod-uct data not discussed here.
APPROACHTwo approaches were used to analyze thedata. The first research question wasanswered using a carefully designed experi-ment, which was analyzed using a statisticaltechnique called Analysis of Variance(ANOVA). The ANOVA determines if therewas a statistically significant difference inthe average total carbon and top and bot-tom iron across the new formulations ascompared to the old formulation. TheANOVA gave us the ability to control forknown differences in cleanliness averagesfor different annealing practices and furnaceatmospheres, so that any difference due tothe lubricants would be isolated for identifi-cation.
The capabilities of the different processstreams to meet the internal cleanlinessspecifications were examined with ProcessPerformance Analysis (PPA) (Petrovich,1998) using Michael V. Petrovich’s programPERFORM.
ANALYSISEffect on CleanlinessThe ANOVA showed that the average cleanli-
ness was not greatly affected by using thenew oils for HNx anneal furnace coils(though Vendor 2 was slightly cleaner onaverage). However, most of the new lubri-cants did significantly improve the cleanli-ness of the steel that was annealed in the H2anneal furnaces over the baseline fattyesters. The exceptions were both formula-tions from Vendor 4, which interacted withthe H2 anneal furnace atmosphere andresulted in a higher average total surface car-bon as compared to the other new lubri-cants, including the baseline.
Figure 1 is a graph of the average totalcarbon for the two different furnace types oflubricant source. The actual numbers havebeen recorded on the graph, and lower num-bers mean cleaner steel. The statisticalanalysis showed the average total carbon forthe HNx anneal type is the same for alllubricants (the difference in the averagescould be due to sampling error, α = 0.10),and that the H2 furnace type was on averagedirtier. Vendors 1, 2, and 3 were all statisti-cally better on average than the baselineanimal fat with the H2 furnaces, and both ofVendor 4’s formulations were even dirtierthan the baseline. This general pattern wasfound with the surface iron as well.
Capability to Meet SpecificationsThe ANOVA only analyzes if the means aredifferent across the different anneal typesand lubricants. It does not imply muchabout the capability to meet a specificationsince most customers do not care if youraverage is within the specification as muchas they want the specific material theyreceive to be in specification. To answer thesecond research question, we calculated“capability indices” which account for bothaverage and variability of the individualcleanliness measurements. (For a good dis-cussion of the “traditional” capabilityindices, please refer to Luftig and Petrovich,1997, and for the process performance capa-bility indices, Petrovich, 1998.)
For capability calculations, the cleanli-ness target is zero. The assumption of one
CONTINUED ON PAGE 46
The ANOVA showedthat the averagecleanliness was notgreatly affected byusing the new oilsfor HNx anneal furnace coils.
44-47 tlt case study 11-03 10/9/03 4:42 PM Page 45
46 N O V E M B E R 2 0 0 3 T R I B O L O G Y & L U B R I C A T I O N T E C H N O L O G Y
type of capability measure (Cpm and Ppm) isthat any deviation from the target accumu-lates cost, so the minimum cost is at perfectcleanliness.
To be able to assess the ability of a processto produce product in the future, you musthave reasonable process stability and an un-derstanding of the total variation.The smallsample sizes in each combination of factorsdoes not allow you to assess control. Howev-er, you can assess the potential capabilitybased on the data accumulated. Potentialcapability merely tells you where the cleanli-ness ended up and does not predict where itwill go in the future. If the potential capabilityindicates that the lubricant is not capable, it is
probably a good bet that it will continue to failwith time. Conversely, if a lubricant has a goodcapability to meet the specification, unlesssomething changes from where it was duringthe study, you will likely see similar but slight-ly lower performance as time goes by.
The ability for a process to meet the specifi-cations is commonly measured in three ways:
• Process variation compared to the spec-ification range (not location) - Cp
• Process ability to make individual unitswithin the specification limits - Cpk
• Process variability around target - CpmIf your capability index equals 1 and you
are on target, then you would theoretically
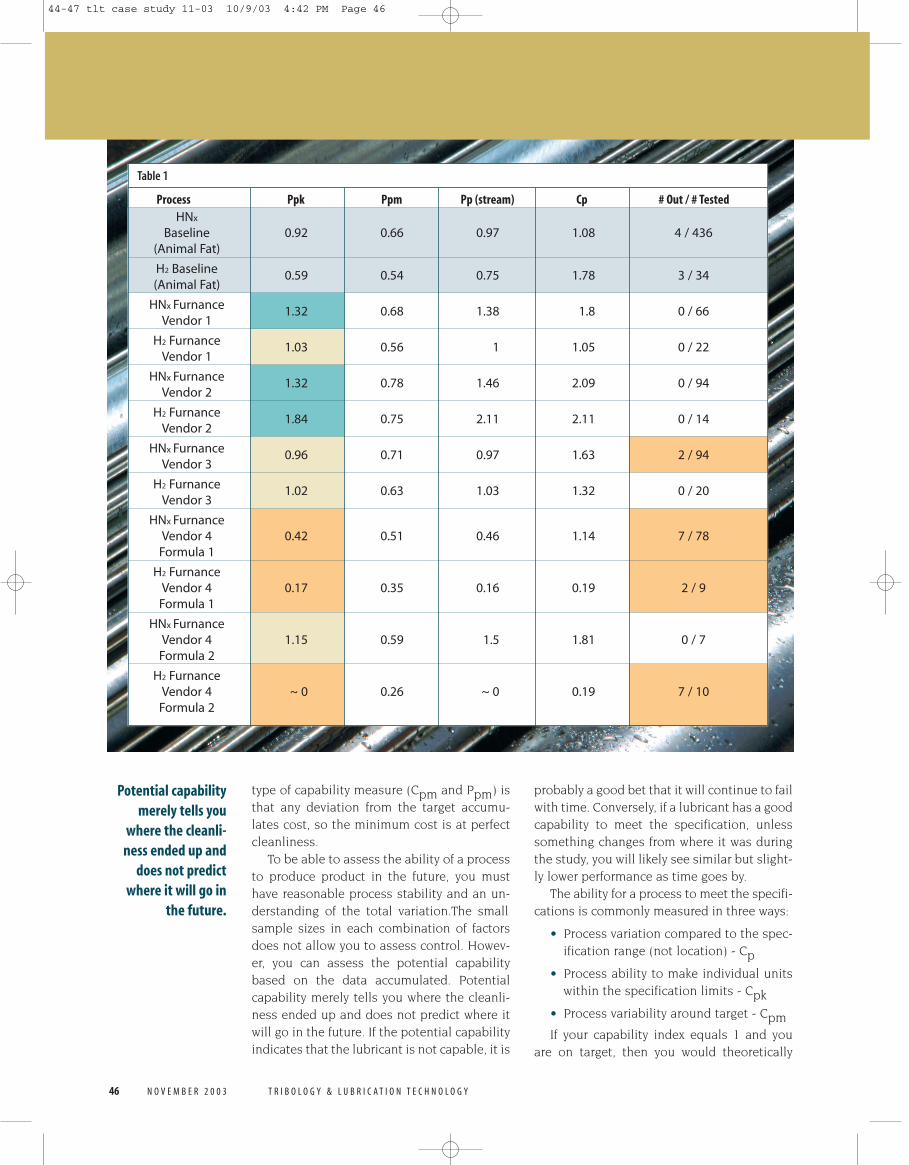
Table 1
Process Ppk Ppm Pp (stream) Cp # Out / # TestedHNx
Baseline 0.92 0.66 0.97 1.08 4 / 436(Animal Fat)
H2 Baseline 0.59 0.54 0.75 1.78 3 / 34(Animal Fat)
HNx Furnance 1.32 0.68 1.38 1.8 0 / 66Vendor 1
H2 Furnance 1.03 0.56 1 1.05 0 / 22Vendor 1
HNx Furnance 1.32 0.78 1.46 2.09 0 / 94Vendor 2
H2 Furnance 1.84 0.75 2.11 2.11 0 / 14Vendor 2
HNx Furnance 0.96 0.71 0.97 1.63 2 / 94Vendor 3
H2 Furnance 1.02 0.63 1.03 1.32 0 / 20Vendor 3
HNx FurnanceVendor 4 0.42 0.51 0.46 1.14 7 / 78Formula 1
H2 FurnanceVendor 4 0.17 0.35 0.16 0.19 2 / 9Formula 1
HNx FurnanceVendor 4 1.15 0.59 1.5 1.81 0 / 7Formula 2
H2 FurnanceVendor 4 ~ 0 0.26 ~ 0 0.19 7 / 10Formula 2
Potential capabilitymerely tells you
where the cleanli-ness ended up and
does not predictwhere it will go in
the future.
44-47 tlt case study 11-03 10/9/03 4:42 PM Page 46
T R I B O L O G Y & L U B R I C A T I O N T E C H N O L O G Y N O V E M B E R 2 0 0 3 47T R I B O L O G Y & L U B R I C A T I O N T E C H N O L O G Y N O V E M B E R 2 0 0 3 47
make 99.73% of your product within thespecification over time. Usually in industryyou want a little insurance against falling outof specification if the process shifts a bit, soInland decided on the common capabilitytarget of 1.33, or 99.9937% within spec (or forthe Six Sigma world, approximately 5.33“sigma”). Larger capability numbers indicatebetter ability to meet the specification. If youhave a Cpk of 1.33, your average cleanlinesscan shift by one standard deviation and youwill still make at least 99.73% of your productwithin specification. By changing how youcalculate the standard deviation and replac-ing the C with a P (for performance), you canassess the process as it has been performingwithout making assumptions about controlor distributional shape. The trade-off is thatyou can only see where you have been andyou may not be accurately predicting thefuture capability. However, it has been ourexperience that the traditional “C” type capa-bility indices have limited, if any, applicationin real-world manufacturing environments.
We determined the potential capability ofeach lubricant stratified (separated) bylubricant and anneal furnace type. Theresults are summarized in the table on page46. Ppk is the potential capability of the des-ignated furnace type to make steel cleanerthan the upper spec limit given the two fur-nace practices and the lubricant, and shouldbe 1.33 or more for this study. Ppm is thecapability to hit target; the bigger the num-ber, the cleaner the steel (closer to the tar-get “0” for cleanliness for both the averageand variability). Pp (stream) is what thecapability could be if it was on target andthe two different furnace types were made togive you the same average, perhaps throughprocess improvements or furnace practicetuning. Cp is the capability you couldachieve by eliminating out-of-control pointsin addition to eliminating differencesbetween furnace types and getting the aver-age on target.
From the PPA analysis, we see that for theHNx furnaces, Vendor 1 and 2 nearly meetthe 1.33 requirement, while Vendor 3 is min-imally capable. However, if we look at thecapability for the new furnaces, almost all
the suppliers exhibit lower capability, withVendors 1 and 2 being minimally capable.The one exception is Vendor 2, which actu-ally shows improved cleanliness in the H2furnaces. Of particular note is that Vendor4’s first formulation is completely inade-quate for the application, and when given achance to reformulate, improves its HNxcapability to borderline while essentiallyguaranteeing that most coils annealed inthe H2 furnace will fall outside the cleanli-ness specification.
RESULTSBased on our analysis, Vendor 1 and 2 per-form near goal with the HNx furnaces. Ven-dor 1 is minimally capable with the H2 fur-naces, and Vendor 2 exceeded our capabilitygoal for H2. Vendor 3 was minimally capablewith both furnace types, and Vendor 4 mustbe dropped from consideration.
An interesting sidenote is that going intothe trial, Vendor 4 was the favorite, bothbecause of price and perceived quality. Ven-dor 4’s product performed well on the othermeasures of interest, and had the cleanli-ness not been tested, would likely havebeen chosen as the new supplier, resultingin increasing customer complaints andreturns for nonconformities related tocleanliness. Inland estimated that had Ven-dor 4 been chosen, $70 million annuallywould have been lost due to the direct costof decreased surface cleanliness and itseffects. No estimate was made of less directcosts such as rework, missed deliveries, lossof customer confidence (and probably busi-ness), customer shutdowns, or scramblingto find a new lubricant supplier in the mid-dle of a cleanliness excursion.
Vendor 2 had the highest cleanliness butdid not become the supplier. Vendor 1 waschosen based on a cost-analysis, since itsproduct was significantly less expensivethan Vendor 2 and the volume through thehydrogen furnaces was small. Process con-trols were implemented to prevent steelrolled on the mill with the new lubricantfrom annealing in the H2 furnaces untilongoing process work had been shown toimprove cleanliness in that process. <<
REFERENCES1. Luftig, J.T. Petrovich,
M. (1997), Quality withConfidence in Manufac-turing, SPSS Inc.,Chicago, Ill.
2. Petrovich, M. (1998),“Performance Analysisfor Process Improve-ment,” 1998 ASQ Congress Proceedings,Philadelphia, Pa.
44-47 tlt case study 11-03 10/9/03 4:42 PM Page 47