Steel Imports Report: India - International Trade … Imports Report: India July 2017 Background...
8
1 Steel Imports Report: India July 2017 Background India is the world’s eleventh-largest steel importer. In year-to-date 2017 (through March), further referred to as YTD 2017, India imported 2 million metric tons of steel, a 43 percent decrease from 3.6 million metric tons in YTD 2016. India’s steel imports represented 3 percent of all steel imported globally in 2016. The volume of India’s 2016 steel imports was just under a third the size of the world’s largest importer, the United States. In value terms, steel represented just 1.9 percent of the total amount of goods imported into India in 2016. India imports steel from over 80 countries and territories. The 7 countries labeled in the map below represent the top import sources for India’s imports of steel, with each sending more than 200 thousand metric tons and together accounting for 85 percent of India’s steel imports in 2016. Quick Facts: ● World’s eleventh-largest steel importer: 2 million metric tons (YTD 2017) ● 45% steel import decrease since Q4 2015 ● YTD import volume down 43% and value down 23% ● Import penetration at 9.2% in YTD 2017 ● Top three import sources: China, South Korea, Japan ● Largest producers: TATA Steel Group, JSW Steel Limited, Steel Authority of India Ltd. (SAIL) ● 19 trade remedies in effect against imports of steel mill products India’s Imports of Steel Mill Products - 2016 Data Source: Global Trade Atlas; Copyright © IHS Global Inc. 2017. All rights reserved.
Transcript of Steel Imports Report: India - International Trade … Imports Report: India July 2017 Background...

1
Steel Imports Report: India July 2017
Background
India is the world’s eleventh-largest steel importer. In year-to-date
2017 (through March), further referred to as YTD 2017, India imported
2 million metric tons of steel, a 43 percent decrease from 3.6 million
metric tons in YTD 2016. India’s steel imports represented 3 percent of
all steel imported globally in 2016. The volume of India’s 2016 steel
imports was just under a third the size of the world’s largest importer,
the United States. In value terms, steel represented just 1.9 percent of
the total amount of goods imported into India in 2016.
India imports steel from over 80 countries and territories. The 7
countries labeled in the map below represent the top import sources for
India’s imports of steel, with each sending more than 200 thousand
metric tons and together accounting for 85 percent of India’s steel
imports in 2016.
Quick Facts:
● World’s eleventh-largest
steel importer: 2 million
metric tons (YTD 2017)
● 45% steel import
decrease since Q4 2015
● YTD import volume
down 43% and value
down 23%
● Import penetration at
9.2% in YTD 2017
● Top three import
sources: China, South
Korea, Japan
● Largest producers: TATA
Steel Group, JSW Steel
Limited, Steel Authority of
India Ltd. (SAIL)
● 19 trade remedies in
effect against imports of
steel mill products
India’s Imports of Steel Mill Products - 2016
Data Source: Global Trade Atlas; Copyright © IHS Global Inc. 2017. All rights reserved.

2
Steel Trade Balance
Since 2005, India has alternated
between being a net steel
importer and a net steel
exporter. Imports and exports
have displayed a roughly inverse
relationship, as imports
declined sharply in tandem with
export growth. Since their most
recent high point in Q4 2015,
India’s imports have decreased
45 percent. In contrast to
having a steel trade deficit in
YTD 2016, India posted a steel
trade surplus of 2.9 million
metric tons in YTD 2017 due to a jump in exports and a drop in imports.
Steel Imports Report: India
Import Volume, Value, and Product
India's volume of steel imports hit a peak in 2015 at 13.3 million metric tons — a jump of 41 percent
from 9.4 million metric tons in 2014. Imports in 2016 decreased back down to 2014 levels, down 26
percent to 9.8 million metric tons. India’s YTD 2017 imports have decreased by 1.5 million metric
tons over YTD 2016. Similarly, the value of India’s YTD 2017 steel imports have decreased by 23
percent to $1.6 billion from $2 billion in YTD 2016.
Flat products accounted for 70 percent of India’s steel imports by volume at 1.4 million metric tons
in YTD 2017, down slightly from 72 percent in YTD 2016. Long products accounted for 14 percent,
or 278 thousand metric tons, followed by semi-finished steel at 6 percent (123 thousand metric
tons), stainless steel at 6 percent (114 thousand metric tons), and pipe and tube products at 5 percent
(102 thousand metric tons).
0
1
2
3
4
5
6
Qtr
1
Qtr
3
Qtr
1
Qtr
3
Qtr
1
Qtr
3
Qtr
1
Qtr
3
Qtr
1
Qtr
3
Qtr
1
Qtr
3
Qtr
1
Qtr
3
Qtr
1
Qtr
3
Qtr
1
Qtr
3
Qtr
1
Qtr
3
Qtr
1
Qtr
3
Qtr
1
Qtr
3
Qtr
1
2005 2006 2007 2008 2009 2010 2011 2012 2013 2014 2015 20162017
Mil
lio
ns
of M
etri
c To
ns
India's Trade in Steel Mill Products by QuarterExports Imports
Source: IHS Global Trade Atlas
0
0.5
1
1.5
2
2.5
3
YTD 2015 YTD 2016 YTD 2017
Mil
lio
ns
of M
etri
c To
ns
India's Imports of Steel Mill ProductsMillions of Metric Tons
Flat Long Pipe & Tube Semi-finished Stainless
Source: IHS Global Trade AtlasYTD through March
0
0.2
0.4
0.6
0.8
1
1.2
1.4
1.6
YTD 2015 YTD 2016 YTD 2017
Bil
lio
ns
of U
.S. D
oll
ars
India's Imports of Steel Mill ProductsBillions of U.S. Dollars
Flat Long Pipe & Tube Semi-finished Stainless
Source: IHS Global Trade AtlasYTD through March

3
Steel Imports Report: India
Imports by Top Source
The top 10 source countries for
India’s steel imports represented
90 percent of the total steel
import volume in YTD 2017 at
1.8 million metric tons (mmt).
China accounted for the largest
share of India’s imports by
source country at 27 percent
(0.54 mmt), followed by South
Korea at 24 percent (0.50 mmt),
Japan at 17 percent (0.34 mmt),
and Indonesia at 6 percent (0.12
mmt).
The United States ranked 14th
as a source for India’s steel
imports, accounting for just 18 thousand metric tons in YTD 2017, a decrease of 18 percent from 22
thousand metric tons in YTD 2016.
Trends in Imports from Top Sources
Between YTD 2016 and YTD 2017, the volume of India’s steel imports decreased from five of India’s
top 10 steel import sources. India’s imports from China showed the greatest decrease in volume,
down 63 percent by volume from YTD 2017, followed by Japan (down 40%), South Korea (down
37%), Russia (down 30%), and
Germany (down 24%). Only
India’s imports from France
showed a significant increase in
volume between YTD 2016 and
YTD 2017, an increase of 285
percent.
The overall value of India’s
imports decreased from five of
its top ten sources. As with
volume decreases, the decreases
in steel value between YTD 2016
and YTD 2017 included India’s
imports from China (down
45%), Germany (down 21%),
South Korea (down 18%), Japan
(down 10%), and Russia (down 3%). Imports from the rest of India’s top 10 steel import sources
increased in value in YTD 2017 from YTD 2016 led by Indonesia (up 91%), France (up 85%), Ukraine
(up 57%), and Singapore (up 35%).
Rest of World
10%
China
27%South Korea
24%
Japan17%
Indonesia6%
France3%
Russia3%
Taiwan3%
Ukraine3%
Singapore
2%
Germany2%
Top 10 Partners
90%
India's Steel Imports - Top 10 SourcesYTD 2017 - Millions of Metric Tons
Source: IHS Global Trade AtlasYTD through March
-100%
-50%
0%
50%
100%
150%
200%
250%
300%
350%
Percent Change in Imports from Top 10 Sources (YTD 2016 to YTD 2017)
Volume Value
Source: IHS Global Trade AtlasYTD through March

4
Steel Imports Report: India
Top Sources by Steel Product Category
India’s top import sources by volume vary across types of steel products. India imported the largest
share of its flat products from South Korea at 31 percent (445 thousand metric tons) in YTD 2017,
followed by China at 24 percent (342 thousand metric tons).
China accounted for the largest share of each of India’s imports of long products at 34 percent (93
thousand metric tons), pipe and tube products at 58 percent (59 thousand metric tons), and stainless
products at 40 percent (45 thousand metric tons). Indonesia held the largest share of India’s semi-
finished imports at 83 percent (103 thousand metric tons).
Stainless was the only product category for which the United States was a top 5 import source in YTD
2017, accounting for 4 thousand metric tons of India’s imports.
0 0.1 0.2 0.3 0.4 0.5
United States
Taiwan
Japan
South Korea
China
China
Japan
Italy
South Korea
Indonesia
Germany
Japan
Nepal
Russia
China
South Korea
Singapore
Ukraine
Japan
China
Russia
France
Japan
China
South Korea
Stai
nles
sSe
mi-
finis
hed
Pip
e an
d Tu
beLo
ng
Pro
du
cts
Flat
Pro
duc
ts
Millions of Metric Tons
India's Top 5 Import Sources by Product - YTD 2017
Source: IHS Global Trade AtlasYTD through March

5
Steel Imports Report: India
India’s Export Market Share from Top Source Countries
In 2016, the share of steel
exports sent to India from its
top import sources decreased
in seven of India’s top 10
sources. Countries with
notable decreases in their
shares of steel exports to India
in 2016 included Japan (down
2.8 percentage points from
2015), South Korea and Brazil
(each down 1.9 percentage
points), and China (down 1.2
percentage points). The share
of exports to India from
Russia, Taiwan, and Germany
each decreased by less than one percentage point. Export shares to India only increased in
Indonesia (up 1.8 percentage points), Austria (up 1.2 percentage points), and France (up 0.7
percentage points).
Among India’s top import sources, South Korea and Indonesia sent the largest shares of their total
steel exports to India in 2016, at 7.9 percent and 16.5 percent respectively. Flat products accounted
for nearly all of South Korea’s exports to India at 91 percent (2.2 million metric tons), while semi-
finished steel accounted for a significant share of Indonesia’s exports to India at 80 percent (207
thousand metric tons).
Top 10 Import
Sources
Share of
Exports to India
- 2015
India's Rank
in 2015
Share of
Exports to India
- 2016
India's Rank
in 2016
China 4.3% 5 3.1% 6
South Korea 9.8% 4 7.9% 4
Japan 6.0% 6 3.2% 10
Russia 1.2% 19 0.9% 23
Indonesia 14.7% 3 16.5% 3
Austria 1.9% 13 3.0% 7
Taiwan 1.9% 15 1.7% 14
Germany 0.9% 19 0.7% 22
Brazil 2.1% 9 0.2% 38
France 0.6% 20 1.3% 13Source: IHS Global Trade Atlas, based on export data per reporting country
India's Steel Export Market Share
0 0.5 1 1.5 2 2.5
Pipe & Tube
Stainless
Long
Flat
Semi-finished
Pipe & Tube
Stainless
Semi-finished
Long
Flat
Millions of Metric Tons
Steel Export Composition of Top Market-Share Countries - 2016
South Korea
Indonesia
Source: IHS Global Trade Atlas, based on export data per reporting country
6
Steel Imports Report: India
Overall Production and Import Penetration
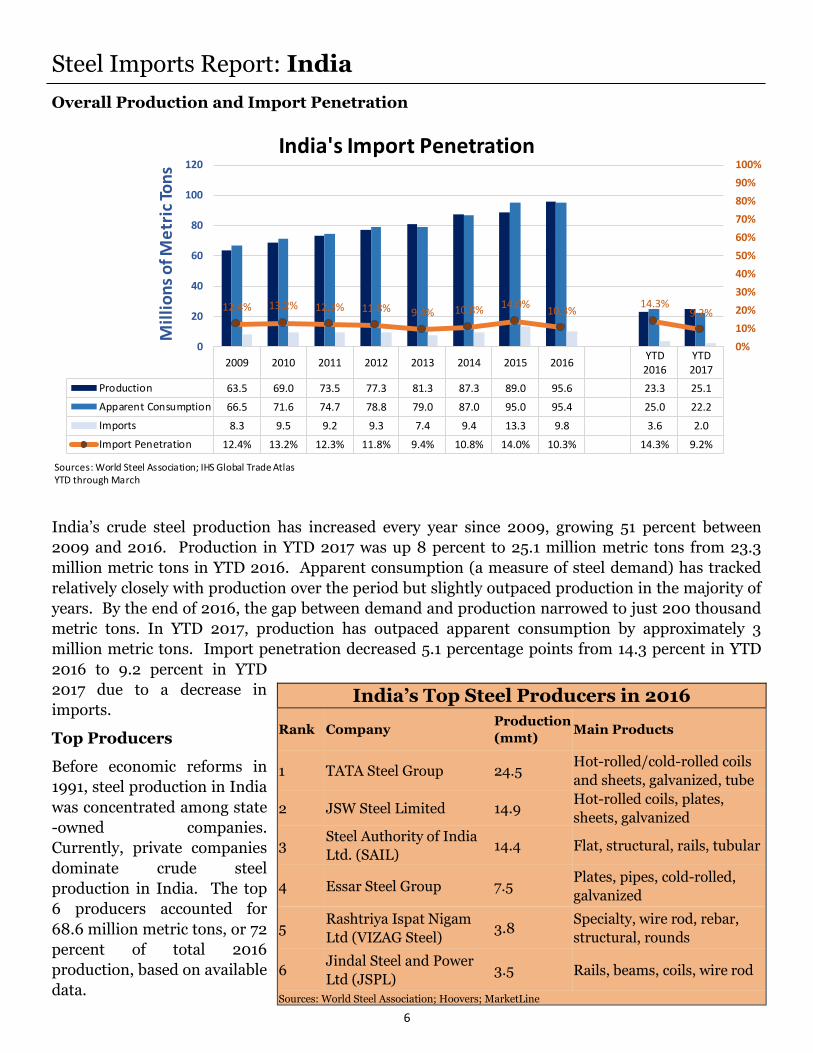
India’s crude steel production has increased every year since 2009, growing 51 percent between
2009 and 2016. Production in YTD 2017 was up 8 percent to 25.1 million metric tons from 23.3
million metric tons in YTD 2016. Apparent consumption (a measure of steel demand) has tracked
relatively closely with production over the period but slightly outpaced production in the majority of
years. By the end of 2016, the gap between demand and production narrowed to just 200 thousand
metric tons. In YTD 2017, production has outpaced apparent consumption by approximately 3
million metric tons. Import penetration decreased 5.1 percentage points from 14.3 percent in YTD
2016 to 9.2 percent in YTD
2017 due to a decrease in
imports.
Top Producers
Before economic reforms in
1991, steel production in India
was concentrated among state
-owned companies.
Currently, private companies
dominate crude steel
production in India. The top
6 producers accounted for
68.6 million metric tons, or 72
percent of total 2016
production, based on available
data.
India’s Top Steel Producers in 2016
Rank Company Production
(mmt) Main Products
1 TATA Steel Group 24.5 Hot-rolled/cold-rolled coils
and sheets, galvanized, tube
2 JSW Steel Limited 14.9 Hot-rolled coils, plates,
sheets, galvanized
3 Steel Authority of India
Ltd. (SAIL) 14.4 Flat, structural, rails, tubular
4 Essar Steel Group 7.5 Plates, pipes, cold-rolled,
galvanized
5 Rashtriya Ispat Nigam
Ltd (VIZAG Steel) 3.8
Specialty, wire rod, rebar,
structural, rounds
6 Jindal Steel and Power
Ltd (JSPL) 3.5 Rails, beams, coils, wire rod
Sources: World Steel Association; Hoovers; MarketLine
2009 2010 2011 2012 2013 2014 2015 2016YTD2016
YTD2017
Production 63.5 69.0 73.5 77.3 81.3 87.3 89.0 95.6 23.3 25.1
Apparent Consumption 66.5 71.6 74.7 78.8 79.0 87.0 95.0 95.4 25.0 22.2
Imports 8.3 9.5 9.2 9.3 7.4 9.4 13.3 9.8 3.6 2.0
Import Penetration 12.4% 13.2% 12.3% 11.8% 9.4% 10.8% 14.0% 10.3% 14.3% 9.2%
12.4% 13.2% 12.3% 11.8% 9.4% 10.8% 14.0%10.3%
14.3%9.2%
0%
10%
20%
30%
40%
50%
60%
70%
80%
90%
100%
0
20
40
60
80
100
120M
illi
on
s o
f Me
tric
To
ns
India's Import Penetration
Sources: World Steel Association; IHS Global Trade AtlasYTD through March

7
Steel Imports Report: India
Trade Remedies in the Steel Sector
Antidumping duties (AD), countervailing duties (CVD), associated suspension agreements, and
safeguards are often referred to collectively as trade remedies. These are internationally agreed upon
mechanisms to address the market-distorting effects of unfair trade, or serious injury or threat of
serious injury caused by a surge in imports. Unlike anti-dumping and countervailing measures,
safeguards do not require a finding of an “unfair” practice. Before applying these duties or measures,
countries investigate allegations and can remedy or provide relief for the injury caused to a domestic
industry. The tables below provides statistics on the current number of trade remedies India has
against imports of steel mill products from various countries.
India’s Trade Remedies in Effect Against Steel Mill Imports
Country AD CVD Suspension Agreements
and Undertakings Total
Brazil 1 1
China 3 3
European Union 2 2
Indonesia 1 1
Japan 1 1
Malaysia 1 1
Russia 1 1
South Africa 1 1
South Korea 4 4
Taiwan 1 1
Thailand 1 1
United States 2 2
TOTAL 19 0 0 19 Source: World Trade Organization, through June 1, 2017
Steel Mill Safeguards in Effect
Country Product
India Hot-rolled steel in coils
India Hot-rolled steel flat sheets and plates Source: World Trade Organization, through May 22, 2017

8
Steel Imports Report: Glossary
Apparent Consumption: Domestic crude steel production plus steel imports minus steel exports. Shipment data are not
available for all countries, therefore crude steel production is used as a proxy.
Export Market: Destination of a country’s exports.
Flat Products: Produced by rolling semi-finished steel through varying sets of rolls. Includes sheets, strips, and plates. Used
most often in the automotive, tubing, appliance, and machinery manufacturing sectors.
Import Penetration: Ratio of imports to apparent consumption.
Import Source: Source of a country’s imports.
Long Products: Steel products that fall outside the flat products category. Includes bars, rails, rods, and beams. Used in
many sectors but most commonly in construction.
Pipe and Tube Products: Either seamless or welded pipe and tube products. Used in many sectors but most commonly in
construction and energy sectors.
Semi-finished Products: The initial, intermediate solid forms of molten steel, to be re-heated and further forged, rolled,
shaped, or otherwise worked into finished steel products. Includes blooms, billets, slabs, ingots, and steel for castings.
Stainless Products: Steel products containing at minimum 10.5% chromium (Cr) offering better corrosion resistance than
regular steel.
Steel Mill Products: Carbon, alloy, or stainless steel produced by either a basic oxygen furnace or an electric arc furnace.
Includes semi-finished steel products and finished steel products. For trade data purposes, steel mill products are defined at
the Harmonized System (HS) 6-digit level as: 720610 through 721650, 721699 through 730110, 730210, 730240 through
730290, and 730410 through 730690. The following discontinued HS codes have been included for purposes of reporting
historical data (prior to 2007): 722520, 722693, 722694, 722910, 730410, 730421, 730610, 730620, and 730660.
Global Steel Trade Monitor: The monitor provides global import and export trends for the top countries trading in steel
products. The current reports expand upon the early release information already provided by the Steel Import Monitoring and
Analysis (SIMA) system that collects and publishes data on U.S. imports of steel mill products. Complementing the SIMA data,
these reports provide objective and current global steel industry information about the top countries that play an essential role
in the global steel trade. Information in these reports includes global exports and import trends, production and consumption
data and, where available, information regarding trade remedy actions taken on steel products. The reports will be updated
quarterly.
Steel Import Monitoring and Analysis (SIMA) System: The Department of Commerce uses a steel import licensing
program to collect and publish aggregate data on near real-time steel mill imports into the United States. SIMA incorporates
information collected from steel license applications with publicly released data from the U.S. Census Bureau. By design, this
information provides stakeholders with valuable information on the steel trade with the United States. For more information
about SIMA, please go to http://enforcement.trade.gov/steel/license/.