Steel Castings Case Study - How to leverage China Sourcing to manage global sourcing risks?
24
How to leverage China Sourcing to manage global sourcing risks - steel castings case study - Your Tailored Sourcing Approach to China
-
Upload
john-william -
Category
Services
-
view
105 -
download
1
Transcript of Steel Castings Case Study - How to leverage China Sourcing to manage global sourcing risks?

How to leverage China Sourcing to manage global sourcing risks
- steel castings case study -
Your Tailored Sourcing Approach to China
© 2005 Dragon Sourcing. All rights reserved.2
Agenda
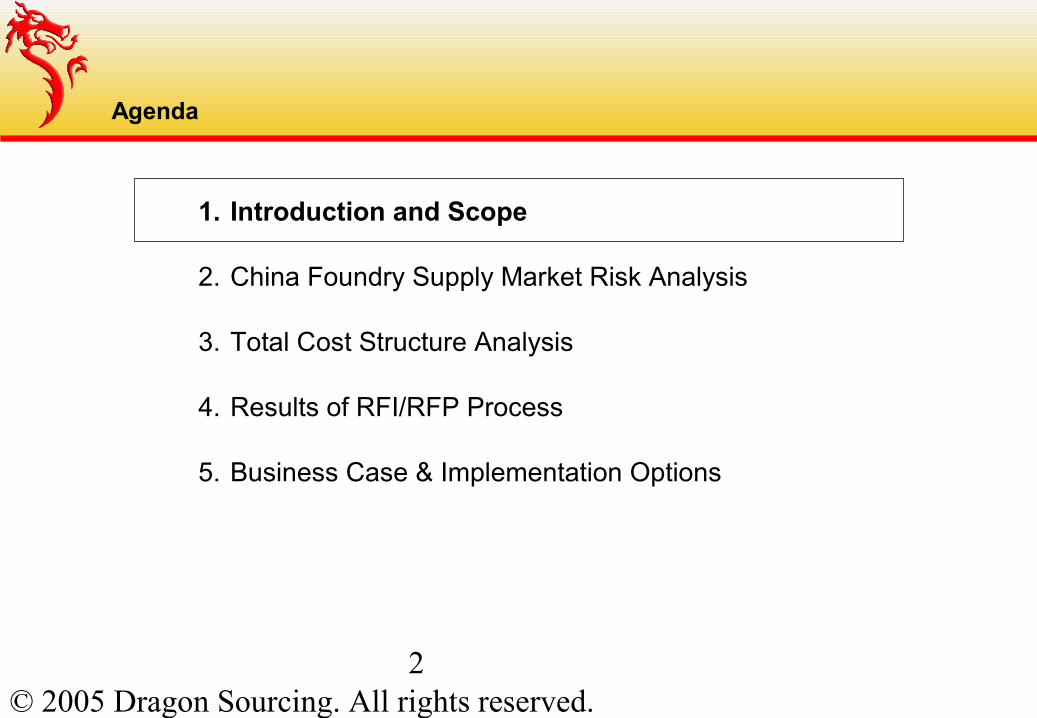
1. Introduction and Scope
2. China Foundry Supply Market Risk Analysis
3. Total Cost Structure Analysis
4. Results of RFI/RFP Process
5. Business Case & Implementation Options

© 2005 Dragon Sourcing. All rights reserved.3
The client is a leading mining equipment manufacturer
• More than $2,7B in Turnover, 9000 employees and 35 manufacturing locations
• Truly global organisation with sales evenly spread out across Europe, Nth America, Sth America and Asia
• Leading supplier of:– Grinding mills– Crushers– Metal crushers– Screens
• Global sourcing organisation with global category managers with significant LCC experience in Latin America, East Europe and Asia

© 2005 Dragon Sourcing. All rights reserved.4
Examples of products made by the client

© 2005 Dragon Sourcing. All rights reserved.5
We assessed the opportunity of sourcing an increased part of Steel Castings in China over an aggressive 4 weeks timeline
Spend and Total Cost Structure Analysis
Implementation Options
China Supply Market RISK Analysis & RFQ
Business Case & Implementation
plan

© 2005 Dragon Sourcing. All rights reserved.6
With €31.5m of spend, Steel Castings represent 68% of the total Castings category
Castings88%
Forgings12%
Spend in 2004
Total = € 52 m
6 181 07514%
7 740 72817%
352 0671%
31 471 47968%
Steel casting Cast Iron Bronze Aluminium

© 2005 Dragon Sourcing. All rights reserved.7
HCC1 15%
HCC2 5%
Others 6%
LCC 29%
LCC 1 54%
CHINA 8%
HCC3 3%
In addition to achieving cost reductions, the main motivations for increasing sourcing from China is to reduce the risks associated with the current sourcing footprint heavily biased towards 1 LCC country (more than 50% of the spend)
• High dependence on 1 LCC with various risks associated:
– Country risk associated with LCC1:
• Political• Inflation
– Currency risk• Recent re-evaluation of the
currency vis-à-vis $ and €– Capacity risk
• Growth in domestic demand
• Limited investment in new capacity
Geographical breakdown of Steel Castings spend

© 2005 Dragon Sourcing. All rights reserved.8
Agenda
1. Introduction and Scope
2. China Foundry Supply Market Risk Analysis
3. Total Cost Structure Analysis
4. Results of RFI/RFP Process
5. Business Case & Implementation Options

© 2005 Dragon Sourcing. All rights reserved.9
China is by far the No1 producer of iron and steel castings in the world, and still growing by more than 12% per annum
• With more than 20,000 foundries and over 15,000 KT of production.
• Its production volume is 50% higher than that of the US.
• This industry has been growing at a pace of 12.5% per year since 2000 driven by the growth in China’s automotive and building construction industries
Iron & Steel Foundry production in 2002
0
4000
8000
12000
16000
China
USA
Japo
n
Ger
man
yIn
dia
Franc
eBra
zil
Korea Ita
ly
Mex
icoKt
Source: Foundrynations.com China Foundry Association
Foundry production in China 2000 - 2003 ( including aluminium casts)
0
5000
10000
15000
20000
2000 2001 2002 2003Kt
Key Facts
© 2005 Dragon Sourcing. All rights reserved.10
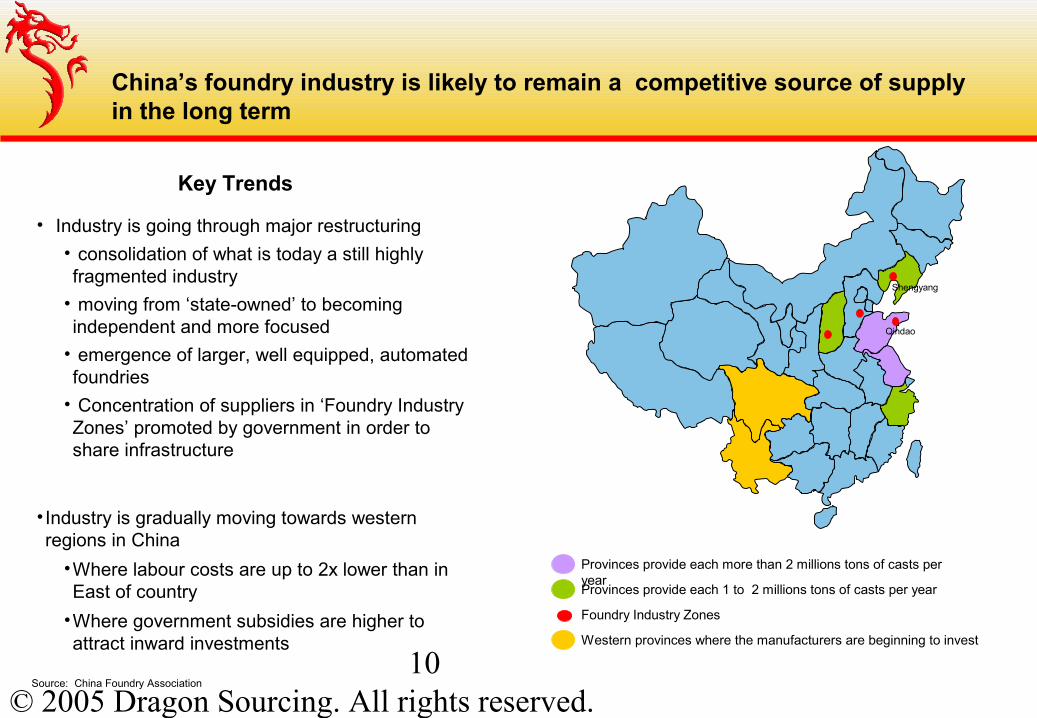
China’s foundry industry is likely to remain a competitive source of supply in the long term
Provinces provide each more than 2 millions tons of casts per year Provinces provide each 1 to 2 millions tons of casts per year
Foundry Industry Zones
Western provinces where the manufacturers are beginning to invest
Source: China Foundry Association
Shengyang
Qindao
• Industry is going through major restructuring
• consolidation of what is today a still highly fragmented industry
• moving from ‘state-owned’ to becoming independent and more focused
• emergence of larger, well equipped, automated foundries
• Concentration of suppliers in ‘Foundry Industry Zones’ promoted by government in order to share infrastructure
• Industry is gradually moving towards western regions in China
•Where labour costs are up to 2x lower than in East of country
•Where government subsidies are higher to attract inward investments
Key Trends

© 2005 Dragon Sourcing. All rights reserved.11
Similarly, expectations are that electricity costs will remain a competitive advantage for the Chinese industry
• China has been plagued over the last few years with shortages in electricity supply, approximately 25 million kW shortage expected in 2005
• The China's electricity shortage problem should gradually resolve itself as a result of the significant investments programme committed to by the chinese government– 55 million kW of power generators were put into production in 2004, more are under
construction– since January 2005, the seriousness of electric power shortage has been reduced: the areas
with insufficient electricity have narrowed and large-area electricity shortage have been replaced by seasonal and periodic shortages
• Under control of the State Electricity Regulatory Commission (SERC), State Power assets are being restructured to:– break monopoly situations and create a competitive electricity generation system– reduce costs and improve price mechanism
• One of the first measure has been the launch in China, end of April 2005, of a new pricing mechanism which links the price of electricity for industrial use with that fuel and coal indices
(1) Source: www.iea.org/texbase/work/2004/brazil/mi_jianhua.pdf

© 2005 Dragon Sourcing. All rights reserved.12
The Chinese Labor advantage is likely to remain at current levels for the forceable future
• Current average labor costs are still between 2.5 and 3x lower in China than they are in LCC1
• And this, despite a narrowing of the gap since end of the 90’s mainly due to devaluation of the currency in the LCC1
• However, this tendency has reversed since 2004
• Furthermore, China has a massive reservoir to keep a lid on labor rate inflation
CommentsComments
2.67 €/h2.67 €/h
27.17 €/h27.17 €/h
1.15 €/h1.15 €/h
2.67 €/h2.67 €/h
Wages index (1999 - 2003)and 2005 extrapolated for LCC1
LCC1 ( USD ) 114
LCC1 ( USD ) 79
LCC1 Local currency154
European Country ( USD) 126
China (RMB) 168
60
100
140
180
1 999 2 000 2 001 2 002 2 003 2005(extrapol.)
LCC1 ( USD ) LCC1 (Local currency) European country( USD) China (RMB)
© 2005 Dragon Sourcing. All rights reserved.13
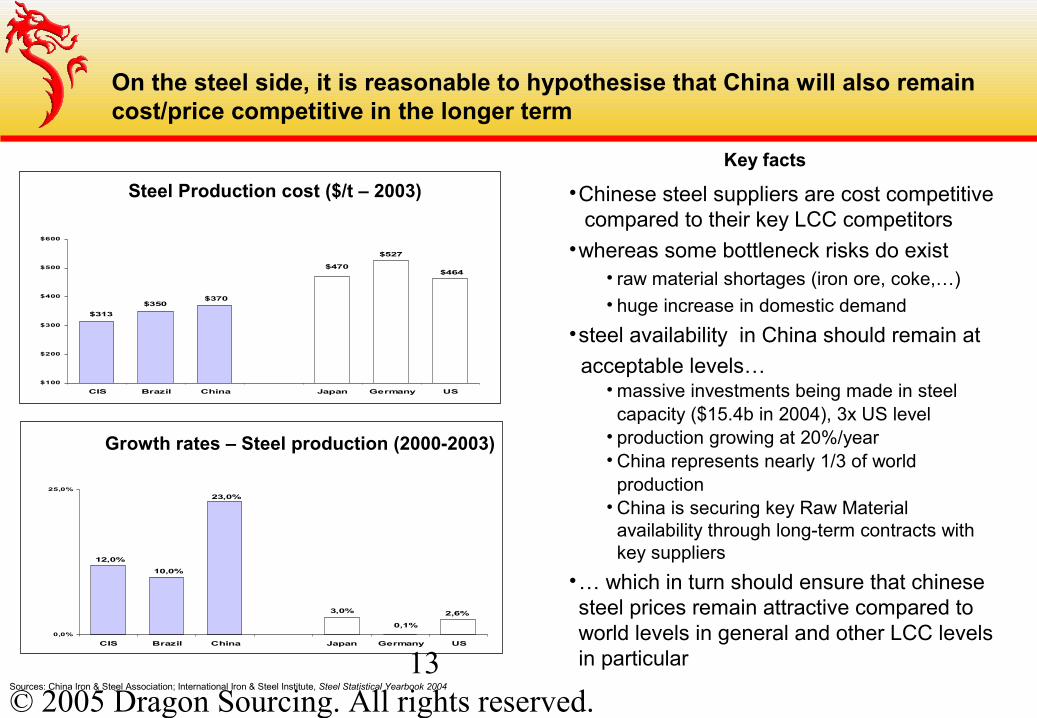
On the steel side, it is reasonable to hypothesise that China will also remain cost/price competitive in the longer term
$464
$527
$350
$470
$370
$313
$100
$200
$300
$400
$500
$600
CIS Brazil China Japan Germany US
Sources: China Iron & Steel Association; International Iron & Steel Institute, Steel Statistical Yearbook 2004
Steel Production cost ($/t – 2003)
2,6%
0,1%
10,0%
3,0%
23,0%
12,0%
0,0%
25,0%
CIS Brazil China Japan Germany US
Growth rates – Steel production (2000-2003)
Key facts
•Chinese steel suppliers are cost competitive compared to their key LCC competitors
•whereas some bottleneck risks do exist• raw material shortages (iron ore, coke,…)• huge increase in domestic demand
•steel availability in China should remain at
acceptable levels…• massive investments being made in steel capacity ($15.4b in 2004), 3x US level• production growing at 20%/year• China represents nearly 1/3 of world production• China is securing key Raw Material
availability through long-term contracts with key suppliers
•… which in turn should ensure that chinese steel prices remain attractive compared to world levels in general and other LCC levels in particular

© 2005 Dragon Sourcing. All rights reserved.14
The highest competitive risk is probably linked to the expected re-evaluation of the Chinese RMB, which will be mitigated by increases in productivity
• Significant pressure is being exerted by the US and Europe on China to let the RMB freely float– US Trade deficit is reaching 6% of GNP– 25% of that imbalance is driven by China-US trade relations
• The markets believe in the eventual re-evaluation of the RMB, demonstrated by $billion inflows into the RMB and HK$; expectations are for a re-evaluation of the RMB of 10 to 20%
• China recently introduced a narrow range of fluctuation and since then $ has dropped 6-7% against the RMB
• Some factors however counter the speed and impact of potential policy change– refusal by chinese government to be seen to react under foreign pressure– unwillingness of chinese governement to see massive devaluation in its $900B+ currency reserves– strong pressure from chinese industry not to re-evalue
• General consensus however believes that it’s only a matter of time before China becomes more flexible on this issue
• However, the huge productivity improvement reservoir that exists in China will allow Chinese industrialists to absorb gradual increases in the currency by gradullay improving productivity in their factories

© 2005 Dragon Sourcing. All rights reserved.15
Agenda
• Introduction and Scope
• China Foundry supply market risk analysis
• Total Cost Structure Analysis
• Results of RFI/RFP process
• Business Case & Implementation Options

© 2005 Dragon Sourcing. All rights reserved.160.06
0.42 0.34
0.05
0.17 0.09
0.28
0.16
0.21
0.21
0.09 0.07
0.76
0,07
The resulting cost structure indicates a 20 to 30% cost advantage for China over LCC1…
Labor
Energy
Raw materials
Molding
Machine depreciation
Overheads
Testing
Supplier margin
* For steel G-20Mn5 (N)
0.05
0.420.21
0.04
0.17
0.09
0.28
0.15
0.21
0.21
0.09
0.05
0.76
0,03
Ex works HCC1Reference PriceIndex 100 €/kg
Ex works HCC1Reference PriceIndex 100 €/kg
Ex Work HCC1Reference PriceIndex 100 €/kg
Ex Work HCC1Reference PriceIndex 100 €/kg
Ex Work LCC1"Should cost“ in LCC1
Index 0.67 €/kg
Ex Work LCC1"Should cost“ in LCC1
Index 0.67 €/kg Ex Work China"Should cost“ in China*
0.53 €/kg
Ex Work China"Should cost“ in China*
0.53 €/kg

© 2005 Dragon Sourcing. All rights reserved.17
When adding logistics costs and duties, China remains a highly competitive source in absolute terms and in relative terms compared to LCC1
1.301.50
0.20
Ex Works Logistics &duties
DDP
1.031.19
0.16
Ex Works Logistics &duties
DDP
Factory 1From LCC1l From China
-21%-21%
1.301.48
0.18
Ex Works Logistics &duties
DDP
1.031.18
0.15
Ex Works Logistics &duties
DDP
Factory 2From 1 From China
-20%-20%
Factory 1 Factory 2 Factory 3€ / kg
EXW price
FOB priceOcean freight (no insurance needed) 0.069 0.083 0.097.. Freight (BAF & CAF excluded) 20' 0.047 0.069 0.085.. BAF & CAF 0.012 0.013 0.012.. Open top add. Charges 0.010 0.000 0.000
Import customs & duties 0 0 0.308Terminal charges 0.008 0.006 0.002Import handling & Adm/BL fee 0.001 0.001 0.003Inland transport (no insurance) 0.032 0.013 0.008
DDP price FOB + 0.12 FOB + 0.11 FOB + 0.41
DDP price EXW + 0.16 EXW + 0.15 EXW + 0.46
0.16 0.15 0.46
0.20 0.18 n/aLogistics and duties from LCC1(€/kg)
to be compared with
EXW
FROM CHINA TO
EXW + 0.045
Logistics and duties from China (€/kg)

© 2005 Dragon Sourcing. All rights reserved.18
Agenda
• Introduction and Scope
• China Foundry supply market risk analysis
• Total Cost Structure Analysis
• Results of RFI/RFP process
• Business Case & Implementation Options

© 2005 Dragon Sourcing. All rights reserved.19
The RFI/RFP process resulted in three supplier responses, a « decent » return considering the aggressive timeline
17 suppliers
3 suppliers
80+ suppliers
Pre-selectedsuppliers
Responses to RFQreceived
Criteria•Steel castings•Parts with a unit weight >2T
•Export experience•Quality certification
Suppliers' reason forNon response
•Already suppliers (6)•Already at full capacity (2)•Too stringent requirements (2)•Out of range of weight (2)•No reason provided (2)
Long list of suppliers
Research to identify potential suppliers for
large castings
Supplierpre-selection
RFQ issuing & follow-up of suppliers intent
to respondResponse analysis

© 2005 Dragon Sourcing. All rights reserved.20
The quotations (before any kind of negotiations) were pretty much in line with the output of the « should-cost » model
1.17 1.17
1.41
1.47
0.83 0.83 0.83
"Should cost"1.00
"Should cost"1.00
"Should cost"1.03
1.13
"Should cost"1.08
0.60
0.80
1.00
1.20
1.40
1.60
.25/.35C -GR 90 60 Steel 320-560-M steel G-20Mn5 (N) Steel 12 MDV6
Pri
ce in
€/k
g

© 2005 Dragon Sourcing. All rights reserved.21
Agenda
• Introduction and Scope
• China Foundry supply market risk analysis
• Total Cost Structure Analysis
• Results of RFI/RFP process
• Business Case & Implementation Options
© 2005 Dragon Sourcing. All rights reserved.22
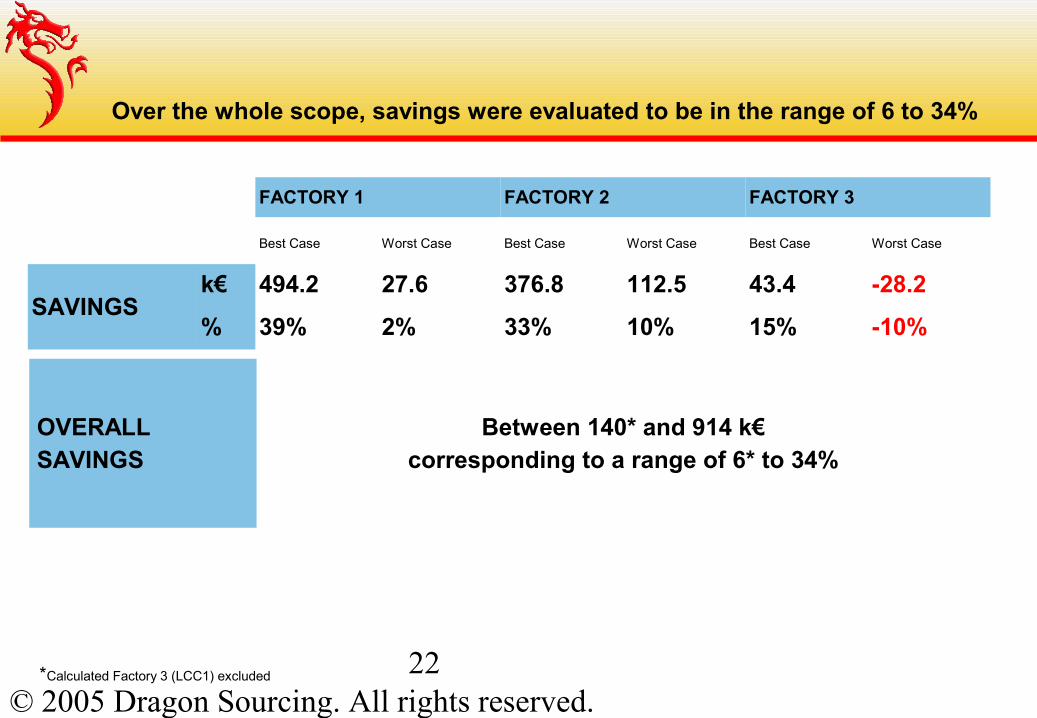
Over the whole scope, savings were evaluated to be in the range of 6 to 34%
FACTORY 1 FACTORY 2 FACTORY 3
Best Case Worst Case Best Case Worst Case Best Case Worst Case
SAVINGSk€ 494.2 27.6 376.8 112.5 43.4 -28.2
% 39% 2% 33% 10% 15% -10%
OVERALLSAVINGS
Between 140* and 914 k€corresponding to a range of 6* to 34%
*Calculated Factory 3 (LCC1) excluded

© 2005 Dragon Sourcing. All rights reserved.23
Options Pro’s Con’s Comments
Direct from Westwith support from local buyers in China
• Low cost• Full control
• No dedicated Export buyers
• competency level of local buyers
• mixed mission of local buyers
• Most companies have come back from this model (e.g.: Caterpillar, PSA, Valéo,…)
Opening IPO (Purchasing office)
• Full Control• cost effective longer
term
• High upfront cost solution
• slow to implement
• Typically $15m-$20m of exported spend needed to justify IPO Investment
Using Procurement service provider
• Speed of implementation
• low risk to start• limited upfront
investment
• Higher cost longer term• Lower control
• Possiblity to start with PSP then move to IPO when results are proven and scale is reached in export spend
Several options were assessed by the client for implementing the business case: from full outsourcing to setting up their own IPO
After 1 year of implementation, savings achieved have been over 25%

© 2005 Dragon Sourcing. All rights reserved.24
After 1 year of implementation, results achieved have been significant
• Over 25% savings on the Steel castings spend transferred to China
• A model being replicated on other major categories (e.g.: Forgings)
• A structural rebalancing of the the global sourcing strategy from LCC country 1 to China allowing to:– Reduce country related risks– Reduce currency related risks– Reduce Supply/Availability related risks