STEC in Michigan- from shedding in cattle to human disease
21
STEC in Michigan- from shedding in cattle to human disease Shannon Manning www.uni-heidelberg.de/zentral/ztl/ grafiken_bilder/bilder/e-coli.jpg
Transcript of STEC in Michigan- from shedding in cattle to human disease

STEC in Michigan- from shedding in cattle to human disease
Shannon Manning www.uni-heidelberg.de/zentral/ztl/grafiken_bilder/bilder/e-coli.jpg

Project goal: To identify factors important for STEC shedding
STEC ecology in Michigan
Collect samples in MI
Identify intestinal microbes that support or prevent
colonization
Disease prevention strategies in cattle
Examine associations with certain
immune cells and diseases
K. Murphy
Identify genotypic and phenotypic characteristics that facilitate colonization Characterize
STEC from wildlife reservoirs
2011-67005-30004

• 11 farms (May-Oct, 2011, 2012) • Pen floors, manure
storage, water
• 1,195 animals were sampled • RAJ swabs, fecal
grabs, blood
• 153 animals were followed (~2 weeks, 3 times) • Fecal grabs, rumen,
tonsil swabs
Blood sample
RAJ swab
Environmental sampling
Fecal grab sample
Rumen fluid
Tonsil swab

Serotyping stx, eae profiling
Immunomagnetic separation (IMS) for O157
STEC CHROMagar™ SMAC
STEC CHROMagar™
E. coli broth,
GN broth
Genotyping and phenotypic assays
Pick up to 20 colonies/plate
qPCR for stx
Community DNA isolation and sequencing
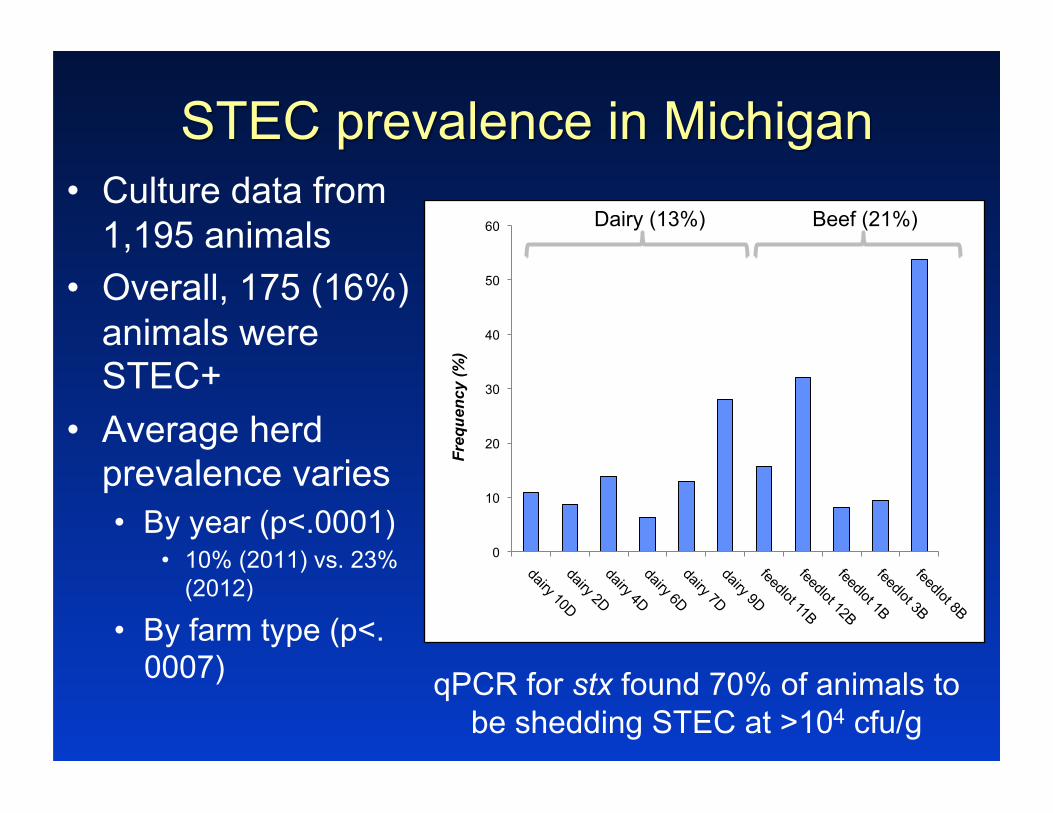
• Culture data from 1,195 animals
• Overall, 175 (16%) animals were STEC+
• Average herd prevalence varies • By year (p<.0001)
• 10% (2011) vs. 23% (2012)
• By farm type (p<.0007)
Dairy (13%) Beef (21%)
0
10
20
30
40
50
60
Freq
uenc
y (%
)
qPCR for stx found 70% of animals to be shedding STEC at >104 cfu/g

• Non-O157 STEC predominated in Michigan cattle – 65 (75%) isolates were non-typeable
• O157 STEC was found in only 22 (26%) animals
n = 86 animals from 5 herds Lindsey Ouellette
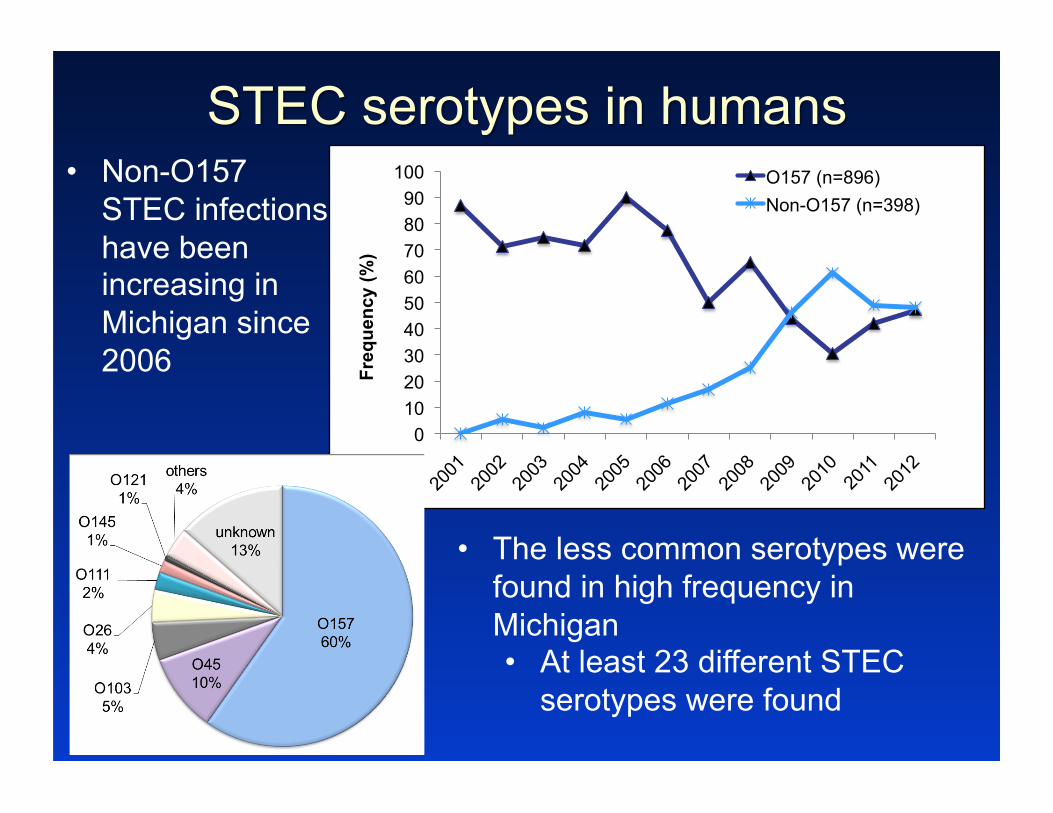
• Non-O157 STEC infections have been increasing in Michigan since 2006
• The less common serotypes were found in high frequency in Michigan • At least 23 different STEC
serotypes were found
0 10 20 30 40 50 60 70 80 90
100
Freq
uenc
y (%
)
O157 (n=896) Non-O157 (n=398)

stx/eae profiling • 3 to 8 profiles per herd • 1 to 4 profiles per
animal – 16% of animals had >1
STEC profile • 12 animals at 4 visits
– 4 unique profiles
Are we underestimating the diversity?
Animal O stx1 stx2c eae
724 NT - - +
725 NT - - +
728 NT - + -
737 NT - - +
740 NT - + -
752 NT - + -
758 NT - - +
760 NT - + -
761 NT - + -
764 NT - + -
768 NT - + -
776 O103 + - +
776 O26 + - + Same animal Chris Elkins, Dave Lacher,
Scott Jackson

• Non-O157 STEC population is extremely diverse – 8 profiles detected in
the same 12 animals
Animal O H stx1 stx2c eae eae allele
724 145 28 - - + g1
725 NT 10 - - + i1
728 168 8 - + -
737 115 25 - - + g2
740 6 34 - + -
752 6 34 - + -
758 178 11 - - + b1
760 168 8 - + -
761 6 34 - + -
764 6 34 - + -
768 6 34 - + -
776 O103 2 + - + e1
776 O26 11 + - + b1
How many animals persistently shed the same STEC strain
over time?
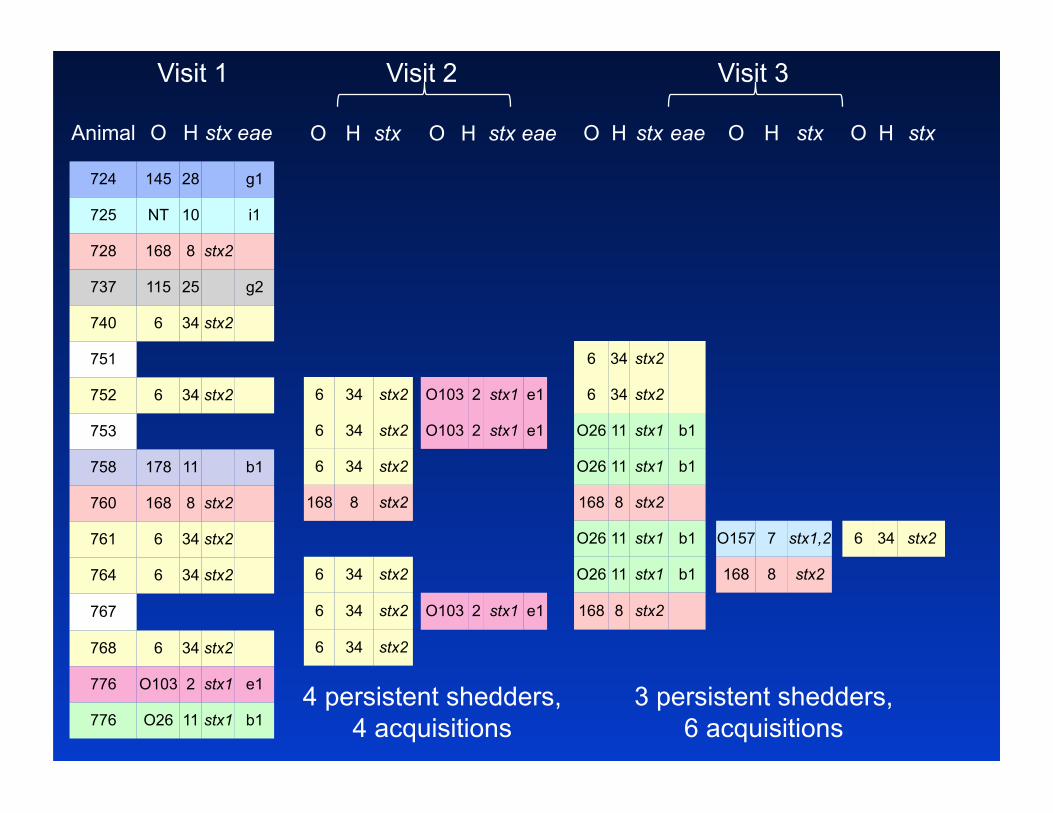
O H stx eae O H stx O H stx
6 34 stx2
6 34 stx2
O26 11 stx1 b1
O26 11 stx1 b1
168 8 stx2
O26 11 stx1 b1 O157 7 stx1,2 6 34 stx2
O26 11 stx1 b1 168 8 stx2
168 8 stx2
Visit 1 Visit 2 Visit 3
6 34 stx2 O103 2 stx1 e1
6 34 stx2 O103 2 stx1 e1
6 34 stx2
168 8 stx2
6 34 stx2
6 34 stx2 O103 2 stx1 e1
6 34 stx2
Animal O H stx eae
724 145 28 g1
725 NT 10 i1
728 168 8 stx2
737 115 25 g2
740 6 34 stx2
751
752 6 34 stx2
753
758 178 11 b1
760 168 8 stx2
761 6 34 stx2
764 6 34 stx2
767
768 6 34 stx2
776 O103 2 stx1 e1
776 O26 11 stx1 b1
O H stx O H stx eae
4 persistent shedders, 4 acquisitions
3 persistent shedders, 6 acquisitions

Is persistence within a herd attributable to specific STEC
characteristics (e.g., biofilms)?
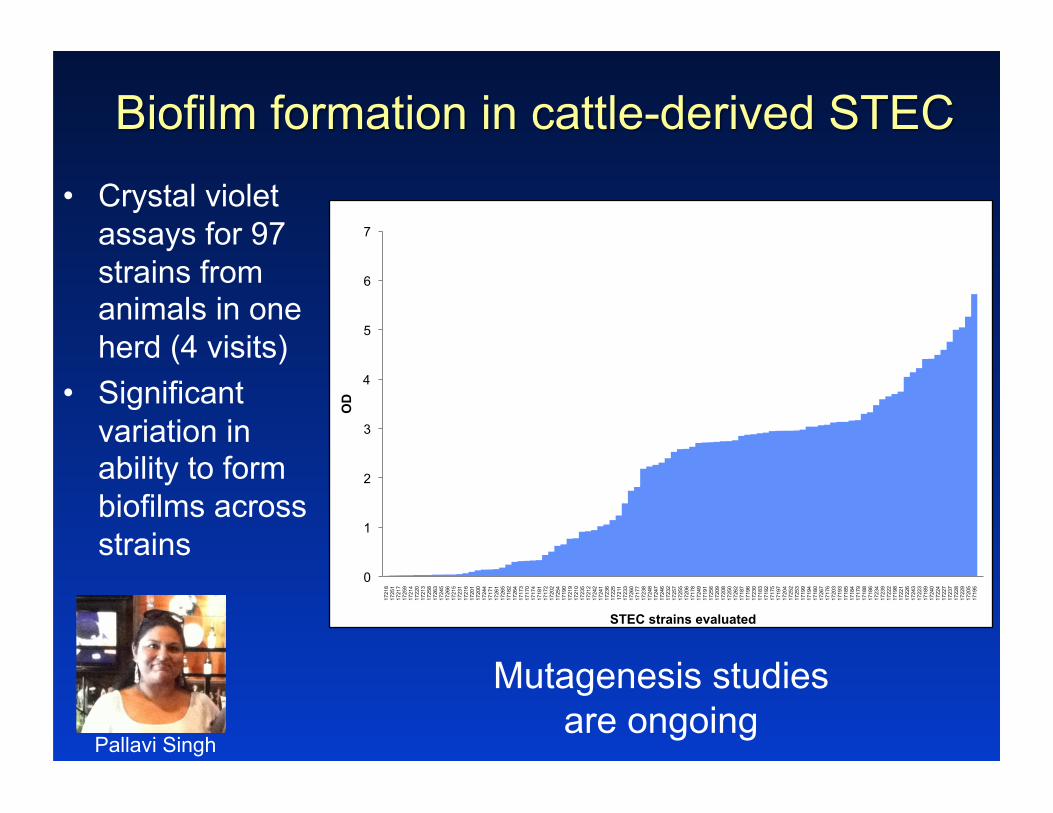
• Crystal violet assays for 97 strains from animals in one herd (4 visits)
• Significant variation in ability to form biofilms across strains
0
1
2
3
4
5
6
7
1721
8 17
251
1721
7 17
259
1721
4 17
220
1721
3 17
258
1726
3 17
245
1726
6 17
215
1723
1 17
216
1720
1 17
200
1724
4 17
171
1726
1 17
265
1718
2 17
264
1717
3 17
170
1717
4 17
181
1717
2 17
202
1725
4 17
190
1721
9 17
210
1723
5 17
212
1724
2 17
241
1723
6 17
225
1721
1 17
233
1726
0 17
177
1723
8 17
248
1724
7 17
246
1723
2 17
257
1725
5 17
206
1717
8 17
249
1719
1 17
256
1720
9 17
208
1725
0 17
262
1718
7 17
196
1723
0 17
183
1719
2 17
175
1719
7 17
204
1725
2 17
253
1719
9 17
194
1718
0 17
267
1717
6 17
203
1719
3 17
185
1718
4 17
179
1718
8 17
186
1723
4 17
239
1722
2 17
198
1722
1 17
226
1724
3 17
223
1718
9 17
240
1722
4 17
227
1723
7 17
228
1722
9 17
205
1719
5
OD
STEC strains evaluated
Mutagenesis studies are ongoing
Pallavi Singh

O H stx eae O H stx O H stx
6 34 stx2
6 34 stx2
O26 11 stx1 b1
O26 11 stx1 b1
168 8 stx2
O26 11 stx1 b1 O157 7 stx1,2 6 34 stx2
O26 11 stx1 b1 168 8 stx2
168 8 stx2
Visit 1 Visit 2 Visit 3
6 34 stx2 O103 2 stx1 e1
6 34 stx2 O103 2 stx1 e1
6 34 stx2
168 8 stx2
6 34 stx2
6 34 stx2 O103 2 stx1 e1
6 34 stx2
Animal O H stx eae
724 145 28 g1
725 NT 10 i1
728 168 8 stx2
737 115 25 g2
740 6 34 stx2
751
752 6 34 stx2
753
758 178 11 b1
760 168 8 stx2
761 6 34 stx2
764 6 34 stx2
767
768 6 34 stx2
776 O103 2 stx1 e1
776 O26 11 stx1 b1
O H stx O H stx eae
O6 and O103 STEC formed the strongest
biofilms in vitro
Is high STEC diversity in a herd mostly due to STEC transmission
or Stx-phage transmission?
Yi-AnYang

• Stx-phage typing PCR-based RFLP assay – Targets a 10-17 kb
variable regions in the Stx1-, Stx2- and Stx2c-phage genomes
– Evaluated 86 STEC from animals across 4 herds
• 17 Phage types identified overall – 11 Stx1, 3 Stx2, 3
Stx2c
Stx1 phage types (PT)
Stx2a phage types
Stx2c phage types
PT1 PT9 PT14 PT7 PT3 PT11
PT4 Spinach PT12 PT13
PT10 Sakai PT15 PT16
PT6 PT6 PT5 Sakai PT17 PT2 PT8

• Distinct phage types in circulation among STEC in each herd – One PT was
found in two herds
– Deer sharing pasture with cattle in herd 9 shared a PT

Visit I No. Stx1 Stx2c O:H 4
5 PT4 NT
6
10
11 PT4 O6:H34
12
13 PT4 O6:H34
15
16 PT4 O6:H34 PT4 NT
18
20
22 PT3 - O26
Visit II Stx1 Stx2c O:H
PT2 - O103:H2 PT2 PT4 NT PT2 PT4 O103 PT2 - O103:H2
- PT4 NT PT2 PT4 NT
- PT4 NT
PT2 - O103:H2 - PT4 O6:H34 - PT4 O6:H34
Visit III Stx1 Stx2c O:H
- PT4 O6:H34
PT3 - O26
PT3 - O26 PT3 - O26 PT3 PT4 O157:H7
PT3 - O26 - PT4 O6:H34
PT3 - O26
PT3 - O26 PT3 -‐ O26 PT3 - O26
- PT4 NT
Visit IV Stx1 Stx2c O:H PT3 - O26
- PT4 NT
- PT4 NT
- PT4 NT
- PT4 NT
PT3 - O26 - PT4 NT

Summary • Non-O157 STEC predominated in Michigan cattle in
2011-2012 – Beef farms had higher overall prevalence – Non-O157 STEC have also increased in human infections
• STEC acquisition occurs frequently over time – Specific STEC types are more likely to persist within
herds • Certain bacterial characteristics may promote persistence
• The STEC population is more diverse than the Stx-phage population per herd – Stx-phage transmission is important for the emergence of
novel STEC strains (e.g., O104:H4, O157:H7)
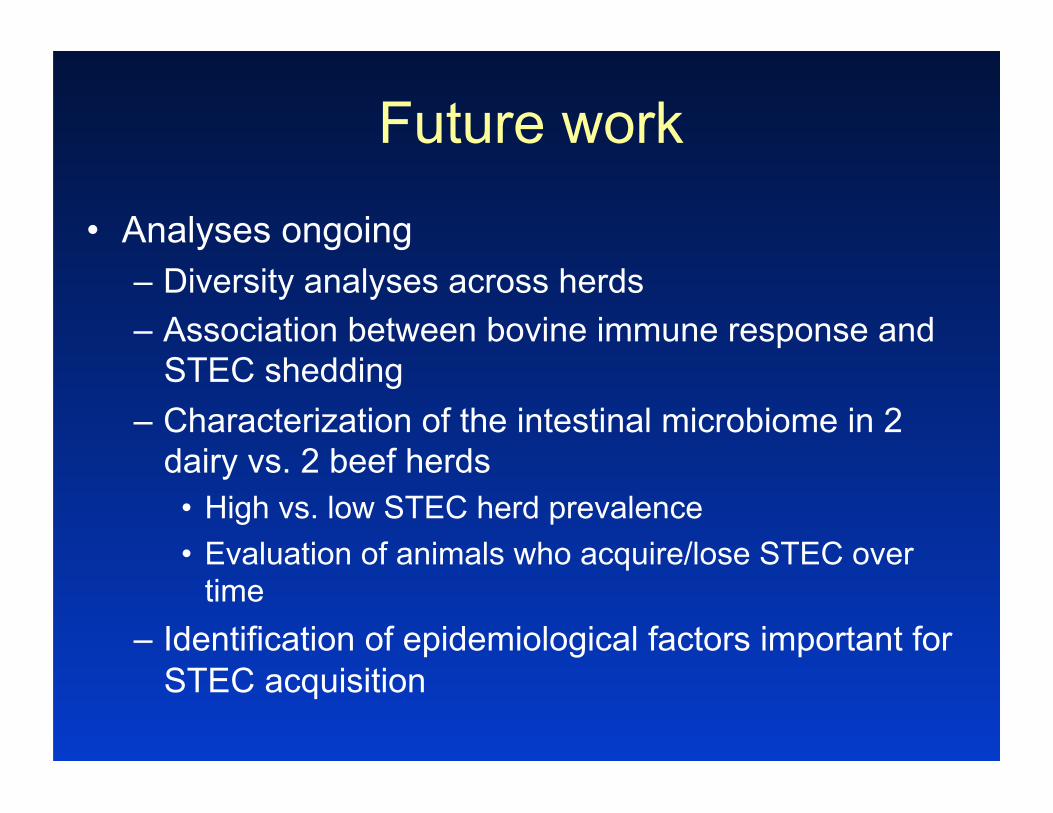
Future work
• Analyses ongoing – Diversity analyses across herds – Association between bovine immune response and
STEC shedding – Characterization of the intestinal microbiome in 2
dairy vs. 2 beef herds • High vs. low STEC herd prevalence • Evaluation of animals who acquire/lose STEC over
time – Identification of epidemiological factors important for
STEC acquisition
Funding:
2011-67005-30004
Acknowledgements
Lindsey Ouellette Pallavi Singh Katherine Jernigan Rebekah Mosci Samantha Wengert Akanksha Khare Scott Henderson J.D. Lehnert Davis Thomas Aaron Balogh Marion Tseng
Dan Grooms
Steven Rust Paul Bartlett
Cristina Venegas Paul Coussens
Yi-An Yang Bo Norby Julie Funk Robert Britton Linda Mansfield
Chris Elkins, Dave Lacher, Scott Jackson Jim Rudrik, Jim Collins

• All 3 eae+, stx- were lost; no phage acquisition • 9 of the 15 (60%) animals acquired at least 1 new
STEC 4-8 weeks later – 5 (33%) animals acquired >1 STEC strain type
• 4 of the 8 STEC profiles were maintained among the 15 animals up to 8 weeks – Are certain strains more likely to persist within a herd?
• 1 novel STEC type (O157) emerged in the animals over time – What factors drive the emergence of new strain types?

![[The kitchen sink]: Detecting and monitoring antibiotic ... · Reducing foodborne pathogens in the food chain (1) • Preharvest control of STEC (E. coli O157:H7) in cattle –Develop](https://static.fdocuments.in/doc/165x107/5f04a2247e708231d40ef085/the-kitchen-sink-detecting-and-monitoring-antibiotic-reducing-foodborne-pathogens.jpg)