STD/PASS/TAGS – Trade and Globalisation Statistics Linkages of trade and structural business...
21
STD/PASS/TAGS – Trade and Globalisation Statisti STD/PASS/TAGS – Trade and Globalisation Statisti Linkages of trade Linkages of trade and structural and structural business statistics business statistics OECD progress report Agenda Agenda Item 8a Item 8a
-
Upload
clemence-carroll -
Category
Documents
-
view
220 -
download
0
Transcript of STD/PASS/TAGS – Trade and Globalisation Statistics Linkages of trade and structural business...

STD/PASS/TAGS – Trade and Globalisation StatisticsSTD/PASS/TAGS – Trade and Globalisation Statistics
Linkages of trade and Linkages of trade and structural business structural business statisticsstatistics
OECD progress report
AgendaAgendaItem 8aItem 8aAgendaAgendaItem 8aItem 8a

2
STD/PASS/TAGS – Trade and Globalisation StatisticsSTD/PASS/TAGS – Trade and Globalisation Statistics
BackgroundBackground
• In the context of a globalized world economy, the demand for
detailed information about the characteristics of trade operatorscharacteristics of trade operators is
gaining more and more importance.
•Trade data by size of enterprise, broken down by sector of activity,
by export markets, and by location (e.g. region) would not only allow
analyzing trade effects on employment and value added, but also
identifying sectoral and/or regional performances.
• Such an analysis requires data from two different statistical sourcesfrom two different statistical sources:
business/industrial statistics and foreign trade statistics.
3
STD/PASS/TAGS – Trade and Globalisation StatisticsSTD/PASS/TAGS – Trade and Globalisation Statistics
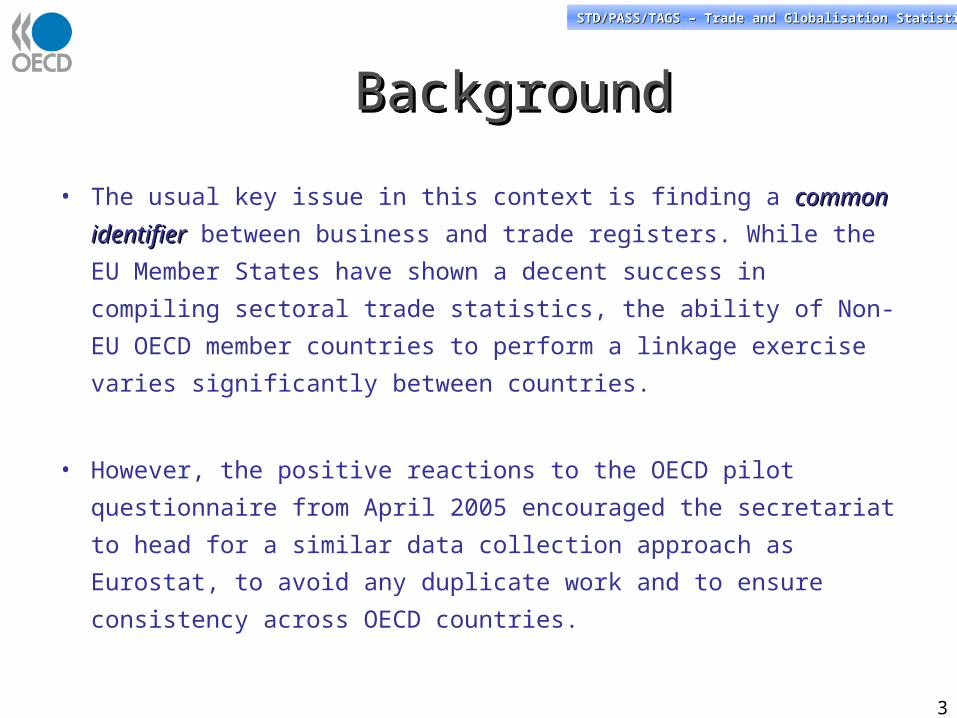
• The usual key issue in this context is finding a common identifiercommon identifier
between business and trade registers. While the EU Member States
have shown a decent success in compiling sectoral trade statistics,
the ability of Non-EU OECD member countries to perform a linkage
exercise varies significantly between countries.
• However, the positive reactions to the OECD pilot questionnaire
from April 2005 encouraged the secretariat to head for a similar data
collection approach as Eurostat, to avoid any duplicate work and to
ensure consistency across OECD countries.
BackgroundBackground
4
STD/PASS/TAGS – Trade and Globalisation StatisticsSTD/PASS/TAGS – Trade and Globalisation Statistics
IntroductionIntroduction
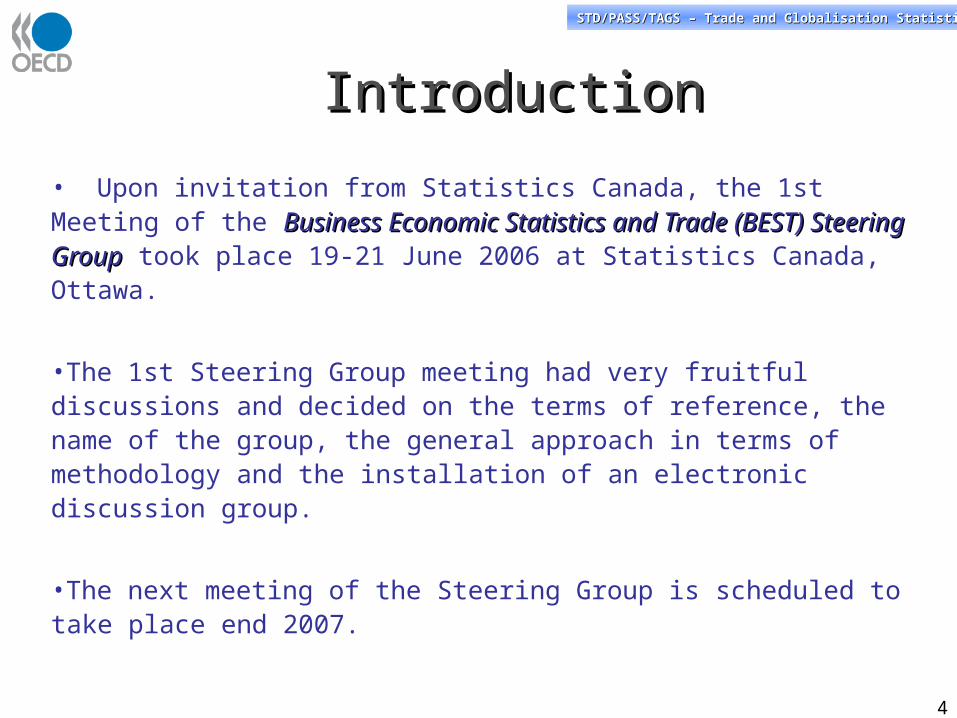
• Upon invitation from Statistics Canada, the 1st Meeting of the Business Business Economic Statistics and Trade (BEST) Steering GroupEconomic Statistics and Trade (BEST) Steering Group took place 19-21 June 2006 at Statistics Canada, Ottawa.
•The 1st Steering Group meeting had very fruitful discussions and decided on the terms of reference, the name of the group, the general approach in terms of methodology and the installation of an electronic discussion group.
•The next meeting of the Steering Group is scheduled to take place end 2007.

5
STD/PASS/TAGS – Trade and Globalisation StatisticsSTD/PASS/TAGS – Trade and Globalisation Statistics
• The project has been presented at the 2nd2nd OECD Structural Business OECD Structural Business Statistics Expert Meeting (10-11 May 2007)Statistics Expert Meeting (10-11 May 2007) and was supported by delegates.
• Also representatives from some Non-OECD countries showed interest in the project.
• Norway has already delivered results for 2003, according to OECD nomenclature.
• OECD would especially appreciate the participation from Non-EU OECD candidate countries in this exercise, but also other non-OECD countries are invited to join the project they wish so...
IntroductionIntroduction

6
STD/PASS/TAGS – Trade and Globalisation StatisticsSTD/PASS/TAGS – Trade and Globalisation Statistics
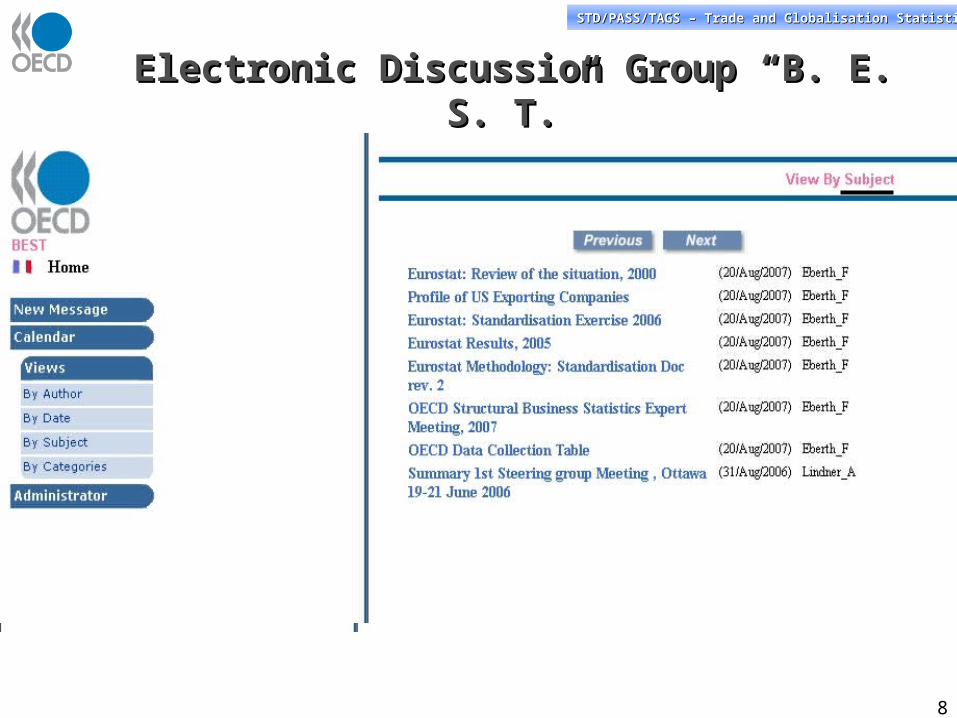
• A considerable number of methodological considerations and drawbacks have to be taken into account given the very different statistical systems in place in these countries. Therefore, the EDG B.E.S.TEDG B.E.S.T. will play a key role in enabling OECD and member countries to compile methodological recommendations.
• The EDGEDG has the following categories for input: – MethodologiesMethodologies (this category is pre-condition for the category
‘guidelines’),– MeetingsMeetings (meeting documents and reports of meetings),– GuidelinesGuidelines (the development of a manual, suitable for Non-EU countries
of the OECD, would be the optimum),– GlobalisationGlobalisation (this category re-groups issues from the globalisation
context which impact on the work of this group. For instance, intra-firm trade and multinationals),
– Data and IndicatorsData and Indicators (this category is intended to assemble the basic data and indicators which have been compiled through this work).
Electronic Discussion Group “B. E. S. T.”Electronic Discussion Group “B. E. S. T.”

7
STD/PASS/TAGS – Trade and Globalisation StatisticsSTD/PASS/TAGS – Trade and Globalisation Statistics
Electronic Discussion Group “B. E. S. T.”Electronic Discussion Group “B. E. S. T.”
8
STD/PASS/TAGS – Trade and Globalisation StatisticsSTD/PASS/TAGS – Trade and Globalisation Statistics
Electronic Discussion Group “B. E. S. T.”Electronic Discussion Group “B. E. S. T.”

9
STD/PASS/TAGS – Trade and Globalisation StatisticsSTD/PASS/TAGS – Trade and Globalisation Statistics
Imports Exports
Number of foreign trade
operatorsi
Trade coverage ii (%)Number of foreign trade
operators i
Trade coverage ii (%)Number of foreign trade
operators i
Number of enterprises /
establishments iii
Trade coverage iv (%)
Total number of enterprises in Business Register:
i: as defined by the identification number. Includes only the above exemption threshold operators.ii: trade identified in the trade register, as a proportion of total trade. Total trade includes an estimation of below-thresholds trade.
Population 1 includes all trade operators above the statistical transaction threshold.Population 2 includes all trade operators from population 1 except incomplete or wrong identification codes. Population 3 includes all trade operators from population 2 that can be succesfully matched with business register.
NB: Table corresponds to Eurostat's Table 1
Table I: Trade and Business Registers
Population concerned
iv: trade identified in the trade register, and matched with the BR, as a proportion of total trade. Total trade includes an estimation of below-thresholds trade
iii: as defined in the BR. For the difference between trade operator and enterprise, see the methodological introduction (annex).
1) All trade operators
2) All trade operators except
incomplete or wrong ID numbers
3) Trade operators successfully
matched with the BR
The first OECD Linkage Table (2007)The first OECD Linkage Table (2007)
This table gives an indication about the statistical relevance / significance of the results. The objective is, of course, to include a maximum of trade operators.
This table gives an indication about the statistical relevance / significance of the results. The objective is, of course, to include a maximum of trade operators.
10
STD/PASS/TAGS – Trade and Globalisation StatisticsSTD/PASS/TAGS – Trade and Globalisation Statistics
01 02 05 10 Etc. 99
0-9
10-49
50-249
250 or more
Unknown
Total
NB: Table corresponds to Eurostat's Table 2.3a
Num
ber o
f em
ploy
ees
Table II: Number of enterprises by economic sector and employment size class
Imports ISIC Rev.3.1 (2-digit level)
Total
01 02 05 10 Etc. 99
0-9
10-49
50-249
250 or more
Unknown
Total
NB: Table corresponds to Eurostat's Table 2.3b
Num
ber o
f em
ploy
ees
Table III: Trade (1000 US$) by economic sector and employment size class
Imports ISIC Rev.3.1 (2-digit level)
Total
01 02 05 10 Etc. 99
0-9
10-49
50-249
250 or more
Unknown
Total
NB: Table corresponds to Eurostat's Table 2.4a
Nu
mb
er o
f em
plo
yees
Table IV: Number of enterprises by economic sector and employment size class
Exports ISIC Rev.3.1 (2-digit level)
Total
01 02 05 10 Etc. 99
0-9
10-49
50-249
250 or more
Unknown
Total
NB: Table corresponds to Eurostat's Table 2.4b
Nu
mb
er o
f em
plo
yees
Table V: Trade (1000 US$) by economic sector and employment size class
Exports ISIC Rev.3.1 (2-digit level)
Total
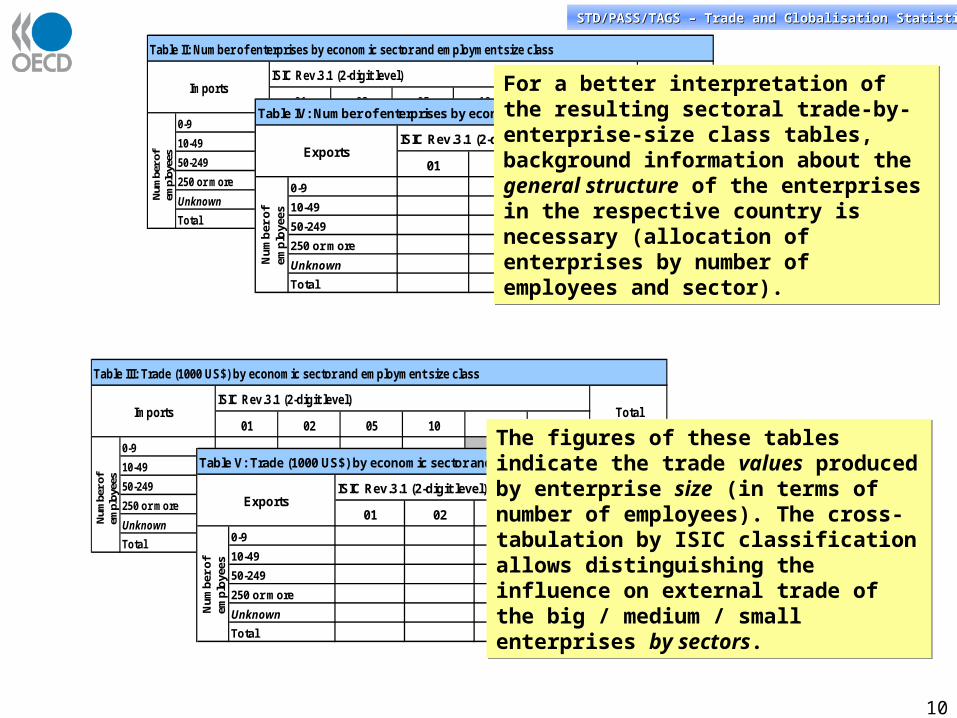
For a better interpretation of the resulting sectoral trade-by-enterprise-size class tables, background information about the general structure of the enterprises in the respective country is necessary (allocation of enterprises by number of employees and sector).
For a better interpretation of the resulting sectoral trade-by-enterprise-size class tables, background information about the general structure of the enterprises in the respective country is necessary (allocation of enterprises by number of employees and sector).
The figures of these tables indicate the trade values produced by enterprise size (in terms of number of employees). The cross-tabulation by ISIC classification allows distinguishing the influence on external trade of the big / medium / small enterprises by sectors.
The figures of these tables indicate the trade values produced by enterprise size (in terms of number of employees). The cross-tabulation by ISIC classification allows distinguishing the influence on external trade of the big / medium / small enterprises by sectors.

11
STD/PASS/TAGS – Trade and Globalisation StatisticsSTD/PASS/TAGS – Trade and Globalisation Statistics
C-E G Others Total
Top 5 enterprises
Top 10 enterprises
Top 20 enterprises
Top 50 enterprises
Top 100 enterprises
Top 500 enterprises
Top 1000 enterprises
All enterprises
NB: Table corresponds to Eurostat's Table 3.3
Table VI: Concentration of trade (1000 US$)
ImportsISIC Rev.3.1 (2-digit level)
C-E G Others Total
Top 5 enterprises
Top 10 enterprises
Top 20 enterprises
Top 50 enterprises
Top 100 enterprises
Top 500 enterprises
Top 1000 enterprises
All enterprises
NB: Table corresponds to Eurostat's Table 3.4
Table VII: Concentration of trade (1000 US$)
ExportsISIC Rev.3.1 (2-digit level)
These tables help to identify the degree in which the top enterprises (in terms of trade value) determine the total trade / trade by sectors of the respective country.
These tables help to identify the degree in which the top enterprises (in terms of trade value) determine the total trade / trade by sectors of the respective country.

12
STD/PASS/TAGS – Trade and Globalisation StatisticsSTD/PASS/TAGS – Trade and Globalisation Statistics
Imports
Partner country or zone C-E G Others Total
Belgium GermanyGreeceSpainFranceIrelandItalyLuxembourgNetherlandsAustriaPortugalFinlandDenmarkSwedenUnited KingdomEU15
Czech RepublicEstoniaCyprusLatviaLithuaniaHungaryMaltaPolandSloveniaSlovakiaNorwaySwitzerlandRomaniaBulgariaTurkeyRussiaOther European CountriesNorth AfricaOther African countries
CanadaUSANorth America
MexicoCentral America and Caribbean
MercosurSouth AmericaNear and Middle Eastern countries
JapanChinaIndiaDAEsOther Asian countries
European Union (15): Geographical zone 5110 (Eurostat nomenclature)Other European countries: Geographical zone 5190 (Eurostat nomenclature)North Africa: Geographical zone 5210 (Eurostat nomenclature)Other African countries: Geographical zone 5290 (Eurostat nomenclature)North America: Geographical zone 5310 (Eurostat nomenclature)Central America and Caribbean: Geographical zone 5320 (Eurostat nomenclature)South America: Geographical zone 5330 (Eurostat nomenclature)Near and Middle Eastern Countries: Geographical zone 5410 (Eurostat nomenclature)Other Asian countries: Geographical zone 5490 (Eurostat nomenclature)Oceania and Polar Regions : Geographical zone 5500 (Eurostat nomenclature)Countries not specified: Geographical zone 5900 (Eurostat nomenclature)Total: Geographical zone 5000 (Eurostat nomenclature)
Mercosur: Economic zone 1330 (Eurostat nomenclature)DAEs: Economic zone 1415 (Eurostat nomenclature)
Table VIII: Number of enterprises by partner zone
NACE Rev. 1.1 (section level)
Exports
Partner country or zone C-E G Others Total
Belgium GermanyGreeceSpainFranceIrelandItalyLuxembourgNetherlandsAustriaPortugalFinlandDenmarkSwedenUnited KingdomEU15
Czech RepublicEstoniaCyprusLatviaLithuaniaHungaryMaltaPolandSloveniaSlovakiaNorwaySwitzerlandRomaniaBulgariaTurkeyRussiaOther European CountriesNorth AfricaOther African countries
CanadaUSANorth America
MexicoCentral America and Caribbean
MercosurSouth AmericaNear and Middle Eastern countries
JapanChinaIndiaDAEsOther Asian countries
European Union (15): Geographical zone 5110 (Eurostat nomenclature)Other European countries: Geographical zone 5190 (Eurostat nomenclature)North Africa: Geographical zone 5210 (Eurostat nomenclature)Other African countries: Geographical zone 5290 (Eurostat nomenclature)North America: Geographical zone 5310 (Eurostat nomenclature)Central America and Caribbean: Geographical zone 5320 (Eurostat nomenclature)South America: Geographical zone 5330 (Eurostat nomenclature)Near and Middle Eastern Countries: Geographical zone 5410 (Eurostat nomenclature)Other Asian countries: Geographical zone 5490 (Eurostat nomenclature)Oceania and Polar Regions : Geographical zone 5500 (Eurostat nomenclature)Countries not specified: Geographical zone 5900 (Eurostat nomenclature)Total: Geographical zone 5000 (Eurostat nomenclature)
Mercosur: Economic zone 1330 (Eurostat nomenclature)DAEs: Economic zone 1415 (Eurostat nomenclature)
Table X: Number of enterprises by partner zone
ISIC Rev.3.1 (2-digit level)
In contrary to the ‘classic view’ of foreign trade statistics (trade value by partner country) these tables concentrate on the question of how many enterprises (in which sectors) trade with which countries. In other words, it’s a look at the number of trade relations (by sectors) instead of a look at the value of trade relations.
In contrary to the ‘classic view’ of foreign trade statistics (trade value by partner country) these tables concentrate on the question of how many enterprises (in which sectors) trade with which countries. In other words, it’s a look at the number of trade relations (by sectors) instead of a look at the value of trade relations.

13
STD/PASS/TAGS – Trade and Globalisation StatisticsSTD/PASS/TAGS – Trade and Globalisation Statistics
Imports
Partner country or zone C-E G Others Total
Belgium GermanyGreeceSpainFranceIrelandItalyLuxembourgNetherlandsAustriaPortugalFinlandDenmarkSwedenUnited KingdomEU15
Czech RepublicEstoniaCyprusLatviaLithuaniaHungaryMaltaPolandSloveniaSlovakiaNorwaySwitzerlandRomaniaBulgariaTurkeyRussiaOther European CountriesNorth AfricaOther African countries
CanadaUSANorth America
MexicoCentral America and Caribbean
MercosurSouth AmericaNear and Middle Eastern countries
JapanChinaIndiaDAEsOther Asian countries
European Union (15): Geographical zone 5110 (Eurostat nomenclature)Other European countries: Geographical zone 5190 (Eurostat nomenclature)North Africa: Geographical zone 5210 (Eurostat nomenclature)Other African countries: Geographical zone 5290 (Eurostat nomenclature)North America: Geographical zone 5310 (Eurostat nomenclature)Central America and Caribbean: Geographical zone 5320 (Eurostat nomenclature)South America: Geographical zone 5330 (Eurostat nomenclature)Near and Middle Eastern Countries: Geographical zone 5410 (Eurostat nomenclature)Other Asian countries: Geographical zone 5490 (Eurostat nomenclature)Oceania and Polar Regions : Geographical zone 5500 (Eurostat nomenclature)Countries not specified: Geographical zone 5900 (Eurostat nomenclature)Total: Geographical zone 5000 (Eurostat nomenclature)
Mercosur: Economic zone 1330 (Eurostat nomenclature)DAEs: Economic zone 1415 (Eurostat nomenclature)
Table IX: Value of trade (1000 US$) by partner zone
NACE Rev. 1.1 (section level)
Exports
Partner country or zone C-E G Others Total
Belgium GermanyGreeceSpainFranceIrelandItalyLuxembourgNetherlandsAustriaPortugalFinlandDenmarkSwedenUnited KingdomEU15
Czech RepublicEstoniaCyprusLatviaLithuaniaHungaryMaltaPolandSloveniaSlovakiaNorwaySwitzerlandRomaniaBulgariaTurkeyRussiaOther European CountriesNorth AfricaOther African countries
CanadaUSANorth America
MexicoCentral America and Caribbean
MercosurSouth AmericaNear and Middle Eastern countries
JapanChinaIndiaDAEsOther Asian countries
European Union (15): Geographical zone 5110 (Eurostat nomenclature)Other European countries: Geographical zone 5190 (Eurostat nomenclature)North Africa: Geographical zone 5210 (Eurostat nomenclature)Other African countries: Geographical zone 5290 (Eurostat nomenclature)North America: Geographical zone 5310 (Eurostat nomenclature)Central America and Caribbean: Geographical zone 5320 (Eurostat nomenclature)South America: Geographical zone 5330 (Eurostat nomenclature)Near and Middle Eastern Countries: Geographical zone 5410 (Eurostat nomenclature)Other Asian countries: Geographical zone 5490 (Eurostat nomenclature)Oceania and Polar Regions : Geographical zone 5500 (Eurostat nomenclature)Countries not specified: Geographical zone 5900 (Eurostat nomenclature)Total: Geographical zone 5000 (Eurostat nomenclature)
Mercosur: Economic zone 1330 (Eurostat nomenclature)DAEs: Economic zone 1415 (Eurostat nomenclature)
Table XI: Value of trade (1000 US$) by partner zone
ISIC Rev.3.1 (2-digit level)
The ‘classic’ view towards trade values by partner countries, but broken-down by ISIC sections of the traders.
The ‘classic’ view towards trade values by partner countries, but broken-down by ISIC sections of the traders.
STD/PASS/TAGS – Trade and Globalisation StatisticsSTD/PASS/TAGS – Trade and Globalisation Statistics

14
STD/PASS/TAGS – Trade and Globalisation StatisticsSTD/PASS/TAGS – Trade and Globalisation Statistics
C-E G Others Total1 partner country2 partner countries3 partner countries4-5 partner countries6-7 partner countries8-10 partner countries11-13 partner countries14+ partner countriesUnknownTotal
NB: Table corresponds to Eurostat's Table 5.3a
ISIC Rev.3.1 (2-digit level)Imports
Nu
mb
er
of
par
tner
co
un
trie
s
Table XII: Number of enterprises according to number of partner countries
C-E G Others Total1 partner country2 partner countries3 partner countries4-5 partner countries6-7 partner countries8-10 partner countries11-13 partner countries14+ partner countriesUnknownTotal
NB: Table corresponds to Eurostat's Table 5.3a
ISIC Rev.3.1 (2-digit level)Imports
Nu
mb
er
of
pa
rtn
er
cou
ntr
ies
Table XIII: Value of trade (1000 US$) according to number of partner countries
C-E G Others Total1 partner country2 partner countries3 partner countries4-5 partner countries6-7 partner countries8-10 partner countries11-13 partner countries14+ partner countriesUnknownTotal
NB: Table corresponds to Eurostat's Table 5.4a
ISIC Rev.3.1 (2-digit level)Exports
Nu
mb
er o
f p
artn
er
cou
ntr
ies
Table XIV: Number of enterprises according to number of partner countries
C-E G Others Total1 partner country2 partner countries3 partner countries4-5 partner countries6-7 partner countries8-10 partner countries11-13 partner countries14+ partner countriesUnknownTotal
NB: Table corresponds to Eurostat's Table 5.4b
ISIC Rev.3.1 (2-digit level)Exports
Nu
mb
er o
f p
artn
er
cou
ntr
ies
Table XV: Value of trade (1000 US$) according to number of partner countries
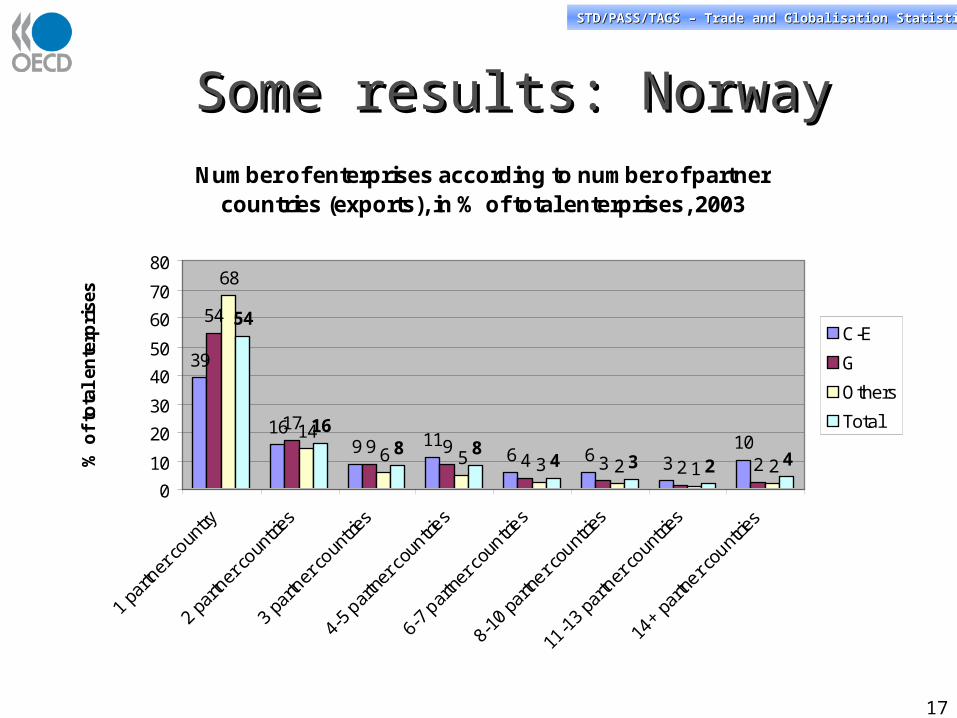
These tables show the degrees of (geographic) diversification by sectors in terms of number of partner countries and number of enterprises.
These tables show the degrees of (geographic) diversification by sectors in terms of number of partner countries and number of enterprises.
STD/PASS/TAGS – Trade and Globalisation StatisticsSTD/PASS/TAGS – Trade and Globalisation Statistics
These tables show the degrees of (geographic) diversification by sectors in terms of number of partner countries and value of trade.
These tables show the degrees of (geographic) diversification by sectors in terms of number of partner countries and value of trade.

15
STD/PASS/TAGS – Trade and Globalisation StatisticsSTD/PASS/TAGS – Trade and Globalisation Statistics
01 02 05 10 Etc. 99
01
02
03
04
11
12
13
14
15
16
17
18
21
22
23
24
25
26
27
28
29
31
32
33
34
35
36
37
38
39
41
42
43
44
45
46
47
48
49
51
CP
C 1
.0 (
2-d
igit
le
ve
l)
Table XVI: Trade (1000 US$) by commodity and economic activity
Imports TotalISIC Rev.3.1 (2-digit level)
01 02 05 10 Etc. 99
01
02
03
04
11
12
13
14
15
16
17
18
21
22
23
24
25
26
27
28
29
31
32
33
34
35
36
37
38
39
41
42
43
44
45
46
47CP
C 1
.0 (
2-d
igit
le
ve
l)
Table XVII: Trade (1000 US$) by commodity and economic activity
ISIC Rev.3.1 (2-digit level)Exports Total
STD/PASS/TAGS – Trade and Globalisation StatisticsSTD/PASS/TAGS – Trade and Globalisation Statistics
Detailed cross-tabulation tables by CPC 1.0 (2-digit-level) and ISIC 3.1 (2-digit-level).
Detailed cross-tabulation tables by CPC 1.0 (2-digit-level) and ISIC 3.1 (2-digit-level).

16
STD/PASS/TAGS – Trade and Globalisation StatisticsSTD/PASS/TAGS – Trade and Globalisation Statistics
Some results: NorwaySome results: NorwayNorway:
Concentration of exports (%), by ISIC Sectors, 2003
57
65
71
79
85
9799
16
26
39
59
72
9296
38
53
68
80
88
97 99
48
5560
69
76
9296
0
10
20
30
40
50
60
70
80
90
100
Top 5 Top 10 Top 20 Top 500 Top 100 Top 500 Top 1000
% o
f to
tal e
xp
ort
s
C-E
G
Others
Total
17
STD/PASS/TAGS – Trade and Globalisation StatisticsSTD/PASS/TAGS – Trade and Globalisation Statistics
Some results: NorwaySome results: NorwayNumber of enterprises according to number of partner
countries (exports), in % of total enterprises, 2003
39
169 11
6 6 310
54
179 9
4 3 2 2
68
146 5 3 2 1 2
54
168 8
4 3 2 4
0
10
20
30
40
50
60
70
80
1 pa
rtner
coun
try
2 pa
rtner
coun
tries
3 pa
rtner
coun
tries
4-5 p
artn
er co
untrie
s
6-7 p
artn
er co
untrie
s
8-10
par
tner c
ountr
ies
11-1
3 pa
rtner
coun
tries
14+
partn
er cou
ntries
% o
f to
tal
ente
rpri
ses
C-E
G
Others
Total

18
STD/PASS/TAGS – Trade and Globalisation StatisticsSTD/PASS/TAGS – Trade and Globalisation Statistics
Some results: NorwaySome results: NorwayValue of trade according to number of partner countries (exports),
in % of total trade, 2003
1 1 1 3 28 9
75
4 2 37 9 11 8
56
27
612
3 4 3 5
40
3 1 2 3 38 9
71
0
10
20
30
40
50
60
70
80
1 pa
rtner
coun
try
2 pa
rtner
coun
tries
3 pa
rtner
coun
tries
4-5 p
artne
r cou
ntrie
s
6-7 p
artne
r cou
ntrie
s
8-10
par
tner
coun
tries
11-1
3 pa
rtner
cou
ntrie
s
14+
partn
er c
ountr
ies
% o
f to
tal
tra
de
C-E
G
Others
Total

19
STD/PASS/TAGS – Trade and Globalisation StatisticsSTD/PASS/TAGS – Trade and Globalisation Statistics
• The process of building up a new database on trade by enterprise
characteristics has been put into motion now with the sending out of the first
version of the OECD Linkage Table.
• The next step consists in filling these out as much as possible by countries,
identifying barriers to do so and clarifying concepts and definitions. This first
stocktaking and initial combining of data is the obligatory first step before
proceeding further. There is nothing OECD can do in this respect without the
active participation of countries.
• OECD has created the Electronic Discussion Group “B.E.S.T.” to provide a one-
stop-address for this work for collaborating countries. Both countries and OECD
can now provide inputs; this is the immediate task for preparing the next
meeting. The first inputs (methodology, data collection tables) have been
provided, and the EDG is in the process of being populated.
The road aheadThe road ahead

20
STD/PASS/TAGS – Trade and Globalisation StatisticsSTD/PASS/TAGS – Trade and Globalisation Statistics
The road ahead The road ahead [ctd][ctd]
• Step-by-step, cleared concepts and definitions should be compiled in a pilot
recommendations manual for adoption by countries. It seems advisable to
make the recommendations sufficiently broad so that they can be also applied
by other countries, for instance the Big 5 Non-Member countries of OECD.
• After results from the first data collection will be available, OECD will set up (in
close cooperation with Eurostat) a first set of OECD tables from the linkage
exercise.
• A 2nd B.E.S.T. meeting is scheduled to take place towards end 2007 to allow
the United States to sufficiently advance in their work. It will be important to
assess best practice and core requirements to proceed further.
• A periodic review is planned to ensure that the project remains on track and is
providing pertinent results.

21
STD/PASS/TAGS – Trade and Globalisation StatisticsSTD/PASS/TAGS – Trade and Globalisation Statistics
Delegates are invited to:Delegates are invited to:
• Comment on the project and -eventually- voice interest in active participation.
• Non-EU countries are invited to comment on their possibility to compile data according to the standard table framework provided and flag scope for co-operation with OECD.
• Comment on the project and -eventually- voice interest in active participation.
• Non-EU countries are invited to comment on their possibility to compile data according to the standard table framework provided and flag scope for co-operation with OECD.