Staying the Course Weatherford International Ltd. 2008 Annual Report
130
Staying the Course Weatherford International Ltd. 2008 Annual Report
Transcript of Staying the Course Weatherford International Ltd. 2008 Annual Report
Staying the CourseWeatherford International Ltd. 2008 Annual Report
Weatherford International Ltd.
20
08
An
nu
al Rep
ort
Weatherford International Ltd. Alpenstrasse 15 6300 Zug Switzerland weatherford.com

Auditors
Ernst & Young LLP5 Houston Center1401 McKinney, Suite 1200Houston, TX 77010
Legal Counsel
Andrews & Kurth LLP600 Travis, Suite 4200Houston, TX 77002
Stock Data
New York Stock ExchangeSymbol: WFT
Corporate Headquarters
Weatherford International Ltd.Alpenstrasse 156300 ZugSwitzerland
Regional Offices
Asia Pacific14th Floor, West WingRohas PerkasaNo. 8, Jalan PerakKuala Lumpur 50450Malaysia+60 3 2168 6000
Canada333 5th Avenue S.W., Suite 1100Calgary, AlbertaT2P 3B6Canada+1 403 693 7500
Middle East/North Africa4th Interchange, Al BarshaSheikh Zayed RoadAl-Khaimah Building IIDubai UAE+9 71 4 312 5000
United States515 Post Oak Boulevard, Suite 600Houston, TX 77027USA+1 713 693 4000
Latin AmericaBlvd Manuel Avila Camancho 4023rd FloorCol. Lomas de ChapultepecMexico D.F., CP11000Mexico+52 5591384800
Russia & FSU4, 4th Lesnoy PereulokMoscow125047 Russia+7 495 775 47 12
Europe/Sub Sahara AfricaSouterhead RoadAltens Industrial EstateAberdeen AB12 3LFUnited Kingdom+44 1224 380200SGS-COC-003505

Weatherford International Ltd. (NYSE: WFT) is an oilfield service and equipment company. We serve the global exploration & production industry with products and services that span a well’s life cycle, encompassing drilling, evaluation, completion, production and intervention. Weatherford operates in over 100 countries and employs approximately50,000 people worldwide.
We are committed to pursuing the highest standards of excellence in all of our business processes and part-nerships. This commitment includes complying withall applicable laws and regulations of the areas withinwhich we operate or exceeding compliance where ourstated expectations require; conducting all operationsin a way that promotes safe work practices and mini-mizes risk to our employees, our communities and theenvironment; and implementing the programs, trainingand internal controls necessary to achieve our goals.
Financial Highlights 2
Letter to Shareholders 3
Region Overviews 7
Product & Service Portfolio 24
Officers & Directors 28
Financial Report 29
Corporate Information Inside back cover
Chuck Lee, a logging-while-drilling (LWD) senior
training engineer, analyzes an LWD image log to pick
structural dips that will enable a geosteering team
to pinpoint well placement in the “sweet spot” of a
horizontal well.
1

2
Financial Highlights
(In thousands, except per share data) 2008 2007 2006
Revenues $ 9,600,564 $ 7,832,062 $ 6,578,928
Operating Income 1,978,549 1,624,336 1,354,687
Net Income from Continuing Operations 1,366,831 1,091,975 906,106
Diluted Earnings Per Share from Continuing Operations $ 1.96 $ 1.57 $ 1.28
Diluted Weighted Average Shares 698,178 695,516 709,664
Balance Sheet Data:
Total Assets $ 16,476,513 $ 13,190,957 $ 10,139,248
Total Debt 5,820,202 3,840,555 2,213,336
Shareholders’ Equity 8,285,648 7,406,719 6,174,799
Depreciation and Amortization $ 731,808 $ 606,226 $ 482,948

3
Letter to Shareholders
In 2008, your company outperformed all of its peers in
revenue and operating income growth, maintaining our
track record as the industry’s most dedicated growth
engine.
Achievements included:
• Posting the highest revenues in the company’s his-
tory, with a 23 percent increase and fourth quarter
annualized revenues crossing the $10.5 billion mark;
• Achieving the highest earnings in the company’s his-
tory, with a 20 percent increase in earnings per share;
• Attaining a combined international growth rate in the
Eastern Hemisphere and Latin America of 32 percent
against an 8 percent increase in rig count – four times
the market rate and a repeat of what Weatherford
achieved in 2006 and 2007.
We lived in a time of plenty during 2008. Record-high
oil prices, escalating back orders on equipment, and
robust rig counts provided the fundamentals and envi-
ronment conducive to posting new high-water marks for
revenues and earnings. Your company, however, would
have achieved far less had we not, over the past several
years, laid the groundwork for 2008’s performance.
Investments made to extend the technology within our
toolbox, broaden our infrastructure, and accelerate the
development of our human talent were the other half of
2008’s success story.
The drive to broaden and deepen the technological
intensity of our product and service offerings provided a
quantum boost to 2008’s performance. This drive is not
new to Weatherford, yet its impact during 2008 was the
strongest in your company’s history.
The best example can be found in the progress of our
directional drilling service line. Directional drilling is
one of our youngest technologies. Late in the year, it
crossed the $1 billion revenue level for the first time
since we acquired the service line three years ago at a
third of its current size. In fact drilling services, which
includes directional drilling and Controlled Pressure
Drilling® (CPD®), is now Weatherford’s largest product
line measured by revenues, displacing artificial lift,
which was historically our largest product line.
Drilling services, integrated drilling, and chemicals and
stimulation made up the three fastest-growing product
lines. All three are relatively new to the Weatherford
toolbox. Of the three, integrated drilling, or better yet
integrated services, offers the greatest promise. And, of
course, all of our product and service lines will benefit
from this.
In Weatherford terms, integrated services maximizes
operating productivity by combining under one ‘architect’
conveyance (a drilling, workover, or coiled tubing rig)
with comprehensive downhole products and services for
the purpose of delivering either well drilling and com-
pletion or well intervention. The objective of integration
is to provide higher productivity as measured by time,
safety, and quality.
We first embarked upon a strategy of combining con-
veyance with our traditional downhole tools and services
in late 2005, following the acquisition of Precision
Energy Services. We believed then, as we do now, that
the service providers capable of integrating rigs – or
more broadly conveyance operations – with downhole
well construction and intervention services stand to
deliver the best value to their clients.
For Weatherford, this theory has proved to be true at all
levels. In our experience to date, field operating results
show marked and measurable productivity improve-
ments in all efficiency and safety statistics. The response
from our clients has made this service line the com-
pany’s fastest growing.

4
We enriched our toolbox in 2008 with 38 acquisitions
and nine technology license and development agree-
ments. The largest was the acquisition of International
Logging Inc. This purchase added surface logging serv-
ices and technologies that enhance the evaluation of
formations and optimize drilling. Other acquisitions
ranged from innovative completion technology to all-in-
one rig mechanization technologies that improve drill
floor operational safety and drilling efficiency.
In the area of infrastructure, we added, in the course of
2008, 17 new large service locations and three research
and development facilities, all in international locations.
We also opened five new training facilities with associ-
ated test rigs and related equipment.
A solution to the people conundrum – where to find
them, how to train them, and how to retain them –
progressed substantially in 2008. We increased head-
count by 33 percent in the Middle East and 61 percent
in Latin America. In Russia, our workforce is now 95
percent local, due to intense training and recruiting
efforts for the past two years. Conversely, headcount
growth in North America was held to a minimum, as
we focused on improving efficiencies in this market.
Our investments in technology, international infrastruc-
ture, and people were necessary predicates to the high
growth of our international business. The international
segments in turn were responsible for most of the growth
at Weatherford. Over the past eight quarters, our inter-
national operations have accounted for 73 percent and
100 percent of your company’s revenue and operating
income growth, respectively.
The next five years will see the same pattern.
A few simple statistics are worth remembering. As best
as we can measure worldwide client expenditures,
roughly 70 percent of all money spent in oilfield service
and equipment is in the international arena, with only
30 percent spent in North America. This 70/30 split, if
anything, is even more lopsided than these numbers
suggest. Furthermore, given the differential in reservoir
quality, both existing and to be developed, we assess the
secular (that is, ex-cyclical) international growth rate in
oilfield expenditures at about twice the rate of North
America’s likely trend.
The conclusion for us is crystal clear:
• The international markets are the largest and fastest-
growing field of opportunity and one we will focus on
intensely.
• North America will remain an important market and a
remarkable source of talent and innovation. Given its
higher volatility and the inherent secular limitations
of its reservoir base, North American operations will
require a heavier focus on efficiency to deliver the
lowest cost solutions.
2009 Outlook and Plan
The market environment in 2009 stands in stark
contrast to that of the 2005-2008 time frame.
We are in a global contraction, fueled by a systemic
credit crisis that has spawned paralysis and fear in every
corner of the world. It is not the usual recession caused
by oilfield supply/demand imbalances. This recession’s
roots are exogenous to the oil and gas market and span
all industries and sectors. The impact on oilfield service
includes sharply lower oil and gas prices, hard-to-access
capital, a violently deteriorating North American market,
and the postponement or downsizing of many interna-
tional projects.
This volatility is reflected in our own stock price.
At the time of this writing, the shares of your company
are trading at very low valuation metrics, matching the
lowest I have experienced in my 22-year tenure with
Weatherford.
Dwelling on the world’s current systemic pessimism is
not productive. We should embrace the current environ-
ment and make the most of it with long-term share-
holder wealth generation as our guiding objective.
Our direction in this environment is twofold:
• We will stay the strategic course we have been on for
the past 10 years, meaning that all decisions will be
made with furthering our long-term growth objectives
in mind. This consistency should allow us to grow
faster when the environment turns.
• We will exploit the downtime to transform your
company into a higher-quality operation. We will
endeavor to systematically strengthen your company’s

5
• operations and support organization. This should • •
• allow us to provide higher margins in the recovery
• and a more efficient use of capital than in the
• 2004-2008 time period.
North America has been hit hard and fast. Robust
production rates from new shale plays, as well as incre-
mental volumes of liquefied natural gas likely to be
available for import into the U.S., are expected to hold
natural gas-related activity at weak levels into 2010.
We will continue to restructure operations as quickly
and efficiently as possible, without eroding service
quality or losing our core talent base. The objective is
to permanently change our fixed cost structure in North
America, primarily in areas such as facilities and over-
head. We believe that the service industry as a whole
must become much more efficient at delivering prod-
ucts and services at a cost that reflects the economic
realities of North America’s reservoirs. Part of this can
be earned through a thoughtful but more aggressive use
of technology; part of it will be provided by thinning
down fixed costs attached to operations over time by a
combination of history and good intentions.
Although business in deepwater, shale gas, and heavy
oil will not escape the difficulties of a very strained 2009
North American market, in the long run these segments
have the best growth prognosis for the U.S. and Canada.
We have invested in a technology portfolio that is ideally
matched for these environments:
• For deepwater, we have world record-breaking and
field-proven extreme environment drilling systems
that enable drillers to reach new depths and pres-
sures. These capabilities bolster our dominant market
positions in well construction, fishing services, and
drilling tools.
• For shale plays, we have one of the strongest and
most comprehensive service offerings in the industry,
with the full scope of expertise, services, and prod-
ucts to understand, drill, and complete shale wells.
• We remain perhaps the leading service company in
the world when it comes to the development of heavy
oil reservoirs, with the broadest artificial lift and
production optimization portfolio in the industry.
On the international side of our business, we expect a
retrenchment in international client spending during
2009, with a drop of 10 to 15 percent in volume as
compared to 2008. There are substantial differences
from one national market to the next. Markets such as
Russia and the North Sea are showing significant weak-
ness. Offsetting these declines are opportunities for
year-on-year growth in selected countries of the Middle
East, North Africa, Asia, and Latin America. In these
four markets, we expect to outperform the underlying
market by a wide margin due to the number and type of
contracts secured in these markets during 2008 and
the financial strength of the clients.
Despite the temporary drag imposed by the current
financial crisis, the international market is in a very
long-term secular uptrend. While 2009 will prove to be
a cyclical decline, the earliest hints of an economic
recovery will bring with them a renewed focus on marginal
spare production capacity and accelerating decline rates.
International reservoirs must play the commanding role
in addressing hydrocarbon demand over the next
decades. These fundamental realities shape our long-
term view of the international markets.
Our recent re-domestication from Bermuda to Switzerland
was important to our strategy of going where our clients
are. It allows us to establish corporate headquarters
closer to the geographic part of our markets that is both
growing the fastest and will end up representing more
than 50 percent of our overall revenues.
We also pursued the re-domestication because we
wanted to be located in a country with a stable legal
and tax regime. Switzerland has long-standing tax
treaties with over 70 countries around the world, as well
as very high standards of corporate governance.
Moving forward, the quest for productivity will be a
moral absolute of sorts. Efficiency is always important,
but during times of very weak commodity prices it is all
the more critical to the health of the industry.
For clients, quest for productivity means combining
field-level execution and technology in ways that yield
incremental efficiency measured in time, quantity of
resources, safety, and quality. The quest for productivity
gains is at the core of our corporate mission in 2009.

6
Productivity in field execution will come from three
areas of focus:
• One is removing complex organizational interfaces
that add costs and breed errors. We have one of the
flattest and most decentralized structures in the
industry. This structure encourages responsiveness
and intensity, and places accountability where it
needs to be: at the regional level and close to the
front lines.
• Two is mitigating operating risks by having better
trained, ideally the best trained, individuals, both
initially and as a result of continuous education.
We have built or are building training centers in all of
our key markets, such as Russia, Middle East/North
Africa, and Asia. This step ensures that we reinforce
our training intensity, at both fundamental and
advanced levels.
• Three is systematically leveraging our infrastructure
of more than 800 service facilities and 128 manufac-
turing facilities in 100 countries. This permits a
broad number of efficiencies in our supply chain, as
well as providing closeness, even intimacy, with the
reservoirs and their specificity.
A Time of Opportunity
2009 is going to be a difficult year, but it is not the
first time in our young history we have faced poor
economic conditions. We do not know when the current
economic tide will turn, nor do we think attempting to
divine the time and rate of the turn is a useful exercise.
Forecasting is a bankrupt intellectual endeavor. It has
always been so.
We do know that economic contraction will not last
forever. And that with a turn, the logic of accelerating
decline rates in hydrocarbon reservoirs, increasing
demography, and growing energy intensity of use will
prevail. More than ever, when this happens, the oilfield
service and equipment industry will be called upon to
act as the world’s strategic plumber.
In anticipation of that time and with the quest for pro-
ductivity as our guiding principle, we intend to make
good use of 2009 and the strained economic conditions
to make Weatherford a better-run company.
The employees of Weatherford have been the unsung
heroes of years of aggressive development securing very
high rates of growth, invariably a multiple of underlying
market conditions. In this down year, they will do their
absolute best to continue building the foundations of
our long-term growth. You will see us committed to
doing whatever must be done to demonstrate in this
year of economic hardship that your organization can
distinguish itself in down markets as well as it did in
better times.
Respectfully,
Bernard J. Duroc-Danner
Chairman, President and Chief Executive Officer

Region Overviews
7

8
A consistent strategy
With a business model that is valid across market
cycles, Weatherford is staying the course to create
growth and value for investors.
In just 22 years, Weatherford International has grown
from very humble beginnings into a world-class oilfield
service and equipment company. Today we operate in
more than 100 countries across the globe and offer an
exceptional breadth of products, services and technolo-
gies that span the life cycle of oil and gas projects.
We have built our success on a well-conceived and
consistently executed strategy that is based on long-
term industry trends. These trends remain valid through
all market cycles. We continue to pursue superior
growth and value for our investors by expanding our
footprint, investing in technology and developing
new competencies.
At the Forefront of Technology
With a commitment to building our intellectual
property and informational capabilities, we have supple-
mented our internal research and development (R&D)
expenditures with investments in R&D and technology
acquisitions to develop new products and services that
complement our traditional strengths. We are leveraging
these capabilities to get involved at the planning stage
of projects where we can lay the foundation for an
integrated offering of products and services across the
project life cycle. Dedicated to staying at the forefront
of market trends and client needs, we offer a spectrum
of advanced technologies and capabilities to meet the
challenges associated with aging reservoirs and difficult
drilling conditions.
Global Stature, Local Presence
As the industry increases its focus on under-exploited
resources in the eastern hemisphere, we have positioned
Weatherford for international growth by decentralizing
our organization. With regional hubs in major energy-
producing areas, we have located people, resources
and authority closer to clients. This structure facilitates
better understanding of markets and risks, strengthens
our local presence and captures business opportunities.
In the western hemisphere, we are tapping robust growth
in Latin America, and we offer strong competencies for
North American opportunities in shale gas, heavy oil
and deep water.
Our relentless quest for best-in-class growth and
performance continues. Our strategy is sound. Our
execution skills are strong. We are staying the course
to realize the company’s full potential.

9
Over the last five years Weatherford’s revenue has increased from $2.6 billion to $9.6 billion, a 30 percent compound annual
growth rate. A critical part of this growth has been our consistent investment in research and development, which amounts
to $785 million since 2003. Much of our growth has been in international markets. We have seen a near tripling of revenue
generated per operating rig in international markets, mirroring our clients’ projected growth plans and spend in areas outside
of North America.

Middle East, North Africa, and Asia
Hani Qutob, Principal Advisor, Reservoir Engineering,
and a Distinguished Lecturer for the Society of
Petroleum Engineers, has been instrumental in
demonstrating the potential of Controlled Pressure
Drilling® (CPD®) technologies in reducing unproduc-
tive rig time and delivering cost savings. In 2008,
managed pressure drilling, a subset of CPD, was a
significant contributor to growth in the Middle East
and North Africa region.
10

Integrated projects that leverage our broad capabilities
ignited a 31 percent increase in revenue from our Middle
East, North Africa, Asia Pacific region during 2008.
Spanning a vast geographic area that boasts some of the
world’s fastest growth in energy production, Weatherford’s
Middle East, North Africa, Asia Pacific region produced
$2.4 billion of revenue during 2008, 25 percent of the
company’s total. Our operations cover 47 countries,
employ 29 percent of the company’s total workforce,
and include 114 service locations and 36 manufactur-
ing facilities.
Growth Across Product Lines
Throughout the region, Weatherford achieved growth
across virtually all of its product lines. Strong market
positions and new contract awards requiring a broad
spectrum of services and capabilities drove our success.
In the Middle East and North Africa, we maintained an
overwhelming share of the market for our Controlled
Pressure Drilling® and Testing services (CPD® & T). We
grew managed pressure drilling (MPD) revenue by a
multiple of the underlying market growth. New contracts
worth nearly $100 million drove increases in well test-
ing and early production facilities. We also introduced
cementing products, fracturing, coiled tubing and
stimulation in the Middle East and North Africa
markets to complement existing product lines. In a
very short time, we have secured several new contracts,
some that became operational in 2008 and additional
ones slated for 2009.
Our traditional product lines delivered a strong perform-
ance in Asia Pacific markets while newer services gained
traction. Tubular running services in particular exhibited
strong growth as rig mechanization products and services
were systematically introduced into the region. We more
than doubled our revenue from cased-hole completions
during 2008 by transitioning our offering from basic
commodity products to service-based solutions. Other
growth products included CPD & T, intelligent comple-
tion, artificial lift and wireline services.
11

12
Project Management Traction
International oil companies increasingly are seeking
turnkey solutions, particularly in remote areas and
underdeveloped markets. Weatherford is capitalizing
on this trend, coupling our project management prowess
and vast capabilities to capture integrated projects.
In 2008, we delivered a number of projects in countries
such as Indonesia, Vietnam, the Philippines, China and
Papua New Guinea, where we provided cross-product
line solutions and project-managed implementation.
Also in Asia, Weatherford is the single-source provider
for the CITIC project in China, where we expect to drill
165 wells over a three-year period starting in 2009.
In the Middle East and North Africa, a strong focus on
project management generated integrated drilling
service contracts in Algeria, Bahrain, Libya, Pakistan,
and Tunisia. In addition, we were selected in Ethiopia
as the single-source provider for a five-well exploration
program valued at approximately $125 million and
spanning two years. The project encompasses the
drilling rig plus ten different service/product lines.
Leveraging Technology to Build Market Share
We are building market share throughout the Middle
East, North Africa, and Asia Pacific region by expanding
our product offerings and leveraging our technologies.
We also are shifting our focus in some product lines
and markets from basic packages to more sophisticated
technologies that add value for clients and enhance our
profitability and returns.
One of the most successful technology introductions
in the Middle East and North Africa, the StabMaster®
system, improves the safety and efficiency of rig opera-
tions. The installation of eight StabMaster systems
during 2008 has enhanced our profitability and opened
new markets for our tubular running services (TRS).
With a dominant share of the TRS market in the Middle
East and North Africa, we continue to reinforce our
leadership position by introducing high-value technolo-
gies. New product launches in 2009 will include other
rig mechanization technologies such as our new
OverDrive™ compact system.
In India, our recently introduced MPD technology
reduced non-productive rig time to one day compared
to an average of ten days on three previously drilled
wells. We captured additional savings for our client
by reducing fluid losses by more than 90 percent
compared to previous wells.
Other successful examples of technology traction in
the Middle East and North Africa include Engineered
Chemistry®, rotary-steerable systems, and our Compact™
suite of logging services.
Expanding our Markets
Our entry into the Asia Pacific well testing market during
2008 met with resounding success. We signed contracts
with two super majors for operations in Thailand and
Indonesia. The Thailand package will incorporate our
multiphase RamPump™, delivering significant
environmental benefits and cost savings to our client
while generating pull-through revenue for Weatherford.
We also have formed joint ventures to more effectively
participate in some high-growth markets like Qatar. A joint
venture with Al Shaheen, a subsidiary of Qatar Petroleum,
encompasses five of our core service lines: drilling, tubular
running, fishing, drilling tools, and both open- and cased-
hole wireline. We expect future pull-through opportunities
for other products and services. We created TubeTek,
a joint venture in Brunei, to respond to local market
needs. This venture resulted in the award of a significant
TRS contract previously held by a competitor. The
project includes conventional tubular running and
rig mechanization services.
Records and Achievements
Weatherford extended its legacy of world records and
industry firsts throughout the region during 2008. We
set a world record in North China, air-drilling one of the
deepest, hottest hole sections ever attempted globally.
Battling unstable hole conditions and water production
in a large wellbore with extreme depths and tempera-
tures, we air- and mist-drilled a well section four times
faster than conventional drilling techniques. At a project
in the South China Sea, our drilling with casing (DwC™)
capabilities saved our client 200 hours of rig time and
$1.6 million.

Weatherford has made a significant investment in
the growing market of Algeria over the past five
years, including the development of our Hassi
Messauod compound, pictured here. In a five-
year timeframe, the number of bases within
Hassi Messauod has expanded from one to four,
and headcount has increased from approximately
400 to more than 1,000 multinational employees.
Product and service line capabilities, which began
with our traditional well construction and drilling
products core, now range from integrated drilling
to pipeline and specialty services.
13

14
In 2008, we opened a new wireline service and support
base in Thailand, which helped us secure a new three-year,
land-based contract in the northwestern part of the country.

In another industry first, Weatherford simultaneously
ran two Downhole Deployment Valves (DDV®) into a well
in Papua New Guinea. Running the DDV tools in tandem
provided the operator with the redundancy needed to
allow the drilling and completion of a high-pressure
gas well underbalanced.
In Saudi Arabia, we reached a global first for the
MetalSkin® cased-hole liner (MCL) system on our first
installation of the new system within the Middle East
and North Africa region. We ran 2,080 feet of MCL
offshore Saudi Arabia, the longest run to date
for Weatherford.
We completed ten installations for the MetalSkinopen-hole liner system in Saudi Arabia, rendering the
system commercial and past the research and develop-
ment status. For 2009, we will offer MetalSkin open-
hole, monobore open-hole, and cased-hole products to
deploy in the Saudi and Algerian markets.
We also extended the reach of our expandable sand
screens (ESS®) in Saudi Arabia. In the longest single-
trip expansion for a 7-inch ESS, we achieved a world-
record depth and set the stage for further qualification
of this system in deep water. In addition, we completed
the first trilateral conventional screen and ESS combi-
nation with Maxflo® installed in the upper two laterals.
Another world first in Saudi Arabia was the installation of
our new Carbonate Reservoir Drainage System (CaRDSSM),
which includes FloReg™ inflow control technology, swell
elastomers and hydraulic packers packaged modularly
for horizontal applications in carbonate reservoirs.
Filling the Footprint
We are adding infrastructure to support our ongoing
growth in the Middle East. Our primary training center
in Abu Dhabi is under construction, and a new Drilling
Simulation Center in the Dubai Industrial Park is now
operational. Future plans include a research center at
the Qatar Service and Technology Park.
We increased regional headcount by 37 percent in 2008.
Strengthening key growth areas with localized talent
continues to be a focus of our strategy in 2009. We will
build our competencies in the region by increasing tech-
nical training across all product lines and continuing to
implement our training program for graduate engineers.
15
16
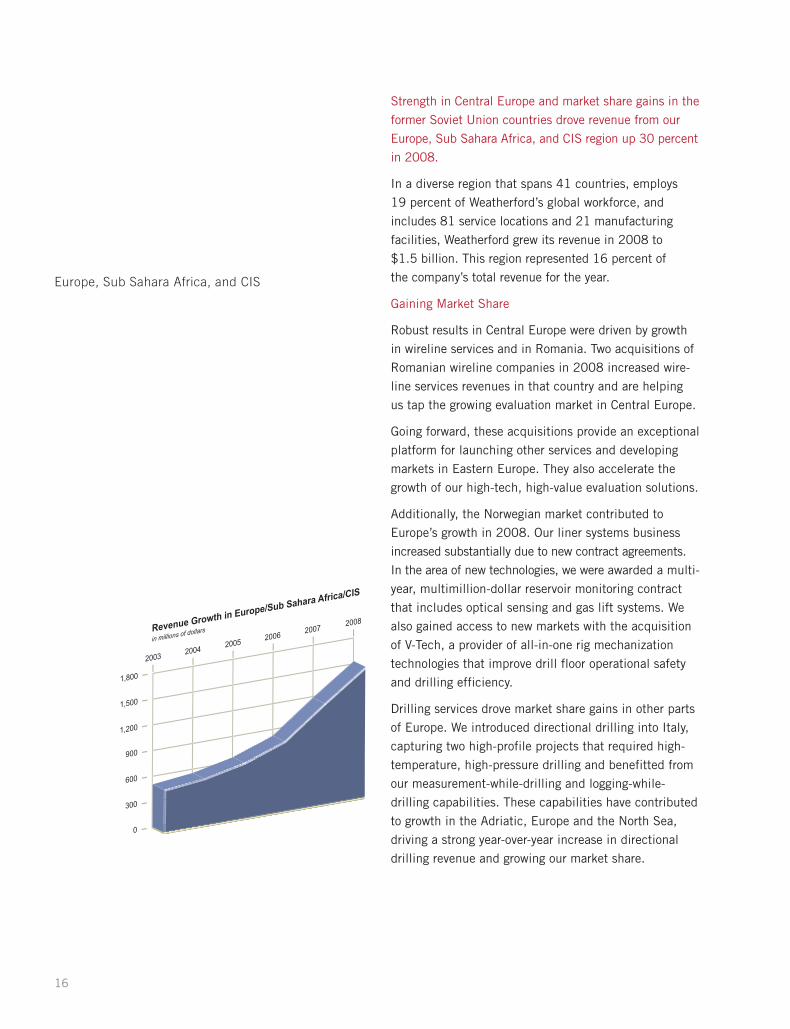
Europe, Sub Sahara Africa, and CIS
Strength in Central Europe and market share gains in the
former Soviet Union countries drove revenue from our
Europe, Sub Sahara Africa, and CIS region up 30 percent
in 2008.
In a diverse region that spans 41 countries, employs
19 percent of Weatherford’s global workforce, and
includes 81 service locations and 21 manufacturing
facilities, Weatherford grew its revenue in 2008 to
$1.5 billion. This region represented 16 percent of
the company’s total revenue for the year.
Gaining Market Share
Robust results in Central Europe were driven by growth
in wireline services and in Romania. Two acquisitions of
Romanian wireline companies in 2008 increased wire-
line services revenues in that country and are helping
us tap the growing evaluation market in Central Europe.
Going forward, these acquisitions provide an exceptional
platform for launching other services and developing
markets in Eastern Europe. They also accelerate the
growth of our high-tech, high-value evaluation solutions.
Additionally, the Norwegian market contributed to
Europe’s growth in 2008. Our liner systems business
increased substantially due to new contract agreements.
In the area of new technologies, we were awarded a multi-
year, multimillion-dollar reservoir monitoring contract
that includes optical sensing and gas lift systems. We
also gained access to new markets with the acquisition
of V-Tech, a provider of all-in-one rig mechanization
technologies that improve drill floor operational safety
and drilling efficiency.
Drilling services drove market share gains in other parts
of Europe. We introduced directional drilling into Italy,
capturing two high-profile projects that required high-
temperature, high-pressure drilling and benefitted from
our measurement-while-drilling and logging-while-
drilling capabilities. These capabilities have contributed
to growth in the Adriatic, Europe and the North Sea,
driving a strong year-over-year increase in directional
drilling revenue and growing our market share.

Romania’s massive reserves require efficient hydrocarbon
recovery, which Weatherford is positioned to deliver through
services such as artificial lift systems, directional drilling,
wireline, and completion.
Romania’s massive reserves require efficient hydrocarbon
recovery, which Weatherford is positioned to deliver through
services such as artificial lift systems, directional drilling,
wireline, and completion.
17

18
Mikhail Gelfgat, global business unit manager for aluminum
alloy tubulars, is a pioneer in the development of high-
strength aluminum alloys, a technology that Weatherford
gained from the 2008 acquisition of Aquatic Company.
This acquisition enhances Weatherford’s portfolio in three
ways: research and engineering capabilities, particularly
in the areas of drilling and well construction technology;
expansion of Weatherford’s applications engineering
infrastructure in Russia; and expertise in the application
of high-strength aluminum alloys, especially for deep,
vertical wells or long, high-angle wells.

In addition to wireline and drilling services, artificial
lift, deliquification systems, and Weatherford’s legacy
services such as tubular running will propel growth
in Europe. Specialized markets such as gas storage
and geothermal activities also represent significant
opportunities for us.
Capturing Integrated Opportunities
National oil companies seeking end-to-end solutions
that deliver efficiency and value are among the key
forces driving markets in Central Europe and Russia.
Our strong focus on capturing integrated project
opportunities produced several major wins in 2008.
In Russia, where we entered the rig market during
2008, our strategic coupling of rigs with other products
and services delivered results. A major contract awarded
during the year encompasses contract drilling, pressure
control, and tubular running services. We see additional
pull-through opportunities for wireline, fishing, and
Controlled Pressure Drilling® and well testing services.
In 2009, we will execute contracts in Russia,
Azerbaijan, and the Ukraine for rigs and associated
products and services.
In Europe, our most significant integrated projects are
for Schoonebeek, a $35 million redevelopment contract
in Holland, and a brownfield redevelopment contract in
Romania. Both contracts combine several of our well
construction, completion, production and intervention
services and products. We also developed a strategy
with our drilling rigs business to bring rigs into the
region in 2009. These additions will help drive our
integrated service packages in Romania and West Africa
this year and beyond.
Commercializing New and Acquired Technologies
Weatherford is reaping strong benefits from some
strategic acquisitions with high-potential technologies.
In 2008, we acquired Aquatic Company, a Russian
company that expanded our engineering infrastructure
in Russia and increased our expertise in the application
of high-strength aluminum alloys. We now are exploring
worldwide opportunities for Aquatic’s technology in
deepwater markets like Brazil, Gulf of Mexico and
West Africa.
Weatherford’s pipeline and specialty services product
line has enriched the scope of its services and has been
awarded a contract for a large pipeline project – the
East Siberian Pacific Ocean pipeline. Our acquisition of
NGKS®, a supplier of inline pipeline inspection tools,
has made a meaningful contribution to Weatherford’s
portfolio, and we are now selling our inline inspection
technology through Weatherford’s infrastructure globally.
We also introduced some new technologies into the
Russian market, including fracturing, coiled tubing
and rig mechanization, as well as Expandable Sand
Screens (ESS®). The success of ESS is paving the way
for the introduction of another expandable technology –
expandable tubulars – into the Russian market in 2009.
Our intelligent completion technology continues to gain
traction in several markets. In West Africa, we completed
the world’s first subsea fiber-optic installation in Angola.
In the Norwegian North Sea, we installed the deepest
set optical pressure/temperature gauge to a depth of
23,596 feet (7,192 meters).
Building for the Future
To support our ongoing growth, we continue to add
facilities throughout the region. We opened a
multi million-dollar manufacturing facility in Cyprus
for expandable completions as well as for our pipeline
and specialty services business. This location allows
for more rapid deployment of our technology to oil-
producing nations in the Middle East and parts of
continental Europe.
In Russia, we are investing in the development of our
workforce, which grew by approximately 80 percent
during 2008 and is now more than 95 percent local.
We have established a training center in partnership
with the Samara State Technical University to build
technical competencies and enhance the expertise of
our personnel. Located near the university, the Samara
training center serves students as well as Weatherford
employees, providing visibility that will attract new
talent to the company.
19

Latin America
Chicontepec, located in the Veracruz and Pueblo
states of Mexico, is one of Weatherford’s largest
integrated drilling projects. Our strengths on the
project include a unique mix of drilling rigs, an
innovative approach to drilling, and a relentless
focus on efficiency.
20

Growth across all product lines and countries propelled
revenue in Latin America to $1.2 billion in 2008, up
37 percent from the previous year.
Weatherford’s Latin America region has shown tremen-
dous growth. Now including ten countries, 18 percent
of the company’s total workforce, 103 service locations
and ten manufacturing facilities, the region has more
than doubled its revenue over the past three years.
With growth of 37 percent in 2008 alone, revenue
from the region reached $1.2 billion, 13 percent of
the company’s total.
We achieved growth across almost all product lines and
in almost all countries. We saw particular strength in
directional and underbalanced drilling, integrated
drilling, artificial lift and tubular running services. We
continue to expand our product and service offerings
throughout the region.
Our drilling services in Latin America had a strong finish
to the year, primarily attributed to Mexico’s onshore
and offshore operations, and a significant increase in
logging while drilling and rotary steerable revenue in
Venezuela. We expanded our wireline services across
most Weatherford locations, adding Ecuador and Peru
to our geographical portfolio, leveraging our Compact™
Services technology to fuel a triple-digit open-hole
revenue increase. We have introduced stimulation
services in Argentina and Mexico, and we are applying
technology from acquisitions in Russia to our pipeline
and specialty services business in Mexico.
An $860 Million Win in Mexico
With the award of two project management contracts
valued at $860 million, Mexico’s Chicontepec oil play
became the greatest success story of the year in Latin
America and one of the company’s largest projects
worldwide. Our contracts represent a substantial share
of currently budgeted expenditures at Chicontepec and
mark a major success in our goal of developing business
that uses a broad spectrum of the company’s capabilities.
Under the contracts, Weatherford will drill up to
600 wells in a geologically challenging region, providing
integrated services that include many Weatherford
products and services such as: rigs, drilling fluids, well-
heads, cementing hardware, tubular running, directional
drilling, stimulation, well testing, artificial lift, cuttings
disposal, wireline services, and third-party services such
as cementing and workover rigs.
Our start-up operations at Chicontepec have been a model
of flexibility and agility. Within five months of the June
2008 contract award, we had recruited 1,000 people,
built a 50,000-square-foot (4,645 square meter) base
and mobilized 20 rigs, many of which are state-of-the-
art. Equipped for speed and efficiency, the new-build
rigs feature skidding systems that dramatically reduce
the time required to move from one well slot to another.
Positioned for the Future
With a strong focus during 2008 on building an inte-
grated organization, hiring and developing employees,
and adding equipment and facilities, the Latin America
region is positioned for growth on numerous fronts.
Chicontepec, a large field in the early stages of develop-
ment where plans call for drilling up to 1,800 wells
annually over the next decade, represents attractive
ongoing business opportunities. We see additional
promising opportunities within the region for the
continued application of multiple product and
service lines.
21

22
North America
the Haynesville shale, our directional drilling technologies
worked continuously for 119 hours at a bottomhole
temperature of 320°F (160°C) while our fracturing
technologies nearly doubled expected production for
another well.
Deepwater Opportunities
The quest for energy resources in the Gulf of Mexico
is taking drillers into deeper water where costs and
risks are high. We are combining classic Weatherford
services with proven new technologies that reduce non-
productive rig time, enable drillers to reach new depths
and add pull-through revenue for the company. In addi-
tion to extreme environment logging capabilities and
products that perform in the harshest environments,
we offer hazard mitigation technologies that can turn
“undrillable” reserves into new energy resources.
During 2008, we continued to set deepwater records
and pursue industry “firsts.” We achieved a world-
record logging-while-drilling triple combo run where
maximum operating pressure reached 32,600 pounds
per square inch (psi) and static temperature exceeded
400°F (200°C). New contracts in the Gulf of Mexico
that will begin in 2009 include a multimillion-dollar
award for two of the latest-generation deepwater rigs. The
contract includes mechanized tubular running services,
cementing products, and liner system work over a four-
year period.
For seven of the new deepwater mobile offshore drilling
unit projects that will come on line in 2009 in the
Gulf of Mexico, we were awarded 100 percent of the
cementing products and 70 percent of the tubular
running services work.
We achieved 13 percent revenue growth in North
America’s mature markets, and we are uniquely
positioned on several fronts.
Weatherford’s North America region, which encompasses
our operations in Canada, the United States and the Gulf
of Mexico, employs 34 percent of Weatherford’s work-
force and includes 506 service locations and 64 manu-
facturing facilities. An established market with many
mature fields, the region is growing at a slower pace
than international markets; however, it is an important
component of our business that accounted for $4.5 bil-
lion, or 46 percent, of our 2008 revenue. We are lever-
aging a strong position in our traditional businesses to
launch offerings that serve emerging needs.
Growth in New Gas
Unconventional gas plays, including shale gas, tight gas
and coalbed methane, are a leading contributor to our
growth in North America. In fact, shale plays represent
the fastest-growing market segment in the U.S., which
has some of the world’s largest shale gas reserves.
These reserves are more challenging to extract. We offer
expertise, technologies, and efficiencies that contribute
to the viability of shale gas projects across their life
cycle. With sophisticated laboratory and geoscience
capabilities, we lend expertise during prospecting. At
later stages, our horizontal drilling prowess and compre-
hensive fracturing and stimulation services enable the
economic extraction of resources.
For example, in the Mancos shale, our Controlled
Pressure Drilling® and Engineered Chemistry® technolo-
gies reduced drilling costs by 50 percent. In and near

23
Nicole Lehocky is manager of the Canadian
Geoscience team that is providing state-of-
the-art borehole imaging and interpretation
of the highly complex network of channels
within the oil sands of Northern Alberta.
This analysis ultimately helps our
clients make better decisions
regarding optimal horizontal well
placement, a critical technique
used to maximize drainage
from aging reservoirs.

Product & Service Portfolio
Our clients face three core challenges on a daily basis:
• maximizing economic recovery from mature conventional reservoirs;
• efficiently producing heavy oil, tight gas, shale gas and oil shale from unconventional reservoirs;
• managing reservoir development in extreme environ-ments including ultra deepwater and arctic plays
To help them manage these issues, particularly in adownturn, Weatherford is focused on providing the technologies, techniques and working practices thatstrip unnecessary cost and risk out of the well’s lifecycle. These products and services are designed to solvethe most urgent well challenges and are backed by oneof the strongest patent portfolios in the oilfield sector. The following four pages highlight some of the fasting-growing technologies, in the context of our ten servicelines. The service lines are listed in the order of revenue generated.
Drilling ServicesIncludes directional drilling services that are particularlyapplicable for draining reservoirs that require complexwell trajectories. These applications range from drillinghorizontal wells for heavy oil production on land to navi-gating salt domes in deepwater plays. Market differentia-tors include world-record-setting logging-while-drilling,measurement-while-drilling and rotary-steerable systemsthat efficiently target formations and drill wells to target locations. These technologies also can be pairedwith our Controlled Pressure Drilling® (CPD®) systems,which include a market-leading suite of equipment, fluid technologies, engineering and operational services, tohelp our clients mitigate drilling hazards, maximize well
productivity and increase rate of penetration. Long term,the drilling services market is expected to continueexpanding, since clients are trying to maximize recoverywhile maintaining attractive field development economicsand reduced environmental impact.
Artificial LiftPrimarily applicable to oil wells with depleting reservoirpressure. Weatherford is the market leader in artificiallift systems, which supplement the natural reservoirpressure to bring the produced oil to the surface. We arethe only company that can provide all forms of lift to theindustry. We also offer specific controllers, processesand software that can control the systems and help optimize production. Approximately 70 percent of the world’s reservoirs currently are on some form of artificial lift, and this percentage will continue to rise as reservoirs mature. With this aging process comes anincrease in associated production challenges, includingencroaching water and depleting reservoir pressure.These factors serve as a powerful secular growth dynamic for our production optimization expertise and technologies.
Well ConstructionConventional casing running and handling services, linersand cementing equipment are essential components of every well design. Our traditional market-leading services and technologies are now being augmented withinnovations such as mechanized rig systems that enhancepersonnel safety and improve drilling efficiency, expand-able tubular technology that mitigates drilling hazardsand helps clients remediate mature wells, and aluminumalloy tubular products with superior corrosion resistancein aggressive drilling environments, including the growingmarkets of ultradeep and extended-reach wells.
Drilling ToolsIncludes market-leading patented tools such as rotatingcontrol devices, drilling jars, and torque and drag reduc-tion systems that clients can rent without the cost ofholding the equipment in their inventory.
CompletionCompleting a well encompasses installing a high-integrityflow conduit from reservoir to surface, equipped with specialized components such as packers, flow controls
24

Real-time Operations
Weatherford’s real-time operations centers, as pictured here, ensure the best decisions at the right time by enablingmonitoring of drilling from a central location. Their dedicatedengineers and 24/7 operations strengthen quality assurance,enable early detection and mitigation of problems, and createefficiencies by reducing travel to well sites. They are an integral piece of Weatherford’s growing geosteering servicesportfolio, which spans forward modeling capabilities to optimize pre-drill plans and drilling services that optimize well placement, including the Revolution® rotary-steerable system, directional drilling motors, and a full complement of geosteering sensors.
25

and safety valves, through stimulation techniques thatmaximize a well’s production potential, to well screentechnologies that protect from the damaging effects ofsand. This market is characterized by an increasingneed for higher-specification completions propelled byhigher-pressure and -temperature reservoirs and moreaggressively produced fluids. To meet this need, wehave evolved our portfolio from one of basic cased-holecommodity products to one that focuses more heavily onpremium offerings for deepwater and high-pressure/high-temperature environments. Market differentiatorsinclude our Expandable Reservoir Completion (ERCTM)System, which helps clients manage oil and gas produc-tion from multizone reservoirs; swellable completiontechnology that can conform to irregularly shaped wellbores; and exclusive, worldwide manufacturingagreements to expedite the introduction of emergingreservoir completion technology to the marketplace.
Wireline & Evaluation ServicesMeasures the physical properties of underground forma-tions to determine the location and potential deliverabil-ity of oil and gas from a reservoir. Current challengesinclude acquiring log data from wellbores exhibitingproblematic hole conditions that impede conveyance oflogging tools or are in geographically remote locationswhere operational logistics are difficult. Weatherford’sanswer, as well as our market differentiator, is the CompactTM suite of logging tools, which are smaller,slimmer and easier to handle than conventional loggingtechnologies. Their size allows them to be conveyed intothe reservoir by a number of methods other than wire-line, including drill pipe and coiled tubing. This flexibil-ity of conveyance makes them well suited for today’sremote and highly deviated wells. Our evaluation capabilities also include the industry’s most modernfleet of surface logging units. This unique portfolio oftechnologies improves operational efficiency by supply-ing operators with more reliable and more accurate geological and drilling engineering information at thewell site, ultimately enhancing formation evaluation and reducing operating time and risk.
Re-entry & Fishing ServicesHelps clients repair wells or prolong production of oiland natural gas reserves. Weatherford’s market-leadingre-entry services and products permit drilling, comple-tion and remediation functions from existing wellbores.
This ability is critical to the growing trend of horizontaldrainage applications involving the re-drilling of maturereservoirs. Market-leading fishing services remove obstructions from the wellbore through experiencedfishing personnel and a comprehensive line of fishingand milling tools.
Stimulation & ChemicalsUses advanced chemical technologies and services toenhance production. Hydraulic fracturing is a stimula-tion technique routinely performed on oil and naturalgas wells in low-permeability reservoirs to increase productivity and hydrocarbon recovery. Our EngineeredChemistry® systems are applied throughout the lifecycle of oil and gas production to optimize drilling andcompletion operations, enhance production andincrease efficiency of other industrial processes. Thesefluid systems can be customized for the client and thewell, one of our differentiators in the marketplace. Wealso can provide the engineered integration of multipleWeatherford technologies, products and services relatedto fracturing, ranging from wireline, plugs and packers to coiled tubing and micro seismic frac mapping, givingclients a more streamlined operation.
Integrated DrillingEncompasses a large and diversified fleet of contractdrilling rigs as well as project management for associ-ated services such as directional drilling, ControlledPressure Drilling®, coiled tubing, and re-entry services.Clients benefit from, and growth exists in, Weatherford’sability to leverage rig operating experience with ourrange of drilling and intervention services, resulting in greater efficiency across a well’s life cycle.
Pipeline & Specialty ServicesIncludes pre-commissioning systems that ensure criticalpreparation in growing deepwater and remote applica-tions; commissioning services that deliver product efficiently; maintenance services such as inspection,cleaning and testing that maintain and prolong the lifecycle of our clients’ assets; shutdown services that reducecost, risk and time; and decommissioning services thathandle asset dismantling and abandonment withoutimpacting the environment. Investment in new productionfacilities and pipeline infrastructure, coupled with theaging of existing assets worldwide, means continuedgrowth in this market sector.
26

Stimulation & Chemical Services
The emerging shale plays in the United States and Canadaare one of the bright spots in the North American market for 2009 and beyond. Our fracture stimulation services, pictured here, are critical to the production of most shalewells because they open channels in the reservoir so that oil and gas can be recovered. Weatherford’s market differen-tiators include the youngest pressure pumping fleet of themajor service companies, and unique chemistry, includingthe commercialization in 2008 of two new reservoir stimula-tion chemicals for shale fracturing that are focused onenhanced conductivity and flowback of water fracturing jobs.
27

Officers &Directors
Board of Directors
Bernard J. Duroc-DannerChairman of the Board, President and Chief Executive OfficerWeatherford International Ltd.
Nicholas F. BradyChairmanDarby Overseas Investments (Private investment company)
David J. ButtersPresident, Chairman and CEONavigator Holdings Ltd. (International shipping company)
William E. MacaulayChairman and Chief Executive OfficerFirst Reserve Corporation (Private equity firm focusing on the energy industry)
Robert B. MillardManaging MemberRealm Partnership LLC (Private investment partnership)
Robert K. Moses, Jr.Private InvestorBlack Jack Resources, Inc. (Private investment company)
The Hon. Robert A. RayneChief Executive DirectorLondon Merchant Securities plc(Property development and venture capital company)
Corporate Officers
Bernard J. Duroc-DannerChairman of the Board, President and Chief Executive Officer
Andrew P. BecnelSenior Vice President and Chief Financial Officer
Stuart E. FergusonSenior Vice President – Reservoir & Production and Chief Technology Officer
Burt M. MartinSenior Vice President, General Counsel and Secretary
Keith R. MorleySenior Vice President – Well Construction & Operations Support and Chief Compliance & Safety Officer
Jessica AbarcaVice President – Accounting and Chief Accounting Officer
M. David ColleyVice President – Artificial Lift Systems
Carel W. J. HoyerVice President – Well Construction Services
Jay HudginsVice President – Tax
28

WEATHERFORD INTERNATIONAL LTD.
Weatherford International Ltd. is one of the world’s leading providers of equipment and services used for thedrilling, completion and production of oil and natural gas wells. The following is a discussion of our business,including our strategy for growth, the markets in which we operate and the products and services we offer. We alsohave included a discussion of our financial results, the trends affecting our results and our financial condition.
Page
Business (including strategy, markets and products and services) . . . . . . . . . . . . . . . . . . . . . . . . . . . . . . 1
Forward-Looking Statements. . . . . . . . . . . . . . . . . . . . . . . . . . . . . . . . . . . . . . . . . . . . . . . . . . . . . . . . . 10
Risk Factors . . . . . . . . . . . . . . . . . . . . . . . . . . . . . . . . . . . . . . . . . . . . . . . . . . . . . . . . . . . . . . . . . . . . . 12Properties . . . . . . . . . . . . . . . . . . . . . . . . . . . . . . . . . . . . . . . . . . . . . . . . . . . . . . . . . . . . . . . . . . . . . . . 17
Common Share Prices and Dividend History . . . . . . . . . . . . . . . . . . . . . . . . . . . . . . . . . . . . . . . . . . . . . 19
Selected Financial Data . . . . . . . . . . . . . . . . . . . . . . . . . . . . . . . . . . . . . . . . . . . . . . . . . . . . . . . . . . . . 21
Management’s Discussion and Analysis of Financial Condition and Results of Operations . . . . . . . . . . . 22
Financial Statements . . . . . . . . . . . . . . . . . . . . . . . . . . . . . . . . . . . . . . . . . . . . . . . . . . . . . . . . . . . . . . . 39
This report is part of our Annual Report on Form 10-K that we have filed with the Securities and ExchangeCommission. We have omitted certain parts of that filing in this report, such as the cover page and exhibit index. Acomplete copy of our Annual Report on Form 10-K is available on the SEC’s website at www.sec.gov or free ofcharge on our website at www.weatherford.com. We will also provide to any shareholder a copy of that reportwithout charge upon written request. Please mail your requests to U.S. Investor Relations at 515 Post OakBoulevard, Houston, Texas 77027. Copies of exhibits will also be provided upon written request subject toreasonable charges for copying and mailing.
If, after reviewing this report, you have any questions regarding our businesses or would like additionalinformation on us or the products and services we offer, please contact our U.S. Investor Relations department at theaddress and telephone number listed on page 1 of the following report or visit our website at www.weatherford.com.
%%TRANSMSG*** Transmitting Job: H65817 PCN: 000010000 ***%%PCMSG| |00003|Yes|No|03/16/2009 14:40|0|0|Page is valid, no graphics -- Color: N|

PART I
Item 1. Business
Weatherford International Ltd. (NYSE:WFT) is one of the world’s leading providers of equipment andservices used in the drilling, evaluation, completion, production and intervention of oil and natural gas wells. Wewere originally incorporated in Delaware in 1972, and as a result of our corporate reorganization in 2002, are nowincorporated in Bermuda. Many of our businesses, including those of Weatherford Enterra, have been operating formore than 50 years. We anticipate that, during the first quarter of 2009, we will complete a transaction in whichWeatherford International Ltd., the Bermuda exempted company (“Weatherford-Bermuda”), will become a wholly-owned subsidiary of Weatherford International Ltd., a Swiss joint-stock company (“Weatherford-Switzerland”),and holders of our common shares will receive one registered share of Weatherford-Switzerland for each commonshare of Weatherford-Bermuda that they hold.
When referring to Weatherford and using phrases such as “we” and “us,” our intent is to refer to WeatherfordInternational Ltd. and its subsidiaries as a whole or on a regional basis, depending on the context in which thestatements are made.
We operate in approximately 100 countries, which are located in nearly all of the oil and natural gas producingregions in the world. Our operational performance is segmented and reviewed on a geographic basis, and we reportthe following regions as reporting segments: (1) North America, (2) Latin America, (3) Europe/West Africa/theCommonwealth of Independent States (“CIS”) and (4) Middle East/North Africa/Asia.
Our growth strategy has included a mix of organic product and service development, the acquisition of keytechnologies, products and services and several notable divestitures. One of our most substantial acquisitions was inAugust 2005, when we acquired Precision Energy Services and Precision Drilling International. Precision EnergyServices broadened our wireline and directional capabilities and strengthened our controlled pressure drilling andtesting product lines. Precision Drilling International added land rigs to our portfolio, primarily in the EasternHemisphere.
Our divestitures include the April 2000 spin-off of our Drilling Products Division to our shareholders through adistribution of the stock of our Grant Prideco, Inc. subsidiary. In February 2001, we completed the merger ofessentially all of our Compression Services division into a subsidiary of Universal Compression Holdings, Inc. inexchange for 13.75 million shares of Universal common stock. During 2004 and 2005, we sold our interest inUniversal Compression Holdings, Inc. In 2005, we sold our non-core Gas Services International compressionfabrication business. In 2008, we finalized the divestiture of our oil and gas development and production business.
Our principal executive offices are located at 515 Post Oak Boulevard, Houston, Texas 77027 and our telephonenumber at that location is (713) 693-4000. We anticipate relocating our principal executive offices to Switzerland inthe first quarter of 2009. However, certain corporate functions, including our U.S. Investor Relations department, willremain at the foregoing address and telephone number. Our Internet address is www.weatherford.com. Generalinformation about us, including our Corporate Governance Policies and charters for the committees of our board ofdirectors, can be found on our Web site. On our Web site we make available, free of charge, our annual reports onForm 10-K, quarterly reports on Form 10-Q, current reports on Form 8-K, and amendments to those reports filed orfurnished pursuant to Section 13(a) or 15(d) of the Exchange Act as soon as reasonably practicable after weelectronically file or furnish them to the SEC. The public may read and copy any materials we have filed with the SECat the SEC’s Public Reference Room at 100 F Street, NE, Room 1580, Washington, DC 20549. Information on theoperation of the Public Reference Room may be obtained by calling the SEC at 1-800-SEC-0330. The SEC maintainsan internet site that contains our reports, proxy and information statements, and our other SEC filings. The address ofthat site is www.sec.gov.
The following is a summary of our business strategies and the markets we serve. We have also included adescription of our products and services offered and our competitors. Segment financial information appears in“Item 8. Financial Statements and Supplementary Data — Notes to Consolidated Financial Statements — Note 18.”
1
%%TRANSMSG*** Transmitting Job: H65817 PCN: 002000000 ***%%PCMSG|1 |00008|Yes|No|02/24/2009 15:47|0|0|Page is valid, no graphics -- Color: N|

Strategy
Our primary objective is to provide our shareholders with above-average returns on their investment throughincome growth and asset appreciation.
Principal components of our strategy include:
• Continuously improving the efficiency, productivity and quality of our products and services and theirrespective delivery in order to grow revenues and operating margins in all of our geographic markets at a rateexceeding underlying market activity;
• Through a commitment to innovation and invention, developing and commercializing new products andservices capable of meeting evolving needs of our customers; and
• Further extending our global infrastructure in scope and scale at a level consistent with meeting customerdemand for our products and services in an efficient manner.
Markets
We are a leading provider of equipment and services to the oil and natural gas exploration and productionindustry. Demand for our industry’s services and products depends upon the number of oil and natural gas wellsbeing drilled, the depth and drilling conditions of wells, the number of well completions and the level of workoveractivity worldwide.
During the mid-1980s, the drilling industry contracted sharply, correcting a condition of significant overca-pacity that existed in the supply of oilfield service and equipment. For the past 20 years, global rig count has cycledup and down with factors such as world economic and political trends that influence supply and demand for energy,the price of oil and natural gas and the level of exploration and drilling for those commodities.
As a result of the maturity of the world’s oil and natural gas reservoirs, accelerating production decline ratesand the focus on complex deepwater prospects, technology has become increasingly critical to the marketplace.Clients continue to seek, test and prove production-enabling technologies at an increasing rate. Technology is animportant aspect of our products and services, as it helps us provide our clients with more efficient tools to find andproduce oil and natural gas. We have invested a substantial amount of our time and resources in building ourtechnology offerings. We believe our products and services enable our clients to reduce their costs of drilling andproduction and/or increase production rates. Furthermore, these offerings afford us additional opportunities to sellour traditional core products and services to our clients.
Product Offerings
Our product offerings can be grouped into ten service lines: 1) artificial lift systems; 2) drilling services;3) well construction; 4) drilling tools; 5) completion systems; 6) wireline and evaluation services; 7) re-entry andfishing; 8) stimulation and chemicals; 9) integrated drilling; and 10) pipeline and specialty services. The followingdiscussion provides an overview of our various product offerings. With the exception of integrated drilling, ourproduct line offerings are provided in all of our regional segments. Our integrated drilling product line is primarilyoffered outside of North America.
Artificial Lift Systems
Artificial lift systems are installed in oil wells and, to a lesser extent, natural gas wells that do not havesufficient reservoir pressure to raise the produced hydrocarbon to the surface. These systems supplement the naturalreservoir pressures to produce oil or natural gas from the well. There are six principal types of artificial lifttechnologies used in the industry. With the exception of our electrical submersible pumps business, which we soldto an equity investment partner in January 2008, we are able to provide all forms of lift, including progressing cavitypumps, reciprocating rod lift systems, gas lift systems, hydraulic lift systems, plunger lift systems and hybrid liftsystems. We also offer wellhead systems and production optimization.
2
%%TRANSMSG*** Transmitting Job: H65817 PCN: 003000000 ***%%PCMSG|2 |00006|Yes|No|02/21/2009 19:30|0|0|Page is valid, no graphics -- Color: N|
Progressing Cavity Pumps — A progressing cavity pump (PCP) is a downhole pump driven by an above-ground electric motor system connected to it by a coupled rod or continuous rod string. These pumps are designed towork in wells of depths up to 12,000 feet with production between 10 and 4,500 barrels of oil per day. PCPs areparticularly useful in heavy-oil-producing basins around the world.
Reciprocating Rod Lift Systems — A reciprocating rod lift system is an artificial lift pumping system that usesan above-ground mechanical unit connected to a sucker rod and a downhole pump. It uses an up-and-down suctionprocess to lift the oil from the reservoir. Reciprocating rod lift is used primarily for the production of oil from wellsof depths up to 14,000 feet and production rates from 20 to 6,000 barrels per day.
Gas Lift Systems — Gas lift is a form of artificial lift that uses natural gas to lift oil in a producing reservoir tothe surface. The process of gas lift involves the injection of natural gas into the well through an above-groundinjection system and a series of downhole mandrels and gas lift valves in the production tubing string. The injectedgas acts as the lifting agent for the oil. Gas lift systems are used primarily for offshore wells (including deepwaterand ultra-deepwater) and for wells that have a high component of gas in the produced fluid or have a gas supply nearthe well. Gas lift systems are designed to operate at depths up to 18,000 feet with volumes up to 50,000 barrels of oilper day.
Hydraulic Lift Systems — A hydraulic lift oil pumping system uses an above-ground surface power unit tooperate a downhole hydraulic pump (jet or piston) to lift oil from the reservoir. These systems are designed for wellsof depths up to 17,000 feet and volumes up to 20,000 barrels per day. Hydraulic pumps are well suited for wells withhigh volumes and low solids.
Plunger Lift Systems — Plunger lift is the only artificial lift method that requires no assistance from outsideenergy sources. The typical system consists of a plunger (or piston), top and bottom bumper springs, a lubricator anda surface controller. As the plunger travels to the surface, it creates a solid interface between the lifted gas below andproduced fluid above to maximize lift energy. Plunger lift is a low-cost, easily maintained method of lift. It isparticularly useful for dewatering gas wells and increasing production from wells with emulsion problems. Plungerlift also keeps wells free of paraffin and other tubing deposits and can be used to produce a well to depletion atdepths of 19,000 feet and volumes up to 200 barrels per day.
Hybrid Lift Systems — We offer a variety of hybrid artificial lift systems which are engineered for specialapplications and may incorporate two or more of the artificial lift methods described above.
Wellhead Systems — We offer a line of conventional wellhead equipment and valves manufactured to the latestAPI industry specifications and client requirements, including conventional surface wellheads through 20,000 psi;gate valves from 2,000 to 20,000 psi; complete wellhead systems (drill-through, multi-bowl, unitized and mud-line); and all the accessories and aftermarket services to go with them.
Production Optimization — Production optimization is the process of monitoring oil and natural gas fields,and interpreting the resulting data to inform production and reservoir management decisions. The ultimate goal is toassist operators in making better decisions that maximize profits through improved optimized well production andmaximized reservoir recovery. The major benefits of production optimization are increased production withdecreased operating costs resulting in increased bottom-line profits for producers.
Weatherford offers products for optimizing at the well, reservoir and field level. Both hardware and softwareare combined into solutions that fit the customer’s specific needs for optimizing production.
Well Optimization — For wellsite intelligence, we offer specific controllers for each type of artificial lift.These controllers contain computers with specific logic to control the well in response to changes in the reservoir,artificial-lift equipment or well completion. The desktop software provides advanced analytical tools that allow theoperator to make changes by controlling the well directly or by changing the parameters that the controller is usingto operate the well. In 2007, we enhanced our plunger lift controller and added a new variable speed drive forprogressing cavity pumps (PCP), rod pumping, and electric submersible pumps (ESP).
Flow Measurement — Our Production Optimization group develops metering and software solutions to supplyreal-time production information to the operator, allowing accurate production measurements as a part of individualwell and field optimization.
3
%%TRANSMSG*** Transmitting Job: H65817 PCN: 004000000 ***%%PCMSG|3 |00006|Yes|No|02/21/2009 19:30|0|0|Page is valid, no graphics -- Color: N|

Field Optimization — We provide tools for optimizing workflow. These software tools assist the operator intracking the operations needed for optimal field management. Tasks such as chemical injection, well workovers andinjection allocation of injection gas can easily generate unnecessary expenses by inefficient prioritization of tasks,poor recordkeeping and lack of analysis of the effectiveness of the total field operations. The combination of ourexperienced consultants and advanced software tools help the operator optimize operations for entire fields.
Drilling Services
These capabilities include directional drilling, Controlled Pressure Drilling» (CPD») & Well Testing, drilling-with-casing (DwCTM) and drilling-with-liner (DwLTM) systems and surface logging systems.
Directional drilling involves the personnel, equipment and engineering required to control the direction of awellbore. Directional drilling allows drilling of multiple wells from a single offshore platform or a land-based padsite. It also allows drilling of horizontal wells and penetration of multiple reservoir pay zones from a singlewellbore. We supply a range of specialized, patented equipment for directional drilling, including:
• Measurement while drilling (MWD) and logging while drilling (LWD) — MWD and LWD measure,respectively, wellbore trajectory and formation properties, in real time, while the well is being drilled.
• Rotary steerable systems (RSS) — These systems allow control of wellbore trajectory while drilling at thesurface with continuous rotation of the drillstring. They are crucial for enabling long, step-out, directionalwells and for reducing completion-running complications resulting from abrupt hole-angle changes causedby conventional drilling methods.
• Directional drilling services — These services include surveying, design and operational support fordirectional and horizontal drilling; products include drilling motors and other associated equipment.
Our directional drilling capabilities are supported by our engineering facility in Houston, which housesqualified engineers, scientists and technicians, all focused on developing technologies for the MWD/LWD anddirectional drilling markets, both land based and offshore.
Controlled Pressure Drilling» (CPD») — Weatherford’s CPD offerings are provided through three tech-niques: 1) Managed Pressure Drilling, 2) Underbalanced Drilling and 3) Air Drilling.
• Managed Pressure Drilling (MPD) — This technique provides an advanced form of primary well control,using a closed, pressurized fluid system that more precisely controls the wellbore pressure profile than mudweight adjustments alone. The main objective of MPD is to optimize drilling processes by decreasing non-productive time and mitigating drilling hazards.
• Underbalanced Drilling (UBD) — This technique is used in development, exploration and mature fieldapplications to minimize formation damage and maximize productivity. UBD is drilling with bottomholepressure that is maintained below reservoir pressure to intentionally invite fluid influx. This techniquepermits the reservoir to flow while drilling takes place, thereby improving well productivity by protectingthe formation from damage by the drilling fluids.
• Air Drilling — This technique applies reduced density fluid systems to drill sub-hydrostatically. Air drillingis used primarily in hard rock applications to reduce drilling costs by increasing the rate of penetration.
A full range of downhole equipment, such as high temperature motors, wireline steering tools, drillpipe, airrotary hammer drills, casing exit systems, downhole deployment valves and downhole data acquisition equipment,make our product offerings unique.
Well Testing — Well testing uses specialized equipment and procedures to obtain essential information aboutoil and gas wells after the drilling process has been completed. Typical information derived may include reservoirperformance, reservoir pressure, formation permeability, formation porosity and formation fluid composition.
A related application is our separation business, which supplies personnel and equipment on a wellsite torecover a mixture of solids, liquids and gases from oil and gas wells. These services are used during drilling, afterstimulation or after re-completion to clean up wells. The operator requires that a well be properly cleaned before
4
%%TRANSMSG*** Transmitting Job: H65817 PCN: 005000000 ***%%PCMSG|4 |00010|Yes|No|02/24/2009 12:43|0|0|Page is valid, no graphics -- Color: N|

undertaking a well test to ensure that the true deliverability of the well is attained and that debris and spentstimulation chemicals do not ultimately flow to the process plant.
Drilling-with-casing and drilling-with-liner systems — These systems allow operators to simultaneously drilland case oil and natural gas wells. Our DwC and DwL techniques eliminate downhole complexity, reducingexpensive rig modifications and the number of trips downhole. Consequently, drilling hazards are mitigated, wellconstruction is simplified, and productivity can be improved when drilling through the reservoir.
Surface Logging Systems — Often referred to as mud logging, this is a well-site service that uses fluid and gassamples along with drilling cuttings to evaluate the geology and geo chemistry of the formation as it is being drilled.The derived data and interpretation is used to help geologists and drillers ensure that the well is placed in the mostproductive formation to maximize ultimate well productivity.
Well Construction
This grouping includes the primary services and products required to construct a well and spans tubularrunning services, cementation tools, liner systems, solid tubular expandable technologies and aluminum alloytubular products.
Tubular Running Services — These services consist of a wide variety of tubular connection and installationservices for the drilling, completion and workover of an oil or natural gas well. We provide tubular handling,preparation, inspection and wellsite installation services from a single source. We offer a suite of products andservices for improving rig floor operations by reducing personnel exposure, increasing operational efficiency andimproving safety. We also specialize in critical-service installations where operating conditions, such as downholeenvironments and/or metallurgical characteristics, call for specific handling technology.
Cementation Tools — Cementing operations comprise one of the most expensive phases of well completion.We produce specialized equipment that allows operators to centralize the casing throughout the wellbore andcontrol the displacement of cement and other fluids. Our cementing engineers also analyze complex wells andprovide recommendations to help optimize cementing results.
Liner Systems — Liner hangers allow suspension of strings of casing within a wellbore without the need toextend the casing to the surface. Most directional wells include one or more liners to optimize casing programs. Weoffer both drilling and production liner hangers. Drilling liners are used to isolate areas within the well duringdrilling operations. Production liners are used in the producing area of the well to support the wellbore and to isolatevarious sections of the well.
Solid Tubular Expandable Technologies — Proprietary expandable tools are being developed for downholesolid tubular applications in well remediation, well completion and well construction. Our solid tubular expandableproducts include the MetalSkin» line and the HydraSkinTM System, MetalSkin systems are used for well cladding toshut off zones, retro-fit corroded sections of casing and strengthen existing casing. MetalSkin open-hole cladsystems are used for controlling drilling hazards such as unwanted fluid loss or influx and as slim-bore drillingliners. Slim-bore and, ultimately, monobore liner systems are designed to allow significant cost reductions byreducing consumables for drilling and completion of wells, allowing use of smaller rigs and reducing cuttingsremoval needs. The benefits are derived because of the potential of expandable technologies to significantly reduceor eliminate the reverse-telescoping architecture inherent in traditional well construction. The HydraSkin system isa hydraulic bottom-up expansion system that can be used for increased diameter efficiency in either planned orcontingency operations.
Aluminum Alloy Tubular Products — We design and manufacture aluminum alloy (AA) tubular goods fordrilling, production and completion. Unique physical and mechanical properties of aluminum alloys provide anumber of benefits, especially superior corrosion resistance in various aggressive environments and enhancedstrength-to-weight ratio, resulting in better drilling performance. Products range from Aluminum Alloy Drill Pipe,which is used in most drilling applications, but especially recommended for ultra deep and extended reach wells andrigs with limited load capacity, to drillpipe risers designed for drilling, production and completion operations. Theselarge diameter products possess high strength and significant corrosion resistance properties essential in aggressiveenvironments, such as deepwater wells.
5
%%TRANSMSG*** Transmitting Job: H65817 PCN: 006000000 ***%%PCMSG|5 |00009|Yes|No|02/24/2009 12:44|0|0|Page is valid, no graphics -- Color: N|

Drilling Tools
We design and manufacture patented tools, including our drilling jars, rotating control devices and otherpressure-control equipment used in drilling oil and natural gas wells. We also offer a broad selection of in-house orthird-party manufactured equipment for the drilling, completion and workover of oil and natural gas wells. We offerthese proprietary and nonproprietary drilling tools to our clients — primarily operators and drilling contractors —on a rental basis, allowing the clients to use unique equipment to improve drilling efficiency without the cost ofholding that equipment in inventory.
Our drilling tools include the following:
• Drillpipe and related drillstem tools, drill collars, heavyweight pipe and drilling jars;
• Downhole tools;
• Pressure-control equipment such as blowout preventers, high-pressure valves, accumulators, adapters andchoke-and-kill manifolds; and
• Tubular handling equipment such as elevators, spiders, slips, tongs and kelly spinners.
Completion Systems
We offer our clients a comprehensive line of completion tools and sand screens. These products and servicesinclude the following:
Completion Tools — These tools are incorporated into the tubing string used to transport hydrocarbons fromthe reservoir to the surface. We offer a wide range of devices for enhancing the safety and functionality of theproduction string, including permanent and retrievable packer systems, subsurface safety systems, flow controlsand tool string, specialized downhole isolation valves and associated servicing equipment. Over the past decade, wehave evolved our portfolio from one of basic cased-hole commodity products to one that focuses more heavily onpremium offerings for deepwater and high-pressure/high-temperature environments.
Sand Screens — Sand production often results in premature failure of artificial-lift and other downhole andsurface equipment and can obstruct the flow of oil and natural gas. To remedy this issue, we provide two differentsand screen approaches: conventional and expandable.
• Conventional sand screens — These products are used in the fluid-solid separation processes and have avariety of product applications. Our primary application of well screens is for the control of sand inunconsolidated formations. We offer premium, pre-pack and wire-wrap sand screens. We also offer aFloRegTM line of inflow control devices that balance horizontal wellbore production, ultimately maximizingreservoir drainage. We also operate the water well and industrial screen business of Johnson Screens. Servedmarkets include water well, petrochemical, wastewater treatment and surface water intake, mining andgeneral industrial applications.
• Expandable Sand Screens (ESS) — Our ESS» systems are proprietary step-change sand-control devices thatreduce cost and improve production. An ESS system consists of three layers, including slotted base pipe,filtration screens and an outer protective shroud. The system can be expanded using a fixed cone and/orcompliantly using our proprietary axial and rotary expansion system. This system aids productivity becauseit stabilizes the wellbore, prevents sand migration and has a larger inner diameter. ESS technology canreplace complex gravel-packing techniques in many sand-control situations.
Reservoir Optimization — Our intelligent completion technology (ICT) uses downhole optical and electronicsensing to allow operators to remotely monitor the downhole pressure, temperature, flow rate, phase fraction andseismic activity of each well and the surrounding reservoir. This advanced monitoring capability allows the operatorto monitor the reaction of the reservoir to the production of the well. Combining this monitoring with multiple-zonedownhole flow control allows field pressure management and shutoff of unwanted flows of water or gas.
6
%%TRANSMSG*** Transmitting Job: H65817 PCN: 007000000 ***%%PCMSG|6 |00009|Yes|No|02/24/2009 12:46|0|0|Page is valid, no graphics -- Color: N|

Wireline and Evaluation Services
Wireline and evaluation services, in concert with surface logging systems and LWD, form a data acquisitionand interpretation capability that enables clients with an integrated approach to formation evaluation and reservoircharacterization. Open-hole wireline services and logging while drilling compliment laboratory-derived analysis ofcore and reservoir fluid samples. When combined with geosciences consulting, this integrated capability providesthe data and interpretation to reduce reservoir uncertainty and ultimately optimize production and maximizerecovery.
Wireline services — Wireline services measure the physical properties of underground formations to helpdetermine the location and potential deliverability of oil and gas from a reservoir. Wireline services are providedfrom surface logging units, which lower tools and sensors into the wellbore mainly on a single or multiple conductorwireline.
The provision of wireline and associated interpretation services is divided into four categories: open holewireline, geoscience services, cased hole wireline and slickline services:
• Open Hole Wireline — This service helps locate oil and gas by measuring certain characteristics ofgeological formations and providing permanent records called “logs.” Open hole logging can be performedat different intervals during the well drilling process or immediately after a well is drilled. The logging dataprovides a valuable benchmark to which future well management decisions may be referenced. The openhole sensors are used to determine well lithology and the presence of hydrocarbons. Formation charac-teristics such as resistivity, density and porosity are measured using electrical, nuclear, acoustic, magneticand mechanical technologies.
The formation characteristics are then used to characterize the reservoir and describe it in terms of porosity,permeability, oil, gas or water content and an estimation of productivity. Wireline services can relay thisinformation from the wellsite on a real-time basis via a secure satellite transmission network and secureInternet connection to the client’s office for faster evaluation and decision making.
• Geoscience Services — This capability, consisting of geologists, geophysicists, and drilling, completion,production and reservoir engineers, serves as the interpretive bridge across diverse data sources to supportclient efforts to maximize their oil and gas assets using for the life of the well — from well planning throughdrilling, evaluation, completion, production, intervention and, finally, abandonment.
Major computing centers in Calgary and Houston, along with branches in Europe, the Middle East, LatinAmerica and Asia Pacific, use the latest technology to deliver data to our clients — from real-time (LWD)“geosteering” for critical well placement decisions to ongoing reservoir monitoring with permanent“intelligent completion” sensors. We provide advanced reservoir solutions by incorporating open hole,cased hole and production data.
• Cased Hole Wireline — This service is performed at various times throughout the life of the well andincludes perforating, completion logging, production logging and casing integrity services. Perforatingcreates the flow path between the reservoir and the wellbore. Production logging can be performedthroughout the life of the well to measure temperature, fluid type, flow rate, pressure and other reservoircharacteristics. In addition, cased hole services may involve wellbore diagnostics and remediation, whichcould include the positioning and installation of various plugs and packers to maintain production or repairwell problems, and casing inspection for internal or external abnormalities in the casing string.
• Slickline Services — This service uses a solid steel or braided nonconductor line, in place of a single ormultiple conductor braided line used in electric logging, to run downhole memory tools, manipulatedownhole production devices and provide fishing services primarily in producing wells.
Integrated Evaluation Services — These services help clients plan the development of new and existing oiland gas production fields. Specifically, a global network of laboratories provide support in terms of fluid andreservoir characterization, specialized core and fluid testing, enhanced oil recovery, rock strength and character-ization, sour richness and maturity, sorption properties assessment and reservoir flow studies.
7
%%TRANSMSG*** Transmitting Job: H65817 PCN: 008000000 ***%%PCMSG|7 |00007|Yes|No|02/24/2009 03:06|0|0|Page is valid, no graphics -- Color: N|

Re-entry and Fishing
Our re-entry, fishing and thru-tubing services help clients repair wells that have mechanical problems or thatneed work to prolong production of oil and natural gas reserves.
Re-entry Services — Our re-entry services include casing exit services and advanced multilateral systems.Conventional and advanced casing exit systems allow sidetrack and lateral drilling solutions for clients who eithercannot proceed down the original well track or want to drill lateral wells from the main or parent wellbore.
Fishing Services — Fishing services are provided through teams of experienced fishing tool supervisors and acomprehensive line of fishing and milling tools. Our teams provide conventional fishing services, such as removingwellbore obstructions, including stuck or dropped equipment, tools, drillstring components and other debris, thathave been lost downhole unintentionally during the drilling, completion or workover of new and old wells.Specialty fishing tools required in these activities include fishing jars, milling tools, casing cutters, overshots andspears. Our Fishing Services business unit also provides well patches and extensive plug-and-abandonmentproducts.
Thru-tubing Services — Thru-tubing services are used in well re-entry activity to allow operators to performcomplex drilling, completion and cementing activities from existing wellbores without removing existing pro-duction systems. We provide a full range of thru-tubing services and products, including drilling motors, casingexits, fishing and milling, zonal isolation packers and other well remediation services.
Stimulation and Chemicals
We offer our clients advanced chemical technology and services for safer and more effective productionenhancement. These products and services include the following:
Fracturing Technologies — Hydraulic reservoir fracturing is a stimulation method routinely performed on oiland natural gas wells in low-permeability reservoirs to increase productivity and oil and gas recovery.
Production Chemical Systems — Our Engineered Chemistry» business combines proprietary chemical solu-tions with internally developed oilfield equipment technologies. Our high-performance chemistry solutionsinclude: customized chemical solutions for production, refining, completion, water treatment and other industrialprocesses; a total service package (product selection, application and optimization); and precise formulations andmulti-functional chemical formulations that include the only formulas certified for capillary injection.
Capillary Injection Technology and Services — Capillary technology maximizes well production whileprotecting tubular goods. With systems installed in live wells in just three to four hours, reservoir production isnot interrupted. Our systems operate at depths of 22,000 feet.
Integrated Drilling
The majority of our land drilling rigs are located outside of North America. We also have the ability to offerproject management services to our clients, in which we provide a number of products and services needed to drilland complete a well, including the rig.
Pipeline and Specialty Services
We provide a range of services used throughout the life cycle of pipelines and process facilities, onshore andoffshore. Our pipeline group can meet all the requirements of the pipeline, process, industrial and energy marketsworldwide. We also can provide any service (or package of services) carried out on permanently installed clientequipment that involves inspecting, cleaning, drying, testing, improving production, running or establishingintegrity from the wellhead out.
Competition
We provide our products and services worldwide, and compete in a variety of distinct segments with a numberof competitors. Our principal competitors include Baker Hughes, BJ Services, Halliburton, Schlumberger and
8
%%TRANSMSG*** Transmitting Job: H65817 PCN: 009000000 ***%%PCMSG|8 |00007|Yes|No|02/21/2009 19:30|0|0|Page is valid, no graphics -- Color: N|

Smith International. We also compete with various other regional suppliers that provide a limited range ofequipment and services tailored for local markets. Competition is based on a number of factors, includingperformance, safety, quality, reliability, service, price, response time and, in some cases, breadth of products.
Other Business Data
Raw Materials
We purchase a wide variety of raw materials as well as parts and components made by other manufacturers andsuppliers for use in our manufacturing. Many of the products sold by us are manufactured by other parties. We arenot dependent on any single source of supply for any of our raw materials or purchased components.
Customers
Our principal customers consist of major and independent oil and natural gas producing companies. During2008, 2007 and 2006, there was no individual customer who accounted for more than 10% of consolidated revenues.
Research and Development and Patents
We maintain world-class technology and training centers throughout the world. Our 34 research, developmentand engineering facilities are focused on improving existing products and services and developing new technologiesto meet customer demands for improved drilling performance and enhanced reservoir productivity. Our expen-ditures for research and development totaled $193 million in 2008, $169 million in 2007 and $149 million in 2006.
As many areas of our business rely on patents and proprietary technology, we have followed a policy of seekingpatent protection both inside and outside the U.S. for products and methods that appear to have commercialsignificance. In the U.S., we currently have 1,182 patents issued and over 413 pending. We have 2,104 patentsissued in international jurisdictions and over 1,310 pending. We amortize patents over the years expected to bebenefited, ranging from 3 to 20 years.
Although in the aggregate our patents are important to the manufacturing and marketing of many of ourproducts, we do not believe that the loss of any one of our patents would have a material adverse effect on ourbusiness.
Seasonality
Weather and natural phenomena can temporarily affect level of demand for our products and services. Springmonths in Canada and winter months in the North Sea tend to negatively affect operations. In the summers of 2005and 2008, the Gulf of Mexico suffered an unusually high number of hurricanes that adversely impacted ouroperations. The widespread geographical locations of our operations serve to mitigate the impact of the seasonalnature of our business.
Federal Regulation and Environmental Matters
Our operations are subject to federal, state and local laws and regulations relating to the energy industry ingeneral and the environment in particular.
In January 2003, a subsidiary of Precision Energy Services was notified by the U.S. Environmental ProtectionAgency (“EPA”) that it was a potentially responsible party to the Gulf Nuclear Superfund Sites in Odessa, Tavenorand Webster, Texas. Based upon the information provided, it appears we will be classified as a de minimus party.Over the last three years, we have also been named as de minimus potentially responsible party in several other stateand federal governmental superfund sites and have settled all of these matters for an aggregate of approximately$50,000. In February 2008, we paid a civil penalty of $208,000 to the Federal Aviation Administration to settle acomplaint regarding the improper labeling of hazardous materials (lithium batteries) that were to be shipped aboarda commercial airliner.
Our 2008 expenditures to comply with environmental laws and regulations were not material, and we currentlyexpect the cost of compliance with environmental laws and regulations for 2009 also will not be material.
9
%%TRANSMSG*** Transmitting Job: H65817 PCN: 010000000 ***%%PCMSG|9 |00006|Yes|No|02/21/2009 19:30|0|0|Page is valid, no graphics -- Color: N|
Employees
At December 31, 2008, we employed approximately 50,000 employees. Certain of our operations are subjectto union contracts. These contracts cover approximately two percent of our employees. We believe that ourrelationship with our employees is generally satisfactory.
Forward-Looking Statements
This report, as well as other filings made by us with the Securities and Exchange Commission (“SEC”), andour releases issued to the public contain various statements relating to future results, including certain projectionsand business trends. We believe these statements constitute “Forward-Looking Statements” as defined in the PrivateSecurities Litigation Reform Act of 1995. These forward-looking statements generally are identified by the words“believe,” “project,” “expect,” “anticipate,” “estimate,” “intend,” “strategy,” “plan,” “may,” “should,” “will,”“would,” “will be,” “will continue,” “will likely result,” and similar expressions, although not all forward-lookingstatements contain these identifying words.
From time to time, we update the various factors we consider in making our forward-looking statements andthe assumptions we use in those statements. However, we undertake no obligation to publicly update or revise anyforward-looking events or circumstances that may arise after the date of this report. The following sets forth thevarious assumptions we use in our forward-looking statements, as well as risks and uncertainties relating to thosestatements. Certain of the risks and uncertainties may cause actual results to be materially different from projectedresults contained in forward-looking statements in this report and in our other disclosures. These risks anduncertainties include, but are not limited to, the following:
• Global political, economic and market conditions could affect projected results. Our operating results andthe forward-looking information we provide are based on our current assumptions about oil and natural gassupply and demand, oil and natural gas prices, rig count and other market trends. Our assumptions on thesematters are in turn based on currently available information, which is subject to change. The oil and naturalgas industry is extremely volatile and subject to change based on political and economic factors outside ourcontrol. Worldwide drilling activity, as measured by average worldwide rig counts, increased in each yearfrom 2002 to 2008. However, activity began declining in the fourth quarter of 2008, particularly in NorthAmerica. The current global economic climate has resulted in lower demand and lower prices for oil andnatural gas, which has reduced drilling and production activity and may therefore affect our future revenuesand income. We cannot accurately predict how much lower commodity prices and drilling activity may go,or when they may recover. Worldwide drilling activity and global demand for oil and natural gas may also beaffected by changes in governmental policies, laws and regulations related to environmental or energysecurity matters, including those addressing alternative energy sources and the risks of global climatechange. We have assumed global demand will be down slightly in 2009 compared to 2008. In 2009,worldwide demand may be significantly weaker than we have assumed.
• Our ability to manage our workforce could affect our projected results. In a climate of decreasing demand,we are faced with managing our workforce levels to control costs without impairing our ability to provideservice to our customers. Our forward-looking statements assume we will be able to do so.
• Increases in the prices and availability of our raw materials could affect our results of operations. We uselarge amounts of raw materials for manufacturing our products. The price of these raw materials has asignificant impact on our cost of producing products for sale or producing fixed assets used in our business.We have assumed that the prices of our raw materials will remain within a manageable range and will bereadily available. If we are unable to obtain necessary raw materials or if we are unable to minimize theimpact of increased raw material costs or to realize the benefit of cost decreases in a timely fashion throughour supply chain initiatives or pricing, our margins and results of operations could be adversely affected.
• Our long-term growth depends upon technological innovation and commercialization. Our ability todeliver our long-term growth strategy depends in part on the commercialization of new technology. A centralaspect of our growth strategy is to improve our products and services through innovation, to obtaintechnologically advanced products through internal research and development and/or acquisitions, to protect
10
%%TRANSMSG*** Transmitting Job: H65817 PCN: 011000000 ***%%PCMSG|10 |00009|Yes|No|02/24/2009 12:17|0|0|Page is valid, no graphics -- Color: N|

proprietary technology from unauthorized use and to expand the markets for new technology by leveragingour worldwide infrastructure. The key to our success will be our ability to commercialize the technology thatwe have acquired and demonstrate the enhanced value our technology brings to our customers’ operations.Our major technological advances include, but are not limited to, those related to controlled pressure drillingand testing systems, expandable solid tubulars, expandable sand screens and intelligent well completion.Our forward-looking statements have assumed successful commercialization of, and above-average growthfrom, these new products and services, as well as legal protection of our intellectual property rights.
• Nonrealization of expected benefits from our 2002 corporate reincorporation could affect our projectedresults. We currently are incorporated in Bermuda and we operate through our various subsidiaries innumerous countries throughout the world including the United States. We anticipate that, during the firstquarter of 2009, we will complete a transaction in which our parent Bermuda company will become awholly-owned subsidiary of Weatherford International Ltd., a Swiss joint-stock company, and holders of ourcommon shares will receive one registered share of the Swiss company in exchange for each of our commonshares that they hold. Consequently, we are or may become subject to changes in tax laws, treaties orregulations or the interpretation or enforcement thereof in the U.S., Bermuda, Switzerland or jurisdictions inwhich we or any of our subsidiaries operates or is resident. Our income tax expense is based upon ourinterpretation of the tax laws in effect in various countries at the time that the expense was incurred. If theU.S. Internal Revenue Service or other taxing authorities do not agree with our assessment of the effects ofsuch laws, treaties and regulations, this could have a material adverse effect on us including the imposition ofa higher effective tax rate on our worldwide earnings or a reclassification of the tax impact of our significantcorporate restructuring transactions.
• Nonrealization of expected benefits from our acquisitions could affect our projected results. We expect togain certain business, financial and strategic advantages as a result of business acquisitions we undertake,including synergies and operating efficiencies. Our forward-looking statements assume that we willsuccessfully integrate our business acquisitions and realize the benefits of that. An inability to realizeexpected strategic advantages as a result of any acquisition would negatively affect the anticipated benefitsof the acquisition.
• The cyclical nature of or a prolonged downturn in our industry could affect the carrying value of ourgoodwill. As of December 31, 2008, we had approximately $3.5 billion of goodwill. Our estimates of thevalue of our goodwill could be reduced in the future as a result of various factors, including market factors,some of which are beyond our control. Our forward-looking statements do not assume any future goodwillimpairment. Any reduction in the fair value of our businesses may result in an impairment charge andtherefore adversely affect our results.
• Currency fluctuations could have a material adverse financial impact on our business. A material changein currency rates in our markets could affect our future results as well as affect the carrying values of ourassets. World currencies have been subject to much volatility. Our forward-looking statements assume nomaterial impact from future changes in currency exchange rates.
• Adverse weather conditions in certain regions could adversely affect our operations. In the summers of2005 and 2008, the Gulf of Mexico suffered several significant hurricanes. These hurricanes and associatedhurricane threats reduced the number of days on which we and our customers could operate, which resultedin lower revenues than we otherwise would have achieved. In parts of 2006, and particularly in the secondquarters of 2007 and 2008, climatic conditions in Canada were not as favorable to drilling as we anticipated,which limited our potential results in that region. Similarly, unfavorable weather in Russia and in the NorthSea could reduce our operations and revenues from that area during the relevant period. Our forward-lookingstatements assume weather patterns in our primary areas of operations will be conducive to our operations.
• U.S. Government and internal investigations could affect our results of operations. We are currentlyinvolved in government and internal investigations involving various of our operations. These investigationsare ongoing, and we cannot anticipate the timing, outcome or possible impact of these investigations,financial or otherwise. The governmental agencies involved in these investigations have a broad range ofcivil and criminal penalties they may seek to impose against corporations and individuals for violations of
11
%%TRANSMSG*** Transmitting Job: H65817 PCN: 012000000 ***%%PCMSG|11 |00008|Yes|No|02/24/2009 04:03|0|0|Page is valid, no graphics -- Color: N|

trading sanctions laws, the Foreign Corrupt Practices Act and other federal statutes including, but not limitedto, injunctive relief, disgorgement, fines, penalties and modifications to business practices and complianceprograms. In recent years, these agencies and authorities have entered into agreements with, and obtained arange of penalties against, several public corporations and individuals in similar investigations, under whichcivil and criminal penalties were imposed, including in some cases fines and other penalties and sanctions inthe tens and hundreds of millions of dollars. Under trading sanctions laws, the Department of Justice(“DOJ”) may also seek to impose modifications to business practices, including immediate cessation of allbusiness activities in specific countries or other limitations that decrease our business, and modifications tocompliance programs, which may increase compliance costs. Any injunctive relief, disgorgement, fines,penalties, sanctions or imposed modifications to business practices resulting from these investigations couldadversely affect our results of operations. Additionally, during 2008, we incurred $56 million for costs inconnection with our exit from sanctioned countries and $47 million for legal and professional fees incurredin connection with complying with and conducting these on-going investigations. We will have additionalcharges related to these matters in future periods, which costs may include labor claims, contractual claims,penalties assessed by customers, and costs, fines, taxes and penalties assessed by the local governments, butwe cannot quantify those charges or be certain of the timing of them.
• Political disturbances, war, or terrorist attacks and changes in global trade policies could adversely impactour operations. We have assumed there will be no material political disturbances or terrorist attacks andthere will be no material changes in global trade policies. Any further military action undertaken by theU.S. or other countries or political disturbances in the countries in which we conduct business couldadversely affect our results of operations.
• Current turmoil in the credit markets may reduce our access to capital or reduce the availability of financialrisk-mitigation tools. In recent quarters, the worldwide credit markets have experienced almost unprece-dented turmoil and uncertainty. Our forward-looking statements assume that the financial institutions thathave committed to extend us credit will honor their commitments under our credit facilities. If one or more ofthose institutions becomes unwilling or unable to honor its commitments, our access to liquidity could beimpaired and our cost of capital to fund growth could further increase. We use interest-rate and foreign-exchange swap transactions with financial institutions to mitigate certain interest-rate and foreign-exchangerisks associated with our capital structure and our business. Our forward-looking statements assume thatthose tools will continue to be available to us. However, the failure of any swap counter party to honor a swapagreement could reduce the availability of these financial risk-mitigation tools or could result in the loss ofexpected financial benefits. In response to credit market conditions and the global economic and businessenvironment, we have undertaken measures to reduce our use of capital going forward. Our forward-lookingstatements assume that we will operate with lower capital expenditures in 2009 than in 2008. However, as thebusiness climate changes and if attractive opportunities for organic or acquisitive growth become available,we may spend capital selectively above the amounts we have budgeted.
Finally, our future results will depend upon various other risks and uncertainties, including, but not limited to,those detailed in our other filings with the SEC. For additional information regarding risks and uncertainties, see ourother filings with the SEC under the Securities Exchange Act of 1934, as amended, and the Securities Act of 1933,as amended, available free of charge at the SEC’s website at www.sec.gov.
Item 1A. Risk Factors
An investment in our common shares involves various risks. When considering an investment in our company,you should consider carefully all of the risk factors described below, the matters discussed on the foregoing pagesunder “Business-Forward-Looking Statements”, as well as other information included and incorporated byreference in this report.
12
%%TRANSMSG*** Transmitting Job: H65817 PCN: 013000000 ***%%PCMSG|12 |00008|Yes|No|02/24/2009 15:52|0|0|Page is valid, no graphics -- Color: N|
We have significant operations that would be adversely impacted in the event of war, political disruption,civil disturbance, economic and legal sanctions or changes in global trade policies.
Like most multinational oilfield service companies, we have operations in certain international areas,including parts of the Middle East, North and West Africa, Latin America, the Asia Pacific region and theCommonwealth of Independent States, that are subject to risks of war, political disruption, civil disturbance,economic and legal sanctions (such as restrictions against countries that the U.S. government may deem to sponsorterrorism) and changes in global trade policies. Our operations may be restricted or prohibited in any country inwhich the foregoing risks occur.
In particular, the occurrence of any of these risks could result in the following events, which in turn, couldmaterially and adversely impact our results of operations:
• disruption of oil and natural gas exploration and production activities;
• restriction of the movement and exchange of funds;
• inhibition of our ability to collect receivables;
• enactment of additional or stricter U.S. government or international sanctions; and
• limitation of our access to markets for periods of time.
We are involved in several governmental and internal investigations, which are costly to conduct, haveresulted in a loss of revenue and may result in substantial financial penalties.
We are currently involved in government and internal investigations involving various of our operations. Weparticipated in the United Nations oil-for-food program governing sales of goods and services into Iraq. The SEChas subpoenaed certain documents in connection with an investigation into our participation in the oil-for-foodprogram. The U.S. Department of Justice is also conducting an investigation of our participation in the oil-for-foodprogram. We are cooperating fully with these investigations. We have retained legal counsel, reporting to our auditcommittee, to investigate this matter. These investigations are ongoing, and we cannot anticipate the timing,outcome or possible impact of these investigations, financial or otherwise.
The U.S. Department of Commerce, Bureau of Industry & Security and the U.S. Department of Justice areinvestigating allegations of improper sales of products and services by us and our subsidiaries in sanctionedcountries. We are cooperating fully with this investigation. We have retained legal counsel, reporting to our auditcommittee, to investigate this matter. This investigation is ongoing, and we cannot anticipate the timing, outcome orpossible impact of the investigation, financial or otherwise.
In light of this investigation and of the current U.S. and foreign policy environment and the inherentuncertainties surrounding these countries, we decided in September 2007 to direct our foreign subsidiaries todiscontinue doing business in countries that are subject to U.S. economic and trade sanctions, including Cuba, Iran,Sudan and Syria. Effective September 2007, we ceased entering into any new contracts relating to these countriesand began an orderly discontinuation and winding down of our existing business in these sanctioned countries.Effective March 31, 2008, we completed our withdrawal from these countries.
With the assistance of outside counsel and in connection with U.S. government investigations and subpoenas,we are conducting investigations regarding the embezzlement of approximately $175,000 at a European subsidiaryand the possible improper use of these funds, including possible payments to government officials in Europe, duringthe period from 2000 to 2004, and the Company’s compliance with the Foreign Corrupt Practices Act and other lawsworldwide. As part of these investigations, we have also uncovered potential violations of U.S. law in connectionwith a joint venture in Angola. These investigations are ongoing, and we cannot anticipate the timing, outcome orpossible impact, if any, of the investigations, financial or otherwise. We have informed the SEC and the DOJ ofthese investigations, and the results of the investigations are being provided to the SEC and DOJ.
The DOJ, the SEC and other agencies and authorities have a broad range of civil and criminal penalties theymay seek to impose against corporations and individuals for violations of trading sanctions laws, the Foreign
13
%%TRANSMSG*** Transmitting Job: H65817 PCN: 014000000 ***%%PCMSG|13 |00007|Yes|No|02/24/2009 12:18|0|0|Page is valid, no graphics -- Color: N|
Corrupt Practices Act and other federal statutes including, but not limited to, injunctive relief, disgorgement, fines,penalties and modifications to business practices and compliance programs. In recent years, these agencies andauthorities have entered into agreements with, and obtained a range of penalties against, several public corporationsand individuals in similar investigations, under which civil and criminal penalties were imposed, including in somecases fines and other penalties and sanctions in the tens and hundreds of millions of dollars. Under trading sanctionslaws, the DOJ may also seek to impose modifications to business practices, including immediate cessation of allbusiness activities in specific countries or other limitations that decrease our business, and modifications tocompliance programs, which may increase compliance costs. In addition, our activities in sanctioned countries,such as Sudan and Iran, could result in certain investors, such as government sponsored pension funds, divesting ornot investing in our common shares. Based on available information, we cannot predict what, if any, actions theDOJ, SEC or other authorities may take in our situation or the effect any such actions may have on our consolidatedfinancial position or results of operations. To the extent we violated U.S. export regulations, fines and otherpenalties may be imposed. Because these matters are now pending before the indicated agencies, there can be noassurance that actual fines or penalties, if any, will not have a material adverse affect on our business, financialcondition, liquidity or results of operations.
During 2008, we incurred $56 million for costs incurred in connection with our exit from sanctioned countriesand $47 million in legal and professional fees incurred in connection with complying and conducting with these on-going investigations. We will have additional charges related to these matters in future periods, which costs mayinclude labor claims, contractual claims, penalties assessed by customers, and costs, fines, taxes and penaltiesassessed by the local governments, but we cannot quantify those charges or be certain of the timing of them.
Our significant operations in foreign countries expose us to currency fluctuation risks.
A portion of our net assets are located outside the U.S. and are carried on our books in local currencies.Changes in those currencies in relation to the U.S. dollar result in translation adjustments, which are reflected asaccumulated other comprehensive income in the shareholders’ equity section in our Consolidated Balance Sheets.We recognize remeasurement and transactional gains and losses on currencies in our Consolidated Statements ofIncome, which may adversely impact our results of operations. We enter into foreign currency forward contractsand other derivative instruments as an effort to reduce our exposure to currency fluctuations; however, there can beno assurance that these hedging activities will be effective in reducing or eliminating foreign currency risks.
In certain foreign countries, a component of our cost structure is denominated in a different currency than ourrevenues. In those cases, currency fluctuations could adversely impact our operating margins.
Uninsured claims and litigation could adversely impact our results.
In the ordinary course of business, we become the subject of various claims and litigation. We maintaininsurance to cover many of our potential losses and we are subject to various self-retentions and deductibles withrespect to our insurance. Although we are subject to various ongoing items of litigation, we do not believe any of ourcurrent items of litigation will result in any material uninsured losses to us. However, it is possible an unexpectedjudgment could be rendered against us in cases in which we could be uninsured and beyond the amounts wecurrently have reserved or anticipate incurring.
We currently carry a variety of insurance for our operations. We are partially self-insured for certain claims inamounts we believe to be customary and reasonable. Although we believe we maintain insurance coverage adequatefor the risks of our business, our insurance may not be sufficient to cover any particular loss, or our insurance maynot cover all losses. For example, while we maintain product liability insurance, this type of insurance is limited incoverage and it is possible an adverse claim could arise in excess of our coverage. Finally, insurance rates have in thepast been subject to wide fluctuation, and in the current global economic environment could increase significantlyin the near future. Changes in coverage, insurance markets and our industry may result in further increases in ourcost and higher deductibles and retentions.
We are also subject to various federal, state and local laws and regulations relating to the energy industry ingeneral and the environment in particular. Environmental laws have in recent years become more stringent and havegenerally sought to impose greater liability on a larger number of potentially responsible parties. While we are not
14
%%TRANSMSG*** Transmitting Job: H65817 PCN: 015000000 ***%%PCMSG|14 |00009|Yes|No|02/24/2009 05:35|0|0|Page is valid, no graphics -- Color: N|

currently aware of any situation involving an environmental claim that would be likely to have a material adverseeffect on our business, it is always possible that an environmental claim with respect to one or more of our currentbusinesses or a business or property that one of our predecessors owned or used could arise and could involvematerial expenditures.
Customer credit risks could result in losses.
The concentration of our customers in the energy industry may impact our overall exposure to credit risk ascustomers may be similarly affected by prolonged changes in economic and industry conditions. Those countriesthat rely heavily upon income from hydrocarbon exports will be hit particularly hard given the drop in oil prices.Further, laws in some jurisdictions in which we operate could make collection difficult or time consuming. Weperform ongoing credit evaluations of our customers and do not generally require collateral in support of our tradereceivables. While we maintain reserves for potential credit losses, we cannot assure such reserves will be sufficientto meet write-offs of uncollectible receivables or that our losses from such receivables will be consistent with ourexpectations.
The capital financing necessary to fund growth may not be available to us at economic rates.
Recent turmoil in the credit markets and the potential impact on liquidity of major financial institutions mayhave an adverse effect on our ability to fund growth opportunities through borrowings, under either existing ornewly created instruments in the public or private markets on terms we believe to be reasonable.
A terrorist attack could have a material and adverse effect on our business.
The terrorist attacks that took place in the U.S. on September 11, 2001 and the subsequent ongoing war onterror have created many global economic and political uncertainties. The potential for future terrorist attacks, thenational and international responses to terrorist attacks, and other acts of war or hostility have created manyeconomic and political uncertainties that could adversely affect our businesses.
Changes in tax laws could adversely impact our results.
On June 26, 2002, the stockholders and Board of Directors of Weatherford International, Inc. (“Weatherford-Delaware”) approved our corporate reorganization, and Weatherford International Ltd. (“Weatherford-Bermuda”),a newly formed Bermuda company, became the parent holding company of Weatherford International, Inc. Weanticipate that, during the first quarter of 2009, we will complete a transaction in which Weatherford Bermudacompany will become a wholly-owned subsidiary of Weatherford International Ltd., a Swiss joint-stock company(“Weatherford-Switzerland”), and holders of our common shares will receive one registered share of WeatherfordSwitzerland for each common share of Weatherford Bermuda that they hold. We refer to this transaction as the“redomestication.” The realization of the tax benefit of this reorganization could be impacted by changes in taxlaws, tax treaties or tax regulations or the interpretation or enforcement thereof or differing interpretation orenforcement of applicable law by the U.S. Internal Revenue Service or other taxing jurisdictions. The inability torealize this benefit could have a material impact on our financial statements.
The anticipated benefits of moving our principal executive offices to Switzerland may not be realized,and difficulties in connection with moving our principal executive offices could have an adverse effecton us.
In connection with the redomestication, we plan to relocate our principal executive offices from Houston,Texas to Zug, Switzerland with a branch office in Geneva, Switzerland. We expect that most of our executiveofficers, including our Chief Executive Officer, and other key decision makers will relocate to Switzerland. We mayface significant challenges in relocating our executive offices to a different country, including difficulties inretaining and attracting officers, key personnel and other employees and challenges in maintaining principalexecutive offices in a country different from the country where other employees, including corporate support staff,are located. Employees may be uncertain about their future roles within our organization pending or following thecompletion of the redomestication. Management may also be required to devote substantial time to the
15
%%TRANSMSG*** Transmitting Job: H65817 PCN: 016000000 ***%%PCMSG|15 |00010|Yes|No|02/24/2009 07:13|0|0|Page is valid, no graphics -- Color: N|

redomestication and related matters, which could otherwise be devoted to focusing on ongoing business operationsand other initiatives and opportunities. In addition, we may not realize the benefits we anticipate from theredomestication, including the benefit of moving to a location that is more centrally located within our area ofworldwide operations. Any such difficulties could have an adverse effect on our business, results of operations orfinancial condition.
The rights of our shareholders will be governed by Swiss law and documents following theredomestication.
After the redomestication, the rights of our shareholders will be governed by Swiss law and Weatherford-Switzerland’s articles of association and organizational regulations (the latter being analogous to bye-laws). Therights of shareholders under Swiss law may differ from the rights of shareholders of companies incorporated inother jurisdictions. For example, directors of Weatherford-Switzerland may be removed by shareholders with orwithout cause, but such removal requires the vote of shareholders holding at least 662⁄3% of the voting rights and theabsolute majority of the par value of the registered shares represented at the meeting as well as a quorum of at leasttwo-thirds of the registered shares recorded in the share register.
We intend to hold future shareholder meetings in Switzerland, and our required quorum for thosemeetings may be lower.
We intend to hold future shareholders meetings, beginning with our 2009 annual meeting, in Switzerland,which may make attendance in person more difficult for some investors. For shareholders meetings forWeatherford-Switzerland for the transaction of any business other than removal of a director or certain otherspecified resolutions, a quorum comprises at least one-third of the registered shares recorded in the share registerand entitled to vote (and at least two-thirds of the registered shares recorded in the share register and entitled to votefor the removal of directors and certain other specified resolutions).
The market for the Weatherford-Switzerland shares may differ from the market for theWeatherford-Bermuda shares, and Weatherford-Switzerland’s shares may be removed as a componentof certain index-based or other funds.
Following the redomestication, the shares of Weatherford-Switzerland will be listed on the NYSE under thesymbol “WFT,” the same symbol under which the Weatherford-Bermuda common shares are currently listed. Themarket price, trading volume or volatility of the Weatherford-Switzerland shares could be different than those of theWeatherford-Bermuda shares.
Weatherford-Bermuda’s common shares were a component of the Standard & Poor’s 500 Index and otherindices before the redomestication. S&P has considered Weatherford-Bermuda and a number of other “offshoreregistered companies” domestic companies for purposes of inclusion in the S&P 500. On February 13, 2009, S&Pannounced that it would remove our shares as a component of the S&P 500. Similar issues could arise with respectto whether our shares will continue to be included as a component in other indices or funds that may impose avariety of qualifications that could be affected by the redomestication. Some institutional investors and funds thattrack the performance of the S&P 500 or such other indices likely will sell their shares in Weatherford and maydecrease future investment in our shares, which could adversely affect the price of our shares. Any such adverseimpact on the price of our shares could be magnified by the current heightened volatility in the financial markets.
Item 1B. Unresolved Staff Comments
None.
16
%%TRANSMSG*** Transmitting Job: H65817 PCN: 017000000 ***%%PCMSG|16 |00008|Yes|No|02/24/2009 15:53|0|0|Page is valid, no graphics -- Color: N|
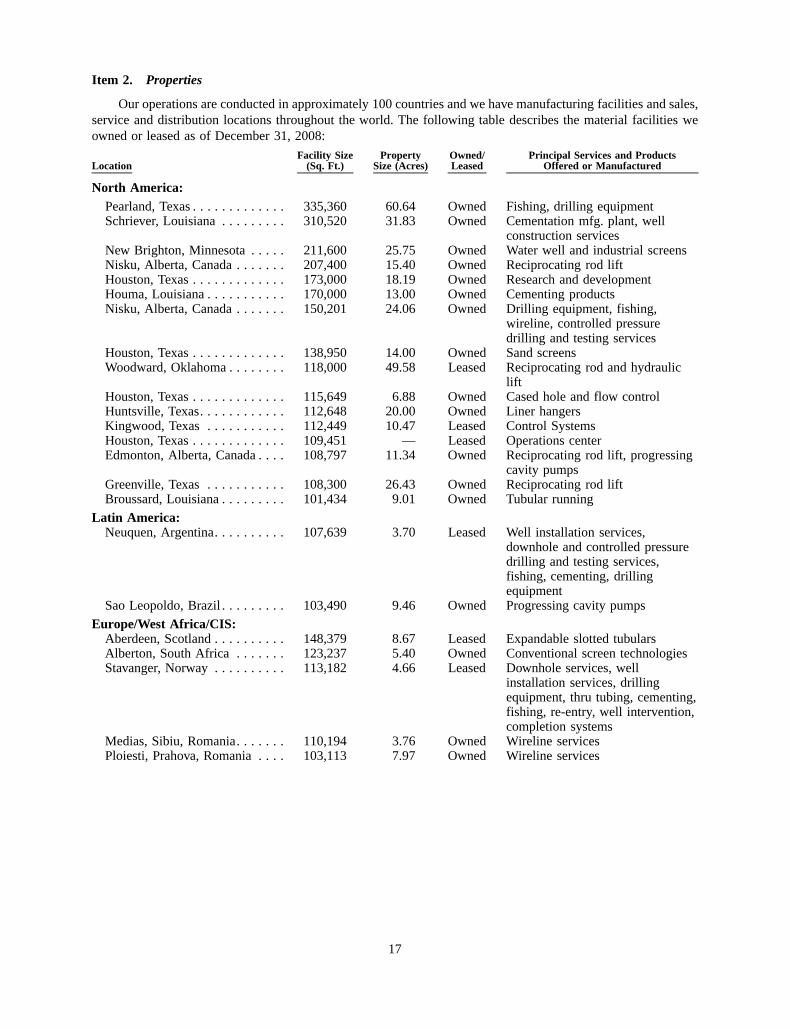
Item 2. Properties
Our operations are conducted in approximately 100 countries and we have manufacturing facilities and sales,service and distribution locations throughout the world. The following table describes the material facilities weowned or leased as of December 31, 2008:
LocationFacility Size
(Sq. Ft.)Property
Size (Acres)Owned/Leased
Principal Services and ProductsOffered or Manufactured
North America:Pearland, Texas . . . . . . . . . . . . . 335,360 60.64 Owned Fishing, drilling equipmentSchriever, Louisiana . . . . . . . . . 310,520 31.83 Owned Cementation mfg. plant, well
construction servicesNew Brighton, Minnesota . . . . . 211,600 25.75 Owned Water well and industrial screensNisku, Alberta, Canada . . . . . . . 207,400 15.40 Owned Reciprocating rod liftHouston, Texas . . . . . . . . . . . . . 173,000 18.19 Owned Research and developmentHouma, Louisiana . . . . . . . . . . . 170,000 13.00 Owned Cementing productsNisku, Alberta, Canada . . . . . . . 150,201 24.06 Owned Drilling equipment, fishing,
wireline, controlled pressuredrilling and testing services
Houston, Texas . . . . . . . . . . . . . 138,950 14.00 Owned Sand screensWoodward, Oklahoma . . . . . . . . 118,000 49.58 Leased Reciprocating rod and hydraulic
liftHouston, Texas . . . . . . . . . . . . . 115,649 6.88 Owned Cased hole and flow controlHuntsville, Texas. . . . . . . . . . . . 112,648 20.00 Owned Liner hangersKingwood, Texas . . . . . . . . . . . 112,449 10.47 Leased Control SystemsHouston, Texas . . . . . . . . . . . . . 109,451 — Leased Operations centerEdmonton, Alberta, Canada . . . . 108,797 11.34 Owned Reciprocating rod lift, progressing
cavity pumpsGreenville, Texas . . . . . . . . . . . 108,300 26.43 Owned Reciprocating rod liftBroussard, Louisiana . . . . . . . . . 101,434 9.01 Owned Tubular running
Latin America:Neuquen, Argentina. . . . . . . . . . 107,639 3.70 Leased Well installation services,
downhole and controlled pressuredrilling and testing services,fishing, cementing, drillingequipment
Sao Leopoldo, Brazil . . . . . . . . . 103,490 9.46 Owned Progressing cavity pumps
Europe/West Africa/CIS:Aberdeen, Scotland . . . . . . . . . . 148,379 8.67 Leased Expandable slotted tubularsAlberton, South Africa . . . . . . . 123,237 5.40 Owned Conventional screen technologiesStavanger, Norway . . . . . . . . . . 113,182 4.66 Leased Downhole services, well
installation services, drillingequipment, thru tubing, cementing,fishing, re-entry, well intervention,completion systems
Medias, Sibiu, Romania. . . . . . . 110,194 3.76 Owned Wireline servicesPloiesti, Prahova, Romania . . . . 103,113 7.97 Owned Wireline services
17
%%TRANSMSG*** Transmitting Job: H65817 PCN: 018000000 ***%%PCMSG|17 |00007|Yes|No|02/24/2009 15:53|0|0|Page is valid, no graphics -- Color: N|

LocationFacility Size
(Sq. Ft.)Property
Size (Acres)Owned/Leased
Principal Services and ProductsOffered or Manufactured
Middle East/North Africa/Asia:Deyang, China . . . . . . . . . . . . . 264,175 20.82 Owned Pump jacks and wellheadHassi Messaoud, Algeria . . . . . . 226,849 40.20 Owned Fishing, liner hangers, controlled
pressure drilling and testingservices
Singapore, Singapore. . . . . . . . . 160,170 2.33 Leased Fishing, re-entry anddecommissioning drilling tools andservices, production operations andsystems
Awjila, Libya . . . . . . . . . . . . . . 165,980 27.67 Leased Warehouse and serviceBatanm Riau, Indonesia. . . . . . . 126,584 — Leased Storage yardEgypt, Maadi, Cairo . . . . . . . . . 122,708 2.81 Leased Machine shop, pipe yard, repair
center and warehouseCorporate:
Houston, Texas . . . . . . . . . . . . . 254,224 — Leased Corporate offices
Item 3. Legal Proceedings
In the ordinary course of business, we become the subject of various claims and litigation. We maintaininsurance to cover many of our potential losses, and we are subject to various self-retention limits and deductibleswith respect to our insurance.
See “Item 1. Business — Other Business Data — Federal Regulation and Environmental Matters”, which isincorporated by reference into this item.
See “Item 1A. Risk Factors — We are involved in several governmental and internal investigations, which arecostly to conduct, have resulted in a loss of revenue and may result in substantial financial penalties”, which isincorporated by reference into this item.
Although we are subject to various ongoing items of litigation, we do not believe any of the items of litigationto which we are currently subject will result in any material uninsured losses to us. It is possible, however, anunexpected judgment could be rendered against us in the cases in which we are involved that could be uninsured andbeyond the amounts we currently have reserved.
Item 4. Submission of Matters to a Vote of Security Holders
No matters were submitted to a vote of shareholders of the Company during the fourth quarter of the yearended December 31, 2008.
18
%%TRANSMSG*** Transmitting Job: H65817 PCN: 019000000 ***%%PCMSG|18 |00007|Yes|No|02/24/2009 15:54|0|0|Page is valid, no graphics -- Color: N|

PART II
Item 5. Market for Registrant’s Common Equity, Related Shareholder Matters and Issuer Purchases ofEquity Securities
Our common shares are traded on the New York Stock Exchange under the symbol “WFT.” As of February 20,2009, there were 2,811 shareholders of record. Additionally, there were 72 stockholders of Weatherford Interna-tional, Inc. as of the same date who had not yet exchanged their shares. The following table sets forth, for the periodsindicated, the range of high and low sales prices per common share as reported on the New York Stock Exchange.During 2008, our Board of Directors approved a two-for-one split of our common shares. All prices have beenrestated to reflect this stock split.
High LowPrice
Year ending December 31, 2008
First Quarter . . . . . . . . . . . . . . . . . . . . . . . . . . . . . . . . . . . . . . . . . . . . . . . . . . $36.82 $25.91
Second Quarter . . . . . . . . . . . . . . . . . . . . . . . . . . . . . . . . . . . . . . . . . . . . . . . . 49.98 34.96
Third Quarter . . . . . . . . . . . . . . . . . . . . . . . . . . . . . . . . . . . . . . . . . . . . . . . . . 49.76 22.26
Fourth Quarter . . . . . . . . . . . . . . . . . . . . . . . . . . . . . . . . . . . . . . . . . . . . . . . . 24.69 7.75
Year ending December 31, 2007
First Quarter . . . . . . . . . . . . . . . . . . . . . . . . . . . . . . . . . . . . . . . . . . . . . . . . . . $23.51 $17.95
Second Quarter . . . . . . . . . . . . . . . . . . . . . . . . . . . . . . . . . . . . . . . . . . . . . . . . 29.52 22.52
Third Quarter . . . . . . . . . . . . . . . . . . . . . . . . . . . . . . . . . . . . . . . . . . . . . . . . . 35.50 24.31
Fourth Quarter . . . . . . . . . . . . . . . . . . . . . . . . . . . . . . . . . . . . . . . . . . . . . . . . 36.11 28.18
On February 20, 2009, the closing sales price of our common shares as reported by the New York StockExchange was $10.01 per share. We have not declared or paid cash dividends on our common shares since 1984.
On October 1, 2008 we sold 959,264 of our common shares and on November 25, 2008 we sold 5,646,772 ofour common shares, both in connection with acquisitions. These shares were sold to the shareholders of the acquiredcompanies as consideration for the shares of the acquired companies. These sales of our common shares wereexempt from registration under the Securities Act of 1933 pursuant to Section 4(2) of that act and pursuant toRegulation D and Regulation S promulgated under that act as a non-public sale to accredited investors and/or tonon-U.S. persons outside the United States.
In December 2005, our Board of Directors approved a share repurchase program under which we can spend upto $1 billion to repurchase outstanding common shares. Future purchases of our shares can be made in the openmarket or privately negotiated transactions, at the discretion of management and as market conditions warrant. Asof December 31, 2008, we have $205 million available under this authorization to repurchase shares. During thequarter ended December 31, 2008, no shares were repurchased.
In addition, under our restricted share plan, employees may elect to have us withhold common shares to satisfyminimum statutory federal, state and local tax withholding obligations arising on the vesting of restricted stockawards and exercise of options. When we withhold these shares, we are required to remit to the appropriate taxingauthorities the market price of the shares withheld, which could be deemed a purchase of the common shares by uson the date of withholding.
During the quarter ended December 31, 2008, we withheld common shares to satisfy these tax withholdingobligations as follows:
PeriodNo. ofShares
AveragePrice
October 1-October 31, 2008 . . . . . . . . . . . . . . . . . . . . . . . . . . . . . . . . . . . . . . . . . 9,959 $20.00
November 1-November 30, 2008 . . . . . . . . . . . . . . . . . . . . . . . . . . . . . . . . . . . . . 8,997 14.21
December 1-December 31, 2008 . . . . . . . . . . . . . . . . . . . . . . . . . . . . . . . . . . . . . . 9,184 9.60
19
%%TRANSMSG*** Transmitting Job: H65817 PCN: 020000000 ***%%PCMSG|19 |00006|Yes|No|02/24/2009 15:55|0|0|Page is valid, no graphics -- Color: N|

Information concerning securities authorized for issuance under equity compensation plans is set forth inPart III of this report under “Item 12(d). Security Authorized for Issuance Under Equity Compensation Plans,”which is incorporated by reference into this Item.
Performance Graph
This graph compares the yearly cumulative return on our common shares with the cumulative return on theDow Jones U.S. Oil Equipment & Services Index and the Dow Jones U.S. Index for the last five years. The graphassumes the value of the investment in the Company’s common shares and each index was $100 on December 31,2003. The stockholder return set forth below is not necessarily indicative of future performance. The followinggraph and related information shall not be deemed “soliciting material” or to be “filed” with the SEC, nor shall suchinformation be incorporated by reference into any future filing under the Securities Act of 1933 or the SecuritiesExchange Act of 1934, except to the extent that Weatherford specifically incorporates it by reference into suchfiling.
Comparison of Five Year Total Return
200820072006200520042003
DO
LL
AR
S
Weatherford International Ltd.
Dow Jones U.S. Oil Equipment and Services Index
Dow Jones U.S. Index
0
50
100
150
200
250
300
350
400
450
20
%%TRANSMSG*** Transmitting Job: H65817 PCN: 021000000 ***%%PCMSG|20 |00010|Yes|No|02/24/2009 15:55|0|0|Page/graphics valid 02/24/2009 15:55 -- Color: N|
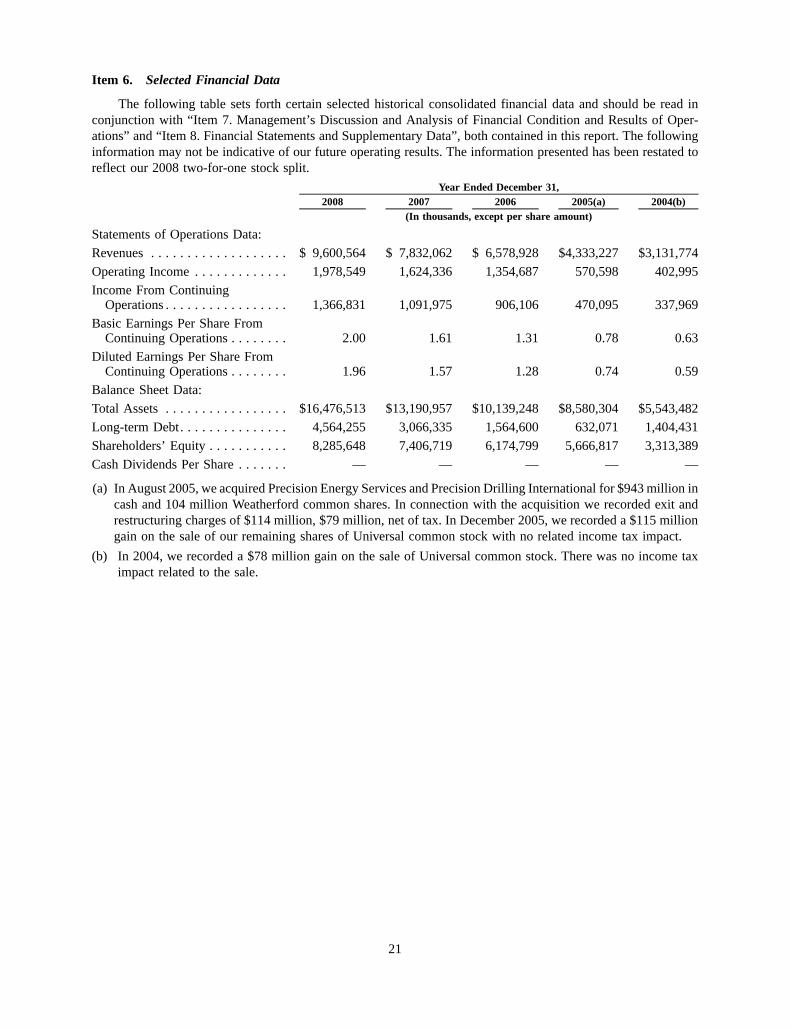
Item 6. Selected Financial Data
The following table sets forth certain selected historical consolidated financial data and should be read inconjunction with “Item 7. Management’s Discussion and Analysis of Financial Condition and Results of Oper-ations” and “Item 8. Financial Statements and Supplementary Data”, both contained in this report. The followinginformation may not be indicative of our future operating results. The information presented has been restated toreflect our 2008 two-for-one stock split.
2008 2007 2006 2005(a) 2004(b)Year Ended December 31,
(In thousands, except per share amount)
Statements of Operations Data:
Revenues . . . . . . . . . . . . . . . . . . . $ 9,600,564 $ 7,832,062 $ 6,578,928 $4,333,227 $3,131,774
Operating Income . . . . . . . . . . . . . 1,978,549 1,624,336 1,354,687 570,598 402,995Income From Continuing
Operations . . . . . . . . . . . . . . . . . 1,366,831 1,091,975 906,106 470,095 337,969Basic Earnings Per Share From
Continuing Operations . . . . . . . . 2.00 1.61 1.31 0.78 0.63Diluted Earnings Per Share From
Continuing Operations . . . . . . . . 1.96 1.57 1.28 0.74 0.59Balance Sheet Data:
Total Assets . . . . . . . . . . . . . . . . . $16,476,513 $13,190,957 $10,139,248 $8,580,304 $5,543,482
Long-term Debt. . . . . . . . . . . . . . . 4,564,255 3,066,335 1,564,600 632,071 1,404,431
Shareholders’ Equity . . . . . . . . . . . 8,285,648 7,406,719 6,174,799 5,666,817 3,313,389
Cash Dividends Per Share . . . . . . . — — — — —
(a) In August 2005, we acquired Precision Energy Services and Precision Drilling International for $943 million incash and 104 million Weatherford common shares. In connection with the acquisition we recorded exit andrestructuring charges of $114 million, $79 million, net of tax. In December 2005, we recorded a $115 milliongain on the sale of our remaining shares of Universal common stock with no related income tax impact.
(b) In 2004, we recorded a $78 million gain on the sale of Universal common stock. There was no income taximpact related to the sale.
21
%%TRANSMSG*** Transmitting Job: H65817 PCN: 022000000 ***%%PCMSG|21 |00008|Yes|No|02/24/2009 15:56|0|0|Page is valid, no graphics -- Color: N|

Item 7. Management’s Discussion and Analysis of Financial Condition and Results of Operations
Our Management’s Discussion and Analysis of Financial Condition and Results of Operations (“MD&A”)begins with an executive overview which, provides a general description of our company today, a synopsis ofindustry market trends, insight into management’s perspective of the opportunities and challenges we face and ouroutlook for 2009. Next, we analyze the results of our operations for the last three years, including the trends in ourbusiness. Then we review our cash flows and liquidity, capital resources and contractual commitments. Weconclude with an overview of our critical accounting judgments and estimates and a summary of recently issuedaccounting pronouncements.
The following discussion should be read in conjunction with our Consolidated Financial Statements and Notesthereto included in “Item 8. Financial Statements and Supplementary Data.” Our discussion includes variousforward-looking statements about our markets, the demand for our products and services and our future results.These statements are based on certain assumptions we consider reasonable. For information about these assump-tions, you should refer to the section entitled “Item 1. Business — Forward-Looking Statements.”
Overview
General
We provide equipment and services used for drilling, completion and production of oil and natural gas wellsthroughout the world. We conduct operations in approximately 100 countries and have service and sales locations innearly all of the oil and natural gas producing regions in the world. Our offerings include drilling services, wellconstruction services, wireline services, fishing and intervention services, completion systems and all forms ofartificial lift.
Our operational performance is segmented and reviewed on a geographic basis and we report the followingregions as separate, distinct reporting segments (1) North America, (2) Latin America, (3) Europe/West Africa/CISand (4) Middle East/North Africa/Asia.
22
%%TRANSMSG*** Transmitting Job: H65817 PCN: 023000000 ***%%PCMSG|22 |00008|Yes|No|02/24/2009 15:56|0|0|Page is valid, no graphics -- Color: N|
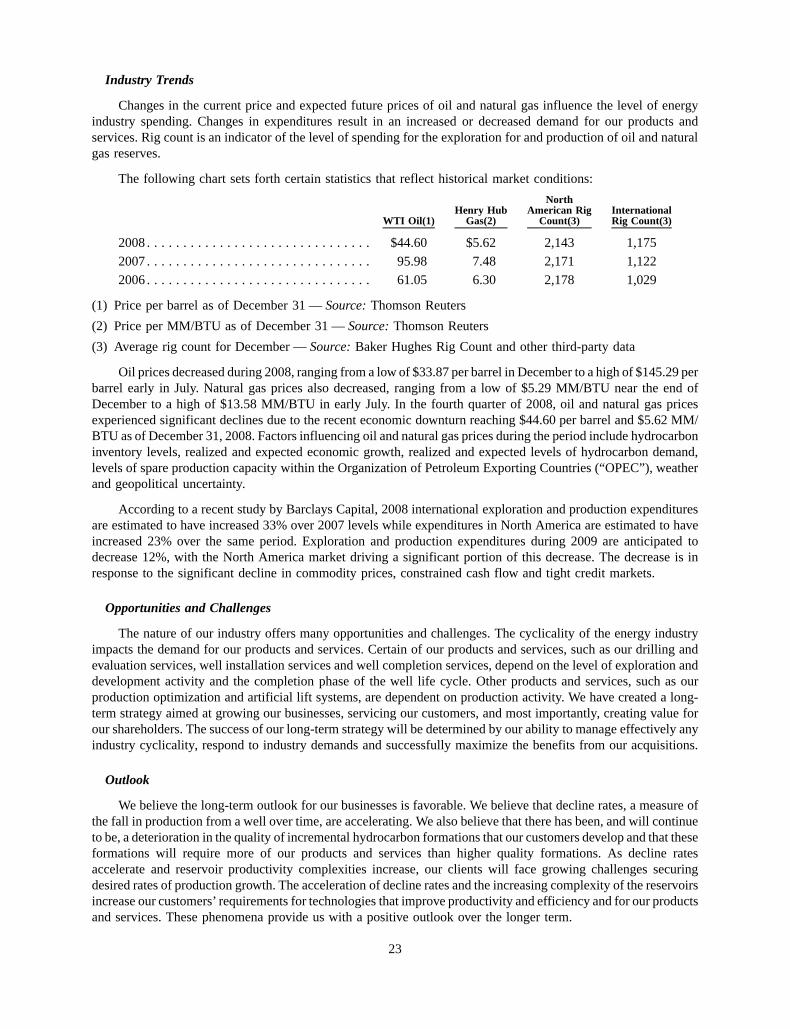
Industry Trends
Changes in the current price and expected future prices of oil and natural gas influence the level of energyindustry spending. Changes in expenditures result in an increased or decreased demand for our products andservices. Rig count is an indicator of the level of spending for the exploration for and production of oil and naturalgas reserves.
The following chart sets forth certain statistics that reflect historical market conditions:
WTI Oil(1)Henry Hub
Gas(2)
NorthAmerican Rig
Count(3)InternationalRig Count(3)
2008 . . . . . . . . . . . . . . . . . . . . . . . . . . . . . . . $44.60 $5.62 2,143 1,175
2007 . . . . . . . . . . . . . . . . . . . . . . . . . . . . . . . 95.98 7.48 2,171 1,122
2006 . . . . . . . . . . . . . . . . . . . . . . . . . . . . . . . 61.05 6.30 2,178 1,029
(1) Price per barrel as of December 31 — Source: Thomson Reuters
(2) Price per MM/BTU as of December 31 — Source: Thomson Reuters
(3) Average rig count for December — Source: Baker Hughes Rig Count and other third-party data
Oil prices decreased during 2008, ranging from a low of $33.87 per barrel in December to a high of $145.29 perbarrel early in July. Natural gas prices also decreased, ranging from a low of $5.29 MM/BTU near the end ofDecember to a high of $13.58 MM/BTU in early July. In the fourth quarter of 2008, oil and natural gas pricesexperienced significant declines due to the recent economic downturn reaching $44.60 per barrel and $5.62 MM/BTU as of December 31, 2008. Factors influencing oil and natural gas prices during the period include hydrocarboninventory levels, realized and expected economic growth, realized and expected levels of hydrocarbon demand,levels of spare production capacity within the Organization of Petroleum Exporting Countries (“OPEC”), weatherand geopolitical uncertainty.
According to a recent study by Barclays Capital, 2008 international exploration and production expendituresare estimated to have increased 33% over 2007 levels while expenditures in North America are estimated to haveincreased 23% over the same period. Exploration and production expenditures during 2009 are anticipated todecrease 12%, with the North America market driving a significant portion of this decrease. The decrease is inresponse to the significant decline in commodity prices, constrained cash flow and tight credit markets.
Opportunities and Challenges
The nature of our industry offers many opportunities and challenges. The cyclicality of the energy industryimpacts the demand for our products and services. Certain of our products and services, such as our drilling andevaluation services, well installation services and well completion services, depend on the level of exploration anddevelopment activity and the completion phase of the well life cycle. Other products and services, such as ourproduction optimization and artificial lift systems, are dependent on production activity. We have created a long-term strategy aimed at growing our businesses, servicing our customers, and most importantly, creating value forour shareholders. The success of our long-term strategy will be determined by our ability to manage effectively anyindustry cyclicality, respond to industry demands and successfully maximize the benefits from our acquisitions.
Outlook
We believe the long-term outlook for our businesses is favorable. We believe that decline rates, a measure ofthe fall in production from a well over time, are accelerating. We also believe that there has been, and will continueto be, a deterioration in the quality of incremental hydrocarbon formations that our customers develop and that theseformations will require more of our products and services than higher quality formations. As decline ratesaccelerate and reservoir productivity complexities increase, our clients will face growing challenges securingdesired rates of production growth. The acceleration of decline rates and the increasing complexity of the reservoirsincrease our customers’ requirements for technologies that improve productivity and efficiency and for our productsand services. These phenomena provide us with a positive outlook over the longer term.
23
%%TRANSMSG*** Transmitting Job: H65817 PCN: 024000000 ***%%PCMSG|23 |00007|Yes|No|02/24/2009 03:49|0|0|Page is valid, no graphics -- Color: N|

Looking into 2009, the near-term outlook is more difficult to assess given the dramatically weakened picture ofthe global economy stemming from a severe dislocation in credit markets and money flows around the world.Climate, natural gas storage levels and commodity prices, as well as expectations for the U.S. economy, will dictatethe level of oilfield service activity in North America for 2009. While these factors are difficult to predict with anycertainty over short periods of time, we anticipate a significant pull back in North American average rig activitycompared to 2008 levels principally due to existing natural gas storage levels, lower natural gas prices and adampened prognosis for the U.S. economy. We believe we are prepared for this decline and intend to adjust our coststructure in North America to be more in-line with the near-term activity prognosis.
We also expect international rig activity to decrease in 2009 as compared to 2008. However, we anticipate thedecrease to be less severe than North America given that international spending is driven by major and national oilcompanies, which take a longer-term view and therefore respond less quickly to short-term changes in commodityprices.
We expect all of our growth in 2009 will come out of the international markets. While it is difficult to predictexact growth rates given the current fluid economic conditions and volatility, we expect our international marketscombined growth rate for 2009 to be in the double digits. We expect North Africa, Middle East, China and CentralEurope to show the largest year-on-year growth in the Eastern Hemisphere. In Latin America, we anticipate ourlarger growth improvements stemming from Brazil and Mexico.
Pricing. During 2008, overall pricing trended upwards, concurrently with raw material and labor costinflation. Pricing in the U.S. and Canada is showing weakness with rigs, tubulars and stimulation showing thestrongest pressures. With a pull back in activity in North America, we would expect pricing in general to come underpressure, with the magnitude dependant upon the extent to which activity declines. In the international markets,pricing is softening where and when contractual terms come to renewal time. Requests by clients to renegotiateexisting contracts are yielding more modest price erosion with significant differences between internationalregions.
Overall, the level of improvements for our businesses for 2009 will continue to depend heavily on our ability tofurther penetrate existing markets with our younger technologies and to successfully introduce these technologies tonew markets. The recruitment, training and retention of personnel will also be a critical factor in growing ourbusinesses. The continued strength of the industry will be highly dependent on many external factors, such as worldeconomic and political conditions, member country quota compliance within OPEC and weather conditions. Theextreme volatility of our markets makes predictions regarding future results difficult.
24
%%TRANSMSG*** Transmitting Job: H65817 PCN: 025000000 ***%%PCMSG|24 |00008|Yes|No|02/24/2009 07:15|0|0|Page is valid, no graphics -- Color: N|

Results of Operations
The following charts contain selected financial data comparing our consolidated and segment results fromoperations for 2008, 2007 and 2006. The information presented has been restated to reflect our 2008 two-for-onestock split.
2008 2007 2006Year Ended December 31,
(In thousands, except percentages andper share data)
Revenues:North America . . . . . . . . . . . . . . . . . . . . . . . . . . . . . . . . . . . . . . $4,460,147 $3,937,456 $3,672,630Middle East/North Africa/Asia . . . . . . . . . . . . . . . . . . . . . . . . . . 2,391,520 1,823,769 1,352,758Europe/West Africa/CIS . . . . . . . . . . . . . . . . . . . . . . . . . . . . . . . 1,539,190 1,188,519 827,343Latin America . . . . . . . . . . . . . . . . . . . . . . . . . . . . . . . . . . . . . . 1,209,707 882,318 726,197
9,600,564 7,832,062 6,578,928Operating Income (Expense):
North America . . . . . . . . . . . . . . . . . . . . . . . . . . . . . . . . . . . . . . 1,125,199 1,013,088 1,040,647Middle East/North Africa/Asia . . . . . . . . . . . . . . . . . . . . . . . . . . 561,012 416,263 279,953Europe/West Africa/CIS . . . . . . . . . . . . . . . . . . . . . . . . . . . . . . . 382,772 293,846 171,798Latin America . . . . . . . . . . . . . . . . . . . . . . . . . . . . . . . . . . . . . . 277,094 203,211 133,027Research and Development . . . . . . . . . . . . . . . . . . . . . . . . . . . . . (192,659) (169,317) (149,429)Corporate . . . . . . . . . . . . . . . . . . . . . . . . . . . . . . . . . . . . . . . . . . (135,012) (101,968) (95,106)Exit and Restructuring . . . . . . . . . . . . . . . . . . . . . . . . . . . . . . . . (39,857) (30,787) (26,203)
1,978,549 1,624,336 1,354,687Interest Expense, Net . . . . . . . . . . . . . . . . . . . . . . . . . . . . . . . . . . . (243,679) (171,281) (102,560)Other, Net . . . . . . . . . . . . . . . . . . . . . . . . . . . . . . . . . . . . . . . . . . . (44,956) (8,569) (13,218)Effective Tax Rate . . . . . . . . . . . . . . . . . . . . . . . . . . . . . . . . . . . . . 17.1% 23.0% 25.9%Income from Continuing Operations per Diluted Share . . . . . . . . . . $ 1.96 $ 1.57 $ 1.28Loss from Discontinued Operation per Diluted Share . . . . . . . . . . . . (0.02) (0.03) (0.02)Net Income per Diluted Share . . . . . . . . . . . . . . . . . . . . . . . . . . . . . 1.94 1.54 1.26Depreciation and Amortization . . . . . . . . . . . . . . . . . . . . . . . . . . . . 731,808 606,226 482,948
Revenues
The following chart contains consolidated revenues by product line for 2008, 2007 and 2006
2008 2007 2006
Year EndedDecember 31,
Artificial Lift Systems . . . . . . . . . . . . . . . . . . . . . . . . . . . . . . . . . . . . . . . . . . . 17% 18% 18%
Drilling Services . . . . . . . . . . . . . . . . . . . . . . . . . . . . . . . . . . . . . . . . . . . . . . . 16 15 15
Well Construction . . . . . . . . . . . . . . . . . . . . . . . . . . . . . . . . . . . . . . . . . . . . . . 15 16 15
Drilling Tools . . . . . . . . . . . . . . . . . . . . . . . . . . . . . . . . . . . . . . . . . . . . . . . . . 11 12 12
Completion Systems . . . . . . . . . . . . . . . . . . . . . . . . . . . . . . . . . . . . . . . . . . . . 10 10 10
Wireline . . . . . . . . . . . . . . . . . . . . . . . . . . . . . . . . . . . . . . . . . . . . . . . . . . . . . 8 8 10
Re-entry & Fishing . . . . . . . . . . . . . . . . . . . . . . . . . . . . . . . . . . . . . . . . . . . . . 7 8 8
Stimulation & Chemicals . . . . . . . . . . . . . . . . . . . . . . . . . . . . . . . . . . . . . . . . . 7 6 6
Integrated Drilling . . . . . . . . . . . . . . . . . . . . . . . . . . . . . . . . . . . . . . . . . . . . . . 6 5 5
Pipeline & Specialty Services . . . . . . . . . . . . . . . . . . . . . . . . . . . . . . . . . . . . . 3 2 1
Total . . . . . . . . . . . . . . . . . . . . . . . . . . . . . . . . . . . . . . . . . . . . . . . . . . . . . . 100% 100% 100%
25
%%TRANSMSG*** Transmitting Job: H65817 PCN: 026000000 ***%%PCMSG|25 |00007|Yes|No|02/21/2009 19:30|0|0|Page is valid, no graphics -- Color: N|

Consolidated revenues increased $1,769 million, or 23%, in 2008 as compared to 2007. Our businessescontinued to benefit from increasing market activity and share gains during 2008. Approximately 70% of ourrevenue growth was derived from outside of North America. International revenues increased $1,246 million, or32%, in 2008 as compared to 2007, which outpaced the 8% increase in average international rig count over thecomparable period and is consistent with international growth trends we experienced in the prior year. Revenuesfrom our drilling services, well construction, artificial lift systems and integrated drilling product lines were strongcontributors to the year-over-year increase.
Consolidated revenues increased $1,253 million, or 19%, in 2007 as compared to 2006. Approximately 79% ofour revenue growth was derived from outside of North America. International revenues increased $988 million, or34%, in 2007 as compared to 2006. This increase outpaced the 8% increase in average international rig count overthe comparable period. Revenues from our drilling services, well construction and artificial lift product lines werestrong contributors to the year-over-year increase.
Operating Income
Consolidated operating income increased $354 million, or 22%, in 2008 as compared to 2007. Our operatingsegments contributed $420 million of incremental operating income during 2008 as compared to 2007. Thisincremental gain was partially offset by an increase in corporate and research and development expenditures of$57 million over 2007 and an increase in exit and restructuring costs of $9 million. The increase in corporate andresearch and development expenses was primarily attributable to higher employee compensation costs.
Consolidated operating income for 2007 increased $270 million, or 20%, as compared to 2006. The increasewas primarily the result of a $301 million increase in operating income from our segments during 2007 as comparedto 2006, which was partially offset by an increase in corporate and research and development expenditures of$27 million over 2006.
We incurred exit and restructuring charges during 2008 of $40 million, which was comprised of $56 million forcosts incurred in connection with our withdrawal from sanctioned countries, $47 million incurred in connectionwith our on-going investigations by the U.S. government and $18 million for severance costs incurred associatedwith restructuring activities. These charges were partially offset by an $81 million gain recognized in the secondquarter of 2008 as a result of selling our 50% interest in a subsidiary we control to Qatar Petroleum for cashconsideration of $113 million.
During 2007, we incurred exit and restructuring charges of $31 million which was comprised of $17 million inseverance charges associated with restructuring activities and $14 million for legal and professional fees incurred inconnection with our on-going investigations by the U.S. government. During 2006, we incurred exit and restruc-turing charges of $26 million, primarily due to severance charges related to restructuring activities.
Interest Expense, Net
Interest expense increased $72 million, or 42%, in 2008 compared to 2007. The increase in interest expensewas primarily attributable to an overall increase in our long-term debt balance during the periods. We issued$1.5 billion in senior notes in June 2007 and an additional $1.5 billion of senior notes in March 2008. This increasewas partially offset by lower weighted average short-term borrowing rates during 2008 as compared to 2007. Theincremental borrowings added during the current year were used to fund capital expenditures and to fund our currentyear acquisitions.
Interest expense increased $69 million, or 67%, in 2007 as compared to 2006. The increase in interest expensewas primarily attributable to an overall increase in our long-term debt combined with higher effective interest ratesassociated with the long-term debt. We issued $0.6 billion in senior notes in August 2006 and an additional$1.5 billion of senior notes in June 2007. The incremental borrowings added during 2007 were used to fund capitalexpenditures, to fund acquisitions and to fund our acquisition of shares under our share repurchase program.
26
%%TRANSMSG*** Transmitting Job: H65817 PCN: 027000000 ***%%PCMSG|26 |00006|Yes|No|02/21/2009 19:30|0|0|Page is valid, no graphics -- Color: N|
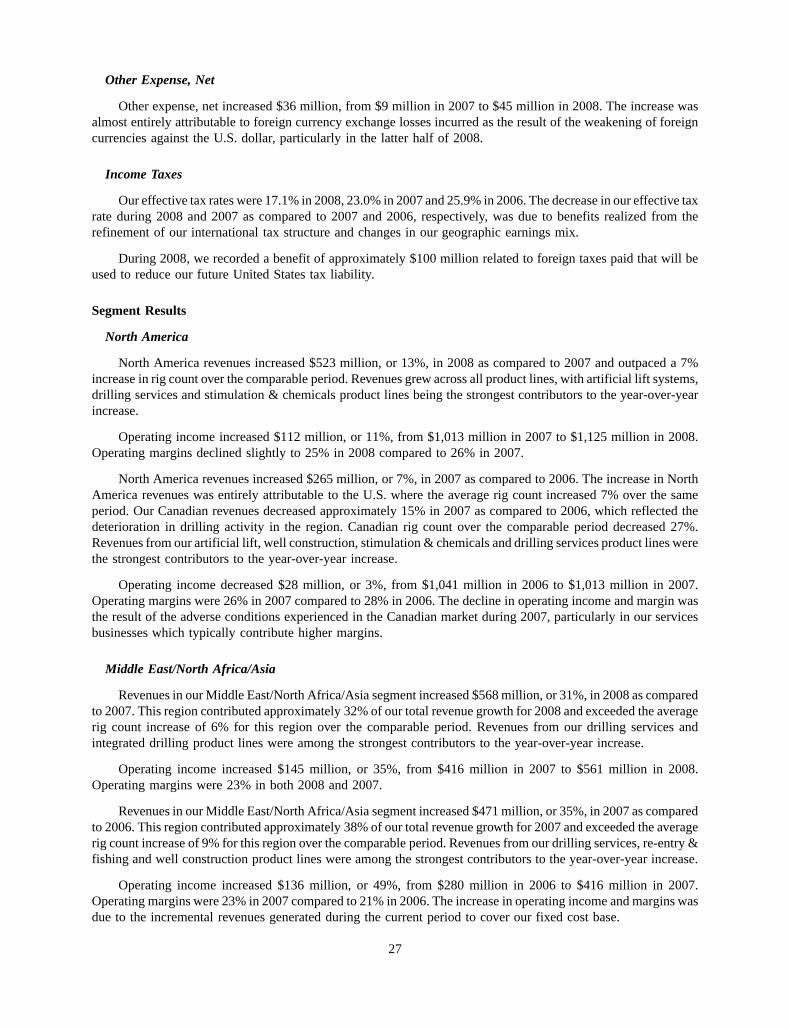
Other Expense, Net
Other expense, net increased $36 million, from $9 million in 2007 to $45 million in 2008. The increase wasalmost entirely attributable to foreign currency exchange losses incurred as the result of the weakening of foreigncurrencies against the U.S. dollar, particularly in the latter half of 2008.
Income Taxes
Our effective tax rates were 17.1% in 2008, 23.0% in 2007 and 25.9% in 2006. The decrease in our effective taxrate during 2008 and 2007 as compared to 2007 and 2006, respectively, was due to benefits realized from therefinement of our international tax structure and changes in our geographic earnings mix.
During 2008, we recorded a benefit of approximately $100 million related to foreign taxes paid that will beused to reduce our future United States tax liability.
Segment Results
North America
North America revenues increased $523 million, or 13%, in 2008 as compared to 2007 and outpaced a 7%increase in rig count over the comparable period. Revenues grew across all product lines, with artificial lift systems,drilling services and stimulation & chemicals product lines being the strongest contributors to the year-over-yearincrease.
Operating income increased $112 million, or 11%, from $1,013 million in 2007 to $1,125 million in 2008.Operating margins declined slightly to 25% in 2008 compared to 26% in 2007.
North America revenues increased $265 million, or 7%, in 2007 as compared to 2006. The increase in NorthAmerica revenues was entirely attributable to the U.S. where the average rig count increased 7% over the sameperiod. Our Canadian revenues decreased approximately 15% in 2007 as compared to 2006, which reflected thedeterioration in drilling activity in the region. Canadian rig count over the comparable period decreased 27%.Revenues from our artificial lift, well construction, stimulation & chemicals and drilling services product lines werethe strongest contributors to the year-over-year increase.
Operating income decreased $28 million, or 3%, from $1,041 million in 2006 to $1,013 million in 2007.Operating margins were 26% in 2007 compared to 28% in 2006. The decline in operating income and margin wasthe result of the adverse conditions experienced in the Canadian market during 2007, particularly in our servicesbusinesses which typically contribute higher margins.
Middle East/North Africa/Asia
Revenues in our Middle East/North Africa/Asia segment increased $568 million, or 31%, in 2008 as comparedto 2007. This region contributed approximately 32% of our total revenue growth for 2008 and exceeded the averagerig count increase of 6% for this region over the comparable period. Revenues from our drilling services andintegrated drilling product lines were among the strongest contributors to the year-over-year increase.
Operating income increased $145 million, or 35%, from $416 million in 2007 to $561 million in 2008.Operating margins were 23% in both 2008 and 2007.
Revenues in our Middle East/North Africa/Asia segment increased $471 million, or 35%, in 2007 as comparedto 2006. This region contributed approximately 38% of our total revenue growth for 2007 and exceeded the averagerig count increase of 9% for this region over the comparable period. Revenues from our drilling services, re-entry &fishing and well construction product lines were among the strongest contributors to the year-over-year increase.
Operating income increased $136 million, or 49%, from $280 million in 2006 to $416 million in 2007.Operating margins were 23% in 2007 compared to 21% in 2006. The increase in operating income and margins wasdue to the incremental revenues generated during the current period to cover our fixed cost base.
27
%%TRANSMSG*** Transmitting Job: H65817 PCN: 028000000 ***%%PCMSG|27 |00010|Yes|No|02/24/2009 12:19|0|0|Page is valid, no graphics -- Color: N|
Europe/West Africa/CIS
Revenues in our Europe/West Africa/CIS segment increased $351 million, or 30%, in 2008 as compared to2007. The region contributed approximately 20% of our total revenue growth for 2008 and exceeded the 20%increase in average rig count in the region over the comparable period. Revenues from our well construction anddrilling services product lines were the strongest contributors to the year-over-year increase.
Operating income increased $89 million, or 30%, from $294 million in 2007 to $383 million in 2008.Operating margins were 25% in both 2008 and 2007.
Revenues in our Europe/West Africa/CIS segment increased $361 million, or 44%, in 2007 as compared to2006. The region contributed approximately 29% of our total revenue growth for 2007 and exceeded the 1%increase in average rig count in the region over the comparable period. Revenues from our well construction,drilling services and completion systems product lines were the strongest contributors to the year-over-yearincrease.
Operating income increased $122 million, or 71%, from $172 million in 2006 to $294 million in 2007.Operating margins were 25% in 2007 compared to 21% in 2006. This year-over-year improvement in operatingincome and margins was primarily the result of higher revenues during the current year absorbing the region’s fixedcost base. In addition, 2007 operating results includes our share in earnings from our equity investment in a Russianjoint venture acquired in June 2007.
Latin America
Revenues in our Latin America segment increased $327 million, or 37%, in 2008 as compared to 2007. Theregion contributed approximately 19% of our total revenue growth for 2008 and outpaced the 8% increase in LatinAmerican rig count over the comparable period. Revenues from our drilling services, completion systems, artificiallift systems and integrated drilling service lines were the strongest contributors to the year-over-year increase.
Operating income increased $74 million, or 36%, from $203 million in 2007 to $277 million in 2008.Operating margins were 23% in both 2008 and 2007.
Revenues in our Latin America segment increased $156 million, or 21%, in 2007 as compared to 2006. Thisincrease outpaced the 10% increase in Latin American rig count over the comparable period. Revenues from ourartificial lift, drilling tools and drilling services service lines were the strongest contributors to the year-over-yearincrease.
Operating income increased $70 million, or 53%, from $133 million in 2006 to $203 million in 2007.Operating margins were 23% in 2007 compared to 18% in 2006. The increase in operating income and margins wasprimarily attributable to the incremental revenues generated during the current year to cover our fixed cost base.
Discontinued Operation
Our discontinued operation consists of our oil and gas development and production company. We had lossesfrom our discontinued operation, net of taxes, of $13 million, $21 million and $10 million for the years ended 2008,2007 and 2006, respectively.
In June 2007, we approved a plan to sell our oil and gas development and production business. We finalized thedivestiture of the business in June 2008. The 2008 loss includes charges of approximately $21 million associatedwith a settlement of a legal dispute regarding the business. These charges were partially offset by an $11 milliongain, net of taxes, recognized upon the finalization of the divestiture. The 2007 loss includes approximately$17 million, net of tax, for asset impairment charges related to write-downs of the operation’s U.S. properties. Inaddition, the we completed the sale of the operation’s international properties in November 2007 and recorded again of approximately $5 million, net of tax, in connection with the sale.
28
%%TRANSMSG*** Transmitting Job: H65817 PCN: 029000000 ***%%PCMSG|28 |00007|Yes|No|02/24/2009 13:48|0|0|Page is valid, no graphics -- Color: N|

Equity Investment Acquisition
We acquired a 33% ownership interest in Premier Business Solutions (“PBS”) in June 2007 for approximately$330 million. PBS conducts business in Russia and is the world’s largest electric submersible pump manufacturerby volume. In January 2008, we sold our electrical submersible pumps product line to PBS and received acombination of cash and an additional equity investment in PBS in consideration of the sale. This transactionincreased our ownership percentage to approximately 40%.
Liquidity and Capital Resources
Sources of Liquidity
Our sources of liquidity include current cash and cash equivalent balances, cash generated from operations,and committed availabilities under bank lines of credit. We also historically have accessed banks for short-termloans from uncommitted borrowing arrangements and the capital markets with debt, equity and convertibleofferings. We maintain a shelf registration statement covering the future issuance of various types of debt and equitysecurities.
Committed Borrowing Facilities
We maintain a $1.5 billion revolving credit agreement with a syndicate of banks. In March 2008, we enteredinto an additional $250 million revolving credit facility. These facilities allow for a combination of borrowings,support for our commercial paper program and issuances of letters of credit and both mature in May 2011. InOctober 2008, we entered into an additional $550 million in revolving credit facilities. These facilities allow for acombination of borrowings and issuances of letter of credits and mature in October 2009. The weighted averageinterest rate on outstanding borrowings of these facilities at December 31, 2008, was 0.9%.
Our committed borrowing facilities require us to maintain a debt-to-capitalization ratio of less than 60% andcontains other covenants and representations customary for an investment-grade commercial credit. Our debt-to-capitalization ratio was 41% at December 31, 2008, which is in compliance with these covenants. The following is arecap of our availability under our committed borrowing facilities at December 31, 2008 (in millions):
Facilities . . . . . . . . . . . . . . . . . . . . . . . . . . . . . . . . . . . . . . . . . . . . . . . . . . . . . . . . . . . . . . $2,300
Less uses of facility:
Amount drawn . . . . . . . . . . . . . . . . . . . . . . . . . . . . . . . . . . . . . . . . . . . . . . . . . . . . . . . . . . 1,068
Commercial paper . . . . . . . . . . . . . . . . . . . . . . . . . . . . . . . . . . . . . . . . . . . . . . . . . . . . . . . 128
Letters of credit . . . . . . . . . . . . . . . . . . . . . . . . . . . . . . . . . . . . . . . . . . . . . . . . . . . . . . . . . 53
Availability . . . . . . . . . . . . . . . . . . . . . . . . . . . . . . . . . . . . . . . . . . . . . . . . . . . . . . . . . . . . $1,051
Commercial Paper
We have a $1.5 billion commercial paper program under which we may from time to time issue short-term,unsecured notes. Our commercial paper issuances are supported by our committed borrowing facilities. Theweighted average interest rate related to outstanding commercial paper issuances at December 31, 2008 was 1.3%.
Cash Requirements
During 2009, we anticipate our cash requirements will include working capital needs and capital expendituresand may include opportunistic business acquisitions. We anticipate funding these requirements from cash generatedfrom operations and, if necessary, from availability under our committed borrowing facilities.
Capital expenditures during the year ended December 31, 2008 were approximately $2.3 billion, net ofproceeds from tools lost down hole. We project our capital expenditures for 2009 will be approximately $1.2 billion.We are projecting lower capital expenditures for the coming year as we adjust our spending to reflect slower growthin the current downward cycle of our industry.
29
%%TRANSMSG*** Transmitting Job: H65817 PCN: 030000000 ***%%PCMSG|29 |00008|Yes|No|02/24/2009 12:21|0|0|Page is valid, no graphics -- Color: N|

From time to time we acquire businesses or technologies or enter into joint ventures to increase our range ofproducts and services, expand our geographic scope or otherwise enhance to our businesses. During the year endedDecember 31, 2008, we used approximately $800 million in cash for business and technology acquisitions.Consideration for 2008 acquisitions also included the issuance of approximately eight million shares valued atapproximately $130 million. From time to time we also divest of businesses when we believe they are no longer coreto our long-term growth strategy or when combining those businesses with a joint venture partner presents astrategic opportunity to us. In 2008, we generated $297 million in cash on sales of businesses, including the sale of a50% interest in a subsidiary we control to Qatar Petroleum, the sale of our electrical submersible pumps business toa joint venture in which we hold an equity interest and divestiture of non-core businesses.
In December 2005, our Board of Directors approved a share repurchase program under which we can spend upto $1.0 billion to repurchase outstanding common shares. We may from time to time repurchase our common sharesdepending upon the price of our common shares, our liquidity and other considerations. As of December 31, 2008,we have $205 million remaining availability under this share repurchase program. During the year endedDecember 31, 2008, no shares were repurchased.
Contractual Obligations
The following summarizes our contractual obligations and contingent commitments by period. The obliga-tions we pay in future periods may vary from those reflected here due to certain assumptions including the durationof our obligations and anticipated actions by third parties.
Obligations and Commitments 20092010 and
20112012 and
2013 Thereafter Total
Payments Due by Period
(In millions)
Short-term debt . . . . . . . . . . . . . . . . . . . . . . $1,240 $ — $ — $ — $ 1,240
Long-term debt(a) . . . . . . . . . . . . . . . . . . . . 11 359 1,352 2,852 4,574
Interest on long-term debt . . . . . . . . . . . . . . 279 555 433 2,505 3,772
Noncancellable operating leases . . . . . . . . . . 111 84 42 115 352Purchase obligations. . . . . . . . . . . . . . . . . . . 327 1 — — 328
Total contractual obligations . . . . . . . . . . . . . $1,968 $999 $1,827 $5,472 $10,266
(a) Amounts represent the expected cash payments for our total debt and do not include any unamortized discountsor deferred gains on terminated interest rate swap agreements.
Due to the uncertainty with respect to the timing of future cash flows associated with our unrecognized taxbenefits at December 31, 2008, we are unable to make reasonably reliable estimates of the period of cash settlementwith the respective taxing authorities. Therefore, unrecognized tax benefits, including interest and penalties of$59 million have been excluded from the contractual obligations table above.
We have defined benefit pension plans covering certain of our U.S. and international employees that providevarious pension benefits. During 2008, we contributed $15 million towards those plans, and for 2009, we anticipatefunding approximately $10 million through cash flows from operating activities.
Senior Notes
In January 2009, we completed a $1.25 billion long-term debt offering comprised of (i) $1 billion of9.625% Senior Notes due in 2019 (“9.625% Senior Notes”) and (ii) $250 million of 9.875% Senior Notes due in2039 (“9.875% Senior Notes”). Net proceeds of $1.23 billion were used to repay short-term borrowings and forgeneral corporate purposes. Interest on the notes is due semi-annually on March 1 and September 1 of each year. Asthe interest rates on the 9.625% Senior Notes and 9.875% Senior Notes are higher than the rates of the short-termborrowings that we repaid, we anticipate that our interest expense in 2009 will be significantly higher than in 2008.
In March 2008, we completed a $1.5 billion long-term debt offering comprised of (i) $500 million of5.15% Senior Notes due in 2013 (“5.15% Senior Notes”), (ii) $500 million of 6.00% Senior Notes due 2018
30
%%TRANSMSG*** Transmitting Job: H65817 PCN: 031000000 ***%%PCMSG|30 |00008|Yes|No|02/24/2009 12:21|0|0|Page is valid, no graphics -- Color: N|
(“6.00% Senior Notes”) and (iii) $500 million of 7.00% Senior Notes due 2038 (“7.00% Senior Notes”). Netproceeds of $1.47 billion were used to repay short-term borrowings and for general corporate purposes, includingcapital expenditures and business acquisitions. Interest on these notes is due semi-annually on March 15 andSeptember 15 of each year.
In June 2007, we completed a $1.5 billion long-term debt offering comprised of (i) $600 million of5.95% senior notes due 2012 (“5.95% Senior Notes”), (ii) $600 million of 6.35% senior notes due 2017(“6.35% Senior Notes”) and (iii) $300 million of 6.80% senior notes due 2037 (“6.80% Senior Notes”). Netproceeds of approximately $1.49 billion were used to repay outstanding borrowings on our commercial paperprogram and for general corporate purposes. Interest on these notes are due payable semi-annually on June 15 andDecember 15 of each year.
In August 2006, we completed an offering of $600 million senior notes at a coupon rate of 6.50%(“6.50% Senior Notes”) with a maturity in August 2036. Net proceeds of approximately $590 million were usedto partially repay outstanding borrowings on our commercial paper program. Interest on the notes is payable semi-annually in arrears on February 1 and August 1 of each year.
In May 2006, the stated maturity date, we repaid in full the outstanding $200 million of 7.25% Senior Notesplus all accrued interest.
In February 2006, we completed an offering of $350 million of 5.50% senior notes due 2016 (“5.50% SeniorNotes”). Interest on the notes is payable semi-annually in arrears on February 15 and August 15 of each year. Netproceeds from the offering were approximately $345 million and were used to reduce borrowings on ourcommercial paper program.
Interest Rate Swaps
Upon completion of the long-term debt offering in March 2008, the Company entered into interest rate swapagreements on an aggregate notional amount of $500 million against its 5.15% Senior Notes. These agreementswere terminated in December 2008. As a result of these terminations, we received cash proceeds, net of accruedinterest, of $12 million. The gain associated with this interest rate swap termination has been deferred and will beamortized over the remaining term of the 5.15% Senior Notes. As of December 31, 2008 and 2007, we had netunamortized gains of $21 million and $12 million, respectively, associated with our interest rate swap terminations.
Other Derivative Instruments
As of December 31, 2008 and 2007, we had several foreign currency forward contracts with notional amountsaggregating $503 million and $682 million, respectively, which were entered into to hedge exposure to currencyfluctuations in various foreign currencies, including, but not limited to, the British pound sterling, the Canadiandollar, the euro and the Norwegian krone. The total estimated fair value of these contracts at December 31, 2008resulted in a liability of approximately $2 million and at December 31, 2007 resulted in an asset of approximately$2 million. These derivative instruments were not designated as hedges and the changes in fair value of the contractsare recorded each period in current earnings.
In addition, after the closing of the acquisition of Precision Energy Services and Precision Drilling Inter-national, we entered into a series of cross-currency swaps between the U.S. dollar and Canadian dollar to hedgecertain exposures to the Canadian dollar created as a result of the acquisition. At December 31, 2008 and 2007, wehad notional amounts outstanding of $280 million and $364 million, respectively. The total estimated fair value ofthese contracts at December 31, 2008 and 2007 resulted in an asset of $1 million and a liability of $74 million,respectively. These derivative instruments were not designated as hedges and the changes in fair value of thecontracts are recorded each period in current earnings.
Warrant
On February 28, 2002, we issued Shell Technology Ventures Inc. a warrant to purchase up to 12.9 millioncommon shares at a price of $15.00 per share. Effective July 12, 2006, this agreement was amended and restated toreflect, among other things, changes in our capital structure. The warrant remains exercisable until February 28,
31
%%TRANSMSG*** Transmitting Job: H65817 PCN: 032000000 ***%%PCMSG|31 |00006|Yes|No|02/21/2009 19:30|0|0|Page is valid, no graphics -- Color: N|
2012 and is subject to adjustment for changes in our capital structure or the issuance of dividends in cash, securitiesor property. Upon exercise by the holder, settlement may occur through physical delivery, net share settlement, netcash settlement or a combination of those methods. The net cash settlement option upon exercise is at our solediscretion. In addition, the amended and restated warrant no longer contains a conversion feature, which previouslyallowed the warrant holder to convert the warrant into common shares. The amendment did not affect theaccounting or classification of the warrant.
Off Balance Sheet Arrangements
Guarantees
The following obligations of Weatherford International, Inc. (“Issuer”) were guaranteed by WeatherfordInternational Ltd. (“Parent”) as of December 31, 2008: (i) the 6.625% Senior Notes, (ii) the 5.95% Senior Notes,(iii) the 6.35% Senior Notes, and (iv) the 6.80% Senior Notes.
The following obligations of the Parent were guaranteed by the Issuer as of December 31, 2008: (i) therevolving credit facilities, (ii) the 4.95% Senior Notes, (iii) the 5.50% Senior Notes, (iv) the 6.50% Senior Notes,(v) the 5.15% Senior Notes, (vi) the 6.00% Senior Notes, (vii) the 7.00% Senior Notes and (viii) issuances of notesunder the commercial paper program.
Letters of Credit
We execute letters of credit in the normal course of business. While these obligations are not normally called, theseobligations could be called by the beneficiaries at any time before the expiration date should we breach certain contractualor payment obligations. As of December 31, 2008, we had $273 million of letters of credit and bid and performance bondsoutstanding, consisting of $220 million outstanding under various uncommitted credit facilities and $53 million letters ofcredit outstanding under our committed facilities. If the beneficiaries called these letters of credit, the called amount wouldbecome an on-balance sheet liability, and our available liquidity would be reduced by the amount called.
Critical Accounting Policies and Estimates
Our discussion and analysis of our financial condition and results of operation is based upon our consolidatedfinancial statements. We prepare these financial statements in conformity with U.S. generally accepted accountingprinciples. As such, we are required to make certain estimates, judgments and assumptions that affect the reportedamounts of assets and liabilities at the date of the financial statements and the reported amounts of revenues andexpenses during the periods presented. We base our estimates on historical experience, available information andvarious other assumptions we believe to be reasonable under the circumstances. On an on-going basis, we evaluateour estimates; however, actual results may differ from these estimates under different assumptions or conditions.The accounting policies we believe require management’s most difficult, subjective or complex judgments and arethe most critical to our reporting of results of operations and financial position are as follows:
Business Combinations and Goodwill and Indefinite-Lived Intangible Assets
Goodwill and intangible assets acquired in connection with business combinations represent the excess ofconsideration over the fair value of tangible net assets acquired. Certain assumptions and estimates are employed indetermining the fair value of assets acquired, the fair value of liabilities assumed, as well as in determining theallocation of goodwill to the appropriate reporting unit.
We perform an impairment test for goodwill and indefinite-lived intangible assets annually as of October 1, orearlier if indicators of potential impairment exist. In addition, we updated our goodwill impairment test inDecember 2008 as a result of a decline in our share price experienced during the fourth quarter. Our goodwillimpairment test involves a comparison of the fair value of each of our reporting units with their carrying value. Ourreporting units are based on our regional structure and consist of the United States, Canada, Latin America, Europe,West Africa, Russia/CIS, Middle East/North Africa and Asia Pacific. Our impairment test for indefinite-livedintangible assets involves the comparison of the fair value of the intangible asset and its carrying value. The fairvalue is determined using discounted cash flows using a discount rate adjusted for the credit risk of the regionalreporting unit tested. Certain estimates and judgments are required in the application of these fair value models.
32
%%TRANSMSG*** Transmitting Job: H65817 PCN: 033000000 ***%%PCMSG|32 |00009|Yes|No|02/24/2009 12:22|0|0|Page is valid, no graphics -- Color: N|

The discounted cash flow analysis consists of estimating the future cash flows that are directly associated with eachof our reporting units. These cash flows are inherently subjective and require significant estimates based uponhistorical experience and future expectations such as budgets and industry projections. We have determined noimpairment exists; however, if for any reason the fair value of our goodwill or that of any of our reporting units or thefair value of our intangible assets with indefinite lives declines below the carrying value in the future, we may incurcharges for the impairment. The amount of the impairment, if any, is then determined based on an allocation of thereporting unit fair values to individual assets and liabilities.
Long-Lived Assets
Long-lived assets, which includes property, plant and equipment and definite-lived intangibles, comprise asignificant amount of our assets. In accounting for long-lived assets, we must make estimates about the expecteduseful lives of the assets and the potential for impairment based on the fair value of the assets and the cash flows theyare expected to generate. The value of the long-lived assets is then amortized over its expected useful life. A changein the estimated useful lives of our long-lived assets would have an impact on our results of operations. We estimatethe useful lives of our long-lived asset groups as follows:
Useful Lives
Buildings and leasehold improvements . . . . . . . . . . . . . . . . . . . . . . . . . . . 5-40 years or lease term
Rental and service equipment . . . . . . . . . . . . . . . . . . . . . . . . . . . . . . . . . . 2-20 years
Machinery and other . . . . . . . . . . . . . . . . . . . . . . . . . . . . . . . . . . . . . . . . 2-12 yearsIntangible assets. . . . . . . . . . . . . . . . . . . . . . . . . . . . . . . . . . . . . . . . . . . . 2-20 years
In estimating the useful lives of our property, plant and equipment, we rely primarily on our actual experiencewith the same or similar assets. The useful lives of our intangible assets are determined by the years over which weexpect the assets to generate a benefit based on legal, contractual or regulatory terms.
Long-lived assets to be held and used by us are reviewed to determine whether any events or changes incircumstances indicate that we may not be able to recover the carrying amount of the asset. Factors that mightindicate a potential impairment may include, but are not limited to, significant decreases in the market value of thelong-lived asset, a significant change in the long-lived asset’s physical condition, the introduction of competingtechnologies, legal challenges, a change in industry conditions or a reduction in cash flows associated with the useof the long-lived asset. If these or other factors exist that indicate the carrying amount of the asset may not berecoverable, we determine whether an impairment has occurred through the use of an undiscounted cash flowanalysis. The undiscounted cash flow analysis consists of estimating the future cash flows that are directlyassociated with and expected to arise from the use and eventual disposition of the asset over its remaining useful life.These cash flows are inherently subjective and require significant estimates based upon historical experience andfuture expectations such as budgets and internal projections. If the undiscounted cash flows do not exceed thecarrying value of the long-lived asset, an impairment has occurred, and we recognize a loss for the differencebetween the carrying amount and the estimated fair value of the asset. The fair value of the asset is measured usingmarket prices, or in the absence of market prices, is based on an estimate of discounted cash flows. Cash flows aregenerally discounted at an interest rate commensurate with our weighted average cost of capital for a similar asset.
Employee Share-Based Compensation
Statement of Financial Accounting Standards (“SFAS”) No. 123 (Revised 2004) Share-Based Payment(“SFAS No. 123R”) addresses the accounting for all share-based payment awards, including shares issued underemployee stock purchase plans, stock options, restricted stock and stock appreciation rights. Under SFAS No. 123R,companies account for share-based compensation transactions using a fair-value method and recognize the expensein the consolidated statement of income.
The fair value of options is estimated using the Black-Scholes option pricing model. Key assumptions in theBlack-Scholes option pricing model, some of which are based on subjective expectations, are subject to change. Achange in one or more of these assumptions would impact the expense associated with future grants. These keyassumptions include the volatility of our common shares, the risk-free interest rate and the expected life of options.
33
%%TRANSMSG*** Transmitting Job: H65817 PCN: 034000000 ***%%PCMSG|33 |00007|Yes|No|02/24/2009 06:07|0|0|Page is valid, no graphics -- Color: N|

We used the following weighted average assumptions in the Black-Scholes option pricing model fordetermining the fair value of our 2006 and 2007 stock option grants. There were no stock options granted in 2008.
2007 2006
Year EndedDecember 31,
Expected volatility . . . . . . . . . . . . . . . . . . . . . . . . . . . . . . . . . . . . . . . . . . . . . . . . . . . 31.0% 36.2%
Expected dividends . . . . . . . . . . . . . . . . . . . . . . . . . . . . . . . . . . . . . . . . . . . . . . . . . . — —
Expected term (in years) . . . . . . . . . . . . . . . . . . . . . . . . . . . . . . . . . . . . . . . . . . . . . . 5.0 5.0
Risk-free rate. . . . . . . . . . . . . . . . . . . . . . . . . . . . . . . . . . . . . . . . . . . . . . . . . . . . . . . 4.5% 4.7%
We calculated the expected volatility of options granted in 2007 using a blended rate based upon impliedvolatility calculated on actively traded options on our common shares and upon the historical volatility of ourcommon shares. We calculated the expected volatility for options granted in 2006 by measuring the volatility of ourhistorical stock price for a period equal to the expected life of the option and ending at the time the option wasgranted. We determined the risk-free interest rate based upon the interest rate on a U.S. Treasury Bill with a termequal to the expected life of the option at the time the option was granted. In estimating the expected lives of ourstock options, we have relied primarily on our actual experience with our previous stock option grants. The expectedlife is less than the term of the option as option holders, in our experience, exercise or forfeit the options during theterm of the option.
Pension and Other Postretirement Benefits
Statement No. 158, Employers’ Accounting for Defined Benefit Pension and Other Postretirement Plans, anamendment of FASB Statements No. 87, 88, 106, and 132(R) (“SFAS No. 158”) requires recognition of theoverfunded or underfunded status of an entity’s defined benefit or postretirement plan as an asset or liability in thefinancial statements, requires the measurement of defined benefit or postretirement plan assets and obligations as ofthe end of the employer’s fiscal year, and requires recognition of the previously deferred portion of defined benefitor postretirement plans in other comprehensive income.
Amounts recognized in the financial statements must be determined on an actuarial basis. Two of the morecritical assumptions in the actuarial calculations are the discount rate for determining the current value of planbenefits and the expected rate of return on plan assets. Discount rates are based on the yields of government bonds orhigh quality corporate bonds in the respective country or economic market. The expected long-term rates of returnon plan assets are based on a combination of historical experience and anticipated future returns in each of the assetcategories. As we have both domestic and international plans, the assumptions, though the same in nature, are basedon varying factors specific to each particular country or economic environment. Changes in any of the assumptionsused could impact our projected benefit obligations and benefit costs as well as other pension and postretirementbenefit calculations.
Due to the significance of the discount rates and expected long-term rates of return, the following sensitivityanalysis demonstrates the effect that a 50 basis point change in those assumptions will have on annual pensionexpense:
50 Basis PointIncrease
50 Basis PointDecrease
Increase (Decrease) of AnnualPension Expense
(In millions)
Discount rate . . . . . . . . . . . . . . . . . . . . . . . . . . . . . . . . . . . . . . . . . . . $(1.4) $1.4Expected long-term rate of return . . . . . . . . . . . . . . . . . . . . . . . . . . . . (0.4) 0.4
Percentage of Completion
Revenue from long-term contracts, primarily for our integrated project management services, is reported onthe percentage-of-completion method of accounting. This method of accounting requires us to calculate contract
34
%%TRANSMSG*** Transmitting Job: H65817 PCN: 035000000 ***%%PCMSG|34 |00006|Yes|No|02/21/2009 19:30|0|0|Page is valid, no graphics -- Color: N|

profit to be recognized in each reporting period for each contract based upon our projections of future outcomes,which include:
• estimates of the total cost to complete the project;
• estimates of project schedule and completion date;
• estimates of the extent of progress toward completion; and
• amounts of any change orders or claims included in revenue.
Measurements of progress are generally output based related to physical progress. At the outset of eachcontract, we prepare a detailed analysis of our estimated cost to complete the project. Risks related to servicedelivery, usage, productivity, and other factors are considered in the estimation process. Our personnel periodicallyevaluate the estimated costs, claims, change orders, and percentage of completion at the contract level. Therecording of profits and losses on long-term contracts requires an estimate of the total profit or loss over the life ofeach contract. This estimate requires consideration of total contract value, change orders, and claims, less costsincurred and estimated costs to complete. There are many factors that impact future costs, including but not limitedto weather, inflation, labor and community disruptions, timely availability of materials, productivity, and otherfactors as outlined in our “Risk Factors.” Anticipated losses on contracts are recorded in full in the period in whichthey become evident. Profits are recorded based upon the total estimated contract profit times the current percentagecomplete for the contract. At least quarterly, significant contracts are reviewed in detail by senior management.
Income Taxes
We provide for income taxes in accordance with SFAS No. 109, Accounting for Income Taxes. This standardtakes into account the differences between the financial statement treatment and tax treatment of certain trans-actions. Deferred tax assets and liabilities are recognized for the future tax consequences attributable to differencesbetween the financial statement carrying amounts of existing assets and liabilities and their respective tax bases.Deferred tax assets and liabilities are measured using enacted tax rates expected to apply to taxable income in theyears in which those temporary differences are expected to be recovered or settled. The effect of a change in taxrates is recognized as income or expense in the period that includes the enactment date. Our effective tax rates for2008, 2007 and 2006 were 17.1%, 23.0% and 25.9%, respectively.
Effective January 1, 2007, we adopted the provisions of Financial Accounting Standards Board (“FASB”)Interpretation No. 48, Accounting for Uncertainty in Income Taxes — an interpretation of FASB Statement No. 109(“FIN No. 48”). FIN No. 48 clarifies the accounting for uncertainty in income taxes recognized in an enterprise’sfinancial statements and prescribes a recognition threshold and measurement attributes of income tax positionstaken or expected to be taken on a tax return. Under FIN No. 48, the impact of an uncertain tax position taken orexpected to be taken on an income tax return must be recognized in the financial statements at the largest amountthat is more-likely-than-not to be sustained upon examination by the relevant taxing authority.
We operate in approximately 100 countries through various legal entities. As a result, we are subject tonumerous domestic and foreign tax jurisdictions and tax agreements and treaties among the various taxingauthorities. Our operations in these jurisdictions are taxed on various bases: income before taxes, deemed profits(which is generally determined using a percentage of revenues rather than profits) and withholding taxes based onrevenue. The calculation of our tax liabilities involves consideration of uncertainties in the application andinterpretation of complex tax regulations in a multitude of jurisdictions across our global operations. We recognizepotential liabilities and record tax liabilities for anticipated tax audit issues in the U.S. and other tax jurisdictionsbased on our estimate of whether, and the extent to which, additional taxes will be due. The tax liabilities arereflected net of realized tax loss carryforwards. We adjust these reserves upon specific events; however, due to thecomplexity of some of these uncertainties, the ultimate resolution may result in a payment that is different from ourcurrent estimate of the tax liabilities. If our estimate of tax liabilities proves to be less than the ultimate assessment,an additional charge to expense would result. If payment of these amounts ultimately proves to be less than therecorded amounts, the reversal of the liabilities would result in tax benefits being recognized in the period when thecontingency has been resolved and the liabilities are no longer necessary. If the tax liabilities relate to taxuncertainties existing at the date of the acquisition of a business, the adjustment of such tax liabilities will result in
35
%%TRANSMSG*** Transmitting Job: H65817 PCN: 036000000 ***%%PCMSG|35 |00009|Yes|No|02/24/2009 15:40|0|0|Page is valid, no graphics -- Color: N|

an adjustment to the goodwill recorded at the date of acquisition. Changes in tax laws, regulations, agreements andtreaties, foreign currency exchange restrictions or our level of operations or profitability in each taxing jurisdictioncould have an impact upon the amount of income taxes that we provide during any given year.
Valuation Allowance for Deferred Tax Assets
We record a valuation allowance to reduce the carrying value of our deferred tax assets when it is more likelythan not that a portion or all of the deferred tax assets will expire before realization of the benefit or that futuredeductibility is not probable. The ultimate realization of the deferred tax assets depends on the ability to generatesufficient taxable income of the appropriate character and in the related jurisdiction in the future. In evaluating ourability to recover our deferred tax assets, we consider all reasonably available positive and negative evidence,including our past operating results, the existence of cumulative losses in the most recent years and our forecast offuture taxable income. In estimating future taxable income, we develop assumptions, including the amount of futurestate, federal and international pretax operating income, the reversal of temporary differences and the implemen-tation of feasible and prudent tax planning strategies. These assumptions require significant judgment.
We have identified various domestic and international tax planning strategies that we would implement, ifnecessary, to enable the realization of our deferred tax assets; however, when the likelihood of the realization ofexisting deferred tax assets changes, adjustments to the valuation allowance are charged to our income tax provisionin the period in which the determination is made.
As of December 31, 2008, our net deferred tax assets were $133 million before a related valuation allowance of$69 million. As of December 31, 2007, our net deferred tax assets were $66 million before a related valuationallowance of $62 million.
For a more comprehensive list of our accounting policies, see “Item 8. Financial Statements and Supple-mentary Data — Notes to Consolidated Financial Statements — Note 1.”
New Accounting Pronouncements
In September 2006, the FASB issued Statement No. 157, Fair Value Measurements (“SFAS No. 157”), whichdefines fair value, established a framework for measuring fair value under generally accepted accounting principles(“GAAP”) and expands disclosures about fair value measurements. SFAS No. 157 applies to other accountingpronouncements that require or permit fair value measurements. Effective January 1, 2008, we adoptedSFAS No. 157 as it relates to financial assets and financial liabilities. In February 2008, the FASB issued FASBStaff Position No. FAS 157-2, Effective Date of FASB Statement No. 157, which delayed the effective date ofSFAS No. 157 for all nonfinancial assets and nonfinancial liabilities, except those that are recognized or disclosed atfair value in the financial statements on at least an annual basis, until January 1, 2009 for calendar year-end entities.Accordingly, we will defer the adoption of SFAS No. 157 for is nonfinancial assets and nonfinancial liabilities untilJanuary 1, 2009.
In December 2007, the FASB issued SFAS No. 141 (revised 2007), Business Combinations(“SFAS No. 141R”). SFAS No. 141R establishes principles and requirements for how a company recognizesassets acquired, liabilities assumed, contractual contingencies and contingent consideration measured at fair valueat the acquisition date. The Statement also establishes disclosure requirements which will enable users to evaluatethe nature and financial effect of the business combination. SFAS No. 141R is effective for business combinationscompleted in fiscal years beginning after December 15, 2008.
In December 2007, the FASB issued SFAS No. 160 Noncontrolling Interests in Consolidated FinancialStatements — an amendment of ARB No. 51 (“SFAS No. 160”). SFAS No. 160 establishes accounting and reportingstandards for ownership interests in subsidiaries held by parties other than the parent, the amount of consolidated netincome attributable to the parent and to the noncontrolling interest, changes in a parent’s ownership interest and thevaluation of retained noncontrolling equity investments when a subsidiary is deconsolidated. The Statement alsoestablishes reporting requirements that provide sufficient disclosures that clearly identify and distinguish betweenthe interest of the parent and the interest of the noncontrolling owners. SFAS No. 160 is effective for fiscal yearsbeginning after December 15, 2008.
36
%%TRANSMSG*** Transmitting Job: H65817 PCN: 037000000 ***%%PCMSG|36 |00007|Yes|No|02/24/2009 12:49|0|0|Page is valid, no graphics -- Color: N|

In March 2008, the FASB issued Statement No. 161, Disclosures about Derivative Instruments and HedgingActivities (“SFAS No. 161”). SFAS No. 161 requires enhanced disclosures about an entity’s derivative and hedgingactivity. Entities are required to provide enhanced disclosures about how and why they use derivative instruments,how derivative instruments and related hedged items are accounted for under SFAS No. 133 and how derivativeinstruments and related hedged items affect an entity’s financial position, financial performance and cash flows.This statement is effective for financial statements issued for fiscal years and interim periods beginning afterNovember 15, 2008.
Item 7A. Quantitative and Qualitative Disclosure About Market Risk
We are currently exposed to market risk from changes in foreign currency and changes in interest rates. Fromtime to time, we may enter into derivative financial instrument transactions to manage or reduce our market risk, butwe do not enter into derivative transactions for speculative purposes. A discussion of our market risk exposure inthese financial instruments follows.
Foreign Currency Exchange Rates
We operate in virtually every oil and natural gas exploration and production region in the world. In some partsof the world, such as the Middle East and Southeast Asia, the currency of our primary economic environment is theU.S. dollar. We use this as our functional currency. In other parts of the world, we conduct our business in currenciesother than the U.S. dollar and the functional currency is the applicable local currency. In those countries in which weoperate in the local currency, the effects of foreign currency fluctuations are largely mitigated because localexpenses of such foreign operations are also generally denominated in the same currency.
Assets and liabilities of which the functional currency is the local currency are translated into U.S. dollarsusing the exchange rates in effect at the balance sheet date, resulting in translation adjustments that are reflected asAccumulated Other Comprehensive Income in the shareholders’ equity section on our Consolidated BalanceSheets. A portion of our net assets are impacted by changes in foreign currencies in relation to the U.S. dollar. Werecorded a $683 million adjustment to decrease our equity account for the year ended December 31, 2008 to reflectthe net impact of the strengthening of the U.S. dollar against various foreign currencies.
As of December 31, 2008 and 2007, we had several foreign currency forward contracts with notional amountsaggregating $503 million and $682 million, respectively, which were entered into to hedge exposure to currencyfluctuations in various foreign currencies, including, but not limited to, the British pound sterling, the Canadiandollar, the euro and the Norwegian krone. The total estimated fair value of these contracts at December 31, 2008resulted in a liability of approximately $2 million and at December 31, 2007, resulted in an asset of approximately$2 million. These derivative instruments were not designated as hedges and the changes in fair value of the contractsare recorded each period in current earnings.
In addition, after the closing of the acquisition of Precision Energy Services and Precision Drilling Inter-national, we entered into a series of cross-currency swaps between the U.S. dollar and Canadian dollar to hedgecertain exposures to the Canadian dollar created as a result of the acquisition. At December 31, 2008 and 2007, wehad notional amounts outstanding of $280 million and $364 million, respectively. The estimated fair value of thesecontracts at December 31, 2008 and 2007 resulted in an asset of $1 million and a liability of $74 million,respectively. These derivative instruments were not designated as hedges and the changes in fair value of thecontracts are recorded each period in current earnings.
Interest Rates
We are subject to interest rate risk on our long-term fixed-interest rate debt and variable-interest rateborrowings. Variable rate debt, where the interest rate fluctuates periodically, exposes us to short-term changesin market interest rates. Fixed rate debt, where the interest rate is fixed over the life of the instrument, exposes us to
37
%%TRANSMSG*** Transmitting Job: H65817 PCN: 038000000 ***%%PCMSG|37 |00011|Yes|No|02/24/2009 15:57|0|0|Page is valid, no graphics -- Color: N|

changes in market interest rates reflected in the fair value of the debt and to the risk that we may need to refinancematuring debt with new debt at a higher rate. All other things being equal, the fair value of our fixed rate debt willincrease or decrease as interest rates change.
Our long-term borrowings that were outstanding at December 31, 2008 subject to interest rate risk consist ofthe following:
CarryingAmount
FairValue
CarryingAmount
FairValue
2008 2007December 31,
(In millions)
6.625% Senior Notes due 2011 . . . . . . . . . . . . . . . . . . . . . . . . $354 $330 $356 $369
5.95% Senior Notes due 2012. . . . . . . . . . . . . . . . . . . . . . . . . 599 585 599 6185.15% Senior Notes due 2012. . . . . . . . . . . . . . . . . . . . . . . . . 511 463 — —
4.95% Senior Notes due 2013. . . . . . . . . . . . . . . . . . . . . . . . . 254 213 255 245
5.50% Senior Notes due 2016. . . . . . . . . . . . . . . . . . . . . . . . . 349 306 349 338
6.35% Senior Notes due 2017. . . . . . . . . . . . . . . . . . . . . . . . . 600 513 600 624
6.00% Senior Notes due 2018. . . . . . . . . . . . . . . . . . . . . . . . . 498 456 — —
6.50% Senior Notes due 2036. . . . . . . . . . . . . . . . . . . . . . . . . 596 495 596 598
6.80% Senior Notes due 2037. . . . . . . . . . . . . . . . . . . . . . . . . 298 227 298 313
7.00% Senior Notes due 2038. . . . . . . . . . . . . . . . . . . . . . . . . 498 394 — —
We have various other long-term debt instruments of $24 million at December 31, 2008, but believe the impactof changes in interest rates in the near term will not be material to these instruments. Short-term borrowings of$1.2 billion at December 31, 2008 approximate fair value.
As it relates to our variable rate debt, if market interest rates average 1% more in 2009 than the rates as ofDecember 31, 2008, interest expense for 2009 would increase by $13 million. This amount was determined bycalculating the effect of the hypothetical interest rate on our variable rate debt. This sensitivity analysis assumesthere are no changes in our financial structure.
Interest Rate Swaps and Derivatives
We manage our debt portfolio to achieve an overall desired position of fixed and floating rates and may employinterest rate swaps as a tool to achieve that goal. The major risks from interest rate derivatives include changes in theinterest rates affecting the fair value of such instruments, potential increases in interest expense due to marketincreases in floating interest rates and the creditworthiness of the counterparties in such transactions. Thecounterparties to our interest rate swaps are multinational commercial banks. In light of recent events in theglobal credit markets and the potential impact of these events on the liquidity of the banking industry, we continue tomonitor the creditworthiness of our counterparties.
We use interest rate swaps to take advantage of available short-term interest rates. Amounts received upontermination of the swaps represent the fair value of the agreements at the time of termination and are recorded as anadjustment to the carrying value of the related debt. These amounts are being amortized as a reduction to interestexpense over the remaining term of the debt.
Upon completion of the long-term debt offering in March 2008, we entered into interest rate swap agreementson an aggregate notional amount of $500 million against our 5.15% Senior Notes. These agreements wereterminated in December 2008. As a result of these terminations, we received cash proceeds, net of accrued interest,of $12 million. The gain associated with this interest rate swap termination has been deferred and will be amortizedover the remaining term of the 5.15% Senior Notes.
As of December 31, 2008 and 2007, we had net unamortized gains of $21 million and $12 million, respectively,associated with interest rate swap terminations. Our interest expense was reduced by $3 million and $2 million forthe years ended December 31, 2008 and 2007, respectively.
38
%%TRANSMSG*** Transmitting Job: H65817 PCN: 039000000 ***%%PCMSG|38 |00009|Yes|No|02/21/2009 19:30|0|0|Page is valid, no graphics -- Color: N|

Item 8. Financial Statements and Supplementary Data
INDEX TO FINANCIAL STATEMENTS AND FINANCIAL STATEMENT SCHEDULE
Page
Management’s Report on Internal Control Over Financial Reporting . . . . . . . . . . . . . . . . . . . . . . . . . . . 40
Report of Independent Registered Public Accounting Firm on Internal Control over FinancialReporting . . . . . . . . . . . . . . . . . . . . . . . . . . . . . . . . . . . . . . . . . . . . . . . . . . . . . . . . . . . . . . . . . . . . . 41
Report of Independent Registered Public Accounting Firm. . . . . . . . . . . . . . . . . . . . . . . . . . . . . . . . . . . 42
Consolidated Balance Sheets as of December 31, 2008 and 2007 . . . . . . . . . . . . . . . . . . . . . . . . . . . . . . 43
Consolidated Statements of Income for each of the three years in the period ended December 31,2008. . . . . . . . . . . . . . . . . . . . . . . . . . . . . . . . . . . . . . . . . . . . . . . . . . . . . . . . . . . . . . . . . . . . . . . . . 44
Consolidated Statements of Shareholders’ Equity for each of the three years in the period endedDecember 31, 2008 . . . . . . . . . . . . . . . . . . . . . . . . . . . . . . . . . . . . . . . . . . . . . . . . . . . . . . . . . . . . . . 45
Consolidated Statements of Cash Flows for each of the three years in the period ended December 31,2008. . . . . . . . . . . . . . . . . . . . . . . . . . . . . . . . . . . . . . . . . . . . . . . . . . . . . . . . . . . . . . . . . . . . . . . . . 46
Notes to Consolidated Financial Statements . . . . . . . . . . . . . . . . . . . . . . . . . . . . . . . . . . . . . . . . . . . . . . 47
Financial Statement Schedule II:
Valuation and Qualifying Accounts and Allowances . . . . . . . . . . . . . . . . . . . . . . . . . . . . . . . . . . . . . . 94
39
%%TRANSMSG*** Transmitting Job: H65817 PCN: 040000000 ***%%PCMSG|39 |00011|Yes|No|02/24/2009 15:57|0|0|Page is valid, no graphics -- Color: N|

MANAGEMENT’S REPORT ON INTERNAL CONTROL OVER FINANCIAL REPORTING
Management of the Company is responsible for establishing and maintaining adequate internal control overfinancial reporting as such term is defined in the Securities Exchange Act of 1934 Rule 13a-15(f). The Company’sinternal controls were designed to provide reasonable assurance as to the reliability of our financial reporting andthe preparation of financial statements for external purposes in accordance with U.S. generally accepted accountingprinciples.
Because of its inherent limitations, internal control over financial reporting may not prevent or detectmisstatements. Also, projections of any evaluation of effectiveness to future periods are subject to the risk thatcontrols may become inadequate because of changes in conditions, or that the degree of compliance with thepolicies or procedures may deteriorate.
Management assessed the effectiveness of the Company’s internal control over financial reporting as ofDecember 31, 2008. In making its assessment, management has utilized the criteria set forth by the Committee ofSponsoring Organizations of the Treadway Commission in Internal Control-Integrated Framework. Based on thisassessment, management concluded that as of December 31, 2008 the Company’s internal control over financialreporting is effective.
The effectiveness of the Company’s internal control over financial reporting as of December 31, 2008, hasbeen audited by Ernst & Young LLP, an independent registered public accounting firm, as stated in their reportwhich appears herein.
40
%%TRANSMSG*** Transmitting Job: H65817 PCN: 041000000 ***%%PCMSG|40 |00007|Yes|No|02/24/2009 16:06|0|0|Page is valid, no graphics -- Color: N|
Report of Independent Registered Public Accounting Firm
The Board of Directors and Shareholders ofWeatherford International Ltd. and subsidiaries
We have audited Weatherford International Ltd.’s internal control over financial reporting as of December 31,2008, based on criteria established in Internal Control — Integrated Framework issued by the Committee ofSponsoring Organizations of the Treadway Commission (the COSO criteria). Weatherford International Ltd.’smanagement is responsible for maintaining effective internal control over financial reporting, and for its assessmentof the effectiveness of internal control over financial reporting included in the accompanying Management’s Reporton Internal Control Over Financial Reporting. Our responsibility is to express an opinion on the company’s internalcontrol over financial reporting based on our audit.
We conducted our audit in accordance with the standards of the Public Company Accounting Oversight Board(United States). Those standards require that we plan and perform the audit to obtain reasonable assurance aboutwhether effective internal control over financial reporting was maintained in all material respects. Our auditincluded obtaining an understanding of internal control over financial reporting, assessing the risk that a materialweakness exists, testing and evaluating the design and operating effectiveness of internal control based on theassessed risk, and performing such other procedures as we considered necessary in the circumstances. We believethat our audit provides a reasonable basis for our opinion.
A company’s internal control over financial reporting is a process designed to provide reasonable assuranceregarding the reliability of financial reporting and the preparation of financial statements for external purposes inaccordance with generally accepted accounting principles. A company’s internal control over financial reportingincludes those policies and procedures that (1) pertain to the maintenance of records that, in reasonable detail,accurately and fairly reflect the transactions and dispositions of the assets of the company; (2) provide reasonableassurance that transactions are recorded as necessary to permit preparation of financial statements in accordancewith generally accepted accounting principles, and that receipts and expenditures of the company are being madeonly in accordance with authorizations of management and directors of the company; and (3) provide reasonableassurance regarding prevention or timely detection of unauthorized acquisition, use, or disposition of the company’sassets that could have a material effect on the financial statements.
Because of its inherent limitations, internal control over financial reporting may not prevent or detectmisstatements. Also, projections of any evaluation of effectiveness to future periods are subject to the risk thatcontrols may become inadequate because of changes in conditions, or that the degree of compliance with thepolicies or procedures may deteriorate.
In our opinion, Weatherford International Ltd. and subsidiaries maintained, in all material respects, effectiveinternal control over financial reporting as of December 31, 2008 based on the COSO criteria.
We also have audited, in accordance with the standards of the Public Company Accounting Oversight Board(United States), the consolidated balance sheets of Weatherford International Ltd. and subsidiaries as of December 31,2008 and 2007, and the related consolidated statements of income, shareholders’ equity, and cash flows for each of thethree years in the period ended December 31, 2008, and our report dated February 24, 2009 expressed an unqualifiedopinion thereon.
Houston, TexasFebruary 24, 2009
41
%%TRANSMSG*** Transmitting Job: H65817 PCN: 042000000 ***%%PCMSG|41 |00013|Yes|No|03/16/2009 14:50|0|0|Page/graphics valid 03/16/2009 14:50 -- Color: N|
Report of Independent Registered Public Accounting Firm
The Board of Directors and Shareholders ofWeatherford International Ltd. and subsidiaries
We have audited the accompanying consolidated balance sheets of Weatherford International Ltd. andsubsidiaries as of December 31, 2008 and 2007, and the related consolidated statements of income, shareholders’equity, and cash flows for each of the three years in the period ended December 31, 2008. Our audits also includedthe financial statement schedule listed in the Index at Item 15. These financial statements and schedule are theresponsibility of the Company’s management. Our responsibility is to express an opinion on these financialstatements and schedule based on our audits.
We conducted our audits in accordance with the standards of the Public Company Accounting Oversight Board(United States). Those standards require that we plan and perform the audit to obtain reasonable assurance aboutwhether the financial statements are free of material misstatement. An audit includes examining, on a test basis,evidence supporting the amounts and disclosures in the financial statements. An audit also includes assessing theaccounting principles used and significant estimates made by management, as well as evaluating the overallfinancial statement presentation. We believe that our audits provide a reasonable basis for our opinion.
In our opinion, the financial statements referred to above present fairly, in all material respects, theconsolidated financial position of Weatherford International Ltd. and subsidiaries at December 31, 2008 and2007, and the consolidated results of their operations and their cash flows for each of the three years in the periodended December 31, 2008, in conformity with U.S. generally accepted accounting principles. Also, in our opinion,the related financial statement schedule, when considered in relation to the basic financial statements taken as awhole, presents fairly in all material respects the information set forth therein.
As discussed in Note 1 to the consolidated financial statements, effective January 1, 2007, the Companyadopted FASB Interpretations — FIN 48: Accounting for Uncertainty in Income Taxes an Interpretation of FASBStatement No. 109 and, as discussed in Note 15, effective December 31, 2006 the Company adopted Statement ofFinancial Accounting Standards No. 158, Employers’ Accounting for Defined Benefit Pension and Other Postre-tirement Plans, an amendment of FASB Statements No. 87, 88, 106, and 132(R).
We also have audited, in accordance with the standards of the Public Company Accounting Oversight Board(United States), Weatherford International Ltd.’s internal control over financial reporting as of December 31, 2008,based on criteria established in Internal Control-Integrated Framework issued by the Committee of SponsoringOrganizations of the Treadway Commission and our report dated February 24, 2009 expressed an unqualifiedopinion thereon.
Houston, TexasFebruary 24, 2009
42
%%TRANSMSG*** Transmitting Job: H65817 PCN: 043000000 ***%%PCMSG|42 |00013|Yes|No|03/16/2009 14:50|0|0|Page/graphics valid 03/16/2009 14:50 -- Color: N|

WEATHERFORD INTERNATIONAL LTD. AND SUBSIDIARIES
CONSOLIDATED BALANCE SHEETS
2008 2007December 31,
(In thousands, except par value)
ASSETSCurrent Assets:
Cash and Cash Equivalents . . . . . . . . . . . . . . . . . . . . . . . . . . . . . . . . . . . . . . $ 238,398 $ 170,714Accounts Receivable, Net of Allowance for Uncollectible Accounts of
$16,425 in 2008 and $13,760 in 2007 . . . . . . . . . . . . . . . . . . . . . . . . . . . . 2,442,848 1,961,854Inventories . . . . . . . . . . . . . . . . . . . . . . . . . . . . . . . . . . . . . . . . . . . . . . . . . . 2,088,342 1,607,684Current Deferred Tax Assets . . . . . . . . . . . . . . . . . . . . . . . . . . . . . . . . . . . . . 270,252 165,508Other Current Assets . . . . . . . . . . . . . . . . . . . . . . . . . . . . . . . . . . . . . . . . . . . 530,442 566,009
5,570,282 4,471,769
Property, Plant and Equipment, at Cost:Land, Buildings and Leasehold Improvements . . . . . . . . . . . . . . . . . . . . . . . . 756,416 557,081Rental and Service Equipment . . . . . . . . . . . . . . . . . . . . . . . . . . . . . . . . . . . . 6,246,278 4,497,113Machinery and Other . . . . . . . . . . . . . . . . . . . . . . . . . . . . . . . . . . . . . . . . . . 1,610,474 1,499,713
8,613,168 6,553,907Less: Accumulated Depreciation . . . . . . . . . . . . . . . . . . . . . . . . . . . . . . . . . . 2,690,996 2,400,062
5,922,172 4,153,845
Goodwill . . . . . . . . . . . . . . . . . . . . . . . . . . . . . . . . . . . . . . . . . . . . . . . . . . . . . 3,530,915 3,358,490Other Intangible Assets, Net . . . . . . . . . . . . . . . . . . . . . . . . . . . . . . . . . . . . . . . 701,483 596,999Equity Investments . . . . . . . . . . . . . . . . . . . . . . . . . . . . . . . . . . . . . . . . . . . . . . 515,770 368,618Other Assets . . . . . . . . . . . . . . . . . . . . . . . . . . . . . . . . . . . . . . . . . . . . . . . . . . . 235,891 241,236
$16,476,513 $13,190,957
LIABILITIES AND SHAREHOLDERS’ EQUITYCurrent Liabilities:
Short-term Borrowings and Current Portion of Long-term Debt . . . . . . . . . . . $ 1,255,947 $ 774,220Accounts Payable . . . . . . . . . . . . . . . . . . . . . . . . . . . . . . . . . . . . . . . . . . . . . 886,104 612,775Accrued Salaries and Benefits . . . . . . . . . . . . . . . . . . . . . . . . . . . . . . . . . . . . 257,016 239,870Income Taxes Payable . . . . . . . . . . . . . . . . . . . . . . . . . . . . . . . . . . . . . . . . . . 82,489 97,482Other Current Liabilities . . . . . . . . . . . . . . . . . . . . . . . . . . . . . . . . . . . . . . . . 540,537 478,018
3,022,093 2,202,365Long-term Debt . . . . . . . . . . . . . . . . . . . . . . . . . . . . . . . . . . . . . . . . . . . . . . . . 4,564,255 3,066,335Deferred Tax Liabilities . . . . . . . . . . . . . . . . . . . . . . . . . . . . . . . . . . . . . . . . . . 228,576 197,494Other Liabilities . . . . . . . . . . . . . . . . . . . . . . . . . . . . . . . . . . . . . . . . . . . . . . . . 295,540 284,717
8,110,464 5,750,911
Minority Interest in Consolidated Subsidiaries . . . . . . . . . . . . . . . . . . . . . . . . . . 80,401 33,327
Shareholders’ Equity:Common Shares, $1 Par Value, Authorized 1,000,000 Shares, Issued 728,689
and 727,204 Shares, Respectively. . . . . . . . . . . . . . . . . . . . . . . . . . . . . . . . 728,689 727,204Capital in Excess of Par Value. . . . . . . . . . . . . . . . . . . . . . . . . . . . . . . . . . . . 4,059,112 3,995,747Treasury Shares, Net . . . . . . . . . . . . . . . . . . . . . . . . . . . . . . . . . . . . . . . . . . . (759,477) (924,202)Retained Earnings . . . . . . . . . . . . . . . . . . . . . . . . . . . . . . . . . . . . . . . . . . . . . 4,524,085 3,170,182Accumulated Other Comprehensive Income (Loss) . . . . . . . . . . . . . . . . . . . . . (266,761) 437,788
8,285,648 7,406,719
$16,476,513 $13,190,957
The accompanying notes are an integral part of these consolidated financial statements.
43
%%TRANSMSG*** Transmitting Job: H65817 PCN: 044000000 ***%%PCMSG|43 |00010|Yes|No|02/24/2009 16:10|0|0|Page is valid, no graphics -- Color: N|

WEATHERFORD INTERNATIONAL LTD. AND SUBSIDIARIES
CONSOLIDATED STATEMENTS OF INCOME
2008 2007 2006Year Ended December 31,
(In thousands, except per share amounts)
Revenues:
Products . . . . . . . . . . . . . . . . . . . . . . . . . . . . . . . . . . . . . . . . . . . $3,564,636 $2,983,427 $2,490,059
Services . . . . . . . . . . . . . . . . . . . . . . . . . . . . . . . . . . . . . . . . . . . 6,035,928 4,848,635 4,088,869
9,600,564 7,832,062 6,578,928
Costs and Expenses:Cost of Products . . . . . . . . . . . . . . . . . . . . . . . . . . . . . . . . . . . . . 2,555,965 2,087,296 1,731,373
Cost of Services . . . . . . . . . . . . . . . . . . . . . . . . . . . . . . . . . . . . . 3,686,495 2,970,314 2,481,460
Research and Development . . . . . . . . . . . . . . . . . . . . . . . . . . . . . 192,659 169,317 149,429
Selling, General and Administrative Attributable to Segments. . . . 1,081,165 850,359 746,386
Corporate General and Administrative . . . . . . . . . . . . . . . . . . . . . 187,075 130,440 115,593
Gain on Sale of Subsidiary . . . . . . . . . . . . . . . . . . . . . . . . . . . . . (81,344) — —
7,622,015 6,207,726 5,224,241
Operating Income . . . . . . . . . . . . . . . . . . . . . . . . . . . . . . . . . . . . . . 1,978,549 1,624,336 1,354,687
Other Income (Expense):
Interest Expense, Net . . . . . . . . . . . . . . . . . . . . . . . . . . . . . . . . . (243,679) (171,281) (102,560)
Other, Net . . . . . . . . . . . . . . . . . . . . . . . . . . . . . . . . . . . . . . . . . (44,956) (8,569) (13,218)
Income from Continuing Operations Before Income Taxes andMinority Interest . . . . . . . . . . . . . . . . . . . . . . . . . . . . . . . . . . . . . 1,689,914 1,444,486 1,238,909
Provision for Income Taxes. . . . . . . . . . . . . . . . . . . . . . . . . . . . . . . (288,811) (332,760) (321,473)
Income from Continuing Operations Before Minority Interest . . . . . 1,401,103 1,111,726 917,436
Minority Interest, Net of Taxes . . . . . . . . . . . . . . . . . . . . . . . . . . . . (34,272) (19,751) (11,330)
Income from Continuing Operations . . . . . . . . . . . . . . . . . . . . . . . . 1,366,831 1,091,975 906,106
Loss from Discontinued Operation, Net of Taxes . . . . . . . . . . . . . . . (12,928) (21,369) (9,737)
Net Income . . . . . . . . . . . . . . . . . . . . . . . . . . . . . . . . . . . . . . . . . . $1,353,903 $1,070,606 $ 896,369
Basic Earnings Per Share:
Income from Continuing Operations . . . . . . . . . . . . . . . . . . . . . . $ 2.00 $ 1.61 $ 1.31
Loss from Discontinued Operation . . . . . . . . . . . . . . . . . . . . . . . (0.02) (0.03) (0.02)
Net Income. . . . . . . . . . . . . . . . . . . . . . . . . . . . . . . . . . . . . . . . . $ 1.98 $ 1.58 $ 1.29
Diluted Earnings Per Share:
Income from Continuing Operations . . . . . . . . . . . . . . . . . . . . . . $ 1.96 $ 1.57 $ 1.28
Loss from Discontinued Operation . . . . . . . . . . . . . . . . . . . . . . . (0.02) (0.03) (0.02)
Net Income. . . . . . . . . . . . . . . . . . . . . . . . . . . . . . . . . . . . . . . . . $ 1.94 $ 1.54 $ 1.26
Weighted Average Shares Outstanding:
Basic . . . . . . . . . . . . . . . . . . . . . . . . . . . . . . . . . . . . . . . . . . . . . 682,704 677,032 692,246
Diluted . . . . . . . . . . . . . . . . . . . . . . . . . . . . . . . . . . . . . . . . . . . . 698,178 695,516 709,664
The accompanying notes are an integral part of these consolidated financial statements.
44
%%TRANSMSG*** Transmitting Job: H65817 PCN: 045000000 ***%%PCMSG|44 |00007|Yes|No|02/24/2009 16:11|0|0|Page is valid, no graphics -- Color: N|

WEATHERFORD INTERNATIONAL LTD. AND SUBSIDIARIES
CONSOLIDATED STATEMENTS OF SHAREHOLDERS’ EQUITY
CommonShares$1 Par
Capital InExcess of Par
ValueRetainedEarnings
AccumulatedOther
ComprehensiveIncome (Loss) Shares
ShareValue
DeferredCompensation
TotalShareholders’
Equity
Treasury Shares
(In thousands, except par value)
Balance at December 31, 2005 . . . . . . . . . . . $717,946 $3,805,392 $1,202,938 $ 92,652 (23,718) $(170,035) $17,924 $5,666,817Comprehensive Income:
Net Income . . . . . . . . . . . . . . . . . . . . . — — 896,369 — — — — 896,369Foreign Currency Translation Adjustment . . . — — — 45,445 — — — 45,445Pension Liability Adjustment, Net of Tax . . . — — — 3,292 — — — 3,292Unrealized Gain on Derivative Instruments,
Net of Tax . . . . . . . . . . . . . . . . . . . . — — — 4,693 — — — 4,693Other, Net of Tax . . . . . . . . . . . . . . . . . — — — 134 — — — 134
Comprehensive Income . . . . . . . . . . . . . . . — — 896,369 53,564 — — — 949,933Adjustment to Initially Apply FASB Statement
No. 158, Net of Tax . . . . . . . . . . . . . . . . — — — (27,063) — — — (27,063)Divestiture of Subsidiary Shares . . . . . . . . . . — 5,336 — — — — — 5,336Purchase of Treasury Shares . . . . . . . . . . . . — — — — (25,050) (548,575) — (548,575)Equity Awards Granted, Vested and Exercised. . 5,896 84,139 — — 4,226 18,176 — 108,211Excess Tax Benefit of Share-Based
Compensation Plans . . . . . . . . . . . . . . . . — 14,121 — — — — — 14,121Other . . . . . . . . . . . . . . . . . . . . . . . . . . — 4,625 — — 278 1,535 (141) 6,019
Balance at December 31, 2006 . . . . . . . . . . . 723,842 3,913,613 2,099,307 119,153 (44,264) (698,899) 17,783 6,174,799Comprehensive Income:
Net Income . . . . . . . . . . . . . . . . . . . . . — — 1,070,606 — — — — 1,070,606Foreign Currency Translation Adjustment . . . — — — 334,217 — — — 334,217Defined Benefit Pension Plans, Net of Tax . . — — — (15,736) — — — (15,736)Other, Net of Tax . . . . . . . . . . . . . . . . . — — — 154 — — — 154
Comprehensive Income . . . . . . . . . . . . . . . — — 1,070,606 318,635 — — — 1,389,241Purchase of Treasury Shares . . . . . . . . . . . . — — — — (10,224) (246,190) — (246,190)Equity Awards Granted, Vested and Exercised. . 3,362 52,031 — — 5,502 2,733 — 58,126Excess Tax Benefit of Share-Based
Compensation Plans . . . . . . . . . . . . . . . . — 28,895 — — — — — 28,895Adoption of FIN No. 48 . . . . . . . . . . . . . . . — — 269 — — — — 269Other . . . . . . . . . . . . . . . . . . . . . . . . . . — 1,208 — — (32) (2,886) 3,257 1,579
Balance at December 31, 2007 . . . . . . . . . . . 727,204 3,995,747 3,170,182 437,788 (49,018) (945,242) 21,040 7,406,719Comprehensive Income:
Net Income . . . . . . . . . . . . . . . . . . . . . — — 1,353,903 — — — — 1,353,903Foreign Currency Translation Adjustment . . . — — — (682,669) — — — (682,669)Deferred Loss on Derivative Instruments . . . — — — (12,576) — — — (12,576)Defined Benefit Pension Plans, Net of Tax . . — — — (9,788) — — — (9,788)Other, Net of Tax . . . . . . . . . . . . . . . . . — — — 484 — — — 484
Comprehensive Income . . . . . . . . . . . . . . . — — 1,353,903 (704,549) — — — 649,354Shares Issued in Acquisition . . . . . . . . . . . . — (38,683) — — 7,709 168,817 — 130,134Equity Awards Granted, Vested and Exercised. . 1,433 102,019 — — 924 (2,331) — 101,121Excess Tax Benefit of Share-Based
Compensation Plans . . . . . . . . . . . . . . . . — 10,032 — — — — — 10,032Other . . . . . . . . . . . . . . . . . . . . . . . . . . 52 (10,003) — — 18 (4,104) 2,343 (11,712)
Balance at December 31, 2008 . . . . . . . . . . . $728,689 $4,059,112 $4,524,085 $(266,761) (40,367) $(782,860) $23,383 $8,285,648
The accompanying notes are an integral part of these consolidated financial statements.
45
%%TRANSMSG*** Transmitting Job: H65817 PCN: 046000000 ***%%PCMSG|45 |00008|Yes|No|02/24/2009 16:12|0|0|Page is valid, no graphics -- Color: N|

WEATHERFORD INTERNATIONAL LTD. AND SUBSIDIARIES
CONSOLIDATED STATEMENTS OF CASH FLOWS
2008 2007 2006Year Ended December 31,
(In thousands)
Cash Flows From Operating Activities:Net Income . . . . . . . . . . . . . . . . . . . . . . . . . . . . . . . . . . . . . . . . . . . . . . . $ 1,353,903 $ 1,070,606 $ 896,369Adjustments to Reconcile Net Income to Net Cash Provided by Operating
Activities:Operating Activities:Depreciation and Amortization . . . . . . . . . . . . . . . . . . . . . . . . . . . . . . . . 731,808 606,226 482,948Gain on Sale of Assets and Businesses, Net . . . . . . . . . . . . . . . . . . . . . . . . (110,326) (41,185) (42,232)Loss from Discontinued Operation . . . . . . . . . . . . . . . . . . . . . . . . . . . . . . 12,928 21,369 9,737Employee Stock-Based Compensation Expense . . . . . . . . . . . . . . . . . . . . . 101,416 64,901 62,739Excess Tax Benefits from Share-Based Compensation . . . . . . . . . . . . . . . . . (10,032) (28,895) (14,121)Minority Interest . . . . . . . . . . . . . . . . . . . . . . . . . . . . . . . . . . . . . . . . . . 34,272 19,751 11,330Deferred Income Tax Provision (Benefit) . . . . . . . . . . . . . . . . . . . . . . . . . (41,442) 28,873 48,413Other, Net . . . . . . . . . . . . . . . . . . . . . . . . . . . . . . . . . . . . . . . . . . . . . . (12,587) 4,608 5,760Change in Operating Assets and Liabilities, Net of Effect of Businesses
Acquired:Accounts Receivable . . . . . . . . . . . . . . . . . . . . . . . . . . . . . . . . . . . . . (461,239) (296,120) (299,335)Inventories . . . . . . . . . . . . . . . . . . . . . . . . . . . . . . . . . . . . . . . . . . . . (581,981) (417,305) (338,323)Other Current Assets . . . . . . . . . . . . . . . . . . . . . . . . . . . . . . . . . . . . . (168,140) (45,794) (66,561)Accounts Payable. . . . . . . . . . . . . . . . . . . . . . . . . . . . . . . . . . . . . . . . 230,596 74,815 27,018Accrued Current Liabilities . . . . . . . . . . . . . . . . . . . . . . . . . . . . . . . . . 62,715 (108,362) 255,009Other, Net. . . . . . . . . . . . . . . . . . . . . . . . . . . . . . . . . . . . . . . . . . . . . (31,104) (70,833) 55,155
Net Cash Provided by Operating Activities-Continuing Operations . . . . . 1,110,787 882,655 1,093,906Net Cash Used by Operating Activities-Discontinued Operation . . . . . . . (6,219) (10,149) (6,887)
Net Cash Provided by Operating Activities . . . . . . . . . . . . . . . . . . . . . 1,104,568 872,506 1,087,019
Cash Flows from Investing Activities:Acquisitions of Businesses, Net of Cash Acquired . . . . . . . . . . . . . . . . . . . . . (798,530) (275,149) (194,314)Capital Expenditures for Property, Plant and Equipment for Continuing
Operations . . . . . . . . . . . . . . . . . . . . . . . . . . . . . . . . . . . . . . . . . . . . . . (2,484,163) (1,635,041) (1,051,100)Acquisition of Intellectual Property . . . . . . . . . . . . . . . . . . . . . . . . . . . . . . . (24,079) (23,035) (31,201)(Purchase) Sale of Equity Investments in Unconsolidated Affiliates . . . . . . . . . (11,568) (335,220) 14,240Proceeds from Sale of Assets and Businesses, Net . . . . . . . . . . . . . . . . . . . . . 297,285 84,476 39,860Other Investing Activities . . . . . . . . . . . . . . . . . . . . . . . . . . . . . . . . . . . . . — (38,500) —
Net Cash Used by Investing Activities-Continuing Operations . . . . . . . . . . (3,021,055) (2,222,469) (1,222,515)Net Cash Used by Investing Activities-Discontinued Operation . . . . . . . . . 11,000 (10,579) (19,984)
Net Cash Used by Investing Activities . . . . . . . . . . . . . . . . . . . . . . . . . . (3,010,055) (2,233,048) (1,242,499)
Cash Flows From Financing Activities:Borrowings of (Repayments on) Short-term Debt, Net . . . . . . . . . . . . . . . . . . 477,821 117,865 (109,490)Borrowings of Long-term Debt . . . . . . . . . . . . . . . . . . . . . . . . . . . . . . . . . . 1,498,874 1,488,934 947,820Repayments on Long-term Debt . . . . . . . . . . . . . . . . . . . . . . . . . . . . . . . . . (20,541) (18,171) (215,805)Purchase of Treasury Shares . . . . . . . . . . . . . . . . . . . . . . . . . . . . . . . . . . . . — (246,190) (548,575)Proceeds from Exercise of Stock Options . . . . . . . . . . . . . . . . . . . . . . . . . . . 9,942 34,192 55,438Excess Tax Benefits from Share-Based Compensation . . . . . . . . . . . . . . . . . . 10,032 28,895 14,121Other Financing Activities, Net . . . . . . . . . . . . . . . . . . . . . . . . . . . . . . . . . . 1,403 (3,896) 1,603
Net Cash Provided by Financing Activities-Continuing Operations . . . . . 1,977,531 1,401,629 145,112Net Cash Provided by Financing Activities-Discontinued Operation . . . . — — —
Net Cash Provided by Financing Activities . . . . . . . . . . . . . . . . . . . . . 1,977,531 1,401,629 145,112
Effect of Exchange Rate Changes on Cash and Cash Equivalents. . . . . . . . . . . . . (4,360) 3,340 2,410Net Increase (Decrease) in Cash and Cash Equivalents . . . . . . . . . . . . . . . . . . . . 67,684 44,427 (7,958)Cash and Cash Equivalents at Beginning of Year . . . . . . . . . . . . . . . . . . . . . . . 170,714 126,287 134,245
Cash and Cash Equivalents at End of Year . . . . . . . . . . . . . . . . . . . . . . . . . . . . $ 238,398 $ 170,714 $ 126,287
The accompanying notes are an integral part of these consolidated financial statements.
46
%%TRANSMSG*** Transmitting Job: H65817 PCN: 047000000 ***%%PCMSG|46 |00008|Yes|No|02/24/2009 16:12|0|0|Page is valid, no graphics -- Color: N|

WEATHERFORD INTERNATIONAL, LTD. AND SUBSIDIARIES
NOTES TO CONSOLIDATED FINANCIAL STATEMENTS
1. Summary of Significant Accounting Policies
Basis of Presentation
Principles of Consolidation
The consolidated financial statements include the accounts of Weatherford International Ltd. (a Bermudaexempted company) (“Weatherford Limited”), all majority-owned subsidiaries and all joint ventures for which wecontrol or variable interest entities for which the Company has determined they are the primary beneficiary(collectively, “the Company”). Investments in affiliates in which the Company exercises significant influence overoperating and financial policies are accounted for on the equity method. All material intercompany accounts andtransactions have been eliminated in consolidation. Beginning in 2008, the Company’s Qatar operations areconducted through a variable interest entity, in which the Company believes it is the primary beneficiary.Accordingly, the Company consolidates this entity and reflects a minority interest.
Nature of Operations
The Company is one of the largest global providers of innovative mechanical solutions, technology andservices for the drilling and production sectors of the oil and natural gas industry.
Reclassifications
Certain reclassifications have been made to our fixed asset and minority interest classifications to conformprior year financial information to the current period presentation.
Discontinued Operation
In June 2007, the Company’s management approved a plan to sell its oil and gas development and productionbusiness. The business was historically included in the Company’s North America and Europe/West Africa/CISsegments. The results of operations, financial position and cash flows of the business have been reflected in theconsolidated financial statements and notes as a discontinued operation for all periods presented. The assets andliabilities held for sale were included in Other Current Assets and Other Current Liabilities, respectively, in theConsolidated Balance Sheets at December 31, 2007. The Company finalized the divestiture of the business in 2008.
Use of Estimates
The preparation of financial statements in conformity with U.S. generally accepted accounting principlesrequires management to make estimates and assumptions that affect the reported amounts of assets and liabilities atthe date of the financial statements and the reported amounts of revenues and expenses during the reporting periodand disclosure of contingent liabilities. On an ongoing basis, the Company evaluates its estimates, including thoserelated to uncollectible accounts receivable, lower of cost or market value of inventories, equity investments,intangible assets and goodwill, property, plant and equipment, income taxes, percentage-of-completion accountingfor long-term contracts, self-insurance, pension and postretirement benefit plans and contingent liabilities. TheCompany bases its estimates on historical experience and on various other assumptions that are believed to bereasonable under the circumstances, the results of which form the basis for making judgments about the carryingvalues of assets and liabilities not readily apparent from other sources. Actual results could differ from thoseestimates.
Cash and Cash Equivalents
The Company considers all highly liquid investments with original maturities of three months or less to be cashequivalents.
47
%%TRANSMSG*** Transmitting Job: H65817 PCN: 048000000 ***%%PCMSG|47 |00012|Yes|No|02/24/2009 16:13|0|0|Page is valid, no graphics -- Color: N|

Accounts Receivable and Allowance for Uncollectible Accounts
Accounts receivable are stated at the historical carrying amount net of allowances for uncollectible accounts.The Company establishes an allowance for uncollectible accounts based on specific customer collection issues theCompany has identified. Uncollectible accounts receivable are written off when a settlement is reached for anamount less than the outstanding historical balance or when the Company has determined the balance will not becollected.
Major Customers and Credit Risk
Substantially all of the Company’s customers are engaged in the energy industry. This concentration ofcustomers may impact the Company’s overall exposure to credit risk, either positively or negatively, in thatcustomers may be similarly affected by changes in economic and industry conditions. The Company performsongoing credit evaluations of its customers and does not generally require collateral in support of its tradereceivables. The Company maintains reserves for potential credit losses, and actual losses have historically beenwithin the Company’s expectations. International sales also present various risks, including risks of war, civildisturbances and governmental activities that may limit or disrupt markets, restrict the movement of funds, result inthe deprivation of contract rights or the taking of property without fair consideration. Most of the Company’sinternational sales, however, are to large international or national companies. In 2008, 2007 and 2006, there was noindividual customer who accounted for more than 10% of consolidated revenues.
Inventories
The Company values inventories at lower of cost or market using either the first-in, first-out (“FIFO”) oraverage cost methods. Cost represents third-party invoice or production cost. Production cost includes material,labor and manufacturing overhead.
Property, Plant and Equipment
Property, plant and equipment, both owned and under capital lease, is carried at cost less accumulateddepreciation. The carrying value of fixed assets is based on estimates and judgments relative to capitalized costs,useful lives and salvage value where applicable. Maintenance and repairs are expensed as incurred. Expenditures forrenewals, replacements and betterments are capitalized. Depreciation on fixed assets, including those under capitalleases, is computed using the straight-line method over the estimated useful lives after allowing for salvage value,where applicable. Depreciation expense for the years ended December 31, 2008, 2007 and 2006 was $669 million,$553 million and $433 million, respectively. The estimated useful lives of the major classes of property, plant andequipment are as follows:
EstimatedUseful Lives
Buildings and leasehold improvements . . . . . . . . . . . . . . . . . . . . . . . . . . . 5-40 years or lease term
Rental and service equipment . . . . . . . . . . . . . . . . . . . . . . . . . . . . . . . . . . 2-20 years
Machinery and other . . . . . . . . . . . . . . . . . . . . . . . . . . . . . . . . . . . . . . . . 2-12 years
Rig assets are classified in Rental and Service Equipment on the Consolidated Balance Sheets. From time totime, the Company may review the estimated remaining useful lives of its drilling rigs and may extend the useful lifewhen events and circumstances, such as upgrades or refurbishment activities, indicate the drilling rig can operatebeyond its original useful life. All estimated useful lives are evaluated and established based upon appraisalconcurrent with acquisition. No changes in the estimated useful lives have occurred since acquisition date.
48
WEATHERFORD INTERNATIONAL, LTD. AND SUBSIDIARIES
NOTES TO CONSOLIDATED FINANCIAL STATEMENTS — (Continued)
%%TRANSMSG*** Transmitting Job: H65817 PCN: 049000000 ***%%PCMSG|48 |00006|Yes|No|02/21/2009 19:57|0|0|Page is valid, no graphics -- Color: N|
Long-Lived Assets
Long-lived assets, excluding goodwill and indefinite-lived intangibles, to be held and used by the Company arereviewed to determine whether any events or changes in circumstances indicate the carrying amount of the assetmay not be recoverable. Factors that might indicate a potential impairment may include, but are not limited to,significant decreases in the market value of the long-lived asset, a significant change in the long-lived asset’sphysical condition, a change in industry conditions or a reduction in cash flows associated with the use of the long-lived asset. If these or other factors indicate the carrying amount of the asset may not be recoverable, the Companydetermines whether an impairment has occurred through the use of an undiscounted cash flow analysis of the assetat the lowest level for which identifiable cash flows exist. If an impairment has occurred, the Company recognizes aloss for the difference between the carrying amount and the fair value of the asset. The fair value of the asset ismeasured using market prices or, in the absence of market prices, is based on an estimate of discounted cash flows.Cash flows are generally discounted at an interest rate commensurate with our weighted average cost of capital for asimilar asset. Assets are classified as held for sale when the Company has a plan for disposal of certain assets andthose assets meet the held for sale criteria of Statement of Financial Accounting Standards (“SFAS”) No. 144,Accounting for the Impairment or Disposal of Long-Lived Assets (“SFAS No. 144”).
Goodwill and Indefinite-Lived Intangible Assets
The Company tests for the impairment of goodwill and other intangible assets with indefinite lives on at leastan annual basis. The Company’s goodwill impairment test involves a comparison of the fair value of each of theCompany’s reporting units with its carrying amount. The Company’s indefinite-lived asset impairment test involvesa comparison of the fair value of the intangible asset and its carrying value. Fair value is estimated using discountedcash flows using a discount rate adjusted for the credit risk of the regional reporting unit tested. If the fair value isless than the carrying value, the asset is considered impaired. The amount of the impairment, if any, is thendetermined based on an allocation of the reporting unit fair values to individual assets and liabilities.
Intangible Assets
The Company’s intangible assets, excluding goodwill, are acquired technology licenses, patents, customerrelationships and other identifiable intangible assets. Intangible assets are amortized on a straight-line basis overtheir estimated economic lives generally ranging from 2 to 20 years except for intangible assets with indefinite lives.As many areas of the Company’s business rely on patents and proprietary technology, it has followed a policy ofseeking patent protection both inside and outside the U.S. for products and methods that appear to have commercialsignificance. The Company capitalizes patent defense costs when it determines that a successful defense isprobable.
Pension and Postretirement Benefit Plans
The Company has defined benefit pension and other postretirement benefit plans covering certain of itsemployees. Costs of the plan are charged to income and consist of several components, known collectively as netperiodic pension cost, which are based on various actuarial assumptions regarding future experience of the plans.Amounts recorded for these defined benefit plans reflect estimates related to future interest rates, investment ratesof return, employee turnover and wage increases. The Company reviews all assumptions and estimates on anongoing basis. As of December 31, 2008 and 2007, the Company has recognized the overfunded or underfundedstatus of its plans as an asset or liability in the Consolidated Balance Sheets.
Research and Development Expenditures
Research and development expenditures are expensed as incurred.
49
WEATHERFORD INTERNATIONAL, LTD. AND SUBSIDIARIES
NOTES TO CONSOLIDATED FINANCIAL STATEMENTS — (Continued)
%%TRANSMSG*** Transmitting Job: H65817 PCN: 050000000 ***%%PCMSG|49 |00009|Yes|No|02/24/2009 06:53|0|0|Page is valid, no graphics -- Color: N|

Environmental Expenditures
Environmental expenditures that relate to the remediation of an existing condition caused by past operationand that do not contribute to future revenues are expensed. Liabilities for these expenditures are recorded when it isprobable that obligations have been incurred and costs can be reasonably estimated. Estimates are based onavailable facts and technology, enacted laws and regulations and the Company’s prior experience in remediation ofcontaminated sites.
Insurance
The Company is self-insured up to certain retention limits for general liability, vehicle liability, group medicaland for workers’ compensation claims for certain of its employees. The amounts in excess of the self-insured levelsare fully insured, up to a limit. Self-insurance accruals are based on claims filed and an estimate for significantclaims incurred but not reported.
Derivative Financial Instruments
The Company accounts for all derivative instruments under SFAS No. 133, Accounting for DerivativeInstruments and Hedging Activities, as amended (“SFAS No. 133”). This standard requires that every derivativeinstrument be recorded at fair value in the balance sheet as either an asset or a liability. Changes in the fair value ofderivatives are recorded each period in current earnings or other comprehensive income, depending on whether thederivative is designated as part of a hedge relationship, and if so, the type of hedge transaction. Any gain or lossassociated with the termination of a swap is deferred and amortized over the remaining debt term.
Foreign Currency
Results of operations for foreign subsidiaries with functional currencies other than the U.S. dollar aretranslated using average exchange rates during the period. Assets and liabilities of these foreign subsidiaries aretranslated using the exchange rates in effect at the balance sheet dates, and the resulting translation adjustments areincluded as Accumulated Other Comprehensive Income, a component of shareholders’ equity.
For non-U.S. subsidiaries where the functional currency is the U.S. dollar, inventories, property, plant andequipment and other non-monetary assets, together with their related elements of expense, are translated athistorical rates of exchange. All other assets and liabilities are translated at current exchange rates. All otherrevenues and expenses are translated at average exchange rates. Translation gains and losses for these subsidiariesare recognized in the Company’s results of operations during the period incurred. The gain or loss related toindividual foreign currency transactions are reflected in results of operations when incurred.
Employee Share-Based Compensation
The Company accounts for all share-based payment awards, including shares issued under employee stockpurchase plans, stock options, restricted stock and stock appreciation rights under SFAS No. 123 (Revised2004) Share-Based Payment (“SFAS No. 123R”). Under SFAS No. 123R, the fair value of employee stock-basedawards granted is measured at the grant date and is recognized as an expense over the service period, which isusually the vesting period.
SFAS No. 123R requires the cash outflows resulting from the tax benefits from the tax deductions in excess ofcompensation cost recognized for share based payment awards to be classified as financing cash flows. Had theCompany not adopted SFAS No. 123R, the excess tax benefits would have been classified as an operating cashinflow.
50
WEATHERFORD INTERNATIONAL, LTD. AND SUBSIDIARIES
NOTES TO CONSOLIDATED FINANCIAL STATEMENTS — (Continued)
%%TRANSMSG*** Transmitting Job: H65817 PCN: 051000000 ***%%PCMSG|50 |00005|Yes|No|02/21/2009 19:57|0|0|Page is valid, no graphics -- Color: N|
Accounting for Income Taxes
Income taxes have been provided based upon the tax laws and rates in the countries in which operations areconducted and income is earned. Deferred tax assets and liabilities are recognized for the future tax consequencesattributable to differences between the financial statement carrying amounts of existing assets and liabilities andtheir respective tax bases. A valuation allowance for deferred tax assets is recorded when it is more likely than notthat some or all of the benefit from the deferred tax asset will not be realized.
The Company adopted the provisions of Financial Accounting Standards Board (“FASB”) InterpretationNo. 48, Accounting for Uncertainty in Income Taxes — an interpretation of FASB Statement No. 109 (“FIN No. 48”)in 2007. FIN No. 48 clarifies the accounting for uncertainty in income taxes recognized in an enterprise’s financialstatements and prescribes a recognition threshold and measurement attributes of income tax positions taken orexpected to be taken on a tax return. Under FIN No. 48, the impact of an uncertain tax position taken or expected tobe taken on an income tax return must be recognized in the financial statements at the largest amount that is more-likely-than-not to be sustained upon examination by the relevant taxing authority.
Revenue Recognition
Revenue is recognized when all of the following criteria have been met: a) evidence of an arrangement exists,b) delivery to and acceptance by the customer has occurred, c) the price to the customer is fixed and determinableand d) collectibility is reasonably assured.
Both contract drilling and pipeline service revenue is contractual by nature and both are day-rate basedcontracts. The Company recognizes revenue for these contracts based on the criteria outlined above which isconsistent with our other product offerings.
From time to time, the Company may receive revenues for preparation and mobilization of equipment andpersonnel. In connection with new drilling contracts, revenues earned and incremental costs incurred directlyrelated to preparation and mobilization are deferred and recognized over the primary contract term of the projectusing the straight-line method. Costs of relocating equipment without contracts to more promising market areas areexpensed as incurred. Demobilization fees received are recognized, along with any related expenses, uponcompletion of contracts.
The Company incurs rebillable expenses including shipping and handling, third-party inspection and repairs,and custom and duties. The Company recognizes the revenue associated with these rebillable expenses as ProductsRevenues and all related costs as Cost of Products in the accompanying Consolidated Statements of Income.
Percentage of Completion — Revenue from long-term contracts, primarily for the Company’s integratedproject management services, is reported on the percentage-of-completion method of accounting. This method ofaccounting requires the Company to calculate contract profit to be recognized in each reporting period for eachcontract based upon its projections of future outcomes, which include:
• estimates of the total cost to complete the project;
• estimates of project schedule and completion date;
• estimates of the extent of progress toward completion; and
• amounts of any change orders or claims included in revenue.
Measurements of progress are generally output based related to physical progress. At the outset of eachcontract, the Company prepares a detailed analysis of its estimated cost to complete the project. Risks related toservice delivery, usage, productivity, and other factors are considered in the estimation process. The Company’spersonnel periodically evaluate the estimated costs, claims, change orders, and percentage of completion at thecontract level. The recording of profits and losses on long-term contracts requires an estimate of the
51
WEATHERFORD INTERNATIONAL, LTD. AND SUBSIDIARIES
NOTES TO CONSOLIDATED FINANCIAL STATEMENTS — (Continued)
%%TRANSMSG*** Transmitting Job: H65817 PCN: 052000000 ***%%PCMSG|51 |00007|Yes|No|02/24/2009 06:12|0|0|Page is valid, no graphics -- Color: N|

total profit or loss over the life of each contract. This estimate requires consideration of total contract value, changeorders, and claims, less costs incurred and estimated costs to complete. Anticipated losses on contracts are recordedin full in the period in which they become evident. Profits are recorded based upon the total estimated contract profittimes the current percentage complete for the contract.
Earnings per Share
The basic earning per share for all periods presented equals net income divided by the weighted averagenumber of the Company’s common shares, $1.00 par value (“Common Share”) outstanding during the period.Diluted earning per share is computed by dividing net income, as adjusted for the assumed conversion of dilutivedebentures, by the weighted average number of Common Shares outstanding during the period as adjusted for thedilutive effect of the Company’s stock option and restricted share plans and warrant. The diluted earnings per sharecalculation excludes 6 million potential shares for the year ended December 31, 2008, due to their antidilutiveeffect. Antidilutive potential shares were not significant for the years ended December 31, 2007 and 2006.
The Company’s Board of Directors approved a two-for-one share split of its Common Shares effected througha share dividend. Shareholders of record on May 9, 2008 were entitled to the dividend, which was distributed onMay 23, 2008. All share and option amounts included in the accompanying consolidated financial statements andrelated notes reflect the effect of the share split.
The following reconciles basic and diluted weighted average number of shares outstanding:
2008 2007 2006Year Ended December 31,
(In thousands)
Basic weighted average shares outstanding . . . . . . . . . . . . . . . . . . . 682,704 677,032 692,246
Dilutive effect of:Warrant . . . . . . . . . . . . . . . . . . . . . . . . . . . . . . . . . . . . . . . . . . . 5,720 5,570 4,410
Stock option and restricted share plans . . . . . . . . . . . . . . . . . . . . 9,754 12,914 13,008
Diluted weighted average shares outstanding . . . . . . . . . . . . . . . . . 698,178 695,516 709,664
New Accounting Pronouncements
In December 2007, the FASB issued SFAS No. 141 (revised 2007), Business Combinations(“SFAS No. 141R”). SFAS No. 141R establishes principles and requirements for how a company recognizesassets acquired, liabilities assumed, contractual contingencies and contingent consideration measured at fair valueat the acquisition date. The Statement also establishes disclosure requirements which will enable users to evaluatethe nature and financial effect of the business combination. SFAS No. 141R is effective for business combinationscompleted in fiscal years beginning after December 15, 2008.
In December 2007, the FASB issued SFAS No. 160, Noncontrolling Interests in Consolidated FinancialStatements — an amendment of ARB No. 51 (“SFAS No. 160”). SFAS No. 160 establishes accounting and reportingstandards for ownership interests in subsidiaries held by parties other than the parent, the amount of consolidated netincome attributable to the parent and to the noncontrolling interest, changes in a parent’s ownership interest and thevaluation of retained noncontrolling equity investments when a subsidiary is deconsolidated. The Statement alsoestablishes reporting requirements that provide sufficient disclosures that clearly identify and distinguish betweenthe interest of the parent and the interest of the noncontrolling owners. SFAS No. 160 is effective for fiscal yearsbeginning after December 15, 2008
In March 2008, the FASB issued Statement No. 161, Disclosures about Derivative Instruments and HedgingActivities (“SFAS No. 161”). SFAS No. 161 requires enhanced disclosures about an entity’s derivative and hedgingactivity. Entities are required to provide enhanced disclosures about how and why they use derivative instruments,
52
WEATHERFORD INTERNATIONAL, LTD. AND SUBSIDIARIES
NOTES TO CONSOLIDATED FINANCIAL STATEMENTS — (Continued)
%%TRANSMSG*** Transmitting Job: H65817 PCN: 053000000 ***%%PCMSG|52 |00005|Yes|No|02/21/2009 19:57|0|0|Page is valid, no graphics -- Color: N|
how derivative instruments and related hedged items are accounted for under SFAS No. 133 and how derivativeinstruments and related hedged items affect an entity’s financial position, financial performance and cash flows.This statement is effective for financial statements issued for fiscal years and interim periods beginning afterNovember 15, 2008.
2. Business Combinations
The Company has acquired businesses critical to its long-term growth strategy. Results of operations foracquisitions are included in the accompanying Consolidated Statements of Income from the date of acquisition. Thebalances included in the Consolidated Balance Sheets related to acquisitions consummated in the preceding twelvemonths are based on preliminary information and are subject to change when final asset valuations are obtained andthe potential for liabilities has been evaluated. Acquisitions are accounted for using the purchase method ofaccounting and the purchase price is allocated to the net assets acquired based upon their estimated fair values at thedate of acquisition. The excess of the purchase price over the net assets was recorded as goodwill. Final valuationsof assets and liabilities are obtained and recorded within one year from the date of the acquisition.
In November 2008, the Company acquired a group of affiliated companies in Latin America, which provideproject management services, drilling fluids, contract drilling and environmental services in Latin America.Consideration for the transaction totaled approximately $160 million, which was comprised of approximately sixmillion shares valued at approximately $65 million, non-cash consideration of approximately $75 million and cashof approximately $20 million. An additional $65 million in cash consideration for this acquisition is contingent onthe occurrence of future events and circumstances and will be recorded by the Company when and if these eventsoccur. The total purchase price was allocated based upon preliminary, estimated fair values which are subject tochange once final valuations of the assets and liabilities are completed.
In August 2008, the Company acquired International Logging, Inc. (“ILI”), a provider of surface logging andformation and evaluation and drilling related services for approximately $400 million. The total purchase price wasallocated to ILI’s net tangible and identifiable intangible assets based on their preliminary, estimated fair values.The Company allocated approximately $140 million of the purchase price to intangible assets (See Note 8). Theexcess of the purchase price over the net assets was recorded as goodwill.
In association with a prior acquisition, the Company identified pre-acquisition contingencies related to dutiesand taxes associated with the importation of certain equipment assets to foreign jurisdictions. At December 31,2008, the Company has a liability of approximately $9 million for this matter. If the Company used the high end ofthe range, the aggregate potential liability would be approximately $10 million higher.
The Company also acquired various other businesses during the years ended December 31, 2008, 2007 and2006 for cash consideration of approximately $380 million, $253 million and $187 million, respectively. Inaddition, other 2008 acquisitions included the issuance of approximately two million shares valued at approx-imately $65 million.
3. Equity Investment Acquisition
The Company acquired a 33% ownership interest in Premier Business Solutions (“PBS”) in June 2007 forapproximately $330 million. PBS conducts business in Russia and is the world’s largest electric submersible pumpmanufacturer by volume. In January 2008, the Company sold its electrical submersible pumps (“ESP”) product lineto PBS and received a combination of cash and an additional equity investment in PBS in consideration of the sale.This transaction increased the Company’s ownership percentage to approximately 40%. The Company’s investmentin PBS is included in Equity Investments in the accompanying Condensed Consolidated Balance Sheets atDecember 31, 2008 and 2007. The assets and liabilities of the ESP product line were classified as held for sale atDecember 31, 2007 and included in Other Current Assets and Other Current Liabilities in the CondensedConsolidated Balance Sheet.
53
WEATHERFORD INTERNATIONAL, LTD. AND SUBSIDIARIES
NOTES TO CONSOLIDATED FINANCIAL STATEMENTS — (Continued)
%%TRANSMSG*** Transmitting Job: H65817 PCN: 054000000 ***%%PCMSG|53 |00007|Yes|No|02/24/2009 12:25|0|0|Page is valid, no graphics -- Color: N|

4. Discontinued Operation
In June 2007, the Company’s management approved a plan to sell its oil and gas development and productionbusiness. The Company finalized the divestiture of the business in June 2008. The results of operations, financialposition and cash flows of the business have been reflected in the condensed consolidated financial statements andnotes as a discontinued operation for all periods presented.
Operating results of the oil and gas development and production business were as follows:
2008 2007 2006Year Ended December 31,
(In thousands)
Revenues. . . . . . . . . . . . . . . . . . . . . . . . . . . . . . . . . . . . . . . . . . . . $ 556 $ 2,299 $ —
Loss Before Income Taxes . . . . . . . . . . . . . . . . . . . . . . . . . . . . . . . $25,811 $30,303 $14,686
Benefit for Income Taxes . . . . . . . . . . . . . . . . . . . . . . . . . . . . . . . . 12,883 8,934 4,949
Loss from Discontinued Operation, Net of Taxes . . . . . . . . . . . . . . $12,928 $21,369 $ 9,737
The 2008 loss includes charges of approximately $21 million associated with a settlement of a legal disputeregarding the business. These charges were partially offset by an $11 million gain, net of taxes, recognized upon thefinalization of the divestiture. The 2007 loss includes approximately $17 million, net of tax, for asset impairmentcharges related to write-downs of the operation’s U.S. properties. In addition, the Company completed the sale ofthe operation’s international properties in November 2007 and recorded a gain of approximately $5 million, net oftax, in connection with the sale.
5. Cash Flow Information
Gain on Sales of Assets and Businesses, Net
Gain on sales of assets and businesses, net for the year ended December 31, 2008 of $110 million includes a$19 million write-off of fixed assets resulting from the Company’s exit from sanctioned countries, an $81 milliongain recognized in connection with the sale of a 50% interest in a subsidiary the Company controls to QatarPetroleum and $48 million in gains related to the Company’s divestiture of other assets and businesses.
Non-cash Activities
The Company issued approximately eight million shares valued at approximately $130 million in connectionwith acquisitions during the year ended December 31, 2008. There were no shares issued in connection withacquisitions during 2007 or 2006.
During the year ended December 31, 2008, there were non-cash investing activities of approximately$75 million related to the Company’s consideration for an acquisition. During the years ended December 31,2007 and 2006, there were non-cash investing activities of $20 million and $64 million, respectively, related to thenotes receivable received in exchange for the Company’s business and asset sales.
Supplemental Cash Flow Information
Cash paid for interest and income taxes, net of refunds, was as follows:
2008 2007 2006Year Ended December 31,
(In thousands)
Interest paid, net of capitalized interest . . . . . . . . . . . . . . . . . . . $233,468 $184,093 $ 93,288
Income taxes paid, net of refunds . . . . . . . . . . . . . . . . . . . . . . . 271,418 372,025 147,973
54
WEATHERFORD INTERNATIONAL, LTD. AND SUBSIDIARIES
NOTES TO CONSOLIDATED FINANCIAL STATEMENTS — (Continued)
%%TRANSMSG*** Transmitting Job: H65817 PCN: 055000000 ***%%PCMSG|54 |00007|Yes|No|02/24/2009 03:59|0|0|Page is valid, no graphics -- Color: N|

6. Inventories
Inventories by category were as follows:
2008 2007December 31,
(In thousands)
Raw materials, components and supplies . . . . . . . . . . . . . . . . . . . . . . . . $ 430,352 $ 373,383
Work in process . . . . . . . . . . . . . . . . . . . . . . . . . . . . . . . . . . . . . . . . . . . 152,864 118,407
Finished goods . . . . . . . . . . . . . . . . . . . . . . . . . . . . . . . . . . . . . . . . . . . 1,505,126 1,115,894
$2,088,342 $1,607,684
Work in process and finished goods inventories include the cost of materials, labor and plant overhead.
7. Goodwill
Goodwill is evaluated for impairment on at least an annual basis. The Company performs its annual goodwillimpairment test as of October 1. In addition, the Company updated its goodwill impairment test in December 2008as a result of the decline in its Common Share price during the fourth quarter of 2008. The Company’s 2008impairment tests indicated goodwill was not impaired. The Company will continue to test its goodwill annually asof October 1 unless events occur or circumstances change between annual tests that would more likely than notreduce the fair value of a reporting unit below its carrying amount.
The Company’s operating segments consist of the following reporting units:
• North America — (i) United States and (ii) Canada
• Latin America
• Europe/West Africa/CIS — (i) Europe, (ii) West Africa and (iii) Russia/CIS
• Middle East/North Africa/Asia — (i) Middle East/North Africa and (ii) Asia Pacific
The changes in the carrying amount of goodwill for the two years ended December 31, 2008 were as follows:
NorthAmerica
Middle East/North Africa/
Asia
Europe/West Africa/
CISLatin
America Total(In thousands)
As of December 31, 2006 . . . . . . . . . . . $1,759,086 $595,310 $ 499,686 $146,507 $3,000,589
Acquisitions . . . . . . . . . . . . . . . . . . . 33,497 3,131 161,840 1,087 199,555
Disposals . . . . . . . . . . . . . . . . . . . . . . (19,626) — (5,523) — (25,149)
Purchase price and otheradjustments . . . . . . . . . . . . . . . . . . (153) 374 1,060 4,494 5,775
Foreign currency translation . . . . . . . . 145,607 6,006 21,370 4,737 177,720
As of December 31, 2007 . . . . . . . . . . . 1,918,411 604,821 678,433 156,825 3,358,490
Acquisitions . . . . . . . . . . . . . . . . . . . 86,037 99,456 169,941 155,098 510,532
Disposals . . . . . . . . . . . . . . . . . . . . . . (4,380) — (1,435) (27) (5,842)
Purchase price and otheradjustments . . . . . . . . . . . . . . . . . . 5,299 (15,847) 5,950 7,766 3,168
Foreign currency translation . . . . . . . . (191,657) (12,872) (117,959) (12,945) (335,433)
As of December 31, 2008 . . . . . . . . . . . $1,813,710 $675,558 $ 734,930 $306,717 $3,530,915
55
WEATHERFORD INTERNATIONAL, LTD. AND SUBSIDIARIES
NOTES TO CONSOLIDATED FINANCIAL STATEMENTS — (Continued)
%%TRANSMSG*** Transmitting Job: H65817 PCN: 056000000 ***%%PCMSG|55 |00010|Yes|No|02/24/2009 12:25|0|0|Page is valid, no graphics -- Color: N|
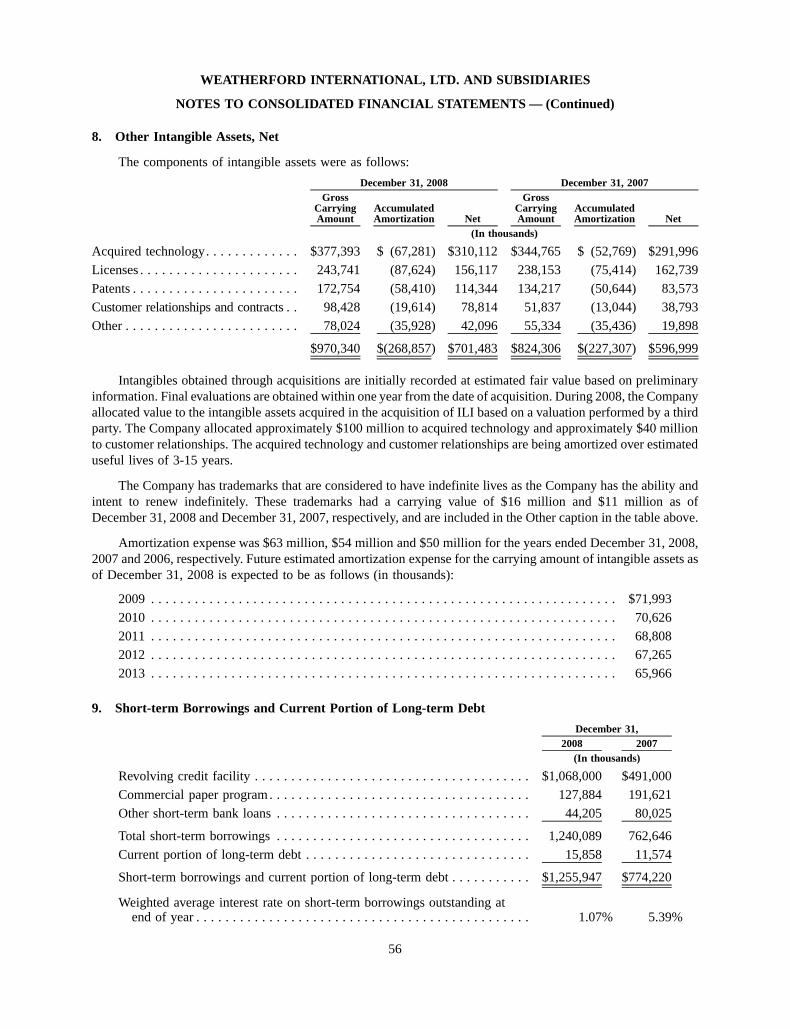
8. Other Intangible Assets, Net
The components of intangible assets were as follows:
GrossCarryingAmount
AccumulatedAmortization Net
GrossCarryingAmount
AccumulatedAmortization Net
December 31, 2008 December 31, 2007
(In thousands)
Acquired technology. . . . . . . . . . . . . $377,393 $ (67,281) $310,112 $344,765 $ (52,769) $291,996
Licenses . . . . . . . . . . . . . . . . . . . . . . 243,741 (87,624) 156,117 238,153 (75,414) 162,739
Patents . . . . . . . . . . . . . . . . . . . . . . . 172,754 (58,410) 114,344 134,217 (50,644) 83,573
Customer relationships and contracts . . 98,428 (19,614) 78,814 51,837 (13,044) 38,793
Other . . . . . . . . . . . . . . . . . . . . . . . . 78,024 (35,928) 42,096 55,334 (35,436) 19,898
$970,340 $(268,857) $701,483 $824,306 $(227,307) $596,999
Intangibles obtained through acquisitions are initially recorded at estimated fair value based on preliminaryinformation. Final evaluations are obtained within one year from the date of acquisition. During 2008, the Companyallocated value to the intangible assets acquired in the acquisition of ILI based on a valuation performed by a thirdparty. The Company allocated approximately $100 million to acquired technology and approximately $40 millionto customer relationships. The acquired technology and customer relationships are being amortized over estimateduseful lives of 3-15 years.
The Company has trademarks that are considered to have indefinite lives as the Company has the ability andintent to renew indefinitely. These trademarks had a carrying value of $16 million and $11 million as ofDecember 31, 2008 and December 31, 2007, respectively, and are included in the Other caption in the table above.
Amortization expense was $63 million, $54 million and $50 million for the years ended December 31, 2008,2007 and 2006, respectively. Future estimated amortization expense for the carrying amount of intangible assets asof December 31, 2008 is expected to be as follows (in thousands):
2009 . . . . . . . . . . . . . . . . . . . . . . . . . . . . . . . . . . . . . . . . . . . . . . . . . . . . . . . . . . . . . . . . $71,993
2010 . . . . . . . . . . . . . . . . . . . . . . . . . . . . . . . . . . . . . . . . . . . . . . . . . . . . . . . . . . . . . . . . 70,626
2011 . . . . . . . . . . . . . . . . . . . . . . . . . . . . . . . . . . . . . . . . . . . . . . . . . . . . . . . . . . . . . . . . 68,808
2012 . . . . . . . . . . . . . . . . . . . . . . . . . . . . . . . . . . . . . . . . . . . . . . . . . . . . . . . . . . . . . . . . 67,2652013 . . . . . . . . . . . . . . . . . . . . . . . . . . . . . . . . . . . . . . . . . . . . . . . . . . . . . . . . . . . . . . . . 65,966
9. Short-term Borrowings and Current Portion of Long-term Debt
2008 2007December 31,
(In thousands)
Revolving credit facility . . . . . . . . . . . . . . . . . . . . . . . . . . . . . . . . . . . . . . $1,068,000 $491,000
Commercial paper program. . . . . . . . . . . . . . . . . . . . . . . . . . . . . . . . . . . . 127,884 191,621
Other short-term bank loans . . . . . . . . . . . . . . . . . . . . . . . . . . . . . . . . . . . 44,205 80,025
Total short-term borrowings . . . . . . . . . . . . . . . . . . . . . . . . . . . . . . . . . . . 1,240,089 762,646
Current portion of long-term debt . . . . . . . . . . . . . . . . . . . . . . . . . . . . . . . 15,858 11,574
Short-term borrowings and current portion of long-term debt . . . . . . . . . . . $1,255,947 $774,220
Weighted average interest rate on short-term borrowings outstanding atend of year . . . . . . . . . . . . . . . . . . . . . . . . . . . . . . . . . . . . . . . . . . . . . . 1.07% 5.39%
56
WEATHERFORD INTERNATIONAL, LTD. AND SUBSIDIARIES
NOTES TO CONSOLIDATED FINANCIAL STATEMENTS — (Continued)
%%TRANSMSG*** Transmitting Job: H65817 PCN: 057000000 ***%%PCMSG|56 |00006|Yes|No|02/24/2009 03:42|0|0|Page is valid, no graphics -- Color: N|

The Company maintains a $1.5 billion revolving credit agreement with a syndicate of banks. In March 2008,the Company entered into an additional $250 million revolving credit facility. These lending facilities allow for acombination of borrowings, support of the Company’s commercial paper program and issuances of letters of creditand both mature in May 2011. In October 2008, the Company entered into an additional $550 million in revolvingcredit facilities. These facilities allow for a combination of borrowings and issuances of letters of credit and maturein October 2009. The weighted average interest rate on outstanding borrowings of these facilities at December 31,2008 was 0.9%. There were $53 million in outstanding letters of credit under these facilities at December 31, 2008.
These borrowing facilities require the Company to maintain a debt-to-capitalization ratio of less than 60% andcontain other covenants and representations customary for an investment-grade commercial credit. The Companywas in compliance with these covenants at December 31, 2008.
The Company has a $1.5 billion commercial paper program under which it may from time to time issue short-term unsecured notes. The commercial paper program is supported by the Company’s revolving credit facilities.The weighted average interest rate related to outstanding commercial paper issuances at December 31, 2008 was1.3%.
The Company has short-term borrowings with various domestic and international institutions pursuant touncommitted facilities. At December 31, 2008, the Company had $44 million in short-term borrowings under thesearrangements with a weighted average interest rate of 4.2%. In addition, the Company had $220 million of letters ofcredit and bid and performance bonds under these uncommitted facilities.
The Company’s short-term borrowings approximate their fair value as of December 31, 2008 and 2007.
10. Long-term Debt
2008 2007December 31,
(In thousands)
6.625% Senior Notes due 2011 . . . . . . . . . . . . . . . . . . . . . . . . . . . . . . . $ 354,286 $ 355,6195.95% Senior Notes due 2012 . . . . . . . . . . . . . . . . . . . . . . . . . . . . . . . . 599,153 598,940
5.15% Senior Notes due 2013 . . . . . . . . . . . . . . . . . . . . . . . . . . . . . . . . 510,833 —
4.95% Senior Notes due 2013 . . . . . . . . . . . . . . . . . . . . . . . . . . . . . . . . 253,959 254,681
5.50% Senior Notes due 2016 . . . . . . . . . . . . . . . . . . . . . . . . . . . . . . . . 348,859 348,732
6.35% Senior Notes due 2017 . . . . . . . . . . . . . . . . . . . . . . . . . . . . . . . . 599,576 599,539
6.00% Senior Notes due 2018 . . . . . . . . . . . . . . . . . . . . . . . . . . . . . . . . 497,512 —
6.50% Senior Notes due 2036 . . . . . . . . . . . . . . . . . . . . . . . . . . . . . . . . 595,824 595,772
6.80% Senior Notes due 2037 . . . . . . . . . . . . . . . . . . . . . . . . . . . . . . . . 298,171 298,150
7.00% Senior Notes due 2038 . . . . . . . . . . . . . . . . . . . . . . . . . . . . . . . . 498,318 —
Foreign bank and other debt denominated in foreign currencies . . . . . . . . 16,046 18,098
Capital lease obligations . . . . . . . . . . . . . . . . . . . . . . . . . . . . . . . . . . . . 6,012 8,378
Other. . . . . . . . . . . . . . . . . . . . . . . . . . . . . . . . . . . . . . . . . . . . . . . . . . . 1,564 —
4,580,113 3,077,909
Less amounts due in one year . . . . . . . . . . . . . . . . . . . . . . . . . . . . . . . . 15,858 11,574
Long-term debt . . . . . . . . . . . . . . . . . . . . . . . . . . . . . . . . . . . . . . . . . . . $4,564,255 $3,066,335
57
WEATHERFORD INTERNATIONAL, LTD. AND SUBSIDIARIES
NOTES TO CONSOLIDATED FINANCIAL STATEMENTS — (Continued)
%%TRANSMSG*** Transmitting Job: H65817 PCN: 058000000 ***%%PCMSG|57 |00006|Yes|No|02/24/2009 04:12|0|0|Page is valid, no graphics -- Color: N|

The following is a summary of scheduled long-term debt maturities by year (in thousands):
2009 . . . . . . . . . . . . . . . . . . . . . . . . . . . . . . . . . . . . . . . . . . . . . . . . . . . . . . . . . . . . . . $ 15,858
2010 . . . . . . . . . . . . . . . . . . . . . . . . . . . . . . . . . . . . . . . . . . . . . . . . . . . . . . . . . . . . . . 10,806
2011 . . . . . . . . . . . . . . . . . . . . . . . . . . . . . . . . . . . . . . . . . . . . . . . . . . . . . . . . . . . . . . 358,256
2012 . . . . . . . . . . . . . . . . . . . . . . . . . . . . . . . . . . . . . . . . . . . . . . . . . . . . . . . . . . . . . . 605,0092013 . . . . . . . . . . . . . . . . . . . . . . . . . . . . . . . . . . . . . . . . . . . . . . . . . . . . . . . . . . . . . . 750,533
Thereafter . . . . . . . . . . . . . . . . . . . . . . . . . . . . . . . . . . . . . . . . . . . . . . . . . . . . . . . . . . 2,839,651
$4,580,113
In March 2008, the Company completed a $1.5 billion long-term debt offering comprised of (i) $500 million of5.15% Senior Notes due in 2013 (“5.15% Senior Notes”), (ii) $500 million of 6.00% Senior Notes due 2018(“6.00% Senior Notes”) and (iii) $500 million of 7.00% Senior Notes due 2038 (“7.00% Senior Notes”). Interest onthese notes is due semi-annually on March 15 and September 15 of each year. The estimated fair value atDecember 31, 2008 of the 5.15% Senior Notes, the 6.00% Senior Notes, and the 7.00% Senior Notes was$463 million, $456 million and $394 million, respectively.
In June 2007, the Company completed a $1.5 billion long-term debt offering comprised of (i) $600 million of5.95% senior notes due 2012 (“5.95% Senior Notes”), (ii) $600 million of 6.35% senior notes due 2017(“6.35% Senior Notes”) and (iii) $300 million of 6.80% senior notes due 2037 (“6.80% Senior Notes”). Intereston these notes are due payable semi-annually on June 15 and December 15 of each year. The estimated fair value atDecember 31, 2008 of the 5.95% Senior Notes, the 6.35% Senior Notes and the 6.80% Senior Notes was$585 million, $513 million and $227 million, respectively.
In August 2006, the Company completed an offering of $600 million senior notes at a coupon rate of 6.50%(“6.50% Senior Notes”) with a maturity in August 2036. The interest on the notes is payable semi-annually inarrears on February 1 and August 1 of each year. The estimated fair value of the 6.50% Senior Notes was$495 million as of December 31, 2008.
In February 2006, the Company completed an offering of $350 million senior notes at a coupon rate of 5.50%(“5.50% Senior Notes”) with a maturity in February 2016. The interest on the notes is payable semi-annually inarrears on February 15 and August 15 of each year. As evidenced by market transactions, the estimated fair value ofthe 5.50% Senior Notes was $306 million as of December 31, 2008.
In October 2003, the Company completed a public offering of $250 million of 4.95% Senior Notes due 2013(“4.95% Senior Notes”). The interest on the notes is payable semi-annually in arrears on April 15 and October 15 ofeach year. The estimated fair value of the 4.95% Senior Notes was $213 million as of December 31, 2008.
In November 2001, the Company completed a private placement of $350 million of 6.625% Senior Notes due2011 (“6.625% Senior Notes”). The interest on the notes is payable semi-annually in arrears on May 15 andNovember 15 of each year. The estimated fair value of the 6.625% Senior Notes was $330 million as ofDecember 31, 2008.
58
WEATHERFORD INTERNATIONAL, LTD. AND SUBSIDIARIES
NOTES TO CONSOLIDATED FINANCIAL STATEMENTS — (Continued)
%%TRANSMSG*** Transmitting Job: H65817 PCN: 059000000 ***%%PCMSG|58 |00007|Yes|No|02/24/2009 04:12|0|0|Page is valid, no graphics -- Color: N|

The following is a recap of the annualized effective rates on the Company’s long-term debt. The effective rateis determined after giving consideration to all derivative activity and amortization of original issue discount (SeeNote 11).
2008 2007
Year EndedDecember 31,
6.625% Senior Notes due 2011 . . . . . . . . . . . . . . . . . . . . . . . . . . . . . . . . . . . . . 6.2% 6.3%
5.95% Senior Notes due 2012 . . . . . . . . . . . . . . . . . . . . . . . . . . . . . . . . . . . . . . 6.0% 6.0%
4.95% Senior Notes due 2013 . . . . . . . . . . . . . . . . . . . . . . . . . . . . . . . . . . . . . . 4.8% 4.8%
5.15% Senior Notes due 2013 . . . . . . . . . . . . . . . . . . . . . . . . . . . . . . . . . . . . . . 5.1% —
5.50% Senior Notes due 2016 . . . . . . . . . . . . . . . . . . . . . . . . . . . . . . . . . . . . . . 5.5% 5.5%6.35% Senior Notes due 2017 . . . . . . . . . . . . . . . . . . . . . . . . . . . . . . . . . . . . . . 6.4% 6.4%
6.00% Senior Notes due 2018 . . . . . . . . . . . . . . . . . . . . . . . . . . . . . . . . . . . . . . 6.0% —
6.50% Senior Notes due 2036 . . . . . . . . . . . . . . . . . . . . . . . . . . . . . . . . . . . . . . 6.5% 6.5%
6.80% Senior Notes due 2037 . . . . . . . . . . . . . . . . . . . . . . . . . . . . . . . . . . . . . . 6.8% 6.8%
7.00% Senior Notes due 2038 . . . . . . . . . . . . . . . . . . . . . . . . . . . . . . . . . . . . . . 7.1% —
11. Derivative Instruments
Interest Rate Swaps
The Company uses interest rate swaps to help mitigate exposures related to short-term interest rates. Amountsreceived upon termination of the swaps represent the fair value of the agreements at the time of termination and arerecorded as an adjustment to the carrying value of the related debt. These amounts are being amortized as areduction to interest expense over the remaining term of the debt.
Upon completion of the long-term debt offering in March 2008, the Company entered into interest rate swapagreements on an aggregate notional amount of $500 million against its 5.15% Senior Notes. These agreementswere terminated in December 2008. As a result of these terminations, the Company received cash proceeds, net ofaccrued interest, of $12 million. The gain associated with these interest rate swap terminations has been deferredand will be amortized over the remaining term of the 5.15% Senior Notes. As of December 31, 2008 and 2007, theCompany had net unamortized gains of $21 million and $12 million, respectively, associated with interest rate swapterminations.
Cash Flow Hedges
In March 2008, the Company entered into interest rate derivative instruments for a notional amount of$500 million to hedge projected exposures to interest rates in anticipation of the 7.00% Senior Notes issued inMarch 2008. Those hedges were terminated at the time of the issuance. The Company paid a cash settlement of$13 million at termination, and the loss on these hedges is being amortized to interest expense over the life of the7.00% Senior Notes.
Other Derivative Instruments
As of December 31, 2008 and 2007, we had several foreign currency forward contracts with notional amountsaggregating $503 million and $682 million, respectively, which were entered into to hedge exposure to currencyfluctuations in various foreign currencies, including, but not limited to, the British pound sterling, the Canadiandollar, the euro and the Norwegian krone. The total estimated fair value of these contracts at December 31, 2008resulted in a liability of approximately $2 million and at December 31, 2007, resulted in an asset of approximately
59
WEATHERFORD INTERNATIONAL, LTD. AND SUBSIDIARIES
NOTES TO CONSOLIDATED FINANCIAL STATEMENTS — (Continued)
%%TRANSMSG*** Transmitting Job: H65817 PCN: 060000000 ***%%PCMSG|59 |00009|Yes|No|02/24/2009 06:54|0|0|Page is valid, no graphics -- Color: N|
$2 million. These derivative instruments were not designated as hedges and the changes in fair value of the contractsare recorded each period in current earnings.
In addition, after the closing of the acquisition of Precision Energy Services and Precision Drilling Inter-national, the Company entered into a series of cross-currency swaps between the U.S. dollar and Canadian dollar tohedge certain exposures to the Canadian dollar created as a result of the acquisition. At December 31, 2008 and2007, the Company had notional amounts outstanding of $280 million and $364 million, respectively. The totalestimated fair value of these contracts at December 31, 2008 and 2007 resulted in an asset of $1 million and aliability of $74 million, respectively. These derivative instruments were not designated as hedges and the changes infair value of the contracts are recorded each period in current earnings.
Effective January 1, 2008, the Company adopted SFAS No. 159. SFAS No. 159 The Fair Value Option forFinancial Assets and Financial Liabilities (“SFAS No. 159”) permits entities to choose to measure many financialinstruments and certain other assets and liabilities at fair value on an instrument-by-instrument basis (the fair valueoption) with changes in fair value reported in earnings. The Company already recorded derivative contracts andhedging activities at fair value in accordance with SFAS No. 133, Accounting for Derivative Instruments andHedging Activities, as amended. The adoption of SFAS No. 159 had no impact on the financial statements as theCompany did not elect the fair value option for any other financial instruments or certain other assets and liabilities.
Effective January 1, 2008, the Company adopted SFAS No. 157, as it relates to financial assets and financialliabilities. In February 2008, the FASB issued FASB Staff Position No. FAS 157-2, Effective Date of FASBStatement No. 157, which delayed the effective date of SFAS No. 157 for all nonfinancial assets and nonfinancialliabilities, except those that are recognized or disclosed at fair value in the financial statements on at least an annualbasis, until January 1, 2009 for calendar year-end entities. Accordingly, the Company will defer the adoption ofSFAS No. 157 for its nonfinancial assets and nonfinancial liabilities until January 1, 2009.
SFAS No. 157 defines fair value, establishes a framework for measuring fair value under generally acceptedaccounting principals and expands disclosures about fair value measurements. The provisions of this standard applyto other accounting pronouncements that require or permit fair value measurements. The adoption of SFAS No. 157,as it relates to financial assets, had no impact on the Company’s consolidated financial position, results ofoperations and cash flows. The Company is currently evaluating the potential impact of SFAS No. 157, as it relatesto nonfinancial assets and nonfinancial liabilities, on its consolidated financial position, results of operations andcash flows.
SFAS No. 157 defines fair value as the price that would be received to sell an asset or paid to transfer a liabilityin an orderly transaction between market participants at the measurement date. SFAS No. 157 establishes a fairvalue hierarchy that distinguishes between market participant assumptions developed based on market dataobtained from independent sources (observable inputs) and an entity’s own assumptions about market participantassumptions developed based on the best information available in the circumstances (unobservable inputs). The fairvalue hierarchy consists of three broad levels, which gives the highest priority to unadjusted quoted prices in activemarkets for identical assets or liabilities (Level 1) and the lowest priority to unobservable inputs (Level 3). The threelevels of the fair value hierarchy under SFAS No. 157 are described below:
Level 1— Unadjusted quoted prices in active markets that are accessible at the measurement date for identical,unrestricted assets or liabilities.
Level 2— Inputs other than quoted prices included within Level 1 that are observable for the asset or liability,either directly or indirectly, including quoted prices for similar assets or liabilities in active markets; quoted pricesfor identical or similar assets or liabilities in markets that are not active; inputs other than quoted prices that areobservable for the asset or liability (e.g., interest rates); and inputs that are derived principally from or corroboratedby observable market data by correlation or other means.
Level 3— Inputs that are both significant to the fair value measurement and unobservable.
60
WEATHERFORD INTERNATIONAL, LTD. AND SUBSIDIARIES
NOTES TO CONSOLIDATED FINANCIAL STATEMENTS — (Continued)
%%TRANSMSG*** Transmitting Job: H65817 PCN: 061000000 ***%%PCMSG|60 |00007|Yes|No|02/24/2009 04:12|0|0|Page is valid, no graphics -- Color: N|

In accordance with SFAS No. 157, the following table presents the Company’s assets and liabilities that aremeasured and recognized at fair value on a recurring basis classified under the appropriate level of the fair valuehierarchy as of December 31, 2008:
Level 1 Level 2 Level 3 TotalDecember 31, 2008
(In thousands)
Assets:
Derivative contracts . . . . . . . . . . . . . . . . . . . . . . . . . . . . . . $— $1,455 $— $1,455
Liabilities:
Derivative contracts . . . . . . . . . . . . . . . . . . . . . . . . . . . . . . — 2,233 — 2,233
12. Shareholders’ Equity
Authorized Shares
The Company is authorized to issue 1,000,000,000 Common Shares and 10,000,000 undesignated preferredshares, $1.00 par value. As of December 31, 2008, no preferred shares have been issued.
Share Repurchase Program
In December 2005, the Company’s Board of Directors approved a share repurchase program under which theCompany can spend up to $1 billion to repurchase Company’s outstanding Common Shares. Pursuant to thisprogram, the Company purchased approximately 10 million and 25 million Common Shares during the years endedDecember 31, 2007 and 2006, at an average price per share of $24.08 and $21.90, respectively. No shares wererepurchased during the year ended December 31, 2008. As of December 31, 2008, the Company had $205 millionavailable under this authorization to repurchase shares.
Warrant
On February 28, 2002, the Company issued Shell Technology Ventures Inc. a warrant to purchase up to12.9 million Common Shares at a price of $15.00 per share. Effective July 12, 2006, this agreement was amendedand restated to reflect, among other things, changes in the Company’s capital structure. The warrant remainsexercisable until February 28, 2012 and is subject to adjustment for changes in the Company’s capital structure orthe issuance of dividends in cash, securities or property. Upon exercise by the holder, settlement may occur throughphysical delivery, net share settlement, net cash settlement or a combination thereof. The net cash settlement optionupon exercise is at the sole discretion of the Company. In addition, the amended and restated warrant no longercontains a conversion feature, which previously allowed the warrant holder to convert the warrant into CommonShares. The amendment did not affect the accounting or classification of the warrant.
13. Share-Based Compensation Plans
Incentive Plan
In May 2006, shareholders voted to approve the Weatherford International Ltd. 2006 Omnibus Incentive Plan(“Omnibus Plan”) previously adopted by the Board of Directors in February 2006. The Omnibus Plan provides forawards of options, stock appreciation rights, restricted share awards (“RSA”), restricted share units (“RSU”),performance share awards, performance unit awards, other share-based awards and cash-based awards to anyemployee or non-employee director of the Company or any of its affiliates. All future issuances of share-basedawards will be made from the Omnibus Plan. The provisions of each award will vary based on the type of awardgranted and will be specified by the Compensation Committee of the Board of Directors. Those awards, such asoptions and SARs, that are based on a specific contractual term will be granted with a term not to exceed ten years.The terms of the issuances to date under the Omnibus Plan are consistent with awards previously granted. Under the
61
WEATHERFORD INTERNATIONAL, LTD. AND SUBSIDIARIES
NOTES TO CONSOLIDATED FINANCIAL STATEMENTS — (Continued)
%%TRANSMSG*** Transmitting Job: H65817 PCN: 062000000 ***%%PCMSG|61 |00007|Yes|No|02/24/2009 04:12|0|0|Page is valid, no graphics -- Color: N|

Omnibus Plan, there are 20 million Common Shares available for grant. As of December 31, 2008, approximatelyeight million shares were available for grant under the plan. To date, only options, restricted shares and restrictedshare units have been granted under the Omnibus Plan.
The options granted under the Omnibus Plan are granted with an exercise price equal to or greater than the fairmarket value of the Common Shares at the time the option is granted. The Company values and recognizes theoptions and restricted shares and restricted share units similar to the awards previously granted under theCompany’s other share-based payment plans.
Stock Option Plans
The Company has a number of stock option plans pursuant to which directors, officers and key employees havebeen granted options to purchase Common Shares at the fair market value on the date of grant.
The Company has in effect a 1991 Employee Stock Option Plan (“1991 ESO Plan”), a 1992 Employee StockOption Plan (“1992 ESO Plan”) and a 1998 Employee Stock Option Plan (“1998 ESO Plan”). Stock optionsgenerally vest after one to four years following the date of grant and expire after ten to fourteen years from the dateof grant. Subsequent to the approval of the Company’s Omnibus Plan in May 2006, future grants under these planshave been suspended.
Restricted Share Plan
The Restricted Share Plan provides for the granting of RSAs or RSUs, the vesting of which is subject toconditions and limitations established at the time of the grant. Upon the grant of an RSA, the participant has therights of a shareholder, including but not limited to the right to vote such shares and the right to receive anydividends paid on such shares. Recipients of RSU awards will not have the rights of a shareholder of the Companyuntil such date as the Common Shares are issued or transferred to the recipient. Key employees, directors andpersons providing material services to the Company may be eligible for participation in the Restricted Share Plan.Subsequent to the approval of the Company’s Omnibus Plan in May 2006, future RSA and RSU grants under thisplan have been suspended.
RSAs and RSUs vest based on continued employment, and vesting generally occurs over a two to five-yearperiod, with an equal amount of the restricted shares vesting on each anniversary of the grant date or with 50% of theshares vesting after two years and the remaining portion vesting in the fourth year.
The fair value of RSAs and RSUs is determined based on the closing price of the Company’s shares on thegrant date. The total fair value, less assumed forfeitures, is amortized to expense on a straight-line basis over thevesting period.
Executive Deferred Compensation Plan
Under the Company’s Executive Deferred Compensation Stock Ownership Plan (the “EDC Plan”), a portion ofthe compensation for certain key employees of the Company, including officers and employee directors, can bedeferred for payment after retirement or termination of employment. The Company has established a grantor trust tofund the benefits under the EDC Plan. The funds provided to such trust are invested by a trustee independent of theCompany in Common Shares, which are purchased by the trustee on the open market. The assets of the trust areavailable to satisfy the claims of all general creditors of the Company in the event of bankruptcy or insolvency.Accordingly, the Common Shares held by the trust and the liability of the Company under the EDC Plan areincluded in the accompanying Consolidated Balance Sheets as Treasury Shares, Net. Effective December 31, 2008,the Company suspended the EDC Plan. While the plan is suspended, no new participants may join the plan and nofurther deferrals of compensation or matching contributions will be made under the plan unless and until theCompany’s Board of Directors determines otherwise.
62
WEATHERFORD INTERNATIONAL, LTD. AND SUBSIDIARIES
NOTES TO CONSOLIDATED FINANCIAL STATEMENTS — (Continued)
%%TRANSMSG*** Transmitting Job: H65817 PCN: 063000000 ***%%PCMSG|62 |00007|Yes|No|02/24/2009 04:12|0|0|Page is valid, no graphics -- Color: N|
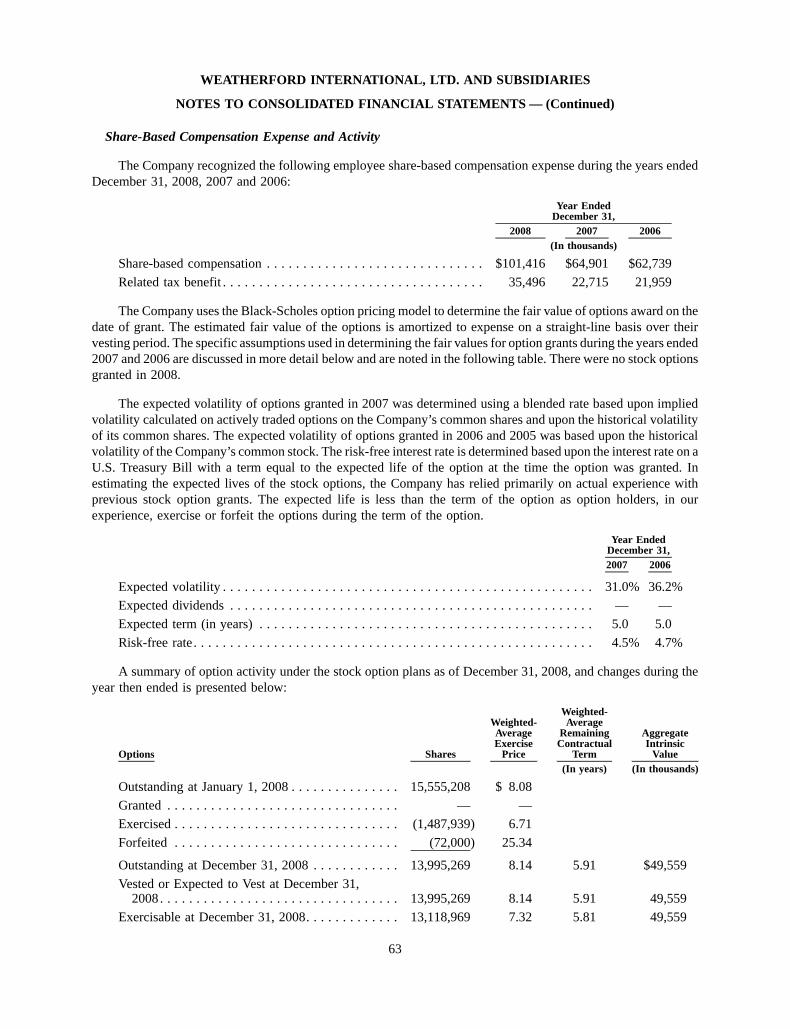
Share-Based Compensation Expense and Activity
The Company recognized the following employee share-based compensation expense during the years endedDecember 31, 2008, 2007 and 2006:
2008 2007 2006
Year EndedDecember 31,
(In thousands)
Share-based compensation . . . . . . . . . . . . . . . . . . . . . . . . . . . . . . $101,416 $64,901 $62,739
Related tax benefit . . . . . . . . . . . . . . . . . . . . . . . . . . . . . . . . . . . . 35,496 22,715 21,959
The Company uses the Black-Scholes option pricing model to determine the fair value of options award on thedate of grant. The estimated fair value of the options is amortized to expense on a straight-line basis over theirvesting period. The specific assumptions used in determining the fair values for option grants during the years ended2007 and 2006 are discussed in more detail below and are noted in the following table. There were no stock optionsgranted in 2008.
The expected volatility of options granted in 2007 was determined using a blended rate based upon impliedvolatility calculated on actively traded options on the Company’s common shares and upon the historical volatilityof its common shares. The expected volatility of options granted in 2006 and 2005 was based upon the historicalvolatility of the Company’s common stock. The risk-free interest rate is determined based upon the interest rate on aU.S. Treasury Bill with a term equal to the expected life of the option at the time the option was granted. Inestimating the expected lives of the stock options, the Company has relied primarily on actual experience withprevious stock option grants. The expected life is less than the term of the option as option holders, in ourexperience, exercise or forfeit the options during the term of the option.
2007 2006
Year EndedDecember 31,
Expected volatility . . . . . . . . . . . . . . . . . . . . . . . . . . . . . . . . . . . . . . . . . . . . . . . . . . . 31.0% 36.2%
Expected dividends . . . . . . . . . . . . . . . . . . . . . . . . . . . . . . . . . . . . . . . . . . . . . . . . . . — —
Expected term (in years) . . . . . . . . . . . . . . . . . . . . . . . . . . . . . . . . . . . . . . . . . . . . . . 5.0 5.0
Risk-free rate. . . . . . . . . . . . . . . . . . . . . . . . . . . . . . . . . . . . . . . . . . . . . . . . . . . . . . . 4.5% 4.7%
A summary of option activity under the stock option plans as of December 31, 2008, and changes during theyear then ended is presented below:
Options Shares
Weighted-AverageExercise
Price
Weighted-Average
RemainingContractual
Term
AggregateIntrinsic
Value(In years) (In thousands)
Outstanding at January 1, 2008 . . . . . . . . . . . . . . . 15,555,208 $ 8.08
Granted . . . . . . . . . . . . . . . . . . . . . . . . . . . . . . . . — —
Exercised . . . . . . . . . . . . . . . . . . . . . . . . . . . . . . . (1,487,939) 6.71
Forfeited . . . . . . . . . . . . . . . . . . . . . . . . . . . . . . . (72,000) 25.34
Outstanding at December 31, 2008 . . . . . . . . . . . . 13,995,269 8.14 5.91 $49,559
Vested or Expected to Vest at December 31,2008 . . . . . . . . . . . . . . . . . . . . . . . . . . . . . . . . . 13,995,269 8.14 5.91 49,559
Exercisable at December 31, 2008. . . . . . . . . . . . . 13,118,969 7.32 5.81 49,559
63
WEATHERFORD INTERNATIONAL, LTD. AND SUBSIDIARIES
NOTES TO CONSOLIDATED FINANCIAL STATEMENTS — (Continued)
%%TRANSMSG*** Transmitting Job: H65817 PCN: 064000000 ***%%PCMSG|63 |00009|Yes|No|02/24/2009 06:30|0|0|Page is valid, no graphics -- Color: N|

The weighted-average grant date fair value of options granted during the years ended December 31, 2007 and2006 was $7.16 and $8.78, respectively. There were no options granted during 2008. The intrinsic value of optionsexercised during 2008, 2007 and 2006 was $46 million, $110 million and $146 million, respectively. As ofDecember 31, 2008, there was $4 million of total unrecognized compensation cost related to the Company’sunvested stock options and that cost is expected to be recognized over a weighted-average period of 2 years.
A summary of the status of the Company’s non-vested RSAs and RSUs issued under its Restricted Share Planand Omnibus Plan as of December 31, 2008 and changes during the year then ended, is presented below:
RSA
Weighted-AverageGrant DateFair Value RSU
Weighted-AverageGrant DateFair Value
Non-Vested at January 1, 2008 . . . . . 4,994,854 $19.52 3,696,900 $21.25
Granted . . . . . . . . . . . . . . . . . . . . . . 3,619,970 32.95 3,493,204 32.13
Vested . . . . . . . . . . . . . . . . . . . . . . . (788,327) 14.94 (453,282) 17.61
Forfeited. . . . . . . . . . . . . . . . . . . . . . (447,649) 24.86 (623,948) 22.86
Non-Vested at December 31, 2008. . . 7,378,848 26.16 6,112,874 27.40
The weighted-average grant date fair value of RSAs and RSUs granted during the years ended 2008, 2007 and2006 was $32.55, $25.42 and $21.82, respectively. The total fair value of RSAs and RSUs vested during the yearsended 2008, 2007 and 2006 was $40 million, $156 million and $47 million, respectively. As of December 31, 2008,there was $247 million of total unrecognized compensation cost related to non-vested RSAs and RSUs, which isexpected to be recognized over a weighted-average period of 2 years.
14. Retirement and Employee Benefit Plans
The Company has defined contribution plans covering certain employees. Contribution expenses related tothese plans totaled $32 million, $29 million and $22 million in 2008, 2007 and 2006, respectively.
The Company has defined benefit pension and other post-retirement benefit plans covering certain U.S. andinternational employees. Plan benefits are generally based on factors such as age, compensation levels and years ofservice. The Company has a SERP which provides pension benefits to certain executives upon retirement. This planis a nonqualified, unfunded retirement plan and in order to meet its future benefit obligations under the SERP, theCompany maintains life insurance policies on the lives of the participants. These policies are not included as planassets nor in the funded status amounts in the table below. The Company is the sole owner and beneficiary of suchpolicies.
Effective December 31, 2006, the Company adopted Statement No. 158, Employer’s Accounting for DefinedBenefit Pension and Other Postretirement Plans, an amendment of FASB Statements No. 87, 88, 106, and 132(R)(“SFAS No. 158”), which requires recognition of the overfunded or underfunded status of an entity’s defined benefitor postretirement plan as an asset or liability in the financial statements, requires the measurement of defined benefitor postretirement plan assets and obligations as of the end of the employer’s fiscal year, and requires recognition ofthe previously deferred portion of defined benefit or postretirement plans in other comprehensive income.
64
WEATHERFORD INTERNATIONAL, LTD. AND SUBSIDIARIES
NOTES TO CONSOLIDATED FINANCIAL STATEMENTS — (Continued)
%%TRANSMSG*** Transmitting Job: H65817 PCN: 065000000 ***%%PCMSG|64 |00008|Yes|No|02/24/2009 04:12|0|0|Page is valid, no graphics -- Color: N|

The changes in benefit obligations were as follows:
UnitedStates International
UnitedStates International
2008 2007Year Ended December 31,
(In thousands)
Benefit obligation at beginning of year. . . . . . . $115,585 $189,193 $ 94,307 $153,940
Service cost. . . . . . . . . . . . . . . . . . . . . . . . . . . 2,879 13,557 2,642 11,308
Interest cost. . . . . . . . . . . . . . . . . . . . . . . . . . . 6,017 9,905 5,391 8,189
Plan participants’ contributions . . . . . . . . . . . . — 3,547 — 3,436
Business combinations . . . . . . . . . . . . . . . . . . . — — — 2,483
Amendments . . . . . . . . . . . . . . . . . . . . . . . . . . — (553) 2,901 152
Curtailments . . . . . . . . . . . . . . . . . . . . . . . . . . — — (2,010) —
Settlements . . . . . . . . . . . . . . . . . . . . . . . . . . . (12,001) (2,116) (8,606) (42)
Actuarial (gain)/loss . . . . . . . . . . . . . . . . . . . . 10,691 (22,099) 21,887 7,606
Currency fluctuations. . . . . . . . . . . . . . . . . . . . — (43,060) — 7,325
Benefits paid . . . . . . . . . . . . . . . . . . . . . . . . . . (1,249) (4,966) (927) (5,204)
Benefit obligation at end of year . . . . . . . . . . . $121,922 $143,408 $115,585 $189,193
The changes in plan assets were as follows:
UnitedStates International
UnitedStates International
2008 2007Year Ended December 31,
(In thousands)
Fair value of plan assets at beginning of year . . . $ 10,518 $142,919 $ 12,023 $120,447
Actual return on plan assets . . . . . . . . . . . . . . . . (2,816) (23,760) 821 7,079
Employer contribution . . . . . . . . . . . . . . . . . . . . 535 14,408 1,079 11,371Plan participants’ contributions . . . . . . . . . . . . . . — 3,547 — 3,436
Business combinations . . . . . . . . . . . . . . . . . . . . — — — 1,338
Settlements . . . . . . . . . . . . . . . . . . . . . . . . . . . . — (1,984) (2,478) (42)
Currency fluctuations . . . . . . . . . . . . . . . . . . . . . — (34,123) — 4,054
Benefits paid . . . . . . . . . . . . . . . . . . . . . . . . . . . (1,141) (4,414) (927) (4,764)
Fair value of plan assets at end of year . . . . . . . . 7,096 96,593 10,518 142,919
Funded status . . . . . . . . . . . . . . . . . . . . . . . . . . . $(114,826) $ (46,815) $(105,067) $ (46,274)
The amounts recognized in the Consolidated Balance Sheets were as follows:
UnitedStates International
UnitedStates International
2008 2007Year Ended December 31,
(In thousands)
Noncurrent assets . . . . . . . . . . . . . . . . . . . . . . $ — $ — $ — $ 136
Current liabilities . . . . . . . . . . . . . . . . . . . . . . (8,671) (494) (12,075) —
Noncurrent liabilities . . . . . . . . . . . . . . . . . . . (106,155) (46,321) (92,992) (46,410)
65
WEATHERFORD INTERNATIONAL, LTD. AND SUBSIDIARIES
NOTES TO CONSOLIDATED FINANCIAL STATEMENTS — (Continued)
%%TRANSMSG*** Transmitting Job: H65817 PCN: 066000000 ***%%PCMSG|65 |00007|Yes|No|02/24/2009 04:12|0|0|Page is valid, no graphics -- Color: N|

Amounts in accumulated other comprehensive income that have not yet been recognized as components of netperiodic benefit cost were as follows:
UnitedStates International
UnitedStates International
2008 2007Year Ended December 31,
(In thousands)
Net loss . . . . . . . . . . . . . . . . . . . . . . . . . . . . . . . $57,888 $20,796 $53,177 $16,297
Net prior service costs (credit) . . . . . . . . . . . . . . . 15,358 (755) 17,191 (1,271)
Net transition asset . . . . . . . . . . . . . . . . . . . . . . . — (20) — (25)
Total accumulated other comprehensive income . . $73,246 $20,021 $70,368 $15,001
The accumulated benefit obligation for defined benefit pension plans was $79 million and $84 million atDecember 31, 2008 and 2007, respectively, for the U.S. plans and $129 million and $173 million at December 31,2008 and 2007, respectively, for the international plans.
The projected benefit obligation, accumulated benefit obligation, and fair value of plan assets for the pensionplans with projected benefit obligations in excess of plan assets or accumulated benefit obligations in excess of planassets as of December 31, 2008 and 2007 were as follows:
UnitedStates International
UnitedStates International
2008 2007
(In thousands)
Plans with projected benefit obligation inexcess of plan assets:Projected benefit obligation . . . . . . . . . . . . . $121,922 $143,156 $115,585 $185,963
Fair value of plan assets . . . . . . . . . . . . . . . . 7,096 96,162 10,518 139,281
Plans with accumulated benefit obligation inexcess of plan assets:
Accumulated benefit obligation . . . . . . . . . . 78,727 128,474 84,034 151,352
Fair value of plan assets . . . . . . . . . . . . . . . . 7,096 96,162 10,518 117,816
The components of net periodic benefit cost during the years ended December 31, 2008, 2007 and 2006 were asfollows:
UnitedStates International
UnitedStates International
UnitedStates International
2008 2007 2006
(In thousands)
Service cost . . . . . . . . . . . . . . . . . . . $ 2,879 $13,557 $ 2,642 $11,308 $ 2,301 $ 9,694
Interest cost . . . . . . . . . . . . . . . . . . . 6,017 9,905 5,391 8,189 4,154 6,575
Expected return on plan assets . . . . . (687) (8,700) (744) (8,003) (765) (6,126)
Amortization of transition asset . . . . . — (4) — (4) — (4)
Amortization of prior service cost(credit) . . . . . . . . . . . . . . . . . . . . . 1,833 (47) 2,108 (87) 2,234 (104)
Settlements/curtailments . . . . . . . . . . 5,621 (126) 1,548 4 6,848 —
Amortization of net loss . . . . . . . . . . 3,862 319 4,224 208 1,807 549
Net periodic benefit cost . . . . . . . . . . $19,525 $14,904 $15,169 $11,615 $16,579 $10,584
66
WEATHERFORD INTERNATIONAL, LTD. AND SUBSIDIARIES
NOTES TO CONSOLIDATED FINANCIAL STATEMENTS — (Continued)
%%TRANSMSG*** Transmitting Job: H65817 PCN: 067000000 ***%%PCMSG|66 |00007|Yes|No|02/24/2009 04:12|0|0|Page is valid, no graphics -- Color: N|

Other changes in plan assets and benefit obligations recognized in other comprehensive income during theyears ended December 31, 2008 and 2007 were as follows:
UnitedStates International
UnitedStates International
2008 2007
(In thousands)
New Activity:
Net loss for the year . . . . . . . . . . . . . . . . . . . . $14,194 $10,747 $19,799 $8,525
Net prior service cost for the year . . . . . . . . . . — 90 2,901 152
Reclassification Adjustments:Net loss . . . . . . . . . . . . . . . . . . . . . . . . . . . . . (9,483) (193) (3,891) (212)
Prior service credit (cost) . . . . . . . . . . . . . . . . . (1,833) 47 (3,989) 87
Transition asset . . . . . . . . . . . . . . . . . . . . . . . . — 4 — 4
Total other comprehensive income: . . . . . . . . . . . $ 2,878 $10,695 $14,820 $8,556
Amounts in accumulated other comprehensive income expected to be recognized as components of netperiodic benefit cost in 2009 are as follows:
UnitedStates International
(In thousands)
Net loss . . . . . . . . . . . . . . . . . . . . . . . . . . . . . . . . . . . . . . . . . . . . . . . . . . . . $4,312 $602
Prior service costs (credit) . . . . . . . . . . . . . . . . . . . . . . . . . . . . . . . . . . . . . . 1,833 (40)
Transition asset . . . . . . . . . . . . . . . . . . . . . . . . . . . . . . . . . . . . . . . . . . . . . . — (4)
Prior service costs are amortized using an alternative straight-line method over the average remaining serviceperiod of employees expected to receive plan benefits.
Assumed long-term rates of return on plan assets, discount rates and rates of compensation increases vary forthe different plans according to the local economic conditions.
The weighted average assumption rates used for benefit obligations were as follows:
2008 2007Year Ended December 31,
Discount rate:
United States plans . . . . . . . . . . . . . . . . . . . . . . . . . . . . . . . . . . . . 5.75 - 6.25% 5.00 - 6.00%
International plans . . . . . . . . . . . . . . . . . . . . . . . . . . . . . . . . . . . . . 2.10 - 6.00 1.94 - 8.10
Rate of compensation increase:United States plans . . . . . . . . . . . . . . . . . . . . . . . . . . . . . . . . . . . . 8.00 8.00
International plans . . . . . . . . . . . . . . . . . . . . . . . . . . . . . . . . . . . . . 2.00 - 5.15 2.00 - 6.50
67
WEATHERFORD INTERNATIONAL, LTD. AND SUBSIDIARIES
NOTES TO CONSOLIDATED FINANCIAL STATEMENTS — (Continued)
%%TRANSMSG*** Transmitting Job: H65817 PCN: 068000000 ***%%PCMSG|67 |00007|Yes|No|02/24/2009 04:12|0|0|Page is valid, no graphics -- Color: N|
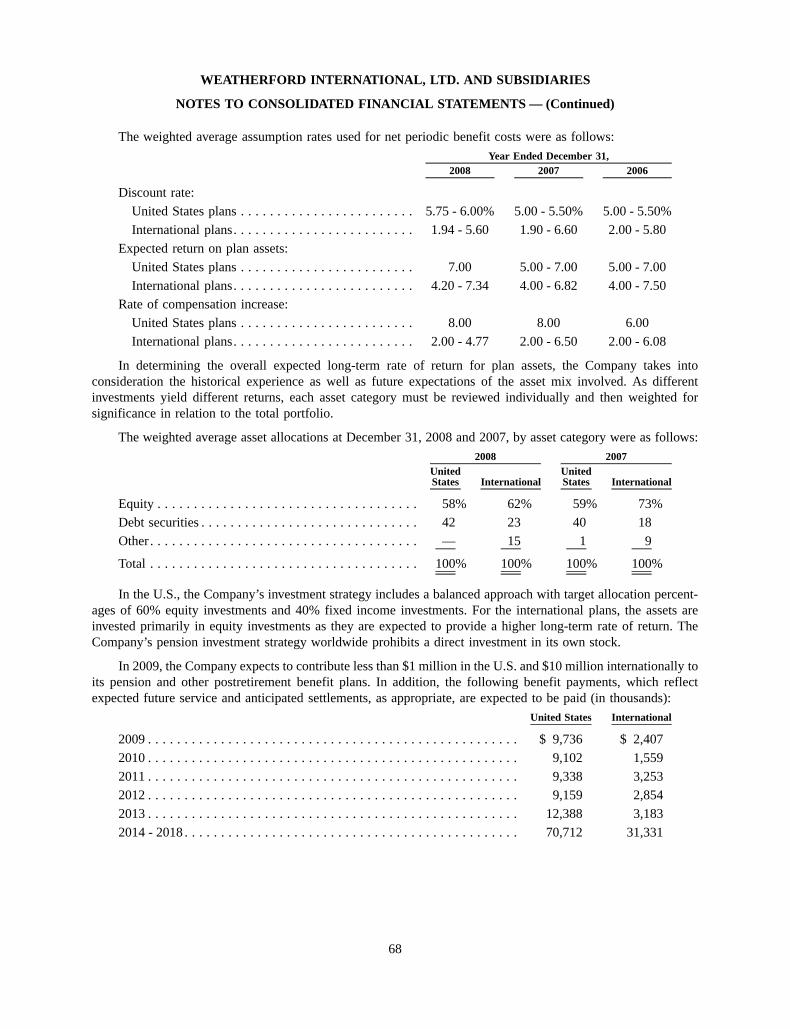
The weighted average assumption rates used for net periodic benefit costs were as follows:
2008 2007 2006Year Ended December 31,
Discount rate:
United States plans . . . . . . . . . . . . . . . . . . . . . . . . 5.75 - 6.00% 5.00 - 5.50% 5.00 - 5.50%
International plans. . . . . . . . . . . . . . . . . . . . . . . . . 1.94 - 5.60 1.90 - 6.60 2.00 - 5.80
Expected return on plan assets:
United States plans . . . . . . . . . . . . . . . . . . . . . . . . 7.00 5.00 - 7.00 5.00 - 7.00
International plans. . . . . . . . . . . . . . . . . . . . . . . . . 4.20 - 7.34 4.00 - 6.82 4.00 - 7.50Rate of compensation increase:
United States plans . . . . . . . . . . . . . . . . . . . . . . . . 8.00 8.00 6.00
International plans. . . . . . . . . . . . . . . . . . . . . . . . . 2.00 - 4.77 2.00 - 6.50 2.00 - 6.08
In determining the overall expected long-term rate of return for plan assets, the Company takes intoconsideration the historical experience as well as future expectations of the asset mix involved. As differentinvestments yield different returns, each asset category must be reviewed individually and then weighted forsignificance in relation to the total portfolio.
The weighted average asset allocations at December 31, 2008 and 2007, by asset category were as follows:
UnitedStates International
UnitedStates International
2008 2007
Equity . . . . . . . . . . . . . . . . . . . . . . . . . . . . . . . . . . . . 58% 62% 59% 73%Debt securities . . . . . . . . . . . . . . . . . . . . . . . . . . . . . . 42 23 40 18
Other . . . . . . . . . . . . . . . . . . . . . . . . . . . . . . . . . . . . . — 15 1 9
Total . . . . . . . . . . . . . . . . . . . . . . . . . . . . . . . . . . . . . 100% 100% 100% 100%
In the U.S., the Company’s investment strategy includes a balanced approach with target allocation percent-ages of 60% equity investments and 40% fixed income investments. For the international plans, the assets areinvested primarily in equity investments as they are expected to provide a higher long-term rate of return. TheCompany’s pension investment strategy worldwide prohibits a direct investment in its own stock.
In 2009, the Company expects to contribute less than $1 million in the U.S. and $10 million internationally toits pension and other postretirement benefit plans. In addition, the following benefit payments, which reflectexpected future service and anticipated settlements, as appropriate, are expected to be paid (in thousands):
United States International
2009 . . . . . . . . . . . . . . . . . . . . . . . . . . . . . . . . . . . . . . . . . . . . . . . . . . . $ 9,736 $ 2,407
2010 . . . . . . . . . . . . . . . . . . . . . . . . . . . . . . . . . . . . . . . . . . . . . . . . . . . 9,102 1,559
2011 . . . . . . . . . . . . . . . . . . . . . . . . . . . . . . . . . . . . . . . . . . . . . . . . . . . 9,338 3,253
2012 . . . . . . . . . . . . . . . . . . . . . . . . . . . . . . . . . . . . . . . . . . . . . . . . . . . 9,159 2,854
2013 . . . . . . . . . . . . . . . . . . . . . . . . . . . . . . . . . . . . . . . . . . . . . . . . . . . 12,388 3,183
2014 - 2018 . . . . . . . . . . . . . . . . . . . . . . . . . . . . . . . . . . . . . . . . . . . . . . 70,712 31,331
68
WEATHERFORD INTERNATIONAL, LTD. AND SUBSIDIARIES
NOTES TO CONSOLIDATED FINANCIAL STATEMENTS — (Continued)
%%TRANSMSG*** Transmitting Job: H65817 PCN: 069000000 ***%%PCMSG|68 |00009|Yes|No|02/24/2009 04:12|0|0|Page is valid, no graphics -- Color: N|

15. Income Taxes
The components of Income from Continuing Operations Before Income Taxes and Minority Interest were asfollows:
2008 2007 2006Year Ended December 31,
(In thousands)
Domestic . . . . . . . . . . . . . . . . . . . . . . . . . . . . . . . . . . . . . $ 533,942 $ 512,275 $ 536,440
Foreign . . . . . . . . . . . . . . . . . . . . . . . . . . . . . . . . . . . . . . 1,155,972 932,211 702,469
$1,689,914 $1,444,486 $1,238,909
The Company’s income tax benefit (provision) from continuing operations consisted of the following:
2008 2007 2006Year Ended December 31,
(In thousands)
Current:
U.S. federal and state income taxes . . . . . . . . . . . . . . . . . . $ (96,549) $(132,182) $ (82,177)Foreign. . . . . . . . . . . . . . . . . . . . . . . . . . . . . . . . . . . . . . . (233,704) (171,705) (190,883)
Total current . . . . . . . . . . . . . . . . . . . . . . . . . . . . . . . . . (330,253) (303,887) (273,060)
Deferred:
U.S. federal . . . . . . . . . . . . . . . . . . . . . . . . . . . . . . . . . . . 37,045 (47,990) (78,819)
Foreign. . . . . . . . . . . . . . . . . . . . . . . . . . . . . . . . . . . . . . . 4,397 19,117 30,406
Total deferred . . . . . . . . . . . . . . . . . . . . . . . . . . . . . . . . 41,442 (28,873) (48,413)
$(288,811) $(332,760) $(321,473)
The difference between the tax (provision) benefit at the statutory federal income tax rate and the tax(provision) benefit attributable to Income from Continuing Operations Before Income Taxes and Minority Interestfor the three years ended December 31, 2008 is analyzed below:
2008 2007 2006Year Ended December 31,
(In thousands)
Statutory federal income tax rate . . . . . . . . . . . . . . . . . . . . . . $(591,470) $(505,571) $(433,618)
Effect of state income tax, net and alternative minimum tax. . (11,177) (8,957) (1,910)
Effect of domestic non-deductible expenses . . . . . . . . . . . . . . (2,510) (5,295) 2,397
Change in valuation allowance . . . . . . . . . . . . . . . . . . . . . . . (4,574) (6,662) (8,395)
Effect of foreign income tax, net . . . . . . . . . . . . . . . . . . . . . . 332,332 204,470 99,291Change in income tax reserve . . . . . . . . . . . . . . . . . . . . . . . . (9,302) (5,425) 7,500
Other . . . . . . . . . . . . . . . . . . . . . . . . . . . . . . . . . . . . . . . . . . (2,110) (5,320) 13,262
$(288,811) $(332,760) $(321,473)
During 2008, the Company recorded a benefit of approximately $100 million related to foreign taxes paid thatwill be used to reduce its future United States tax liability. This adjustment is presented in effect of foreign incometax, net.
During 2006, the Company recorded a benefit of $26 million related to the favorable settlement of certainforeign income tax exposures. This adjustment is presented in effect of foreign income tax, net.
69
WEATHERFORD INTERNATIONAL, LTD. AND SUBSIDIARIES
NOTES TO CONSOLIDATED FINANCIAL STATEMENTS — (Continued)
%%TRANSMSG*** Transmitting Job: H65817 PCN: 070000000 ***%%PCMSG|69 |00009|Yes|No|02/24/2009 12:26|0|0|Page is valid, no graphics -- Color: N|
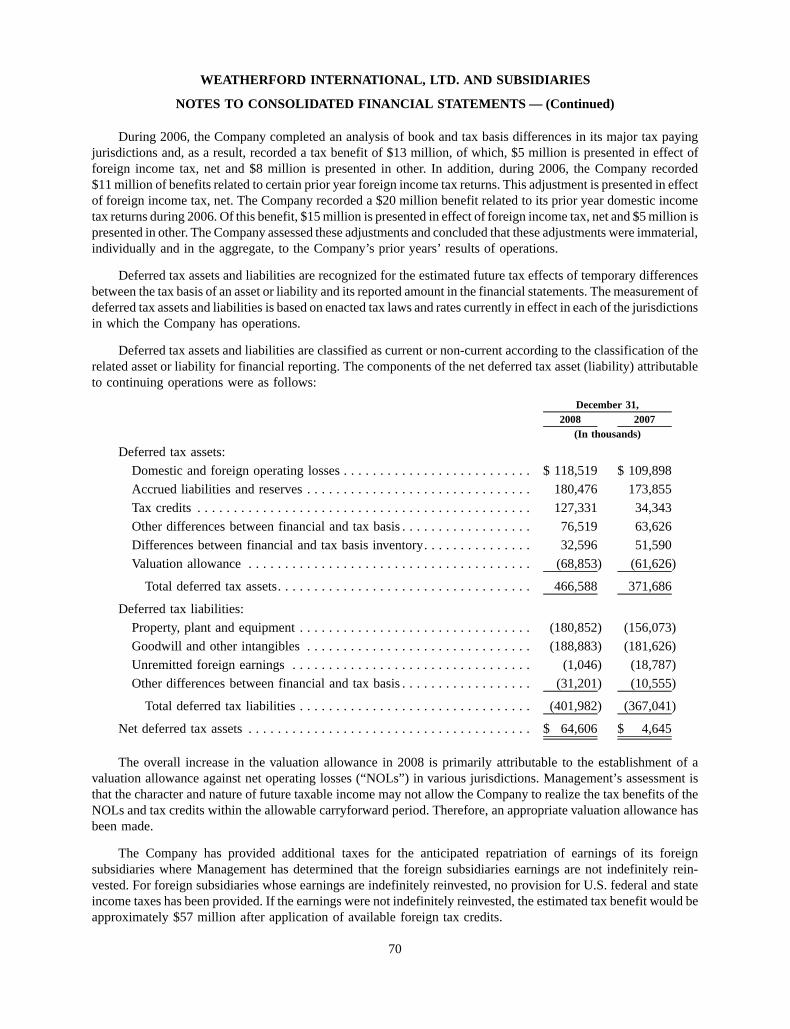
During 2006, the Company completed an analysis of book and tax basis differences in its major tax payingjurisdictions and, as a result, recorded a tax benefit of $13 million, of which, $5 million is presented in effect offoreign income tax, net and $8 million is presented in other. In addition, during 2006, the Company recorded$11 million of benefits related to certain prior year foreign income tax returns. This adjustment is presented in effectof foreign income tax, net. The Company recorded a $20 million benefit related to its prior year domestic incometax returns during 2006. Of this benefit, $15 million is presented in effect of foreign income tax, net and $5 million ispresented in other. The Company assessed these adjustments and concluded that these adjustments were immaterial,individually and in the aggregate, to the Company’s prior years’ results of operations.
Deferred tax assets and liabilities are recognized for the estimated future tax effects of temporary differencesbetween the tax basis of an asset or liability and its reported amount in the financial statements. The measurement ofdeferred tax assets and liabilities is based on enacted tax laws and rates currently in effect in each of the jurisdictionsin which the Company has operations.
Deferred tax assets and liabilities are classified as current or non-current according to the classification of therelated asset or liability for financial reporting. The components of the net deferred tax asset (liability) attributableto continuing operations were as follows:
2008 2007December 31,
(In thousands)
Deferred tax assets:
Domestic and foreign operating losses . . . . . . . . . . . . . . . . . . . . . . . . . . $ 118,519 $ 109,898
Accrued liabilities and reserves . . . . . . . . . . . . . . . . . . . . . . . . . . . . . . . 180,476 173,855
Tax credits . . . . . . . . . . . . . . . . . . . . . . . . . . . . . . . . . . . . . . . . . . . . . . 127,331 34,343
Other differences between financial and tax basis . . . . . . . . . . . . . . . . . . 76,519 63,626
Differences between financial and tax basis inventory. . . . . . . . . . . . . . . 32,596 51,590
Valuation allowance . . . . . . . . . . . . . . . . . . . . . . . . . . . . . . . . . . . . . . . (68,853) (61,626)
Total deferred tax assets. . . . . . . . . . . . . . . . . . . . . . . . . . . . . . . . . . . 466,588 371,686
Deferred tax liabilities:
Property, plant and equipment . . . . . . . . . . . . . . . . . . . . . . . . . . . . . . . . (180,852) (156,073)
Goodwill and other intangibles . . . . . . . . . . . . . . . . . . . . . . . . . . . . . . . (188,883) (181,626)
Unremitted foreign earnings . . . . . . . . . . . . . . . . . . . . . . . . . . . . . . . . . (1,046) (18,787)
Other differences between financial and tax basis . . . . . . . . . . . . . . . . . . (31,201) (10,555)
Total deferred tax liabilities . . . . . . . . . . . . . . . . . . . . . . . . . . . . . . . . (401,982) (367,041)
Net deferred tax assets . . . . . . . . . . . . . . . . . . . . . . . . . . . . . . . . . . . . . . . $ 64,606 $ 4,645
The overall increase in the valuation allowance in 2008 is primarily attributable to the establishment of avaluation allowance against net operating losses (“NOLs”) in various jurisdictions. Management’s assessment isthat the character and nature of future taxable income may not allow the Company to realize the tax benefits of theNOLs and tax credits within the allowable carryforward period. Therefore, an appropriate valuation allowance hasbeen made.
The Company has provided additional taxes for the anticipated repatriation of earnings of its foreignsubsidiaries where Management has determined that the foreign subsidiaries earnings are not indefinitely rein-vested. For foreign subsidiaries whose earnings are indefinitely reinvested, no provision for U.S. federal and stateincome taxes has been provided. If the earnings were not indefinitely reinvested, the estimated tax benefit would beapproximately $57 million after application of available foreign tax credits.
70
WEATHERFORD INTERNATIONAL, LTD. AND SUBSIDIARIES
NOTES TO CONSOLIDATED FINANCIAL STATEMENTS — (Continued)
%%TRANSMSG*** Transmitting Job: H65817 PCN: 071000000 ***%%PCMSG|70 |00008|Yes|No|02/24/2009 04:12|0|0|Page is valid, no graphics -- Color: N|
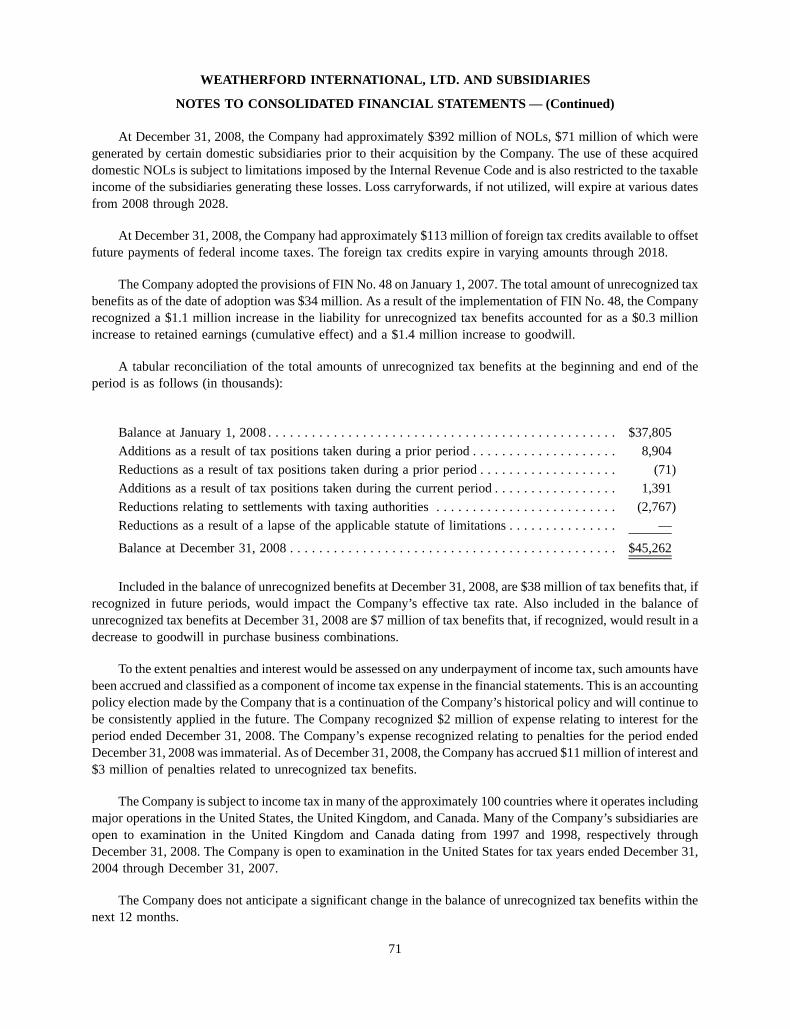
At December 31, 2008, the Company had approximately $392 million of NOLs, $71 million of which weregenerated by certain domestic subsidiaries prior to their acquisition by the Company. The use of these acquireddomestic NOLs is subject to limitations imposed by the Internal Revenue Code and is also restricted to the taxableincome of the subsidiaries generating these losses. Loss carryforwards, if not utilized, will expire at various datesfrom 2008 through 2028.
At December 31, 2008, the Company had approximately $113 million of foreign tax credits available to offsetfuture payments of federal income taxes. The foreign tax credits expire in varying amounts through 2018.
The Company adopted the provisions of FIN No. 48 on January 1, 2007. The total amount of unrecognized taxbenefits as of the date of adoption was $34 million. As a result of the implementation of FIN No. 48, the Companyrecognized a $1.1 million increase in the liability for unrecognized tax benefits accounted for as a $0.3 millionincrease to retained earnings (cumulative effect) and a $1.4 million increase to goodwill.
A tabular reconciliation of the total amounts of unrecognized tax benefits at the beginning and end of theperiod is as follows (in thousands):
Balance at January 1, 2008 . . . . . . . . . . . . . . . . . . . . . . . . . . . . . . . . . . . . . . . . . . . . . . . . $37,805
Additions as a result of tax positions taken during a prior period . . . . . . . . . . . . . . . . . . . . 8,904Reductions as a result of tax positions taken during a prior period . . . . . . . . . . . . . . . . . . . (71)
Additions as a result of tax positions taken during the current period . . . . . . . . . . . . . . . . . 1,391
Reductions relating to settlements with taxing authorities . . . . . . . . . . . . . . . . . . . . . . . . . (2,767)
Reductions as a result of a lapse of the applicable statute of limitations . . . . . . . . . . . . . . . —
Balance at December 31, 2008 . . . . . . . . . . . . . . . . . . . . . . . . . . . . . . . . . . . . . . . . . . . . . $45,262
Included in the balance of unrecognized benefits at December 31, 2008, are $38 million of tax benefits that, ifrecognized in future periods, would impact the Company’s effective tax rate. Also included in the balance ofunrecognized tax benefits at December 31, 2008 are $7 million of tax benefits that, if recognized, would result in adecrease to goodwill in purchase business combinations.
To the extent penalties and interest would be assessed on any underpayment of income tax, such amounts havebeen accrued and classified as a component of income tax expense in the financial statements. This is an accountingpolicy election made by the Company that is a continuation of the Company’s historical policy and will continue tobe consistently applied in the future. The Company recognized $2 million of expense relating to interest for theperiod ended December 31, 2008. The Company’s expense recognized relating to penalties for the period endedDecember 31, 2008 was immaterial. As of December 31, 2008, the Company has accrued $11 million of interest and$3 million of penalties related to unrecognized tax benefits.
The Company is subject to income tax in many of the approximately 100 countries where it operates includingmajor operations in the United States, the United Kingdom, and Canada. Many of the Company’s subsidiaries areopen to examination in the United Kingdom and Canada dating from 1997 and 1998, respectively throughDecember 31, 2008. The Company is open to examination in the United States for tax years ended December 31,2004 through December 31, 2007.
The Company does not anticipate a significant change in the balance of unrecognized tax benefits within thenext 12 months.
71
WEATHERFORD INTERNATIONAL, LTD. AND SUBSIDIARIES
NOTES TO CONSOLIDATED FINANCIAL STATEMENTS — (Continued)
%%TRANSMSG*** Transmitting Job: H65817 PCN: 072000000 ***%%PCMSG|71 |00008|Yes|No|02/24/2009 04:12|0|0|Page is valid, no graphics -- Color: N|

16. Disputes, Litigation and Contingencies
U.S. Government and Internal Investigations
We are currently involved in government and internal investigations involving various of our operations. Weparticipated in the United Nations oil-for-food program governing sales of goods and services into Iraq. The SEChas subpoenaed certain documents in connection with an investigation into our participation in the oil-for-foodprogram. The U.S. Department of Justice is also conducting an investigation of our participation in the oil-for-foodprogram. We are cooperating fully with these investigations. We have retained legal counsel, reporting to our auditcommittee, to investigate this matter. These investigations are ongoing, and we cannot anticipate the timing,outcome or possible impact of these investigations, financial or otherwise.
The U.S. Department of Commerce, Bureau of Industry & Security and the U.S. Department of Justice areinvestigating allegations of improper sales of products and services by us and our subsidiaries in sanctionedcountries. We are cooperating fully with this investigation. We have retained legal counsel, reporting to our auditcommittee, to investigate this matter. This investigation is ongoing, and we cannot anticipate the timing, outcome orpossible impact of the investigation, financial or otherwise.
In light of this investigation and of the current U.S. and foreign policy environment and the inherentuncertainties surrounding these countries, we decided in September 2007 to direct our foreign subsidiaries todiscontinue doing business in countries that are subject to U.S. economic and trade sanctions, including Cuba, Iran,Sudan and Syria. Effective September 2007, we ceased entering into any new contracts relating to these countriesand began an orderly discontinuation and winding down of our existing business in these sanctioned countries.Effective March 31, 2008, we completed our withdrawal from these countries.
With the assistance of outside counsel and in connection with U.S. government investigations and subpoenas,we are conducting investigations regarding the embezzlement of approximately $175,000 at a European subsidiaryand the possible improper use of these funds, including possible payments to government officials in Europe, duringthe period from 2000 to 2004, and the Company’s compliance with the Foreign Corrupt Practices Act and other lawsworldwide. As part of these investigations, we have also uncovered potential violations of U.S. law in connectionwith a joint venture in Angola. These investigations are ongoing, and we cannot anticipate the timing, outcome orpossible impact, if any, of the investigations, financial or otherwise. We have informed the SEC and the DOJ ofthese investigations, and the results of the investigations are being provided to the SEC and DOJ.
The DOJ, the SEC and other agencies and authorities have a broad range of civil and criminal penalties theymay seek to impose against corporations and individuals for violations of trading sanctions laws, the ForeignCorrupt Practices Act and other federal statutes including, but not limited to, injunctive relief, disgorgement, fines,penalties and modifications to business practices and compliance programs. In recent years, these agencies andauthorities have entered into agreements with, and obtained a range of penalties against, several public corporationsand individuals in similar investigations, under which civil and criminal penalties were imposed, including in somecases fines and other penalties and sanctions in the tens and hundreds of millions of dollars. Under trading sanctionslaws, the DOJ may also seek to impose modifications to business practices, including immediate cessation of allbusiness activities in specific countries or other limitations that decrease our business, and modifications tocompliance programs, which may increase compliance costs. In addition, our activities in sanctioned countries,such as Sudan and Iran, could result in certain investors, such as government sponsored pension funds, divesting ornot investing in our common shares. Based on available information, we cannot predict what, if any, actions theDOJ, SEC or other authorities may take in our situation or the effect any such actions may have on our consolidatedfinancial position or results of operations. To the extent we violated U.S. export regulations, fines and otherpenalties may be imposed. Because these matters are now pending before the indicated agencies, there can be noassurance that actual fines or penalties, if any, will not have a material adverse affect on our business, financialcondition, liquidity or results of operations.
72
WEATHERFORD INTERNATIONAL, LTD. AND SUBSIDIARIES
NOTES TO CONSOLIDATED FINANCIAL STATEMENTS — (Continued)
%%TRANSMSG*** Transmitting Job: H65817 PCN: 073000000 ***%%PCMSG|72 |00009|Yes|No|02/24/2009 12:28|0|0|Page is valid, no graphics -- Color: N|
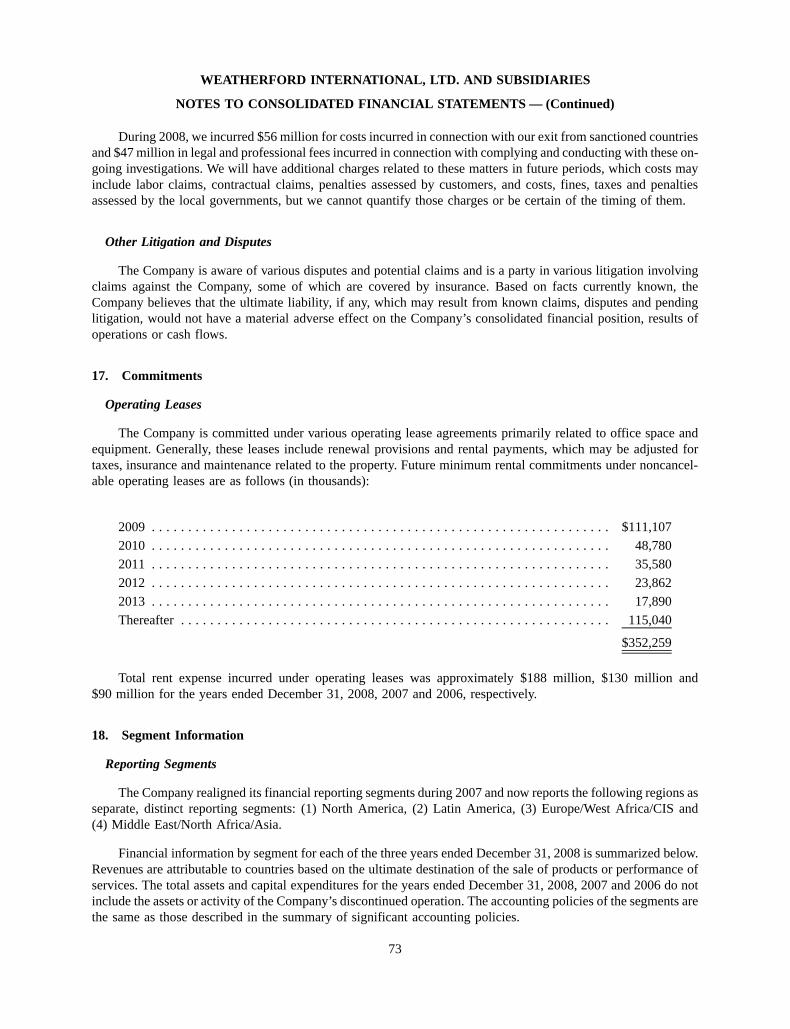
During 2008, we incurred $56 million for costs incurred in connection with our exit from sanctioned countriesand $47 million in legal and professional fees incurred in connection with complying and conducting with these on-going investigations. We will have additional charges related to these matters in future periods, which costs mayinclude labor claims, contractual claims, penalties assessed by customers, and costs, fines, taxes and penaltiesassessed by the local governments, but we cannot quantify those charges or be certain of the timing of them.
Other Litigation and Disputes
The Company is aware of various disputes and potential claims and is a party in various litigation involvingclaims against the Company, some of which are covered by insurance. Based on facts currently known, theCompany believes that the ultimate liability, if any, which may result from known claims, disputes and pendinglitigation, would not have a material adverse effect on the Company’s consolidated financial position, results ofoperations or cash flows.
17. Commitments
Operating Leases
The Company is committed under various operating lease agreements primarily related to office space andequipment. Generally, these leases include renewal provisions and rental payments, which may be adjusted fortaxes, insurance and maintenance related to the property. Future minimum rental commitments under noncancel-able operating leases are as follows (in thousands):
2009 . . . . . . . . . . . . . . . . . . . . . . . . . . . . . . . . . . . . . . . . . . . . . . . . . . . . . . . . . . . . . . . $111,107
2010 . . . . . . . . . . . . . . . . . . . . . . . . . . . . . . . . . . . . . . . . . . . . . . . . . . . . . . . . . . . . . . . 48,780
2011 . . . . . . . . . . . . . . . . . . . . . . . . . . . . . . . . . . . . . . . . . . . . . . . . . . . . . . . . . . . . . . . 35,580
2012 . . . . . . . . . . . . . . . . . . . . . . . . . . . . . . . . . . . . . . . . . . . . . . . . . . . . . . . . . . . . . . . 23,862
2013 . . . . . . . . . . . . . . . . . . . . . . . . . . . . . . . . . . . . . . . . . . . . . . . . . . . . . . . . . . . . . . . 17,890
Thereafter . . . . . . . . . . . . . . . . . . . . . . . . . . . . . . . . . . . . . . . . . . . . . . . . . . . . . . . . . . . 115,040
$352,259
Total rent expense incurred under operating leases was approximately $188 million, $130 million and$90 million for the years ended December 31, 2008, 2007 and 2006, respectively.
18. Segment Information
Reporting Segments
The Company realigned its financial reporting segments during 2007 and now reports the following regions asseparate, distinct reporting segments: (1) North America, (2) Latin America, (3) Europe/West Africa/CIS and(4) Middle East/North Africa/Asia.
Financial information by segment for each of the three years ended December 31, 2008 is summarized below.Revenues are attributable to countries based on the ultimate destination of the sale of products or performance ofservices. The total assets and capital expenditures for the years ended December 31, 2008, 2007 and 2006 do notinclude the assets or activity of the Company’s discontinued operation. The accounting policies of the segments arethe same as those described in the summary of significant accounting policies.
73
WEATHERFORD INTERNATIONAL, LTD. AND SUBSIDIARIES
NOTES TO CONSOLIDATED FINANCIAL STATEMENTS — (Continued)
%%TRANSMSG*** Transmitting Job: H65817 PCN: 074000000 ***%%PCMSG|73 |00009|Yes|No|02/24/2009 06:31|0|0|Page is valid, no graphics -- Color: N|

NetOperatingRevenues
Incomefrom
Operations
Depreciationand
AmortizationCapital
Expenditures
Total Assets atDecember 31,
2008
Year Ended December 31, 2008
(In thousands)
North America . . . . . . . . . . . . . . . . . $4,460,147 $1,125,199 $310,054 $ 602,876 $ 6,541,697Middle East/North Africa/Asia . . . . . 2,391,520 561,012 196,443 1,123,751 4,320,875Europe/West Africa/CIS . . . . . . . . . . 1,539,190 382,772 119,957 393,532 2,641,687Latin America . . . . . . . . . . . . . . . . . 1,209,707 277,094 93,942 312,382 2,010,313
9,600,564 2,346,077 720,396 2,432,541 15,514,572Corporate and Research and
Development . . . . . . . . . . . . . . . . — (327,671) 11,412 51,622 961,941Other(a) . . . . . . . . . . . . . . . . . . . . . . — (39,857) — — —
Total . . . . . . . . . . . . . . . . . . . . . . . . $9,600,564 $1,978,549 $731,808 $2,484,163 $16,476,513
NetOperatingRevenues
Incomefrom
Operations
Depreciationand
AmortizationCapital
Expenditures
Total Assets atDecember 31,
2007
Year Ended December 31, 2007
(In thousands)
North America . . . . . . . . . . . . . . . . . $3,937,456 $1,013,088 $277,222 $ 722,277 $ 6,265,186Middle East/North Africa/Asia . . . . . 1,823,769 416,263 158,321 446,215 3,027,456Europe/West Africa/CIS . . . . . . . . . . 1,188,519 293,846 86,768 230,990 2,005,391Latin America . . . . . . . . . . . . . . . . . 882,318 203,211 74,089 198,321 1,209,846
7,832,062 1,926,408 596,400 1,597,803 12,507,879Corporate and Research and
Development . . . . . . . . . . . . . . . . — (271,285) 9,826 37,238 656,876Other(b) . . . . . . . . . . . . . . . . . . . . . . — (30,787) — — —
Total . . . . . . . . . . . . . . . . . . . . . . . . $7,832,062 $1,624,336 $606,226 $1,635,041 $13,164,755
NetOperatingRevenues
Incomefrom
Operations
Depreciationand
AmortizationCapital
Expenditures
Total Assets atDecember 31,
2006
Year Ended December 31, 2006
(In thousands)
North America . . . . . . . . . . . . . . . . . $3,672,630 $1,040,647 $223,895 $ 525,248 $ 5,290,389Middle East/North Africa/Asia . . . . . 1,352,758 279,953 117,599 304,553 2,330,911Europe/West Africa/CIS . . . . . . . . . . 827,343 171,798 65,540 102,259 1,272,906Latin America . . . . . . . . . . . . . . . . . 726,197 133,027 64,864 85,393 959,141
6,578,928 1,625,425 471,898 1,017,453 9,853,347Corporate and Research and
Development . . . . . . . . . . . . . . . . — (244,535) 11,050 33,647 252,408Other(c) . . . . . . . . . . . . . . . . . . . . . . — (26,203) — — —
Total . . . . . . . . . . . . . . . . . . . . . . . . $6,578,928 $1,354,687 $482,948 $1,051,100 $10,105,755
(a) The year ended December 31, 2008 is comprised of $56 million for costs incurred in connection with theCompany’s withdrawal from sanctioned countries, $47 million in legal and professional fees incurred inconnection with the Company’s on-going investigations by the U.S. government and $18 million for severance
74
WEATHERFORD INTERNATIONAL, LTD. AND SUBSIDIARIES
NOTES TO CONSOLIDATED FINANCIAL STATEMENTS — (Continued)
%%TRANSMSG*** Transmitting Job: H65817 PCN: 075000000 ***%%PCMSG|74 |00010|Yes|No|02/24/2009 06:32|0|0|Page is valid, no graphics -- Color: N|
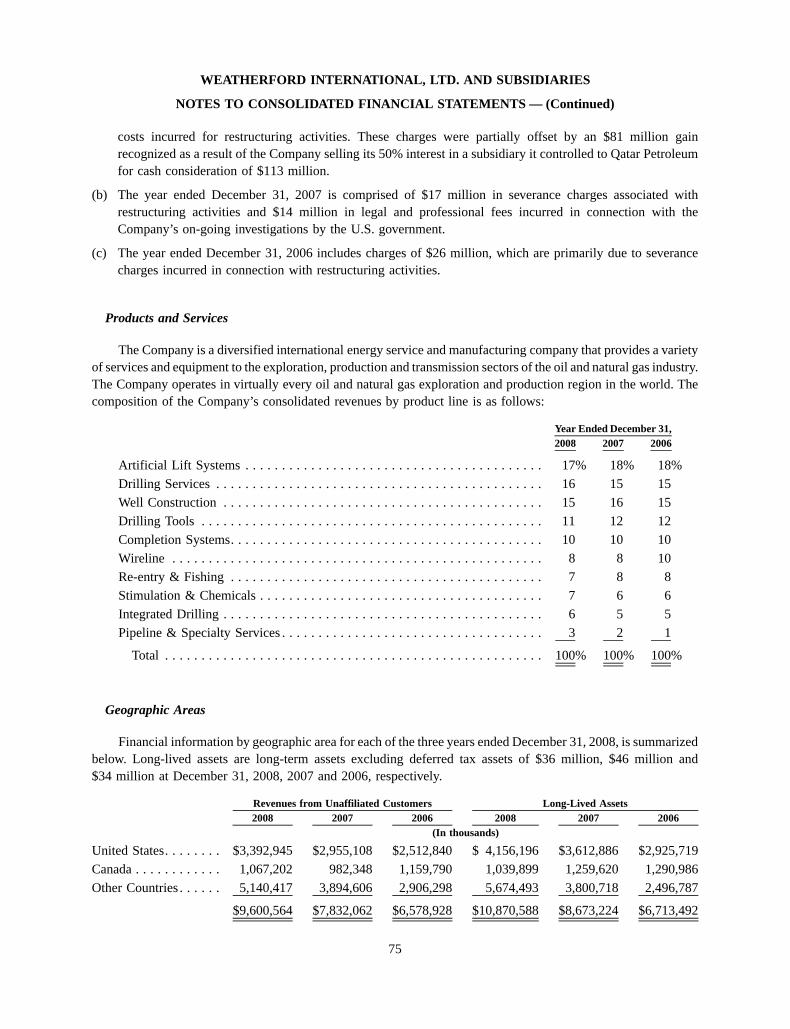
costs incurred for restructuring activities. These charges were partially offset by an $81 million gainrecognized as a result of the Company selling its 50% interest in a subsidiary it controlled to Qatar Petroleumfor cash consideration of $113 million.
(b) The year ended December 31, 2007 is comprised of $17 million in severance charges associated withrestructuring activities and $14 million in legal and professional fees incurred in connection with theCompany’s on-going investigations by the U.S. government.
(c) The year ended December 31, 2006 includes charges of $26 million, which are primarily due to severancecharges incurred in connection with restructuring activities.
Products and Services
The Company is a diversified international energy service and manufacturing company that provides a varietyof services and equipment to the exploration, production and transmission sectors of the oil and natural gas industry.The Company operates in virtually every oil and natural gas exploration and production region in the world. Thecomposition of the Company’s consolidated revenues by product line is as follows:
2008 2007 2006Year Ended December 31,
Artificial Lift Systems . . . . . . . . . . . . . . . . . . . . . . . . . . . . . . . . . . . . . . . . . 17% 18% 18%
Drilling Services . . . . . . . . . . . . . . . . . . . . . . . . . . . . . . . . . . . . . . . . . . . . . 16 15 15
Well Construction . . . . . . . . . . . . . . . . . . . . . . . . . . . . . . . . . . . . . . . . . . . . 15 16 15
Drilling Tools . . . . . . . . . . . . . . . . . . . . . . . . . . . . . . . . . . . . . . . . . . . . . . . 11 12 12
Completion Systems. . . . . . . . . . . . . . . . . . . . . . . . . . . . . . . . . . . . . . . . . . . 10 10 10
Wireline . . . . . . . . . . . . . . . . . . . . . . . . . . . . . . . . . . . . . . . . . . . . . . . . . . . 8 8 10Re-entry & Fishing . . . . . . . . . . . . . . . . . . . . . . . . . . . . . . . . . . . . . . . . . . . 7 8 8
Stimulation & Chemicals . . . . . . . . . . . . . . . . . . . . . . . . . . . . . . . . . . . . . . . 7 6 6
Integrated Drilling . . . . . . . . . . . . . . . . . . . . . . . . . . . . . . . . . . . . . . . . . . . . 6 5 5
Pipeline & Specialty Services . . . . . . . . . . . . . . . . . . . . . . . . . . . . . . . . . . . . 3 2 1
Total . . . . . . . . . . . . . . . . . . . . . . . . . . . . . . . . . . . . . . . . . . . . . . . . . . . . 100% 100% 100%
Geographic Areas
Financial information by geographic area for each of the three years ended December 31, 2008, is summarizedbelow. Long-lived assets are long-term assets excluding deferred tax assets of $36 million, $46 million and$34 million at December 31, 2008, 2007 and 2006, respectively.
2008 2007 2006 2008 2007 2006Revenues from Unaffiliated Customers Long-Lived Assets
(In thousands)
United States. . . . . . . . $3,392,945 $2,955,108 $2,512,840 $ 4,156,196 $3,612,886 $2,925,719
Canada . . . . . . . . . . . . 1,067,202 982,348 1,159,790 1,039,899 1,259,620 1,290,986
Other Countries . . . . . . 5,140,417 3,894,606 2,906,298 5,674,493 3,800,718 2,496,787
$9,600,564 $7,832,062 $6,578,928 $10,870,588 $8,673,224 $6,713,492
75
WEATHERFORD INTERNATIONAL, LTD. AND SUBSIDIARIES
NOTES TO CONSOLIDATED FINANCIAL STATEMENTS — (Continued)
%%TRANSMSG*** Transmitting Job: H65817 PCN: 076000000 ***%%PCMSG|75 |00010|Yes|No|02/24/2009 12:50|0|0|Page is valid, no graphics -- Color: N|

19. Quarterly Financial Data (Unaudited)
First Second Third Fourth TotalQuarter
(In thousands, except per share amounts)
2008Revenues . . . . . . . . . . . . . . . . . . . . . . $2,195,892 $2,229,250 $2,540,796 $2,634,626 $9,600,564
Gross Profit . . . . . . . . . . . . . . . . . . . . 746,214 775,096 899,873 936,923 3,358,106
Income from Continuing Operations . . 284,069 364,044 370,600 348,118 1,366,831
Gain (Loss) from DiscontinuedOperation, Net of Tax . . . . . . . . . . . (19,868) 6,940 — — (12,928)
Net Income. . . . . . . . . . . . . . . . . . . . . 264,201 370,984 370,600 348,118 1,353,903
Basic Earnings Per Share:
Continuing Operations . . . . . . . . . . . $ 0.42 $ 0.53 $ 0.54 $ 0.51 $ 2.00
Discontinued Operation . . . . . . . . . . (0.03) 0.01 — — (0.02)
Net Income . . . . . . . . . . . . . . . . . . . $ 0.39 $ 0.54 $ 0.54 $ 0.51 $ 1.98
Diluted Earnings Per Share:
Continuing Operations . . . . . . . . . . . $ 0.41 $ 0.52 $ 0.53 $ 0.50 $ 1.96
Discontinued Operation . . . . . . . . . . (0.03) 0.01 — — (0.02)
Net Income . . . . . . . . . . . . . . . . . . . $ 0.38 $ 0.53 $ 0.53 $ 0.50 $ 1.94
2007Revenues . . . . . . . . . . . . . . . . . . . . . . $1,852,285 $1,815,945 $1,971,991 $2,191,841 $7,832,062
Gross Profit . . . . . . . . . . . . . . . . . . . . 687,929 623,477 698,744 764,302 2,774,452
Income from Continuing Operations . . 283,819 176,480 294,924 336,752 1,091,975
Loss from Discontinued Operation,Net of Tax . . . . . . . . . . . . . . . . . . . (2,247) (11,170) (2,211) (5,741) (21,369)
Net Income. . . . . . . . . . . . . . . . . . . . . 281,572 165,310 292,713 331,011 1,070,606Basic Earnings Per Share:
Continuing Operations . . . . . . . . . . . $ 0.42 $ 0.26 $ 0.44 $ 0.50 $ 1.61
Discontinued Operation . . . . . . . . . . — (0.02) ( 0.01) (0.01) (0.03)
Net Income . . . . . . . . . . . . . . . . . . . $ 0.42 $ 0.24 $ 0.43 $ 0.49 $ 1.58
Diluted Earnings Per Share:Continuing Operations . . . . . . . . . . . $ 0.41 $ 0.25 $ 0.42 $ 0.48 $ 1.57
Discontinued Operation . . . . . . . . . . — (0.01) — (0.01) ( 0.03)
Net Income . . . . . . . . . . . . . . . . . . . $ 0.41 $ 0.24 $ 0.42 $ 0.47 $ 1.54
20. Subsequent Events
In January 2009, the Company completed a $1.25 billion long-term debt offering comprised of (i) $1 billion of9.625% Senior Notes due in 2019 (“9.625% Senior Notes”) and (ii) $250 million of 9.875% Senior Notes due in2039 (“9.875% Senior Notes”). Net proceeds of $1.23 billion were used to repay short-term borrowings withmaturities of less than one month and for general corporate purposes. Interest on these notes is due semi-annually onMarch 1 and September 1 of each year.
76
WEATHERFORD INTERNATIONAL, LTD. AND SUBSIDIARIES
NOTES TO CONSOLIDATED FINANCIAL STATEMENTS — (Continued)
%%TRANSMSG*** Transmitting Job: H65817 PCN: 077000000 ***%%PCMSG|76 |00008|Yes|No|02/24/2009 12:31|0|0|Page is valid, no graphics -- Color: N|
The Company anticipates that, during the first quarter of 2009, it will complete a transaction in whichWeatherford Limited will become a wholly-owned subsidiary of Weatherford International Ltd., a Swiss joint-stockcompany (“Weatherford-Switzerland”), and holders of its common shares will receive one registered share ofWeatherford Switzerland for each common share of Weatherford Limited that they hold.
21. Consolidating Financial Statements
The following obligations of Weatherford International, Inc. (“Issuer”) were guaranteed by WeatherfordInternational Ltd. (“Parent”) as of December 31, 2008 and 2007: (i) the 6.625% Senior Notes, (ii) the 5.95% SeniorNotes, (iii) the 6.35% Senior Notes and (iv) the 6.80% Senior Notes.
The following obligations of the Parent were guaranteed by the Issuer at December 31, 2008: (i) the revolvingcredit facilities, (ii) the 4.95% Senior Notes, (iii) the 5.50% Senior Notes, (iv) the 6.50% Senior Notes, (v) the5.15% Senior Notes, (vi) the 6.00% Senior Notes, (vii) the 7.00% Senior Notes and (viii) issuances of notes underthe commercial paper program.
As a result of these guarantee arrangements, the Company is required to present the following condensedconsolidating financial information. The accompanying guarantor financial information is presented on the equitymethod of accounting for all periods presented. Under this method, investments in subsidiaries are recorded at costand adjusted for the Company’s share in the subsidiaries’ cumulative results of operations, capital contributions anddistributions and other changes in equity. Elimination entries relate primarily to the elimination of investments insubsidiaries and associated intercompany balances and transactions. Certain prior year amounts have beenreclassified to conform to the current year presentation.
77
WEATHERFORD INTERNATIONAL, LTD. AND SUBSIDIARIES
NOTES TO CONSOLIDATED FINANCIAL STATEMENTS — (Continued)
%%TRANSMSG*** Transmitting Job: H65817 PCN: 078000000 ***%%PCMSG|77 |00008|Yes|No|02/24/2009 04:12|0|0|Page is valid, no graphics -- Color: N|

Condensed Consolidating Balance SheetDecember 31, 2008
(In thousands)
Parent IssuerOther
Subsidiaries Eliminations Consolidation
ASSETSCurrent Assets:
Cash and Cash Equivalents . . . $ 24 $ 50 $ 238,324 $ — $ 238,398
Other Current Assets. . . . . . . . 11,547 90,626 5,229,711 — 5,331,884
11,571 90,676 5,468,035 — 5,570,282
Equity Investments inAffiliates . . . . . . . . . . . . . . . . 14,335,661 6,231,144 12,611,943 (33,178,748) —
Shares Held in Parent . . . . . . . . . — 133,519 625,958 (759,477) —
Intercompany Receivables, Net . . 1,289,507 906,534 — (2,196,041) —
Other Assets. . . . . . . . . . . . . . . . 59,325 184,869 10,662,037 — 10,906,231
$15,696,064 $7,546,742 $29,367,973 $(36,134,266) $16,476,513
LIABILITIES AND SHAREHOLDERS’ EQUITYCurrent Liabilities:
Short-term Borrowings andCurrent Portion of Long-term Debt . . . . . . . . . . . . . . $ 781,443 $ 1,758 $ 472,746 $ — $ 1,255,947
Accounts Payable and OtherCurrent Liabilities . . . . . . . . 59,534 39,764 1,666,848 — 1,766,146
840,977 41,522 2,139,594 — 3,022,093
Long-term Debt . . . . . . . . . . . . . 2,701,747 1,849,428 13,080 — 4,564,255
Intercompany Payables, Net . . . . — — 2,196,041 (2,196,041) —Other Long-term Liabilities . . . . 110,627 2,502 410,987 — 524,116
3,653,351 1,893,452 4,759,702 (2,196,041) 8,110,464
Minority Interest in ConsolidatedSubsidiaries . . . . . . . . . . . . . . — — 80,401 — 80,401
Shareholders’ Equity . . . . . . . . . 12,042,713 5,653,290 24,527,870 (33,938,225) 8,285,648
$15,696,064 $7,546,742 $29,367,973 $(36,134,266) $16,476,513
78
WEATHERFORD INTERNATIONAL, LTD. AND SUBSIDIARIES
NOTES TO CONSOLIDATED FINANCIAL STATEMENTS — (Continued)
%%TRANSMSG*** Transmitting Job: H65817 PCN: 079000000 ***%%PCMSG|78 |00011|Yes|No|02/24/2009 17:03|0|0|Page is valid, no graphics -- Color: N|

Condensed Consolidating Balance SheetDecember 31, 2007
(In thousands)
Parent IssuerOther
Subsidiaries Eliminations Consolidation
ASSETSCurrent Assets:
Cash and Cash Equivalents . . . $ 228 $ 1,489 $ 168,997 $ — $ 170,714
Other Current Assets. . . . . . . . 13,591 2,537 4,284,927 — 4,301,055
13,819 4,026 4,453,924 — 4,471,769
Equity Investments inAffiliates . . . . . . . . . . . . . . . . 12,008,907 4,696,938 13,600,365 (30,306,210) —
Shares Held in Parent . . . . . . . . . — 129,428 794,774 (924,202) —
Intercompany Receivables, Net . . (127,594) 1,233,846 — (1,106,252) —
Other Assets. . . . . . . . . . . . . . . . 52,031 34,186 8,632,971 — 8,719,188
$11,947,163 $6,098,424 $27,482,034 $(32,336,664) $13,190,957
LIABILITIES AND SHAREHOLDERS’ EQUITYCurrent Liabilities:
Short-term Borrowings andCurrent Portion of Long-term Debt . . . . . . . . . . . . . . $ 582,389 $ 24,854 $ 166,977 $ — $ 774,220
Accounts Payable and OtherCurrent Liabilities . . . . . . . . 47,574 7,959 1,372,612 — 1,428,145
629,963 32,813 1,539,589 — 2,202,365
Long-term Debt . . . . . . . . . . . . . 1,198,418 1,850,594 17,323 — 3,066,335
Intercompany Payables, Net . . . . — — 1,106,252 (1,106,252) —Other Long-term Liabilities . . . . 91,392 22,556 368,263 — 482,211
1,919,773 1,905,963 3,031,427 (1,106,252) 5,750,911
Minority Interest In ConsolidatedSubsidiaries . . . . . . . . . . . . . . — — 33,327 — 33,327
Shareholders’ Equity . . . . . . . . . 10,027,390 4,192,461 24,417,280 (31,230,412) 7,406,719
$11,947,163 $6,098,424 $27,482,034 $(32,336,664) $13,190,957
79
WEATHERFORD INTERNATIONAL, LTD. AND SUBSIDIARIES
NOTES TO CONSOLIDATED FINANCIAL STATEMENTS — (Continued)
%%TRANSMSG*** Transmitting Job: H65817 PCN: 080000000 ***%%PCMSG|79 |00011|Yes|No|02/24/2009 17:03|0|0|Page is valid, no graphics -- Color: N|
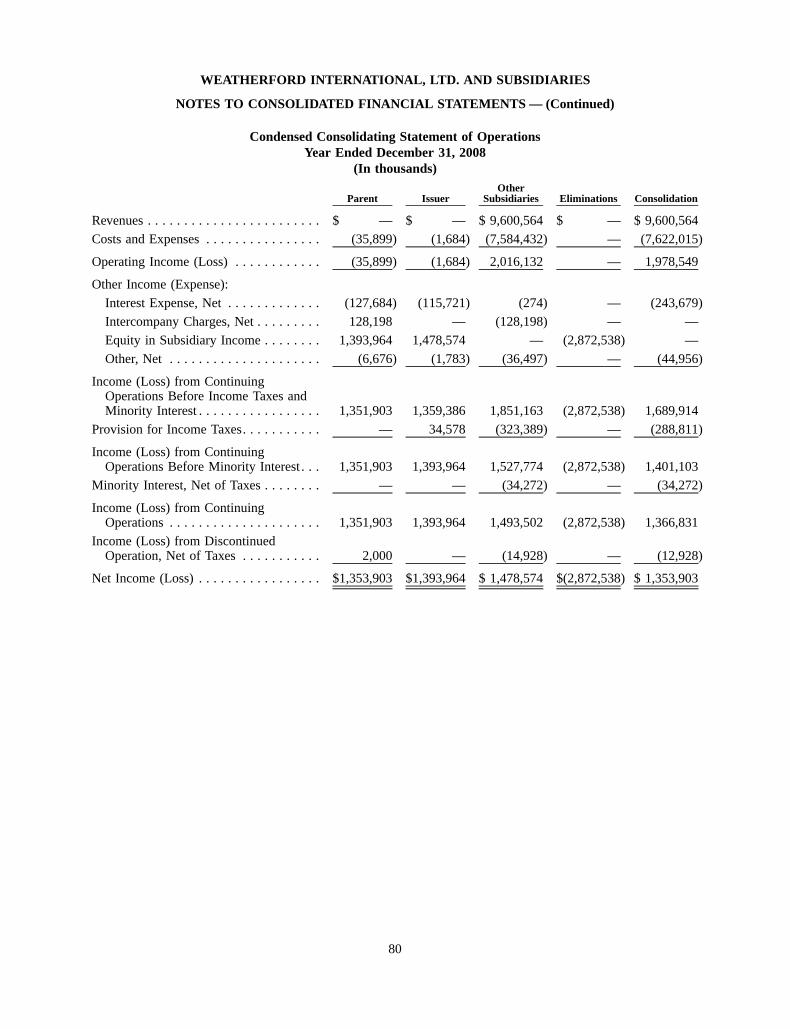
Condensed Consolidating Statement of OperationsYear Ended December 31, 2008
(In thousands)
Parent IssuerOther
Subsidiaries Eliminations Consolidation
Revenues . . . . . . . . . . . . . . . . . . . . . . . . $ — $ — $ 9,600,564 $ — $ 9,600,564
Costs and Expenses . . . . . . . . . . . . . . . . (35,899) (1,684) (7,584,432) — (7,622,015)
Operating Income (Loss) . . . . . . . . . . . . (35,899) (1,684) 2,016,132 — 1,978,549
Other Income (Expense):
Interest Expense, Net . . . . . . . . . . . . . (127,684) (115,721) (274) — (243,679)
Intercompany Charges, Net . . . . . . . . . 128,198 — (128,198) — —
Equity in Subsidiary Income . . . . . . . . 1,393,964 1,478,574 — (2,872,538) —
Other, Net . . . . . . . . . . . . . . . . . . . . . (6,676) (1,783) (36,497) — (44,956)
Income (Loss) from ContinuingOperations Before Income Taxes andMinority Interest . . . . . . . . . . . . . . . . . 1,351,903 1,359,386 1,851,163 (2,872,538) 1,689,914
Provision for Income Taxes. . . . . . . . . . . — 34,578 (323,389) — (288,811)
Income (Loss) from ContinuingOperations Before Minority Interest . . . 1,351,903 1,393,964 1,527,774 (2,872,538) 1,401,103
Minority Interest, Net of Taxes . . . . . . . . — — (34,272) — (34,272)
Income (Loss) from ContinuingOperations . . . . . . . . . . . . . . . . . . . . . 1,351,903 1,393,964 1,493,502 (2,872,538) 1,366,831
Income (Loss) from DiscontinuedOperation, Net of Taxes . . . . . . . . . . . 2,000 — (14,928) — (12,928)
Net Income (Loss) . . . . . . . . . . . . . . . . . $1,353,903 $1,393,964 $ 1,478,574 $(2,872,538) $ 1,353,903
80
WEATHERFORD INTERNATIONAL, LTD. AND SUBSIDIARIES
NOTES TO CONSOLIDATED FINANCIAL STATEMENTS — (Continued)
%%TRANSMSG*** Transmitting Job: H65817 PCN: 081000000 ***%%PCMSG|80 |00011|Yes|No|02/24/2009 17:04|0|0|Page is valid, no graphics -- Color: N|

Condensed Consolidating Statement of OperationsYear Ended December 31, 2007
(In thousands)
Parent IssuerOther
Subsidiaries Eliminations Consolidation
Revenues . . . . . . . . . . . . . . . . . . . . $ — $ — $ 7,832,062 $ — $ 7,832,062
Costs and Expenses . . . . . . . . . . . . . (15,400) (3,641) (6,188,685) — (6,207,726)
Operating Income (Loss) . . . . . . . . . (15,400) (3,641) 1,643,377 — 1,624,336
Other Income (Expense):
Interest Expense, Net . . . . . . . . . . (95,568) (73,428) (2,285) — (171,281)
Intercompany Charges, Net . . . . . (100,538) 206,371 (105,833) — —
Equity in Subsidiary Income . . . . 1,262,288 1,177,140 — (2,439,428) —
Other, Net . . . . . . . . . . . . . . . . . . 7,709 1,101 (17,379) — (8,569)
Income (Loss) from ContinuingOperations Before Income Taxesand Minority Interest . . . . . . . . . . 1,058,491 1,307,543 1,517,880 (2,439,428) 1,444,486
Provision for Income Taxes . . . . . . . — (45,255) (287,505) — (332,760)
Income (Loss) from ContinuingOperations Before MinorityInterest . . . . . . . . . . . . . . . . . . . . 1,058,491 1,262,288 1,230,375 (2,439,428) 1,111,726
Minority Interest, Net of Taxes . . . . — — (19,751) — (19,751)
Income (Loss) from ContinuingOperations . . . . . . . . . . . . . . . . . . 1,058,491 1,262,288 1,210,624 (2,439,428) 1,091,975
Loss from Discontinued Operation,Net of Taxes . . . . . . . . . . . . . . . . 12,115 — (33,484) — (21,369)
Net Income (Loss) . . . . . . . . . . . . . $1,070,606 $1,262,288 $ 1,177,140 $(2,439,428) $ 1,070,606
81
WEATHERFORD INTERNATIONAL, LTD. AND SUBSIDIARIES
NOTES TO CONSOLIDATED FINANCIAL STATEMENTS — (Continued)
%%TRANSMSG*** Transmitting Job: H65817 PCN: 082000000 ***%%PCMSG|81 |00010|Yes|No|02/24/2009 17:04|0|0|Page is valid, no graphics -- Color: N|

Condensed Consolidating Statement of OperationsYear Ended December 31, 2006
(In thousands)Parent Issuer Other Subsidiaries Eliminations Consolidation
Revenues . . . . . . . . . . . . . . . . . . . . . $ — $ — $ 6,578,928 $ — $ 6,578,928
Costs and Expenses . . . . . . . . . . . . . (16,872) (1,013) (5,206,356) — (5,224,241)
Operating Income (Loss) . . . . . . . . . (16,872) (1,013) 1,372,572 — 1,354,687
Other Income (Expense):
Interest Expense, Net . . . . . . . . . . (74,669) (26,337) (1,554) — (102,560)
Intercompany Charges, Net . . . . . . (42,732) 67,923 (25,191) — —
Equity in Subsidiary Income . . . . . 1,030,970 1,006,190 — (2,037,160) —
Other, Net . . . . . . . . . . . . . . . . . . (325) (864) (12,029) — (13,218)
Income (Loss) from ContinuingOperations Before Income Taxesand Minority Interest . . . . . . . . . . 896,372 1,045,899 1,333,798 (2,037,160) 1,238,909
Provision for Income Taxes. . . . . . . . (3) (14,929) (306,541) — (321,473)
Income (Loss) from ContinuingOperations Before MinorityInterest . . . . . . . . . . . . . . . . . . . . . 896,369 1,030,970 1,027,257 (2,037,160) 917,436
Minority Interest, Net of Taxes . . . . . — — (11,330) — (11,330)
Income (Loss) from ContinuingOperations . . . . . . . . . . . . . . . . . . 896,369 1,030,970 1,015,927 (2,037,160) 906,106
Loss from Discontinued Operation,Net of Taxes . . . . . . . . . . . . . . . . . — — (9,737) — (9,737)
Net Income (Loss) . . . . . . . . . . . . . . $ 896,369 $1,030,970 $ 1,006,190 $(2,037,160) $ 896,369
82
WEATHERFORD INTERNATIONAL, LTD. AND SUBSIDIARIES
NOTES TO CONSOLIDATED FINANCIAL STATEMENTS — (Continued)
%%TRANSMSG*** Transmitting Job: H65817 PCN: 083000000 ***%%PCMSG|82 |00012|Yes|No|02/24/2009 17:05|0|0|Page is valid, no graphics -- Color: N|

Condensed Consolidating Statement of Cash FlowsYear Ended December 31, 2008
(In thousands)
Parent IssuerOther
Subsidiaries Eliminations Consolidation
Cash Flows from Operating Activities:Net Income (Loss) . . . . . . . . . . . . . . . . . . . . . . . $ 1,353,903 $ 1,393,964 $ 1,478,574 $(2,872,538) $ 1,353,903Adjustments to Reconcile Net Income (Loss) to Net
Cash Provided (Used) by Operating Activities:Charges from Parent or Subsidiary . . . . . . . . . . (128,198) — 128,198 — —(Gain) Loss from Discontinued Operations . . . . . (2,000) — 14,928 — 12,928Equity in (Earnings) Loss of Affiliates . . . . . . . . (1,393,964) (1,478,574) — 2,872,538 —Deferred Income Tax Provision (Benefit) . . . . . . — (15,687) (25,755) — (41,442)Other Adjustments . . . . . . . . . . . . . . . . . . . . . (21,284) (120,321) (72,997) — (214,602)
Net Cash Provided (Used) by OperatingActivities — Continuing Operations . . . . . . (191,543) (220,618) 1,522,948 — 1,110,787
Net Cash Used by Operating Activities —Discontinued Operations . . . . . . . . . . . . . . — — (6,219) — (6,219)
Net Cash Provided (Used) by OperatingActivities . . . . . . . . . . . . . . . . . . . . . . . . (191,543) (220,618) 1,516,729 — 1,104,568
Cash Flows from Investing Activities:Acquisitions of Businesses, Net of Cash Acquired . . — — (798,530) — (798,530)Capital Expenditures for Property, Plant and
Equipment . . . . . . . . . . . . . . . . . . . . . . . . . . . — — (2,484,163) — (2,484,163)Acquisition of Intellectual Property. . . . . . . . . . . . — — (24,079) — (24,079)Purchase of Equity Investment in Unconsolidated
Affiliate . . . . . . . . . . . . . . . . . . . . . . . . . . . . — — (11,568) — (11,568)Proceeds from Sale of Assets and Businesses, Net. . — — 297,285 — 297,285Capital Contribution to Subsidiary . . . . . . . . . . . . (350,966) (5,050) — 356,016 —
Net Cash Provided (Used) by InvestingActivities — Continuing Operations . . . . . . (350,966) (5,050) (3,021,055) 356,016 (3,021,055)
Net Cash Provided by Investing Activities —Discontinued Operations . . . . . . . . . . . . . . 11,000 — — — 11,000
Net Cash Provided (Used) by InvestingActivities . . . . . . . . . . . . . . . . . . . . . . . . (339,966) (5,050) (3,021,055) 356,016 (3,010,055)
Cash Flows from Financing Activities:Borrowings of (Repayments on) Short-term Debt,
Net . . . . . . . . . . . . . . . . . . . . . . . . . . . . . . . 199,054 (23,096) 301,863 — 477,821Borrowings of (Repayments on) Long-term Debt,
Net . . . . . . . . . . . . . . . . . . . . . . . . . . . . . . . 1,483,931 (1,166) (4,432) — 1,478,333Proceeds from Exercise of Stock Options . . . . . . . — 9,942 — — 9,942Borrowings (Repayments) Between Subsidiaries,
Net . . . . . . . . . . . . . . . . . . . . . . . . . . . . . . . (1,151,147) 226,581 924,566 — —Proceeds from Capital Contribution . . . . . . . . . . . — — 356,016 (356,016) —Other, Net . . . . . . . . . . . . . . . . . . . . . . . . . . . . (533) 11,968 — — 11,435
Net Cash Provided (Used) by FinancingActivities — Continuing Operations . . . . . . 531,305 224,229 1,578,013 (356,016) 1,977,531
Net Cash Provided (Used) by FinancingActivities — Discontinued Operations . . . . . — — — — —
Net Cash Provided (Used) by FinancingActivities . . . . . . . . . . . . . . . . . . . . . . . . 531,305 224,229 1,578,013 (356,016) 1,977,531
Effect of Exchange Changes on Cash and CashEquivalents . . . . . . . . . . . . . . . . . . . . . . . . . . . . — — (4,360) — (4,360)
Net Decrease in Cash and Cash Equivalents . . . . . . . (204) (1,439) 69,327 — 67,684Cash and Cash Equivalents at Beginning of Year . . . . 228 1,489 168,997 — 170,714
Cash and Cash Equivalents at End of Year . . . . . . . . $ 24 $ 50 $ 238,324 $ — $ 238,398
83
WEATHERFORD INTERNATIONAL, LTD. AND SUBSIDIARIES
NOTES TO CONSOLIDATED FINANCIAL STATEMENTS — (Continued)
%%TRANSMSG*** Transmitting Job: H65817 PCN: 084000000 ***%%PCMSG|83 |00010|Yes|No|02/24/2009 17:06|0|0|Page is valid, no graphics -- Color: N|

Condensed Consolidating Statement of Cash FlowsYear Ended December 31, 2007
(In thousands)
Parent IssuerOther
Subsidiaries Eliminations Consolidation
Cash Flows from Operating Activities:Net Income (Loss) . . . . . . . . . . . . . . . . . . . . . . . . $ 1,070,606 $ 1,262,288 $ 1,177,140 $(2,439,428) $ 1,070,606Adjustments to Reconcile Net Income (Loss) to Net
Cash Provided (Used) by OperatingActivities:Charges from Parent or Subsidiary . . . . . . . . . . . . 100,538 (206,371) 105,833 — —(Income) Loss from Discontinued Operation . . . . . . (12,115) — 33,484 — 21,369Equity in (Earnings) Loss of Affiliates. . . . . . . . . . (1,262,288) (1,177,140) — 2,439,428 —Deferred Income Tax Provision (Benefit) . . . . . . . . — (16,788) 45,661 — 28,873Other Adjustments . . . . . . . . . . . . . . . . . . . . . . . 413,899 (115,003) (537,089) — (238,193)
Net Cash Provided (Used) by OperatingActivities — Continuing Operations . . . . . . . . 310,640 (253,014) 825,029 — 882,655
Net Cash Used by Operating Activities —Discontinued Operation . . . . . . . . . . . . . . . . — — (10,149) — (10,149)
Net Cash Provided (Used) by OperatingActivities . . . . . . . . . . . . . . . . . . . . . . . . . . 310,640 (253,014) 814,880 — 872,506
Cash Flows from Investing Activities:Acquisitions of Businesses, Net of Cash Acquired . . . — — (275,149) — (275,149)Purchase of Equity Investments in Unconsolidated
Affiliates . . . . . . . . . . . . . . . . . . . . . . . . . . . . . — — (335,220) — (335,220)Capital Expenditures for Property, Plant and
Equipment . . . . . . . . . . . . . . . . . . . . . . . . . . . . — — (1,635,041) — (1,635,041)Acquisition of Intellectual Property . . . . . . . . . . . . . — — (23,035) — (23,035)Proceeds from Sale of Assets and Businesses, Net . . . — — 84,476 — 84,476Capital Contribution to Subsidiary . . . . . . . . . . . . . . (736,748) (36,147) — 772,895 —Distribution of Earnings from Subsidiary . . . . . . . . . . — (1,486,365) 1,486,365 — —Other Investing Activities . . . . . . . . . . . . . . . . . . . . — — (38,500) — (38,500)
Net Cash Provided (Used) by InvestingActivities — Continuing Operations . . . . . . . . (736,748) (1,522,512) (736,104) 772,895 (2,222,469)
Net Cash Used by Investing Activities —Discontinued Operation . . . . . . . . . . . . . . . . — — (10,579) — (10,579)
Net Cash Provided (Used) by InvestingActivities . . . . . . . . . . . . . . . . . . . . . . . . . . (736,748) (1,522,512) (746,683) 772,895 (2,233,048)
Cash Flows from Financing Activities:Borrowings of (Repayments on) Short-term Debt, Net. . . (299,187) 16,361 400,691 — 117,865Borrowings of (Repayments on) Long-term Debt,
Net . . . . . . . . . . . . . . . . . . . . . . . . . . . . . . . . . — 1,485,497 (14,734) — 1,470,763Borrowings (Repayments) Between Subsidiaries,
Net . . . . . . . . . . . . . . . . . . . . . . . . . . . . . . . . . 725,488 213,695 (939,183) — —Purchase of Treasury Shares . . . . . . . . . . . . . . . . . . — — (246,190) — (246,190)Proceeds from Exercise of Stock Options . . . . . . . . . — 34,192 — — 34,192Proceeds from Capital Contribution . . . . . . . . . . . . . — — 772,895 (772,895) —Other, Net . . . . . . . . . . . . . . . . . . . . . . . . . . . . . . — 24,999 — — 24,999
Net Cash Provided (Used) by FinancingActivities — Continuing Operations . . . . . . . . 426,301 1,774,744 (26,521) (772,895) 1,401,629
Net Cash Provided by Financing Activities —Discontinued Operation . . . . . . . . . . . . . . . . — — — — —
Net Cash Provided (Used) by FinancingActivities . . . . . . . . . . . . . . . . . . . . . . . . . . 426,301 1,774,744 (26,521) (772,895) 1,401,629
Effect of Exchange Rate Changes on Cash and CashEquivalents . . . . . . . . . . . . . . . . . . . . . . . . . . . . . — — 3,340 — 3,340
Net Increase (Decrease) in Cash and Cash Equivalents . . 193 (782) 45,016 — 44,427Cash and Cash Equivalents at Beginning of Year . . . . . . 35 2,271 123,981 — 126,287
Cash and Cash Equivalents at End of Year . . . . . . . . . . $ 228 $ 1,489 $ 168,997 $ — $ 170,714
84
WEATHERFORD INTERNATIONAL, LTD. AND SUBSIDIARIES
NOTES TO CONSOLIDATED FINANCIAL STATEMENTS — (Continued)
%%TRANSMSG*** Transmitting Job: H65817 PCN: 085000000 ***%%PCMSG|84 |00010|Yes|No|02/24/2009 17:06|0|0|Page is valid, no graphics -- Color: N|
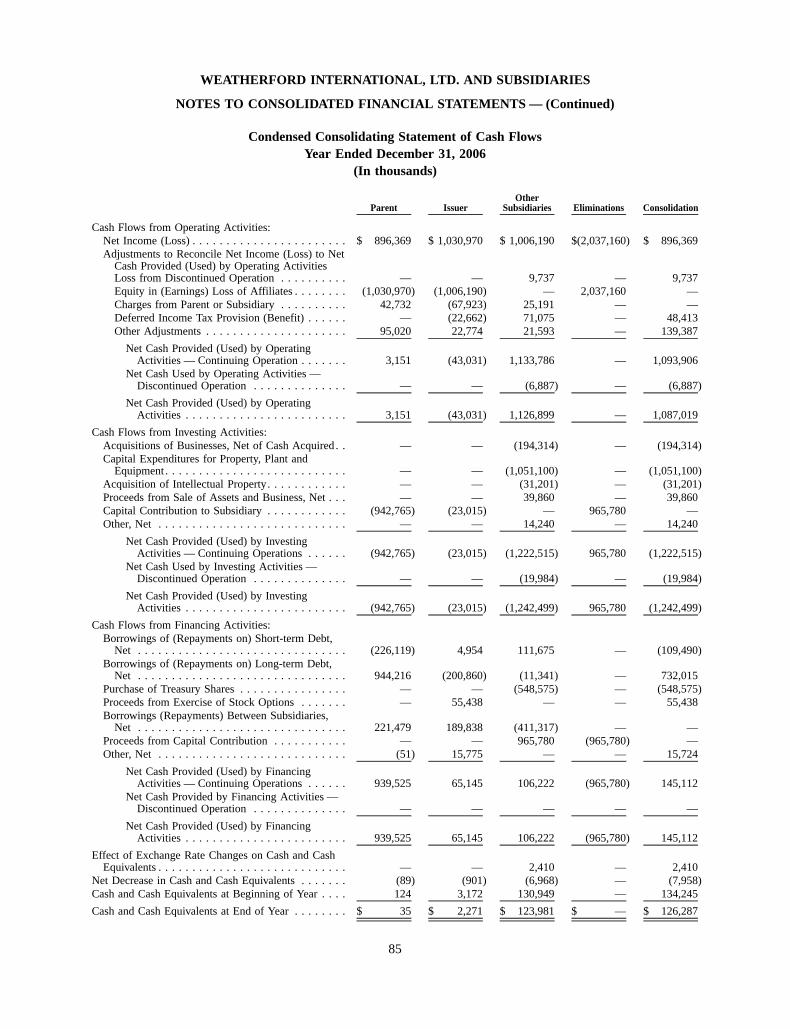
Condensed Consolidating Statement of Cash FlowsYear Ended December 31, 2006
(In thousands)
Parent IssuerOther
Subsidiaries Eliminations Consolidation
Cash Flows from Operating Activities:Net Income (Loss) . . . . . . . . . . . . . . . . . . . . . . . $ 896,369 $ 1,030,970 $ 1,006,190 $(2,037,160) $ 896,369Adjustments to Reconcile Net Income (Loss) to Net
Cash Provided (Used) by Operating ActivitiesLoss from Discontinued Operation . . . . . . . . . . — — 9,737 — 9,737Equity in (Earnings) Loss of Affiliates . . . . . . . . (1,030,970) (1,006,190) — 2,037,160 —Charges from Parent or Subsidiary . . . . . . . . . . 42,732 (67,923) 25,191 — —Deferred Income Tax Provision (Benefit) . . . . . . — (22,662) 71,075 — 48,413Other Adjustments . . . . . . . . . . . . . . . . . . . . . 95,020 22,774 21,593 — 139,387
Net Cash Provided (Used) by OperatingActivities — Continuing Operation . . . . . . . 3,151 (43,031) 1,133,786 — 1,093,906
Net Cash Used by Operating Activities —Discontinued Operation . . . . . . . . . . . . . . — — (6,887) — (6,887)
Net Cash Provided (Used) by OperatingActivities . . . . . . . . . . . . . . . . . . . . . . . . 3,151 (43,031) 1,126,899 — 1,087,019
Cash Flows from Investing Activities:Acquisitions of Businesses, Net of Cash Acquired . . — — (194,314) — (194,314)Capital Expenditures for Property, Plant and
Equipment . . . . . . . . . . . . . . . . . . . . . . . . . . . — — (1,051,100) — (1,051,100)Acquisition of Intellectual Property. . . . . . . . . . . . — — (31,201) — (31,201)Proceeds from Sale of Assets and Business, Net . . . — — 39,860 — 39,860Capital Contribution to Subsidiary . . . . . . . . . . . . (942,765) (23,015) — 965,780 —Other, Net . . . . . . . . . . . . . . . . . . . . . . . . . . . . — — 14,240 — 14,240
Net Cash Provided (Used) by InvestingActivities — Continuing Operations . . . . . . (942,765) (23,015) (1,222,515) 965,780 (1,222,515)
Net Cash Used by Investing Activities —Discontinued Operation . . . . . . . . . . . . . . — — (19,984) — (19,984)
Net Cash Provided (Used) by InvestingActivities . . . . . . . . . . . . . . . . . . . . . . . . (942,765) (23,015) (1,242,499) 965,780 (1,242,499)
Cash Flows from Financing Activities:Borrowings of (Repayments on) Short-term Debt,
Net . . . . . . . . . . . . . . . . . . . . . . . . . . . . . . . (226,119) 4,954 111,675 — (109,490)Borrowings of (Repayments on) Long-term Debt,
Net . . . . . . . . . . . . . . . . . . . . . . . . . . . . . . . 944,216 (200,860) (11,341) — 732,015Purchase of Treasury Shares . . . . . . . . . . . . . . . . — — (548,575) — (548,575)Proceeds from Exercise of Stock Options . . . . . . . — 55,438 — — 55,438Borrowings (Repayments) Between Subsidiaries,
Net . . . . . . . . . . . . . . . . . . . . . . . . . . . . . . . 221,479 189,838 (411,317) — —Proceeds from Capital Contribution . . . . . . . . . . . — — 965,780 (965,780) —Other, Net . . . . . . . . . . . . . . . . . . . . . . . . . . . . (51) 15,775 — — 15,724
Net Cash Provided (Used) by FinancingActivities — Continuing Operations . . . . . . 939,525 65,145 106,222 (965,780) 145,112
Net Cash Provided by Financing Activities —Discontinued Operation . . . . . . . . . . . . . . — — — — —
Net Cash Provided (Used) by FinancingActivities . . . . . . . . . . . . . . . . . . . . . . . . 939,525 65,145 106,222 (965,780) 145,112
Effect of Exchange Rate Changes on Cash and CashEquivalents . . . . . . . . . . . . . . . . . . . . . . . . . . . . — — 2,410 — 2,410
Net Decrease in Cash and Cash Equivalents . . . . . . . (89) (901) (6,968) — (7,958)Cash and Cash Equivalents at Beginning of Year . . . . 124 3,172 130,949 — 134,245
Cash and Cash Equivalents at End of Year . . . . . . . . $ 35 $ 2,271 $ 123,981 $ — $ 126,287
85
WEATHERFORD INTERNATIONAL, LTD. AND SUBSIDIARIES
NOTES TO CONSOLIDATED FINANCIAL STATEMENTS — (Continued)
%%TRANSMSG*** Transmitting Job: H65817 PCN: 086000000 ***%%PCMSG|85 |00010|Yes|No|02/24/2009 17:07|0|0|Page is valid, no graphics -- Color: N|

Item 9. Changes in and Disagreement with Accountants on Accounting and Financial Disclosure
None.
Item 9A. Controls and Procedures
Evaluation of disclosure controls and procedures.
At the end of the period covered by this Annual Report on Form 10-K, the Company carried out an evaluation,under the supervision and with the participation of management, including the Chief Executive Officer (“CEO”)and the Chief Financial Officer (“CFO”), of the effectiveness of the Company’s disclosure controls and procedures(as defined in Rules 13a-15 (e) and 15d-15 (e) under the Exchange Act). Based upon that evaluation, the Company’sCEO and CFO have concluded the Company’s disclosure controls and procedures are effective as of the end of theperiod covered by this report to ensure that information required to be disclosed by the Company in the reports itfiles or submits under the Exchange Act is recorded, processed, summarized and reported within the time periodsspecified in the Securities and Exchange Commission’s rules and forms and that information relating to theCompany (including its consolidated subsidiaries) required to be disclosed is accumulated and communicated tomanagement, including the CEO and CFO, to allow timely decisions regarding required disclosure.
Changes in internal controls.
The Company’s management, including the CEO and CFO, identified no change in the Company’s internalcontrol over financial reporting that occurred during the Company’s fiscal quarter ended December 31, 2008, thathas materially affected, or is reasonably likely to materially affect, the Company’s internal controls over financialreporting.
Internal controls over financial reporting.
Management’s report on our internal controls over financial reporting can be found in Item 8 of this report.
Item 9B. Other Information
None
PART III
Item 10. Directors, Executive Officers and Corporate Governance
Pursuant to General Instructions G(3), information on directors and executive officers of the Registrant will befiled in an amendment to this Annual Report on Form 10-K or incorporated by reference from the Company’sDefinitive Proxy Statement for the annual meeting to be held on May 7, 2009.
Our board of directors has adopted a code of ethics entitled “Code of Conduct,” which applies to all ouremployees, officers and directors and has also adopted a separate “Supplemental Code of Business Conduct” for oursenior officers. Copies of these codes can also be found at www.weatherford.com.
Item 11. Executive Compensation
Pursuant to General Instructions G(3), information on executive compensation will be filed in an amendmentto this Annual Report on Form 10-K or incorporated by reference from the Company’s Definitive Proxy Statementfor the annual meeting to be held on May 7, 2009.
Item 12(a). Security Ownership of Certain Beneficial Owners.
Pursuant to General Instructions G(3), information on security ownership of certain beneficial owners will befiled in an amendment to this Annual Report on Form 10-K or incorporated by reference from the Company’sDefinitive Proxy Statement for the annual meeting to be held on May 7, 2009.
86
%%TRANSMSG*** Transmitting Job: H65817 PCN: 087000000 ***%%PCMSG|86 |00010|Yes|No|02/24/2009 16:18|0|0|Page is valid, no graphics -- Color: N|

Item 12(b). Security Ownership of Management.
Pursuant to General Instructions G(3), information on security ownership of management will be filed in anamendment to this Annual Report on Form 10-K or incorporated by reference from the Company’s Definitive ProxyStatement for the annual meeting to be held on May 7, 2009.
Item 12(d). Securities Authorized for Issuance Under Equity Compensation Plans.
The following table provides information as of December 31, 2008 about the number of shares to be issuedupon vesting or exercise of equity awards including options, restricted shares, warrants and deferred stock units aswell as the number of shares remaining available for issuance under our equity compensation plans.
Number of Sharesto be Issued Upon
Exercise ofOutstanding
Options, Warrantsand Rights
Weighted AverageExercise Price of
OutstandingOptions, Warrants
and Rights
Number of SharesRemaining Availablefor Future Issuance
Under EquityCompensation Plans(Excluding SharesReflected in theFirst Column)
(In thousands, except share prices)
Plan Category:
Equity compensation plans approved byshareholders . . . . . . . . . . . . . . . . . . . 10,855 $29.43 8,462
Equity compensation plans notapproved by shareholders(a) . . . . . . . 29,837 11.82 —
Total . . . . . . . . . . . . . . . . . . . . . . . . . . 40,692 16.51 8,462
(a) The Weatherford International, Inc. 1998 Employee Stock Option Plan, as amended (the “Plan”), is admin-istered by the Compensation Committee of the Board of Directors. The Plan provides for the grant ofnonqualified options to purchase Common Shares of Weatherford International Ltd to all of our employees orits affiliates, as determined by the Compensation Committee. The price at which shares may be purchased isbased on the market price of the shares and cannot be less than the aggregate par value of the shares on the datethe option was granted. Unless otherwise provided in an option agreement, no option may be exercised afterone day less than 10 years from the date of vesting. Options generally become fully exercisable after three tofour years from the date of grant, subject to earlier vesting in the event of the death, disability or retirement ofthe employee or in the event of a change of control of the Company. The Plan provided for the grant of optionsto purchase up to 88,000,000 shares. As of December 31, 2008, there were options to purchase an aggregate of9,812,985 Common Shares outstanding under this Plan, all of which are vested. Subsequent to the shareholderapproval of the Company’s Omnibus Plan in May 2006, awards are no longer granted under the Plan.
On September 8, 1998, July 5, 2000, and September 26, 2001, we granted to each of our directors other thanMr. Duroc-Danner options to purchase 374,528, 240,000 and 240,000 Common Shares, respectively, at apurchase price per share equal to $2.90, $9.19 and $5.94, respectively, which was the fair market value of ourCommon Shares as of the day we granted the options. The options were issued under agreements between usand the directors. Each option is exercisable for a period of ten years from the date which it becomes fullyexercisable. The options granted on September 8, 1998 and July 5, 2000 became fully exercisable three yearsfrom the date of grant, and the options granted on September 26, 2001 became fully exercisable four years fromthe date of grant, in each case subject to earlier vesting in the event of the death, disability or retirement of theoptionee or warrantholder or a change of control of Weatherford. Under these agreements, there were optionsto purchase an aggregate of 3,105,984 Common Shares outstanding as of December 31, 2008, all of which arefully vested.
Under our Non-Employee Director Deferred Compensation Plan (the “DDC Plan”), each non-employeedirector may elect to defer up to 7.5% of any fees paid by the Company. The deferred fees are converted intonon-monetary units representing Common Shares that could have been purchased with the deferred fees basedon the market price of the Common Shares on the last day of the month in which fees were deferred. If a non-employee director elects to defer at least 5% of his fees, we will make an additional contribution to the
87
%%TRANSMSG*** Transmitting Job: H65817 PCN: 088000000 ***%%PCMSG|87 |00012|Yes|No|02/24/2009 16:19|0|0|Page is valid, no graphics -- Color: N|
director’s account equal to the sum of (1) 7.5% of the director’s fees plus (2) the amount of fees deferred by thedirector. The non-employee directors are fully vested at all times. Our directors may generally determine whendistributions will be made from the plan, but in any event all benefits under the DDC Plan will be distributed nolater than January 1, 2017. The amount of the distribution will be a number of Common Shares equal to thenumber of units at the time of distribution. Distributions are made in Common Shares. As of December 31,2008, there were 121,226 deferred units outstanding under this plan. Effective December 31, 2008, wesuspended the DDC Plan. While the plan is suspended, no new participants may join the plan and no furtherdeferrals of fees or matching contributions will be made under the plan unless and until our Board of Directorsdetermines otherwise.
We established our Foreign Executive Deferred Compensation Stock Ownership Plan for key foreignemployees. Under our Foreign Executive Deferred Compensation Stock Ownership Plan (“FEDC Plan”),we contribute 15% of each participant’s total salary, bonus and commission compensation each year. TheCompany’s contributions vest over a five-year period on the basis of 20% per year for each year of service.Under the FEDC Plan, our contributions are converted into non-monetary units equal to the number ofCommon Shares that could have been purchased with the amounts contributed based on the average closingprice of the Common Shares for each day of the month in which contributions are made. Distributions are madeunder the FEDC Plan after a participant retires, becomes disabled or dies or after his employment is terminated,but in any event all benefits under the FEDC Plan will be distributed no later than January 1, 2017.Distributions under the FEDC Plan are made in a number of Common Shares equal to the number of unitsallocated to the participant’s account at the time of distribution. As of December 31, 2008, there were 154,828deferred units outstanding under this plan.
On February 28, 2002, the Company issued to Shell Technology Ventures Inc. a warrant to purchase up to12,928,856 Common Shares at a price of $15.00 per share. The warrant has a nine-year exercisable lifebeginning one year after the issue date. The warrant holder may exercise the warrant and settlement may occurthrough physical delivery, net share settlement, net cash settlement or a combination thereof. The net cashsettlement option upon exercise is at our sole discretion.
In 2003, our Board of Directors approved a restricted share plan that allows for the grant of up to 15,340,000 ofour Common Shares to our key employees and directors. Restricted shares are subject to forfeiture restrictionsthat generally lapse after a specified period from the date of grant and are subject to earlier vesting in the eventof death, retirement or a change in control. As of December 31, 2008, there were 12,763,285 shares grantedunder this plan, of which 9,049,859 shares are vested. Subsequent to the shareholder approval of our OmnibusPlan in May 2006, awards are no longer made under this plan.
Item 13. Certain Relationships and Related Transactions, and Director Independence
Pursuant to General Instruction G(3), information on certain relationships and related transactions will be filedin an amendment to this Annual Report on Form 10-K or incorporated by reference from the Company’s DefinitiveProxy Statement for the annual meeting to be held on May 7, 2009.
Item 14. Principal Accountant Fees and Services
Pursuant to General Instruction G(3), information on principal accountant fees and services will be filed in anamendment to this Annual Report on Form 10-K or incorporated by reference from the Company’s Definitive ProxyStatement for the annual meeting to be held on May 7, 2009.
PART IV
Item 15. Exhibits, Financial Statement Schedules
(a) The following documents are filed as part of this report or incorporated by reference:
1. The consolidated financial statements of the Company listed on page 39 of this report.
2. The financial statement schedule on page 94 of this report.
88
%%TRANSMSG*** Transmitting Job: H65817 PCN: 089000000 ***%%PCMSG|88 |00011|Yes|No|02/24/2009 16:20|0|0|Page is valid, no graphics -- Color: N|

3. The exhibits of the Company listed below under Item 15(b).
(b) Exhibits:
ExhibitNumber Description
2.1 Stock Purchase Agreement dated June 6, 2005 by and between Precision Drilling Corporation andWeatherford International Ltd. (incorporated by reference to Exhibit 2.1 to Amendment No. 1 to theRegistrant’s Current Report on Form 8-K dated June 6, 2005 on Form 8-K/A (File No. 1-31339) filedJune 9, 2005).
2.2 Agreement and Plan of Merger dated May 8, 2002, among Weatherford International, Inc., WeatherfordMerger, Inc., Weatherford International Ltd. and Weatherford U.S. Holdings LLC (incorporated byreference to Exhibit 2.1 to Amendment No. 1 to the Registration Statement on Form S-4(Reg. No. 333-85644) filed on May 22, 2002).
2.3 Share Exchange Agreement dated as of December 10, 2008, among Weatherford International, Ltd., aBermuda exempted company, and Weatherford International Ltd., a Swiss company (incorporated byreference to Exhibit 2.1 to the Registrant’s Current Report on Form 8-K (File No. 1-31339) filedDecember 10, 2008).
3.1 Memorandum of Association of Weatherford International Ltd. (incorporated by reference to Annex II tothe proxy statement/prospectus included in Amendment No. 1 to the Registration Statement on Form S-4(Reg. No. 333-85644) filed on May 22, 2002).
3.2 Memorandum of Increase of Share Capital of Weatherford International Ltd. (incorporated by referenceto Annex II to the proxy statement/prospectus included in Amendment No. 1 to the RegistrationStatement on Form S-4 (Reg. No. 333-85644) filed on May 22, 2002).
3.3 Bye-laws of Weatherford International Ltd. (incorporated by reference to Annex III to the proxystatement/prospectus included in Amendment No. 1 to the Registration Statement on Form S-4 (Reg.No. 333-85644) filed on May 22, 2002).
4.1 See Exhibits 3.1, 3.2 and 3.3 for provisions of the Memorandum of Association and Bye-laws ofWeatherford International Ltd. defining the rights of holders of common shares.
4.2 Certificate of Assistant Secretary as to the adoption of a resolution increasing authorized share capital(incorporated by reference to Exhibit 4.1 to the Registrant’s Current Report on Form 8-K (FileNo. 1-31339) filed May 15, 2006).
4.3 Guarantee, dated as of October 25, 2005, of Weatherford International, Inc. for the benefit of holders ofany notes issued by Weatherford International Ltd., from time to time pursuant to the Issuing and PayingAgent Agreement, dated as of October 25, 2005, between Weatherford International Ltd., WeatherfordInternational, Inc. and JPMorgan Chase Bank, National Association (incorporated by reference toExhibit 4.1 to the Registrant’s Current Report on Form 8-K (File No. 1-31339) filed October 31, 2005).
4.4 Second Amended and Restated Credit Agreement dated as of May 2, 2006, among WeatherfordInternational Ltd., Weatherford International, Inc., Weatherford Liquidity Management HungaryLimited Liability Company, JPMorgan Chase Bank as Administrative Agent, and the other Lendersparty thereto (incorporated by reference to Exhibit 4.1 to the Registrant’s Current Report on Form 8-K(File No. 1-31339) filed May 5, 2006).
4.5 Notice of Commitment Increase dated as of November 14, 2006, among Weatherford International Ltd.,Weatherford International, Inc., Weatherford Liquidity Management Hungary Limited LiabilityCompany, JPMorgan Chase Bank as Administrative Agent, and the other Lenders party thereto(incorporated by reference to Exhibit 4.1 to the Registrant’s Current Report on Form 8-K (FileNo. 1-31339) filed November 16, 2006.
4.6 Omnibus Consent and Amendment to Second Amended and Restated Credit Agreement dated January 9,2009 (incorporated by reference to Exhibit 4.1 to the Registrant’s Current Report on Form 8-K (FileNo. 1-31339) filed January 15, 2009).
4.7 Credit Agreement, dated March 19, 2008, among Weatherford International Ltd, as borrower,Weatherford International, Inc. as guarantor, and Deutsche Bank AG Cayman Islands Branch asadministrative agent, and the other lenders party thereto (incorporated by reference to Exhibit 4.6 tothe Registrant’s Current Report on Form 8-K (File No. 1-31339) filed March 25, 2008).
4.8 Omnibus Consent and Amendment to Credit Agreement dated January 9, 2009 (incorporated byreference to Exhibit 4.2 to the Registrant’s Current Report on Form 8-K (File No. 1-31339) filedJanuary 15, 2009).
89
%%TRANSMSG*** Transmitting Job: H65817 PCN: 090000000 ***%%PCMSG|89 |00008|Yes|No|02/24/2009 06:39|0|0|Page is valid, no graphics -- Color: N|

ExhibitNumber Description
4.9 Indenture dated May 17, 1996, between Weatherford Enterra, Inc. and Bank of Montreal Trust Company,as Trustee (incorporated by reference to Exhibit 4.1 to Weatherford Enterra, Inc.’s Current Report onForm 8-K (File No. 1-7867) filed May 31, 1996).
4.10 Third Supplemental Indenture dated November 16, 2001, between Weatherford International, Inc. andThe Bank of New York, as Trustee (incorporated by reference to Exhibit 4.11 to the RegistrationStatement on Form S-3 (Reg. No. 333-73770) filed November 20, 2001).
4.11 Fourth Supplemental Indenture dated June 26, 2002, among Weatherford International, Inc.,Weatherford International Ltd. and The Bank of New York (as successor in interest to Bank ofMontreal Trust Company) (incorporated by reference to Exhibit 4.7 to the Registrant’s QuarterlyReport on Form 10-Q for the quarter ended June 30, 2002 (File No. 1-13086) filed August 14, 2002).
4.12 Indenture, dated October 1, 2003, among Weatherford International Ltd., Weatherford International,Inc., and Deutsche Bank Trust Company Americas (incorporated by reference to Exhibit 4.1 to theRegistrant’s Current Report on Form 8-K (File No. 1-31339) filed October 2, 2003).
4.13 Officers’ Certificate dated as of February 17, 2006, establishing the series of 5.50% Senior Notes due2016 (incorporated by reference to Exhibit 4.2 to the Registrant’s Current Report on Form 8-K (FileNo. 001-31339) filed February 17, 2006).
4.14 Officer’s Certificate, dated August 7, 2006, establishing the series of 6.50% Senior Notes due 2036(incorporated by reference to Exhibit 4.1 to the Registrant’s Current Report on Form 8-K (FileNo. 1-31339) filed August 7, 2006).
4.15 First Supplemental Indenture, dated March 25, 2008 among Weatherford International Ltd., WeatherfordInternational, Inc., and Deutsche Bank Trust Company Americas (incorporated by reference toExhibit 4.1 to the Registrant’s Current Report on Form 8-K (File No. 1-31339) filed March 25, 2008).
4.16 Indenture, dated June 18, 2007, among the Weatherford Delaware, as issuer, Weatherford Bermuda, asguarantor, and Deutsche Bank Trust Company Americas, as trustee, (incorporated by reference toExhibit 4.1 to the Registrant’s Current Report on Form 8-K (File No. 1-31339) filed on June 18, 2007).
4.17 First Supplemental Indenture, dated June 18, 2007, among the Weatherford Delaware, as issuer,Weatherford Bermuda, as guarantor, and Deutsche Bank Trust Company Americas, as trustee(including forms of notes) (incorporated by reference to Exhibit 4.2 to the Registrant’s CurrentReport on Form 8-K (File No. 1-31339) filed on June 18, 2007).
4.18 Second Supplemental Indenture, dated as of January 8, 2009, among Weatherford International Ltd.,Weatherford International, Inc., and Deutsche Bank Trust Company Americas (incorporated byreference to Exhibit 4.1 to the Registrant’s Current Report on Form 8-K (File No. 1-31339) filedJanuary 8, 2009).
4.19 Form of global note for 5.95% Senior Notes due 2012 (incorporated by reference to Exhibit 4.15 to theRegistrant’s Registration Statement on Form S-4 (Registration No. 333-146695) filed November 8,2007).
4.20 Form of global note for 5.15% Senior Notes due 2013 (incorporated by reference to Exhibit 4.2 to theRegistrant’s Current Report on Form 8-K (File No. 1-31339) filed March 25, 2008).
4.21 Form of global note for 4.95% Senior Notes due 2013 (incorporated by reference to Exhibit 4.1 to theRegistrant’s Current Report on Form 8-K (File No. 1-31339) filed October 7, 2003).
4.22 Form of global note for 5.50% Senior Notes due 2016 (incorporated by reference to Exhibit 4.1 to theRegistrant’s Current Report on Form 8-K (File No. 001-31339) filed February 17, 2006).
4.23 Form of global note for 6.00% Senior Notes due 2018 (incorporated by reference to Exhibit 4.3 to theRegistrant’s Current Report on Form 8-K (File No. 1-31339) filed March 25, 2008).
4.24 Form of global note for 9.625% Senior Notes due 2019 (incorporated by reference to Exhibit 4.2 to theRegistrant’s Current Report on Form 8-K (File No. 1-31339) filed January 8, 2009).
4.25 Form of $500,000 Global note for 6.50% Senior Notes due 2036 (incorporated by reference toExhibit 4.2 to the Registrant’s Current Report on Form 8-K (File No. 1-31339) filed August 7, 2006).
4.26 Form of $100,000 Global note for 6.50% Senior Notes due 2036 (incorporated by reference toExhibit 4.3 to the Registrant’s Current Report on Form 8-K (File No. 1-31339) filed August 7, 2006).
4.27 Form of global note for 6.80% Senior Notes due 2037 (incorporated by reference to Exhibit 4.17 to theRegistrant’s Registration Statement on Form S-4 (Registration No. 333-146695) filed November 8,2007).
4.28 Form of global note for 7.00% Senior Notes due 2038 (incorporated by reference to Exhibit 4.4 to theRegistrant’s Current Report on Form 8-K (File No. 1-31339) filed March 25, 2008).
90
%%TRANSMSG*** Transmitting Job: H65817 PCN: 091000000 ***%%PCMSG|90 |00008|Yes|No|02/24/2009 06:39|0|0|Page is valid, no graphics -- Color: N|

ExhibitNumber Description
4.29 Form of global note for 9.875% Senior Notes due 2039 (incorporated by reference to Exhibit 4.3 to theRegistrant’s Current Report on Form 8-K (File No. 1-31339) filed January 8, 2009).
4.30 Amended and Restated Warrant Agreement, dated effective as of July 12, 2006, by and amongWeatherford International, Ltd., Weatherford International, Inc. and Shell Technology Ventures, Inc.(incorporated by reference to Exhibit 4.1 to the Registrant’s Current Report on Form 8-K (FileNo. 1-31339) filed July 14, 2006).
10.1 Issuing and Paying Agent Agreement, dated as of October 25, 2005, among Weatherford InternationalLtd., Weatherford International, Inc. and JPMorgan Chase Bank, National Association (incorporated byreference to Exhibit 10.1 to the Registrant’s Current Report on Form 8-K (File No. 1-31339) filedOctober 31, 2005).
10.2 Commercial Paper Dealer Agreement, dated as of October 25, 2005, among Weatherford InternationalLtd., Weatherford International, Inc. and J.P. Morgan Securities Inc. (incorporated by reference toExhibit 10.2 to the Registrant’s Current Report on Form 8-K (File No. 1-31339) filed October 31, 2005).
10.3 Commercial Paper Dealer Agreement, dated as of October 25, 2005, among Weatherford InternationalLtd., Weatherford International, Inc. and Goldman, Sachs & Co. (incorporated by reference toExhibit 10.3 to the Registrant’s Current Report on Form 8-K (File No. 1-31339) filed October 31, 2005).
10.4 Commercial Paper Dealer Agreement, dated as of October 25, 2005, among Weatherford InternationalLtd., Weatherford International, Inc. and Merrill Lynch Money Markets Inc. (for notes with maturities upto 270 days) and Merrill Lynch, Pierce, Fenner & Smith Incorporated, (for notes with maturities over270 days up to 397 days) (incorporated by reference to Exhibit 10.4 to the Registrant’s Current Report onForm 8-K (File No. 1-31339) filed October 31, 2005).
*10.5 Weatherford International Ltd. Restricted Share Plan, including form of agreement for officers and non-officers (incorporated by reference to Exhibit 10.2 to Amendment No. 1 to the Registrant’s QuarterlyReport on Form 10-Q for the quarter ended March 31, 2004 on Form 10-Q/A (File No. 1-31339) filedSeptember 15, 2004).
*10.6 Trust under Weatherford International Ltd. Nonqualified Executive Retirement Plan dated March 23,2004 (incorporated by reference to Exhibit 10.1 to the Registrant’s Quarterly Report on Form 10-Q forthe quarter ended March 31, 2004 (File No. 1-31339) filed May 6, 2004).
*10.7 Amended and Restated Non-Employee Director Stock Option Plan (incorporated by reference toExhibit 10.1 to the Registrant’s Quarterly Report on Form 10-Q for the quarter ended June 30, 1995(File No. 1-13086) filed August 12, 1995).
*10.8 General Amendment of Employee Stock Option Programs of Weatherford International, Inc. datedMay 9, 2003 (incorporated by reference to Exhibit 10.1 to the Registrant’s Quarterly Report onForm 10-Q for the quarter ended June 30, 2003 (File No. 1-31339) filed August 14, 2003).
*10.9 General Amendment of Director’s Stock Option Plans and Agreements dated May 9, 2003 (incorporatedby reference to Exhibit 10.2 to the Registrant’s Quarterly Report on Form 10-Q for the quarter endedJune 30, 2003 (File No. 1-31339) filed August 14, 2003).
*10.10 Weatherford International, Inc. 1998 Employee Stock Option Plan, as amended, including form ofagreement for officers (incorporated by reference to Exhibit 10.18 to the Registrant’s Annual Report onForm 10-K for the year ended December 31, 2003 (File No. 1-13086) filed March 24, 2004).
*10.11 Amendment to Stock Option Programs (incorporated by reference to Exhibit 4.19 to the Registrant’sRegistration Statement on Form S-8 (Reg. No. 333-36598) filed May 19, 2000).
*10.12 Indemnification Agreement, dated as of September 29, 2005, between Weatherford International Ltd.and Andrew P. Becnel (incorporated by reference to Exhibit 10.3 to the Registrant’s Current Report onForm 8-K (File No. 1-31339) filed October 5, 2005).
*10.13 Indemnification Agreements with Robert K. Moses, Jr. (incorporated by reference to Exhibit 10.10 toWeatherford Enterra, Inc.’s Annual Report on Form 10-K for the year ended December 31, 1987 (FileNo. 1-7867)); and William E. Macaulay (incorporated by reference to Exhibit 10.2 to WeatherfordEnterra, Inc.’s Quarterly Report on Form 10-Q for the quarter ended September 30, 1995 (FileNo. 1-7867)).
*10.14 Indemnification Agreements with each of Bernard J. Duroc-Danner, Burt M. Martin, Stuart E. Ferguson,David J. Butters, Robert A. Rayne, Robert K. Moses, Jr., Robert B. Millard, and William E. Macaulay(incorporated by reference to Exhibit 10.1 to the Registrant’s Quarterly Report on Form 10-Q for thequarter ended September 30, 2002 (File No. 1-13086) filed November 13, 2002).
91
%%TRANSMSG*** Transmitting Job: H65817 PCN: 092000000 ***%%PCMSG|91 |00008|Yes|No|02/24/2009 06:39|0|0|Page is valid, no graphics -- Color: N|
ExhibitNumber Description
*10.15 Form of Stock Option Agreement for Non-Employee Directors dated September 8, 1998 (incorporatedby reference to Exhibit 10.23 to the Registrant’s Annual Report on Form 10-K for the year endedDecember 31, 1998 (File No. 1-13086) filed March 31, 1999).
*10.16 Form of Amendment to Stock Option Agreements dated September 8, 1998 for Non-Employee Directors(incorporated by reference to Exhibit 4.17 to the Registration Statement on Form S-8 (Reg.No. 333-36598) filed May 9, 2000).
*10.17 Form of Stock Option Agreement for Non-employee Directors dated July 5, 2000 (incorporated byreference to Exhibit 4.16 to the Registration Statement on Form S-8 (Reg. No. 333-48322) filedOctober 20, 2000).
*10.18 Form of Stock Option Agreement for Non-employee Directors dated September 26, 2001 (incorporatedby reference to Exhibit 4.19 to the Registration Statement on Form S-8 (Reg. No. 333-81678) filedJanuary 30, 2002).
*10.19 Assumption and General Amendment of Directors’ Stock Option and Benefit Programs and GeneralAmendment of Employee Stock Option and Benefit Programs of Weatherford International, Inc. datedJune 26, 2002 (incorporated by reference to Exhibit 10.1 to the Registrant’s Quarterly Report onForm 10-Q for the quarter ended June 30, 2002 (File No. 1-13086) filed August 14, 2002).
*10.20 Indemnification Agreement dated October 27, 2006, between Weatherford International Ltd. and JessicaAbarca (incorporated by reference to Exhibit 10.3 to the Registrant’s Current Report on Form 8-K (FileNo. 1-31339) filed October 27, 2006).
*10.21 Form of Restricted Share Unit Award Agreement for Officers pursuant to Weatherford International Ltd.2006 Omnibus Incentive Plan (incorporated by reference to Exhibit 10.45 to the Registrant’s AnnualReport on Form 10-K for the year ended December 31,2006 (File No. 1-31339) filed February 23, 2007).
*10.22 Form of Stock Option Award Agreement for Officers pursuant to Weatherford International Ltd. 2006Omnibus Incentive Plan (incorporated by reference to Exhibit 10.46 to the Registrant’s Annual Report onForm 10-K for the year ended December 31, 2006 (File No. 1-31339) filed February 23, 2007).
*10.23 Form of Restricted Share Award Agreement for Non-employee Directors pursuant to WeatherfordInternational Ltd. 2006 Omnibus Incentive Plan (incorporated by reference to Exhibit 10.47 to theRegistrant’s Annual Report on Form 10-K for the year ended December 31, 2006 (File No. 1-31339 filedFebruary 23, 2007).
*10.24 Form of Restricted Share Award Agreement for Officers pursuant to Weatherford International Ltd. 2006Omnibus Incentive Plan (incorporated by reference to Exhibit 10.48 to the Registrant’s Annual Report onForm 10-K for the year ended December 31, 2006 (File No. 1-31339) filed February 23, 2007).
*10.25 Form of Stock Option Award Agreement for Non-Employee Directors pursuant to WeatherfordInternational Ltd. 2006 Omnibus Plan (incorporated by reference to Exhibit 10.49 to the Registrant’sAnnual Report on Form 10-K for the year ended December 31, 2006 (File No. 1-31339) filedFebruary 23, 2007).
*10.26 Indemnification Agreement, dated as of June 11, 2007, between Weatherford International Ltd. andKeith R. Morley (incorporated by reference to Exhibit 10.2 to the Registrant’s Current Report onForm 8-K (File No. 1-31339) filed June 11, 2007).
*10.27 Amended and Restated Employment Agreements dated December 31, 2008, between WeatherfordInternational Ltd. and each of Jessica Abarca, Andrew P. Becnel, M. David Colley, Bernard J. Duroc-Danner, Stuart E. Ferguson, Burt M. Martin and Keith R. Morley (incorporated by reference toExhibit 10.1 to the Registrant’s Current Report on Form 8-K (File No. 1-31339) filed December 31,2008).
*10.28 Employment Agreements effective as of January 1, 2009, between Weatherford International, Inc. andeach of Jessica Abarca, Andrew P. Becnel, M. David Colley, Bernard J. Duroc-Danner, Stuart E.Ferguson, Burt M. Martin and Keith R. Morley (incorporated by reference to Exhibit 10.2 to theRegistrant’s Current Report on Form 8-K (File No. 1-31339) filed December 31, 2008).
*10.29 Weatherford International, Inc. Executive Deferred Compensation Stock Ownership Plan, as amendedand restated as of December 31, 2008 (incorporated by reference to Exhibit 10.3 to the Registrant’sCurrent Report on Form 8-K (File No. 1-31339) filed December 31, 2008).
*10.30 Weatherford International, Inc. Foreign Executive Deferred Compensation Stock Plan, as amended andrestated as of December 31, 2008 (incorporated by reference to Exhibit 10.4 to the Registrant’s CurrentReport on Form 8-K (File No. 1-31339) filed December 31, 2008).
92
%%TRANSMSG*** Transmitting Job: H65817 PCN: 093000000 ***%%PCMSG|92 |00008|Yes|No|02/24/2009 06:39|0|0|Page is valid, no graphics -- Color: N|
ExhibitNumber Description
*10.31 Weatherford International Ltd. Non-Employee Director Deferred Compensation, as amended andrestated as of December 31, 2008 (incorporated by reference to Exhibit 10.5 to the Registrant’sCurrent Report on Form 8-K (File No. 1-31339) filed December 31, 2008).
*10.32 Weatherford International Ltd. Non-Employee Director Retirement Plan, as amended and restated as ofDecember 31, 2008 (incorporated by reference to Exhibit 10.6 to the Registrant’s Current Report onForm 8-K (File No. 1-31339) filed December 31, 2008).
*10.33 Weatherford Management Incentive Plan, including Form of Award Letter, as amended and restated as ofDecember 31, 2008 (incorporated by reference to Exhibit 10.7 to the Registrant’s Current Report onForm 8-K (File No. 1-31339) filed December 31, 2008).
*10.34 Amended and Restated Weatherford International Ltd. Nonqualified Executive Retirement Plan(incorporated by reference to Exhibit 10.8 to the Registrant’s Current Report on Form 8-K (FileNo. 1-31339) filed December 31, 2008).
*10.35 Weatherford International, Inc. Supplemental Retirement Plan (incorporated by reference to Exhibit 10.9to the Registrant’s Current Report on Form 8-K (File No. 1-31339) filed December 31, 2008).
*10.36 Weatherford International Ltd. 2006 Omnibus Incentive Plan, as amended (incorporated by reference toExhibit 10.10 to the Registrant’s Current Report on Form 8-K (File No. 1-31339) filed December 31,2008).
*10.37 Amendment to Weatherford International, Inc. 1998 Employee Stock Option Plan (incorporated byreference to Exhibit 10.11 to the Registrant’s Current Report on Form 8-K (File No. 1-31339) filedDecember 31, 2008).
*10.38 Amendment to Weatherford International Ltd. Non-Employee Director Stock Option Agreements(incorporated by reference to Exhibit 10.12 to the Registrant’s Current Report on Form 8-K (FileNo. 1-31339) filed December 31, 2008).
†*10.39 Amended and Restated Employment Agreement, dated December 31, 2008, between WeatherfordInternational Ltd. and Carel W. Hoyer.
†*10.40 Employment Agreement, dated February 2, 2009, between Weatherford International, Inc. and Carel W.Hoyer.
†*10.41 Indemnification Agreement, dated as of February 9, 2009, between Weatherford International Ltd. andCarel W. Hoyer.
†*10.42 Indemnification Agreement, dated as of February 9, 2009, between Weatherford International, Inc. andCarel W. Hoyer.
†*10.43 Amended and Restated Employment Agreement, dated December 31, 2008 between WeatherfordInternational Ltd. and James M. Hudgins.
†*10.44 Employment Agreement, dated February 9, 2009, between Weatherford International, Inc. andJames M. Hudgins.
†*10.45 Indemnification Agreement, dated as of September 4, 2002, between Weatherford International Ltd. andJames M. Hudgins.
†*10.46 Indemnification Agreement, dated as of September 4, 2002, between Weatherford International, Inc. andJames M. Hudgins.
†21.1 Subsidiaries of Weatherford International Ltd.†23.1 Consent of Ernst & Young LLP.†31.1 Certification of Chief Executive Officer pursuant to Section 302 of the Sarbanes-Oxley Act of 2002.†31.2 Certification of Chief Financial Officer pursuant to Section 302 of the Sarbanes-Oxley Act of 2002.†32.1 Certification of Chief Executive Officer pursuant to Section 906 of the Sarbanes-Oxley Act of 2002.†32.2 Certification of Chief Financial Officer pursuant to Section 906 of the Sarbanes-Oxley Act of 2002.
* Management contract or compensatory plan or arrangement.
† Filed herewith.
As permitted by Item 601(b)(4)(iii)(A) of Regulation S-K, the Company has not filed with this Annual Reporton Form 10-K certain instruments defining the rights of holders of long-term debt of the Company and itssubsidiaries because the total amount of securities authorized under any of such instruments does not exceed 10% ofthe total assets of the Company and its subsidiaries on a consolidated basis. The Company agrees to furnish a copyof any of such instruments to the Securities and Exchange Commission upon request.
93
%%TRANSMSG*** Transmitting Job: H65817 PCN: 094000000 ***%%PCMSG|93 |00012|Yes|No|02/24/2009 12:33|0|0|Page is valid, no graphics -- Color: N|

We agree to furnish to any requesting stockholder a copy of any of the above named exhibits upon the paymentof our reasonable expenses of obtaining, duplicating and mailing the requested exhibits. All requests for copies ofexhibits should be made in writing to our U.S. Investor Relations Department at 515 Post Oak Blvd., Houston, TX77027.
(c) Financial Statement Schedules
1. Valuation and qualifying accounts and allowances.
SCHEDULE IIWEATHERFORD INTERNATIONAL LTD. AND SUBSIDIARIES
VALUATION AND QUALIFYING ACCOUNTS AND ALLOWANCESFOR THE THREE YEARS ENDED DECEMBER 31, 2008
Description
Balance atBeginningof Period
Charged toCosts andExpenses Collections Deductions
Balance atEnd ofPeriod
Additions
(In thousands)
Year Ended December 31, 2008:Allowance for uncollectible
accounts receivable . . . . . . . . . . . $13,760 $5,970 $4,975 $(8,280) $16,425
Year Ended December 31, 2007:Allowance for uncollectible
accounts receivable . . . . . . . . . . . 13,452 6,984 523 (7,199) 13,760
Year Ended December 31, 2006:Allowance for uncollectible
accounts receivable . . . . . . . . . . . 12,210 6,242 881 (5,881) 13,452
All other schedules are omitted because they are not required or because the information is included in thefinancial statements or the related notes.
94
%%TRANSMSG*** Transmitting Job: H65817 PCN: 095000000 ***%%PCMSG|94 |00009|Yes|No|02/24/2009 16:21|0|0|Page is valid, no graphics -- Color: N|
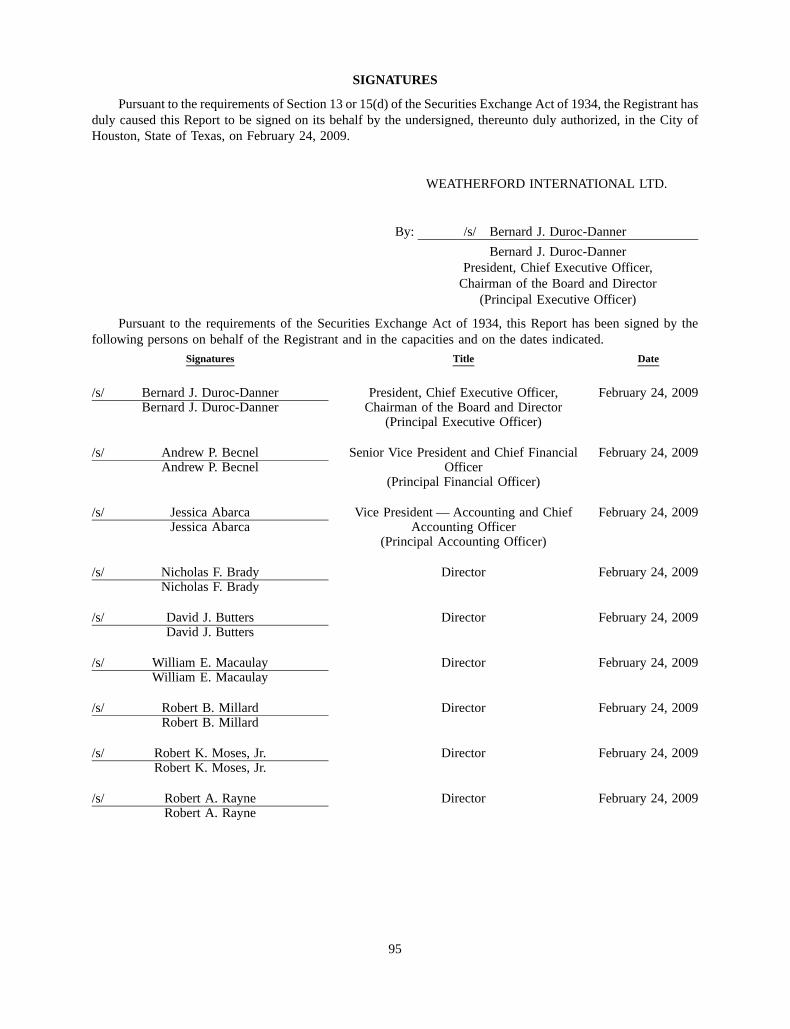
SIGNATURES
Pursuant to the requirements of Section 13 or 15(d) of the Securities Exchange Act of 1934, the Registrant hasduly caused this Report to be signed on its behalf by the undersigned, thereunto duly authorized, in the City ofHouston, State of Texas, on February 24, 2009.
WEATHERFORD INTERNATIONAL LTD.
By: /s/ Bernard J. Duroc-Danner
Bernard J. Duroc-DannerPresident, Chief Executive Officer,
Chairman of the Board and Director(Principal Executive Officer)
Pursuant to the requirements of the Securities Exchange Act of 1934, this Report has been signed by thefollowing persons on behalf of the Registrant and in the capacities and on the dates indicated.
Signatures Title Date
/s/ Bernard J. Duroc-DannerBernard J. Duroc-Danner
President, Chief Executive Officer,Chairman of the Board and Director
(Principal Executive Officer)
February 24, 2009
/s/ Andrew P. BecnelAndrew P. Becnel
Senior Vice President and Chief FinancialOfficer
(Principal Financial Officer)
February 24, 2009
/s/ Jessica AbarcaJessica Abarca
Vice President — Accounting and ChiefAccounting Officer
(Principal Accounting Officer)
February 24, 2009
/s/ Nicholas F. BradyNicholas F. Brady
Director February 24, 2009
/s/ David J. ButtersDavid J. Butters
Director February 24, 2009
/s/ William E. MacaulayWilliam E. Macaulay
Director February 24, 2009
/s/ Robert B. MillardRobert B. Millard
Director February 24, 2009
/s/ Robert K. Moses, Jr.Robert K. Moses, Jr.
Director February 24, 2009
/s/ Robert A. RayneRobert A. Rayne
Director February 24, 2009
95
%%TRANSMSG*** Transmitting Job: H65817 PCN: 096000000 ***%%PCMSG|95 |00008|Yes|No|02/24/2009 16:21|0|0|Page is valid, no graphics -- Color: N|

NYSE Certification
Our Chief Executive Officer submitted last year’s certification to the NYSE that he was not aware of anyviolation by Weatherford of NYSE corporate governance standards as of the date of the certification. Thecertification was not qualified.
Sarbanes-Oxley Certification
We filed with the SEC, as an exhibit to our Annual Report on Form 10-K for the year ended December 31,2008, the required Sarbanes-Oxley Act Certifications.
%%TRANSMSG*** Transmitting Job: H65817 PCN: 100000000 ***%%PCMSG| |00001|Yes|No|03/11/2009 13:43|0|0|Page is valid, no graphics -- Color: N|

Auditors
Ernst & Young LLP5 Houston Center1401 McKinney, Suite 1200Houston, TX 77010
Legal Counsel
Andrews & Kurth LLP600 Travis, Suite 4200Houston, TX 77002
Stock Data
New York Stock ExchangeSymbol: WFT
Corporate Headquarters
Weatherford International Ltd.Alpenstrasse 156300 ZugSwitzerland
Regional Offices
Asia Pacific14th Floor, West WingRohas PerkasaNo. 8, Jalan PerakKuala Lumpur 50450Malaysia+60 3 2168 6000
Canada333 5th Avenue S.W., Suite 1100Calgary, AlbertaT2P 3B6Canada+1 403 693 7500
Middle East/North Africa4th Interchange, Al BarshaSheikh Zayed RoadAl-Khaimah Building IIDubai UAE+9 71 4 312 5000
United States515 Post Oak Boulevard, Suite 600Houston, TX 77027USA+1 713 693 4000
Latin AmericaBlvd Manuel Avila Camancho 4023rd FloorCol. Lomas de ChapultepecMexico D.F., CP11000Mexico+52 5591384800
Russia & FSU4, 4th Lesnoy PereulokMoscow125047 Russia+7 495 775 47 12
Europe/Sub Sahara AfricaSouterhead RoadAltens Industrial EstateAberdeen AB12 3LFUnited Kingdom+44 1224 380200SGS-COC-003505

Staying the CourseWeatherford International Ltd. 2008 Annual Report
Weatherford International Ltd.
20
08
An
nu
al Rep
ort
Weatherford International Ltd. Alpenstrasse 15 6300 Zug Switzerland weatherford.com