
Stay Balanced.. Stay Steady! - HDFC Mutual...
26
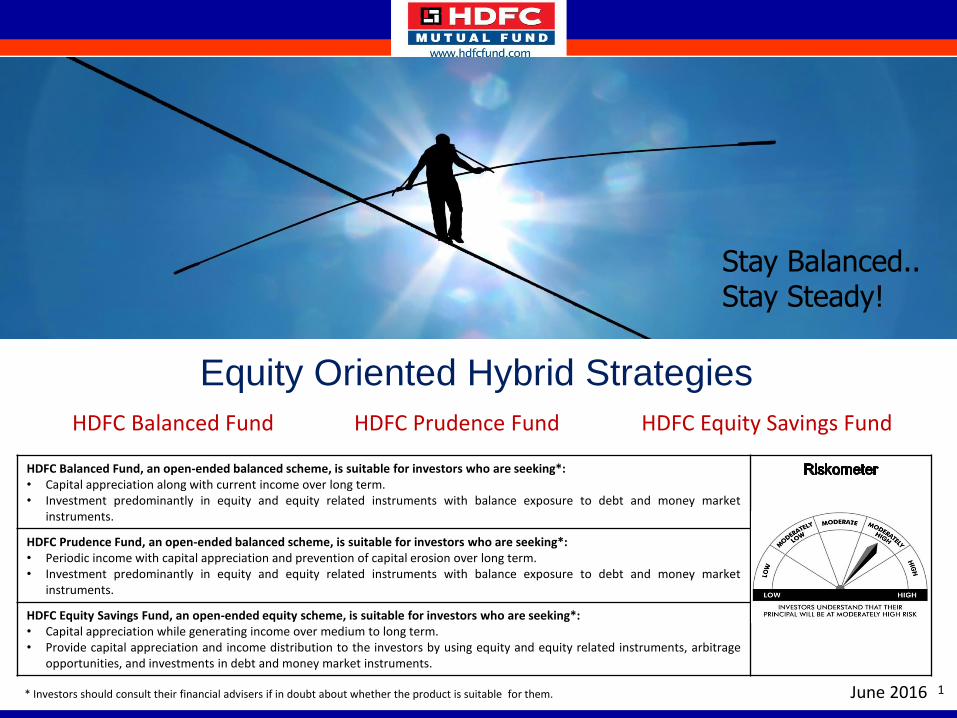
1 Equity Oriented Hybrid Strategies June 2016 * Investors should consult their financial advisers if in doubt about whether the product is suitable for them. HDFC Balanced Fund HDFC Prudence Fund HDFC Equity Savings Fund HDFC Balanced Fund, an open-ended balanced scheme, is suitable for investors who are seeking*: • Capital appreciation along with current income over long term. • Investment predominantly in equity and equity related instruments with balance exposure to debt and money market instruments. HDFC Prudence Fund, an open-ended balanced scheme, is suitable for investors who are seeking*: • Periodic income with capital appreciation and prevention of capital erosion over long term. • Investment predominantly in equity and equity related instruments with balance exposure to debt and money market instruments. HDFC Equity Savings Fund, an open-ended equity scheme, is suitable for investors who are seeking*: • Capital appreciation while generating income over medium to long term. • Provide capital appreciation and income distribution to the investors by using equity and equity related instruments, arbitrage opportunities, and investments in debt and money market instruments. 1 Stay Balanced.. Stay Steady!
Transcript of Stay Balanced.. Stay Steady! - HDFC Mutual...
11
Equity Oriented Hybrid Strategies
June 2016* Investors should consult their financial advisers if in doubt about whether the product is suitable for them.
HDFC Balanced Fund HDFC Prudence Fund HDFC Equity Savings Fund
HDFC Balanced Fund, an open-ended balanced scheme, is suitable for investors who are seeking*:• Capital appreciation along with current income over long term.• Investment predominantly in equity and equity related instruments with balance exposure to debt and money market
instruments.
HDFC Prudence Fund, an open-ended balanced scheme, is suitable for investors who are seeking*:• Periodic income with capital appreciation and prevention of capital erosion over long term.• Investment predominantly in equity and equity related instruments with balance exposure to debt and money market
instruments.
HDFC Equity Savings Fund, an open-ended equity scheme, is suitable for investors who are seeking*:• Capital appreciation while generating income over medium to long term.• Provide capital appreciation and income distribution to the investors by using equity and equity related instruments, arbitrage
opportunities, and investments in debt and money market instruments.
1
Stay Balanced.. Stay Steady!

What are Equity Oriented Hybrid Strategies?A Mix of Equity & A Dash of Debt
Ret
urn
s
Risk
• A portfolio generally comprising predominantly (over 65%) equities and rest into debt instruments
• Target returns greater than debt schemes with lower volatility than pure equity schemes
• Provide investors the growth of equity with the stability of debt
MIP – Monthly Income PlansIn view of the individual circumstances and risk profile, each investor is advised to consult his / her professional advisor before making a decision to invest.
HybridFunds (Equity Oriented)
2

Investor Objective: Equity Oriented Hybrid Strategies
Two key objectives of any individual investor
• Growth of capital – Through Equities
• Stability of capital – Through Debt
Equity Oriented Hybrid Strategies are ideal to achieve these objectives
Equity Oriented Hybrid Strategies are also capable of providing
• Regular cash flows through dividends* or SWAP (refer to slide 7 for more details)
• Tax efficient returns
3
* There is no assurance or guarantee to Unit holders as to rate/quantum of dividend distribution or that the dividends will be paid regularly.

Our Equity Oriented Hybrid Strategies
Equity Exposure*
Average Maturity (Years)*
Yield to Maturity*# Exit Load
Dividend Frequency
Dividend Track
Record##
HDFC Balanced Fund
70.98% 12.69 7.68%See note below**
QuarterlyPaid dividends in
each of the last 10 years
HDFC PrudenceFund
74.75% 14.32 8.19%See note below**
MonthlyPaid dividends in
each of the last 10 years
HDFC Equity Savings Fund
Equity: 38.78%
Arbitrage: 30.59%2.39 8.09%
See note below**
No pre-defined frequency
Paid dividends in each of the last 7
years***
In view of the individual circumstances and risk profile, each investor is advised to consult his / her professional advisor before making a decision to invest.
* Portfolio details as on 31st May 2016. # Computed on the invested amount for debt portfolio.**Exit Load: In respect of each purchase / switch-in of units, upto 15% of the units may be redeemed without any exit load from the date of allotment. Any redemption in excess of the above limit shall be subject to exit load of 1.00% if units are redeemed / switched-out within 1 year from the date of allotment of units. No Exit load is payable if units are redeemed / switched out after 1 year from the date of allotment.*** Including the dividend in the erstwhile HDFC Multiple Yield Fund, which was repositioned as HDFC Equity Savings Fund in December 2015.## For details on dividend distribution, refer dividend history available on website, www.hdfcfund.com. There is no assurance or guarantee to Unit holders as to rate/quantum of dividend distribution or that the dividends will be paid regularly.
4

Relative Fund Positioning
5
Returns
Risk
In view of the individual circumstances and risk profile, each investor is advised to consult his / her professional advisor before making a decision to invest.

Market Outlook
Equity
• Economic recovery underway
• Falling commodity prices to advantage India
• Improving margin outlook for Indian corporates
• Valuations are supportive. Low Market Cap to
GDP ratio (see chart)
Debt
• Benign inflation outlook
• Falling Fiscal Deficit
• Low Current Account Deficit
Invest in our Equity Oriented Hybrid Funds, as they stand to benefit from both equity and debt markets!
FY 13* FY 14* FY 15E FY 16E FY 17E
CPI (Avg %) 9.9 9.4 5.9 4.9 5
WPI (Avg %) 7.4 6 2 (2.5) 2.3
GDP Growth (%) 5.4 6.3 7.1 7.2 7.7
Fiscal Deficit (% GDP) 4.9 4.5 4.1 3.9 3.6
CAD (% GDP) -4.8 (1.7) (1.3) (1.0) (1.9)
Source: Kotak Institutional Equities. *Actual Figures. E – Estimates. Data & Estimates as of 30th April 2016. CPI – Consumer Price Inflation, WPI – Wholesale Price Index, CAD – Current Account Deficit 6

Combine our Hybrid Strategies with SWAP for
Tax Efficient Periodic Income
7
Date of SWAP(A)
NAVs(B)
Cash flow(C)
Units Transacted(D) = (C) / (B)
Units Outstanding(E) = Prev (E) + (D)
Principal Component (F) = (D) * Start (B)
Income Component(G) = - (C) – (F)
Value of Investment(H) = (B) * (E)
1-Mar 71.22 120000 1685.0 1685 120000
1-Apr 74.27 -800 -10.8 1674 767 33 124341
1-May 77.05 -800 -10.4 1664 739 61 128196
1-Jun 85.61 -800 -9.3 1655 665 135 141643
1-Jul 90.97 -800 -8.8 1646 626 174 149720
1-Aug 90.63 -800 -8.8 1637 629 171 148354
1-Sep 95.09 -800 -8.4 1629 599 201 154851
1-Oct 96.43 -800 -8.3 1620 591 209 156230
1-Nov 100.14 -800 -8.0 1612 569 231 161449
1-Dec 103.95 -800 -7.7 1605 548 252 166785
1-Jan 105.46 -800 -7.6 1597 540 260 168415
1-Feb 108.57 -800 -7.4 1590 525 275 172578
1-Mar 110.16 -800 -7.3 1582 517 283 174299
SWAP Value Principal Returned Taxable Income Tax @ 15% Tax as a % of SWAP Units Outstanding Value of Investment
9600 7316 2284 343 3.6% 1582 174299
An Illustration
• A Fixed Deposit with a periodic interest pay out attracts taxes of upto 30% as per slab rates
• Combining a hybrid strategy with SWAP (Systematic Withdrawal Advantage Plan) results in tax-efficient periodic income
• Since bulk of the money withdrawn are accounted for by the principal component, the cash flows are more tax-efficient when compared to interest income
SWAP withdrawal rate assumed at 8% p.a. of the initial investment, which works out to monthly cash flow of Rs.800 in this case. Short Term Capital Gains Tax rate assumed at 15%.
Calculation is based on notional NAVs. The above table is for illustration purpose only purely to explain the concept of SWAP and should not be construed as providing any kind of
investment advice or as a substitute for any kind of financial planning. HDFC Mutual Fund/HDFC AMC is not guaranteeing any returns on investments made in the Scheme. The result of
the calculations generated in the above illustration may not be accurate. Calculations are based on assumptions provided above. Due to the personal nature of investments and financialplanning, investors are advised to consult his/her financial advisor.
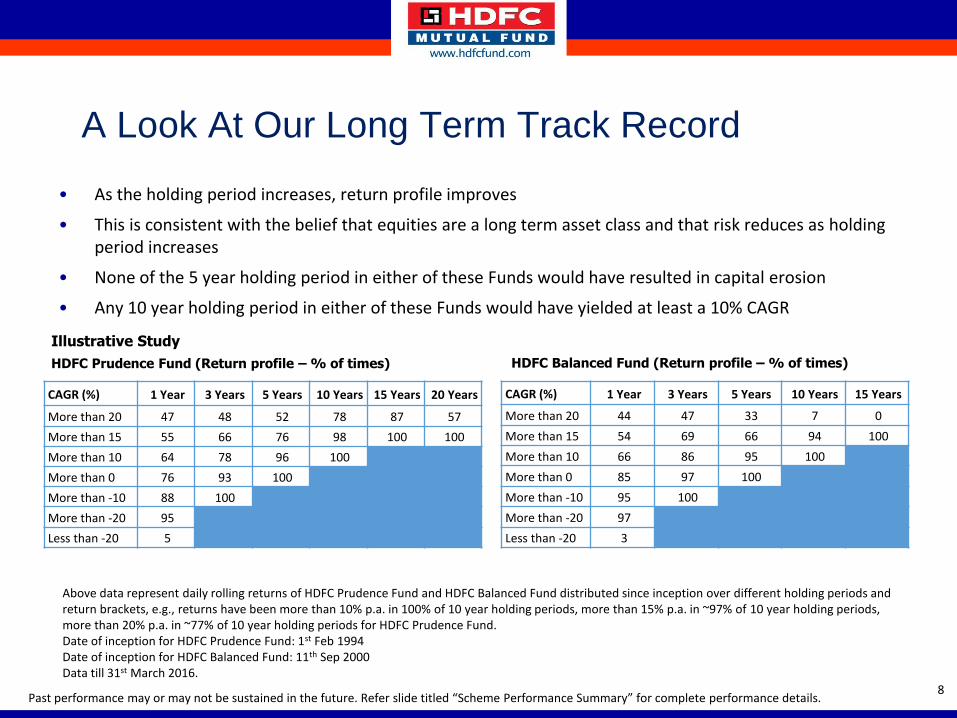
A Look At Our Long Term Track Record
• As the holding period increases, return profile improves
• This is consistent with the belief that equities are a long term asset class and that risk reduces as holding period increases
• None of the 5 year holding period in either of these Funds would have resulted in capital erosion
• Any 10 year holding period in either of these Funds would have yielded at least a 10% CAGR
8
CAGR (%) 1 Year 3 Years 5 Years 10 Years 15 Years 20 Years
More than 20 47 48 52 78 87 57
More than 15 55 66 76 98 100 100
More than 10 64 78 96 100
More than 0 76 93 100
More than -10 88 100
More than -20 95
Less than -20 5
CAGR (%) 1 Year 3 Years 5 Years 10 Years 15 Years
More than 20 44 47 33 7 0
More than 15 54 69 66 94 100
More than 10 66 86 95 100
More than 0 85 97 100
More than -10 95 100
More than -20 97
Less than -20 3
HDFC Prudence Fund (Return profile – % of times) HDFC Balanced Fund (Return profile – % of times)
Past performance may or may not be sustained in the future. Refer slide titled “Scheme Performance Summary” for complete performance details.
Above data represent daily rolling returns of HDFC Prudence Fund and HDFC Balanced Fund distributed since inception over different holding periods and return brackets, e.g., returns have been more than 10% p.a. in 100% of 10 year holding periods, more than 15% p.a. in ~97% of 10 year holding periods, more than 20% p.a. in ~77% of 10 year holding periods for HDFC Prudence Fund.Date of inception for HDFC Prudence Fund: 1st Feb 1994Date of inception for HDFC Balanced Fund: 11th Sep 2000Data till 31st March 2016.
Illustrative Study

Our Offerings in Detail
9

Refer Disclaimer / Risk Factors on
Slide: 18
HDFC Balanced Fund The Growth of equity With The Foundation of Debt
• The fund assets are generally held in predefined proportion of debt / money market securities and equities.
• The fund, broadly targets returns greater than debt schemes with lower volatility than equity schemes.
• Suitable for investors looking for a well diversified portfolio across asset classes:
– Benefit from the growth of equities and
– The stability of debt markets
10
* Computed on the invested amount for debt portfolioThe current investment strategy is subject to change depending on the market conditions
HDFC Balanced Fund Current Investment Strategy
• Within equities, the fund has a balanced mix between consumption and investment themes.
• While selecting stocks, the focus is on: Sound quality companies; Companies that enjoy leadership / near leadership position; Businesses with superior growth prospects available at a reasonable price.
• Within debt, the portfolio is positioned to take advantage of falling interest rates and upswing in growth momentum.
• Weighted Average Maturity of 13.67 years* and Modified Duration of 7.08 years* as on 30 Apr 2016
11

HDFC Prudence FundA Fund That Has Seen It All
The investment strategy is subject to change depending on the market conditions. Please refer to Scheme Information Document for complete investment strategy.
Being a hybrid strategy, invests in both equities and in debt
• Asset Allocation between equities/debt is a function of valuations, growth outlook, interest rates, etc.
Equity strategy
• Clear long term focus
• Multi cap strategy, flexibility to invest in small/ mid / large cap stocks
• Sound quality companies
• Effective diversification of portfolio
Debt Strategy
• Portfolio duration is actively managed based on outlook for interest rates with a 2-3 year view
• Strong preference for good credit quality
12

HDFC Prudence Fund Creating Wealth Across Cycles
• HDFC Prudence Fund is today the largest* Equity Oriented Hybrid Fund in India with a AUM of ~ INR 7,772 crores as on 31st March, 2016.
• In this journey of over 22 years, Rs 10,000 has become ~Rs 4.56 lacs (~46 times) at CAGR of ~18.38%**
• The Fund has paid dividends in each of last 18 years (since 1999 when fund turned open ended)
• Introduction of monthly dividend frequency since January 2016
*Source: AMFI.**Past performance may or may not be sustained in the future. Refer slide titled “Scheme Performance Summary” for complete performance details. 13

HDFC Equity Savings FundThe Best of Three
• Asset allocation is key to financial success
• Fund takes exposure to Equity, Debt and Arbitrage
Equity Savings
Fund
Equity
DebtArbitrage
A Stable Trio
Characteristics of an Equity Savings Fund
Volatility < Equity FundsPotential Returns >Debt Funds
Taxation = Equity Funds
Lower unhedged Equity exposure ensures lower volatility while the combined exposure of Equity + Arbitrage offers the tax efficiency of equity oriented funds while offering higher
potential returns as compared to debt funds.
HDFC Mutual Fund/AMC is not guaranteeing return on investments made in the Scheme 14

Why HDFC Equity Savings Scheme?
• Optimal Growth – Tactical equity allocation to take advantage of the long term potential in IndianEquities.
• Regular Income – Debt and arbitrage securities held in the portfolio will seek to provide regularincome opportunities.
• Efficient Taxation –Tax Efficient Returns with appropriate mix of Equity, Debt and Derivatives.
• Low Fund Volatility – Using Equity Arbitrage Instruments without hindering growth prospects.
• Diversified Asset Allocation – Regular balancing between asset classes based on market conditionsand asset valuations.
HDFC Mutual Fund/AMC is not guaranteeing return on investments made in the scheme 15
Product Features and Asset Allocation
16

Nature of Scheme Open-ended Balanced Scheme
Inception Date
(Date of allotment)
September 11, 2000
Investment Objective To generate capital appreciation along with current income from a combined portfolio of equity and equity-related and debt &money market instruments
Fund Manager $ Chirag Setalvad
Investment Plan Direct Plan and Regular Plan
Investment Options Under Each Plan: Growth & Dividend. The Dividend Option offers Dividend Payout and Reinvestment facility
Minimum ApplicationAmount.(Under Each Plan/Option)
Purchase: Rs. 5,000 and any amount thereafter
Additional Purchase: Rs. 1,000 and any amount thereafter
Load Structure Entry Load:• Not Applicable. Upfront commission shall be paid directly by the investor to the ARN Holder (AMFI registered Distributor)
based on the investors’ assessment of various factors including the service rendered by the ARN Holder.
Exit Load:• In respect of each purchase / switch-in of Units, upto 15% of the units may be redeemed without any exit load from the
date of allotment.• Any redemption in excess of the above limit shall be subject to the following exit load:
• Exit Load of 1.00% is payable if Units are redeemed / switched-out within 1 year from the date of allotment. • No Exit Load is payable if Units are redeemed / switched-out after 1 year from the date of allotment.
For further details on load structure, please refer to the Scheme Information Document/Key information memorandum of theScheme.
Benchmark CRISIL Balanced Fund Index
Additional Benchmark Nifty 50 Index
Product Features – HDFC Balanced Fund
$ Dedicated Fund Manager for Overseas Investments: Mr Rakesh VyasFor further details, please refer to the Scheme Information Document. 17

Asset Allocation Pattern – HDFC Balanced Fund
Types of Instruments
Normal Allocation
(% of Net Assets)
Normal Deviation
(% of Normal Allocation)
Risk Profile
Equities & Equity related instruments 60 20 Medium to High
Debt Securities (including securitized debt) and Money Market instruments
40 30 Low to medium
Under normal circumstances, the asset allocation of the Scheme’s portfolio will be as follows:
For further details, refer SID and KIM available on www.hdfcfund.com and at Investor Service Centres of HDFC Mutual Fund
18

Product Features – HDFC Prudence Fund
Type of Scheme Open-ended Balanced Scheme
Inception Date
(Date of allotment)February 01, 1994
Investment Objective
To provide periodic returns and capital appreciation over a long period of time, from a judicious mix of equity and debtinvestments, with the aim to prevent / minimize any capital erosion. Under normal circumstances, it is envisaged that the debt: equity mix would vary between 25:75 and 40:60 respectively. This mix may achieve the investment objective, may result inregular income, capital appreciation and may also prevent capital erosion.
Fund Manager $ Prashant Jain
Plans Direct Plan and Regular Plan
Sub-Options Under Each Plan: Growth & Dividend. The Dividend Option offers Dividend Payout and Reinvestment facility.
Minimum Application Amount
(Under Each Plan/Option)
Purchase: Rs. 5,000 and any amount thereafter
Additional Purchase: Rs. 1,000 and any amount thereafter
Load Structure
Entry Load:• Not Applicable. Upfront commission shall be paid directly by the investor to the ARN Holder (AMFI registered
Distributor) based on the investors’ assessment of various factors including the service rendered by the ARN Holder.
Exit Load:• In respect of each purchase / switch-in of Units, upto 15% of the units may be redeemed without any exit load from
the date of allotment.• Any redemption in excess of the above limit shall be subject to the following exit load:
• Exit Load of 1.00% is payable if Units are redeemed / switched-out within 1 year from the date of allotment. • No Exit Load is payable if Units are redeemed / switched-out after 1 year from the date of allotment.
For further details on load structure, please refer to the Scheme Information Document/Key information memorandum of theScheme.
Benchmark Index CRISIL Balanced Fund Index
For further details, refer SID and KIM available on www.hdfcfund.com and at Investor Service Centres of HDFC Mutual Fund$ Dedicated fund manager for overseas investments Mr. Rakesh Vyas
19

Asset Allocation Pattern – HDFC Prudence Fund
Under normal circumstances, the asset allocation (% of net assets) of the Scheme’s portfolio will be as follows:
Types of Instruments Normal Allocation (%) Risk Profile
Equity and Equity relatedinstruments
40% – 75% max High
Debt and Money MarketInstruments*
25% - 60% max Low to Medium
For further details, refer SID and KIM available on www.hdfcfund.com and at Investor Service Centres of HDFC Mutual Fund
20
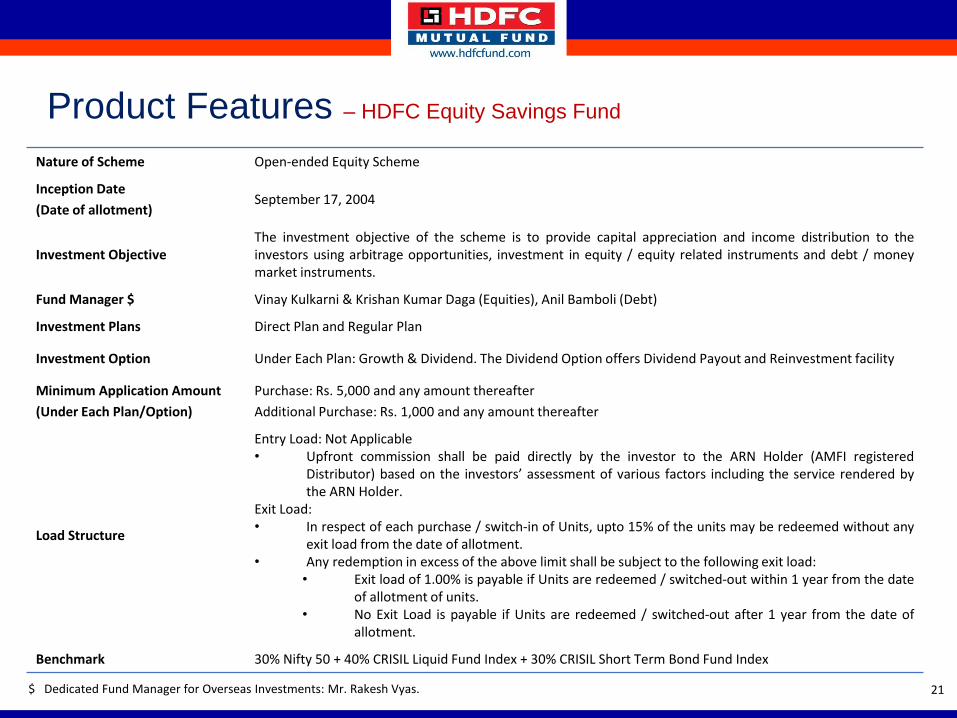
Nature of Scheme Open-ended Equity Scheme
Inception Date
(Date of allotment)September 17, 2004
Investment ObjectiveThe investment objective of the scheme is to provide capital appreciation and income distribution to theinvestors using arbitrage opportunities, investment in equity / equity related instruments and debt / moneymarket instruments.
Fund Manager $ Vinay Kulkarni & Krishan Kumar Daga (Equities), Anil Bamboli (Debt)
Investment Plans Direct Plan and Regular Plan
Investment Option Under Each Plan: Growth & Dividend. The Dividend Option offers Dividend Payout and Reinvestment facility
Minimum Application Amount
(Under Each Plan/Option)
Purchase: Rs. 5,000 and any amount thereafter
Additional Purchase: Rs. 1,000 and any amount thereafter
Load Structure
Entry Load: Not Applicable• Upfront commission shall be paid directly by the investor to the ARN Holder (AMFI registered
Distributor) based on the investors’ assessment of various factors including the service rendered bythe ARN Holder.
Exit Load:• In respect of each purchase / switch-in of Units, upto 15% of the units may be redeemed without any
exit load from the date of allotment.• Any redemption in excess of the above limit shall be subject to the following exit load:
• Exit load of 1.00% is payable if Units are redeemed / switched-out within 1 year from the dateof allotment of units.
• No Exit Load is payable if Units are redeemed / switched-out after 1 year from the date ofallotment.
Benchmark 30% Nifty 50 + 40% CRISIL Liquid Fund Index + 30% CRISIL Short Term Bond Fund Index
$ Dedicated Fund Manager for Overseas Investments: Mr. Rakesh Vyas. 21
Product Features – HDFC Equity Savings Fund
21

Under normal circumstances, the asset allocation of the scheme’s portfolio will be as follows:
Asset Allocation Pattern – HDFC Equity Savings Fund
Types of InstrumentsMinimum
(% of Net Assets)Maximum Risk Profile
Equities & Equity related instruments 65 90 Medium to High
Of which net long equity* 15 40 Medium to High
Of which Derivatives including index futures, stock futures, index options etc.**
25 75 Low to Medium
Debt instruments & Money Market instruments #$ 10 35 Low to Medium
* This net long equity exposure is aimed to gain from potential capital appreciation and thus is a directional equity exposure which will not be hedged. This equityexposure means exposure to equity shares alone without a corresponding equity derivative exposure. ** The exposure to derivative shown in the above assetallocation table would normally be the exposure taken against the underlying equity investments and in such case, exposure to derivative will not be considered forcalculating the gross exposure. # Investments in securitised debt, if undertaken, shall not exceed 35% of net assets of the Scheme.
$ Investments in derivatives shall not exceed 50% of the asset allocation stipulated above. Exposure to Derivatives may be taken to hedge the portfolio, rebalance thesame or to undertake any other strategy as permitted under SEBI (MF) Regulations from time to time. The margin money deployed on these positions (both equityand / or debt derivatives) would be included in Money Market category. ^The Scheme may seek investment opportunity in ADR / GDR and Foreign Securities, inaccordance with guidelines stipulated in this regard by SEBI and RBI from time to time. Under normal circumstances, the Scheme shall not have an exposure of morethan 50% of its assets in foreign ADR / GDR and Foreign Securities. The cumulative gross exposure through debt, equity and derivative positions shall not exceed 100%of the net assets of the scheme in accordance with SEBI Cir/IMD/DF/11/2010 dated August 18, 2010.
For further details refer SID/KIM 22

Past performance may or may not be sustained in the future. Returns greater than 1 year period are compounded annualized (CAGR). The above returns are of regular plan - growthoption. $ Adjusted for bonus units declared under the scheme # The Scheme is co-managed by Chirag Setalvad and Miten Lathia. +The Scheme is co-managed by Chirag Setalvad(Equities) and Anil Bamboli (Debt). @Scheme performance may not strictly be comparable with that of its Additional Benchmark in view of balanced nature of the scheme where aportion of scheme's investments are made in debt instruments. ^Scheme performance may not strictly be comparable with that of its Additional Benchmark in view of hybrid nature ofthe scheme where a portion of scheme's investments are made in equity instruments. @@ Open Ended Equity Linked Savings Scheme with a lock-in period of 3 years. Load is nottaken into consideration for computation of performance. 1. Benchmark. 2. Additional Benchmark. NAV at Inception for all the above schemes was Rs 10.
Scheme Performance Summary
23
31 Mar 2015 to
31 Mar 2016
31 Mar 2014 to
31 Mar 2015
28 Mar 2013 to
31 Mar 2014
Since Inception
CAGR (in %)
HDFC Balanced Fund @ 11-Sep-00 106.336 -1.04 45.00 22.00 16.41 1,06,336
CRISIL Balanced Fund Index1 -2.90 22.53 13.29 NA NA
Nifty 50 Index2 -8.86 26.65 17.82 11.33 53,136
HDFC Mid- Cap Opportunities Fund 25-Jun-07 36.250 -1.36 63.36 30.24 15.81 36,250
Nifty Midcap 100 Index1 -1.91 50.96 16.22 9.34 21,885
Nifty 50 Index2 -8.86 26.65 17.82 7.04 18,168
HDFC Capital Builder Fund# 1-Feb-94 194.378 -2.55 43.20 23.22 14.32 1,94,378
Nifty 500 Index1 -7.54 33.56 17.56 8.47 60,708
Nifty 50 Index2 -8.86 26.65 17.82 8.65 62,917
HDFC Long Term Advantage Fund @@ 2-Jan-01 227.114 -4.92 34.36 23.83 22.72 2,27,114
S&P BSE SENSEX 1 -9.36 24.89 18.68 12.83 63,057
Nifty 50 Index2 -8.86 26.65 17.82 12.57 60,846
HDFC Small and Mid Cap Fund 3-Apr-08 25.244 -0.93 40.92 22.55 12.28 25,244
Nifty Smallcap 100 Index1 -13.13 52.27 17.69 3.57 13,236
Nifty 50 Index2 -8.86 26.65 17.82 6.23 16,218
HDFC Children's Gift Fund - Investment Plan $ @ 2-Mar-01 81.827 -2.09 37.36 25.83 16.96 1,06,375
CRISIL Balanced Fund Index1 -2.90 22.53 13.29 NA NA
Nifty 50 Index2 -8.86 26.65 17.82 12.51 59,237
HDFC Children's Gift Fund - Savings Plan $ ^ 2-Mar-01 37.018 4.23 23.31 9.00 10.97 48,123
CRISIL MIP Blended Index1 5.67 16.45 6.46 NA NA
CRISIL 10 Year Gilt Index2 7.97 14.57 -0.95 NA NA
HDFC Multiple Yield Fund- Plan 2005 +^ 17-Aug-05 25.766 4.42 16.85 11.37 9.31 25,766
CRISIL MIP Blended Index1 5.67 16.45 6.46 8.12 22,915
CRISIL 1 Year T - Bill Index27.69 8.74 5.79 6.13 18,824
Scheme
NAV as
on 31 Mar
2016
Value of
investment of
Rs. 10,000
Since Inception
Other Funds Managed by Chirag Setalvad, Fund Manager of HDFC Balanced Fund
Discrete Returns in %
Inception Date

Past performance may or may not be sustained in the future. Returns greater than 1 year period are compounded annualised (CAGR). The above returns are ofregular plan - growth option. $All dividends declared prior to the splitting of the Scheme into Dividend & Growth Options are assumed to be reinvested in theunits of the Scheme at the then prevailing NAV (ex-dividend NAV). #The Scheme is co-managed by Prashant Jain and Srinivas Rao Ravuri. +The Scheme is co-managed by Prashant Jain (Equities) and Shobhit Mehrotra (Debt). @Scheme performance may not strictly be comparable with that of its Additional Benchmark inview of balanced nature of the scheme where a portion of scheme's investments are made in debt instruments. ^Scheme performance may not strictly becomparable with that of its Additional Benchmark in view of hybrid nature of the scheme where a portion of scheme's investments are made in equityinstruments. 1. Benchmark 2. Additional Benchmark
Scheme Performance Summary
24
31 Mar 2015 to
31 Mar 2016
31 Mar 2014 to
31 Mar 2015
28 Mar 2013 to
31 Mar 2014
Since
Inception
CAGR (in %)
HDFC Prudence Fund$ 1-Feb-94 353.360 -6.05 41.84 19.03 18.81 4,56,708
CRISIL Balanced Fund Index1 -2.90 22.53 13.29 NA NA
Nifty 50 Index2 -8.86 26.65 17.82 8.65 62,917
HDFC Equity Fund $ 1-Jan-95 416.701 -11.29 41.49 22.25 19.18 4,16,701
Nifty 500 Index1 -7.54 33.56 17.56 9.17 64,522
Nifty 50 Index2 -8.86 26.65 17.82 NA NA
HDFC Top 200 Fund $ 11-Oct-96 309.109 -9.80 35.11 20.31 20.48 3,76,899
S&P BSE 2001 -7.86 31.93 17.04 12.77 1,03,951
S&P BSE SENSEX2 -9.36 24.89 18.68 11.28 80,183
HDFC Infrastructure Fund#$ 10-Mar-08 13.871 -16.99 58.70 10.91 4.14 13,871
Nifty 500 Index1 -7.54 33.56 17.56 6.35 16,426
Nifty 50 Index2 -8.86 26.65 17.82 6.10 16,120
HDFC MIP Long Term Plan $+ 26-Dec-03 35.437 2.46 21.49 8.50 10.86 35,437
CRISIL MIP Blended Fund Index1 5.67 16.45 6.46 7.66 24,748
Nifty 50 Index2 7.97 14.57 -0.95 5.27 18,771
Scheme
NAV as on 31
Mar 2016
Discrete Returns in % Value of
investment of
Rs. 10,000
Since
Other Funds Managed by Prashant Jain, Fund Manager of HDFC Prudence Fund
Inception
Dates

DISCLAIMER / RISK FACTORS
This document is dated 20th June 2016. The views expressed herein are based on the basis of internaldata, publicly available information and other sources believed to be reliable. Any calculations made areapproximations, meant as guidelines only, which you must confirm before relying on them. Theinformation contained in this document is for general purposes only and is not an offer to sell or asolicitation to buy/sell any mutual fund units/securities. The document is given in summary form anddoes not purport to be complete. The document does not have regard to specific investment objectives,financial situation and the particular needs of any specific person who may receive this document. Theinformation/ data herein alone are not sufficient and should not be used for the development orimplementation of an investment strategy. The same should not be construed as investment advice toany party. The statements contained herein are based on our current views and involve known andunknown risks and uncertainties that could cause actual results, performance or events to differmaterially from those expressed or implied in such statements. Neither HDFC Asset ManagementCompany (HDFC AMC) and HDFC Mutual Fund (the Fund) nor any person connected with them, acceptsany liability arising from the use of this document. The recipient(s) before acting on any informationherein should make his/her/their own investigation and seek appropriate professional advice and shallalone be fully responsible / liable for any decision taken on the basis of information contained herein.
MUTUAL FUND INVESTMENTS ARE SUBJECT TO MARKET RISKS, READ ALL SCHEME RELATED DOCUMENTS CAREFULLY.
25

Thank You
26


![Hdfc Mutual Fund Auto Saved]](https://static.fdocuments.in/doc/165x107/577d260d1a28ab4e1ea02953/hdfc-mutual-fund-auto-saved.jpg)


