Stay Alert - Paessler Alert product. However, as this test was related to ... work, but the PRTG...
8
Stay Alert product. However, as this test was related to software solutions, Nagios and its derivatives had to stay on the sidelines. The following prod- ucts, however, were in the running: Ipswitch’s WhatsUp Gold Premium, ManageEngine’s Op- Manager, Paessler’s PRTG Network Monitor and Solarwinds’ Orion Network Performance Moni- tor. Paessler PRTG Network Monitor Version 9 Development at Paessler has been taking huge strides forward. The version number of this su- perb network monitoring software has gone up an entire integer before the dot since our last test about a year ago: the soon-to-come version of PRTG Network Monitor is version 9. We’ve already had the opportunity to test the first re- lease candidate, and we liked what we saw. The software setup was executed quickly and simply, as usual: the PRTG Network Moni- tor was on the test machine’s hard drive in less than two minutes, and that was that. Special requirements, like a functioning Microsoft SQL server or MySQL installation, for example, are not necessary. Contrary to many other monitor- ing packages, the program doesn’t use these at all. One part of the setup, however, does require attention: the PRTG Network Monitor can be installed in single or cluster mode. The single REPRINT Today, network infrastructure is considered one of the most critical elements of every business strategy. There are hardly few companies that can function without the permanent availability of business applications, and thus, the technol- ogy, that those deliver. This requires that all in- volved components be monitored proactively by the IT department of every company, whether small or large. Only through constant monitor- ing can failures be avoided or, at the very least, quickly rectified with minimal impact on produc- tivity. Modern network monitoring products are the tools that allow IT personnel to feel the pulse of the network and its components. Today, these tools are extremely high performing, are gener- ally easily procurable and operable, and are af- fordable for businesses of any size. funkschau tested four representatives of this product cat- egory. Products were found that were not only procurable and applicable for large companies with full-blown IT departments, but that should be perfectly usable in small or medium-sized companies with only two or three IT “all-round- ers.” Because of this, products like Nagios, for example, were out of the running. This popular product has its strengths, but simple procure- ment is not one of them. Nagios is better suited to smaller companies when applied as an appli- ance -- the Sonarplex appliance from Azeti Net- works, for example, is a brilliant Nagios-based mode is suitable for smaller network environ- ments or for beginners who first want to gain experience with the product. In cluster mode, the administrator installs the product on two or more servers and is thus able to obtain a high availability installation with automatic failover, load distribution and the ability to operate moni- toring from various locations. One part of the setup process troubled us, in spite of its straightforwardness. The computer was restarted at the end of the installation rou- tine, and we weren’t sure that we had received any warning. The administrator is required to create a device in the PRTG configuration for every physical de- vice in the network that should be monitored. Sensors must then be assigned to these devices, each of which monitors a specific aspect of the network or device. This sounds like a load of work, but the PRTG Network Monitor is able to complete this assignment automatically -- more on that later. First, to the monitoring or object hierarchy: all objects in a PRTG monitoring configuration are organized in a tree-like hierarchy, which presents an easy-to-navigate list. Users can create object groups that monitor similar devices, services, or a single location. The hierarchy also serves to define standardized settings for larger object groups, as settings can be inherited within the hierarchy. The root group is at the top of the Issue 20/2011 October 21, 2011 Network monitoring software informs users of the state of their network hardware, services, and app- lications in real time. Network monitoring pack- ages are indispensable tools for every adminis- trator; businesses cannot afford to recognize im- minent problems too late.
Transcript of Stay Alert - Paessler Alert product. However, as this test was related to ... work, but the PRTG...
- 1 -
Stay Alert
product. However, as this test was related to software solutions, Nagios and its derivatives had to stay on the sidelines. The following prod-ucts, however, were in the running: Ipswitch’s WhatsUp Gold Premium, ManageEngine’s Op-Manager, Paessler’s PRTG Network Monitor and Solarwinds’ Orion Network Performance Moni-tor.
Paessler PRTG Network Monitor Version 9Development at Paessler has been taking huge strides forward. The version number of this su-perb network monitoring software has gone up an entire integer before the dot since our last test about a year ago: the soon-to-come version of PRTG Network Monitor is version 9. We’ve already had the opportunity to test the first re-lease candidate, and we liked what we saw.
The software setup was executed quickly and simply, as usual: the PRTG Network Moni-tor was on the test machine’s hard drive in less than two minutes, and that was that. Special requirements, like a functioning Microsoft SQL server or MySQL installation, for example, are not necessary. Contrary to many other monitor-ing packages, the program doesn’t use these at all. One part of the setup, however, does require attention: the PRTG Network Monitor can be installed in single or cluster mode. The single
REPRINT
Today, network infrastructure is considered one of the most critical elements of every business strategy. There are hardly few companies that can function without the permanent availability of business applications, and thus, the technol-ogy, that those deliver. This requires that all in-volved components be monitored proactively by the IT department of every company, whether small or large. Only through constant monitor-ing can failures be avoided or, at the very least, quickly rectified with minimal impact on produc-tivity.
Modern network monitoring products are the tools that allow IT personnel to feel the pulse of the network and its components. Today, these tools are extremely high performing, are gener-ally easily procurable and operable, and are af-fordable for businesses of any size. funkschau tested four representatives of this product cat-egory. Products were found that were not only procurable and applicable for large companies with full-blown IT departments, but that should be perfectly usable in small or medium-sized companies with only two or three IT “all-round-ers.” Because of this, products like Nagios, for example, were out of the running. This popular product has its strengths, but simple procure-ment is not one of them. Nagios is better suited to smaller companies when applied as an appli-ance -- the Sonarplex appliance from Azeti Net-works, for example, is a brilliant Nagios-based
mode is suitable for smaller network environ-ments or for beginners who first want to gain experience with the product. In cluster mode, the administrator installs the product on two or more servers and is thus able to obtain a high availability installation with automatic failover, load distribution and the ability to operate moni-toring from various locations.
One part of the setup process troubled us, in spite of its straightforwardness. The computer was restarted at the end of the installation rou-tine, and we weren’t sure that we had received any warning.
The administrator is required to create a device in the PRTG configuration for every physical de-vice in the network that should be monitored. Sensors must then be assigned to these devices, each of which monitors a specific aspect of the network or device. This sounds like a load of work, but the PRTG Network Monitor is able to complete this assignment automatically -- more on that later.
First, to the monitoring or object hierarchy: all objects in a PRTG monitoring configuration are organized in a tree-like hierarchy, which presents an easy-to-navigate list. Users can create object groups that monitor similar devices, services, or a single location. The hierarchy also serves to define standardized settings for larger object groups, as settings can be inherited within the hierarchy. The root group is at the top of the
Issue 20/2011 October 21, 2011
Network monitoring software informs users of the state of their network hardware, services, and app- lications in real time. Network monitoring pack- ages are indispensable tools for every adminis- trator; businesses cannot afford to recognize im-minent problems too late.

- 2 -
funkschau Issue 20/2011 • October 21, 2011
Monitoring Software Test ProcedureEach of the four products was in-stalled in a network in which mul-tiple Windows Server 2003/2008 machines, a Microsoft Exchange Server and a Microsoft SQL Server 2008 carried out their usual regular services. The machines in the net-work were connected to each other via Fast Ethernet Switches and SMC WLAN routers. The client machines ran on various operating systems in-cluding Windows XP, Windows 7 and Linux (OpenSUSE). TCP/IP, DNS, POP3, SMTP, IMAP, SNMP, HTTP, HTTPS and FTP were among the executed servic-es and protocols in the network. After the first installation and -- where necessary -- configuration, we let the monitoring program explore the net-work and collect information about the installed devices, services, appli-cations and protocols. Afterwards, threshold values were set and actions to be executed were defined. We investigated whether the program would recognize exceeded thresh-olds, changed system conditions and performance breaks and react as planned. The price-performance re-lationship, user-friendliness and the way in which the product supported monitoring of spatially distributed networks were evaluated.
hierarchy, containing all setup objects. Settings on this level apply to all objects. Every other group is a part of a probe. A probe is the platform on which monitor-ing takes place. All objects configured un-der a probe are monitored via this probe. Each PRTG core installation automatically creates a local probe, and administra-tors are able to create additional probes or remote probes for monitoring remote devices outside of the network. Each probe contains one or more groups that, as mentioned above, combine objects. Probes and/or groups contain the devices to be monitored, like file or web servers,
client computers, routers and switches, or nearly every device in the network that has its own IP address. PRTG auto-matically adds a so-called probe device to the local probe. This probe device is an internal system device that uses various sensors to monitor the parameters of the computer on which the probe itself runs. Sensors can be added to every device, each of which monitors a specific aspect of the device. This could include, for ex-ample, network services like SMTP, FTP or HTTP, switch port traffic, the computer’s processor load or a NetFlow device. Each sensor comes with a series of channels,
PRTG’s colorful new welcome screen makes the introduction into network monitoring easy. It takes little imagination to find your way in the updated WebGUI.
Pict
ure:
Pae
ssle
r
PRTGs libraries make it easy for administrators to concentrate on important devices and services.
Pict
ure:
Pae
ssle
r
over which it receives the different data streams. Of course, the new version comes with several new sensors, of which a two-way QoS sensor, WMI security sen-sor and manufacturer-specific hardware sensors for Dell, HP and APS systems are especially worth mentioning.
The system is already well arranged and easy to navigate due to the hierarchically arranged objects, and can be used and displayed according to functional char-acteristics. However, the user experiences further enhancement with version 9’s newly implemented libraries. These librar-ies are available to help users create their own “trees.” This improves the overview and leads to higher speeds for large in-stallations. The tree view within the library is very interactive. The user can move or copy monitoring objects in trees or librar-ies using drag & drop to quickly and easily compile a collection that contains only the specific objects that he wants to monitor.
After setting up the program, two new links appear on the desktop or in the Win-dows Start menu, “PRTG Network Moni-
Issue 20/2011 • October 21, 2011 funkschau
- 3 -
tor” and “PRTG Enterprise Console.” The PRTG Enterprise Console is the former Windows GUI, which has certainly un-dergone significant improvement. It now supports simultaneous display of data from multiple PRTG core installations. In other words: all monitoring data is dis-played in a single program, even with large setups. The console contains many additional new features and offers nearly the entire functionality of WebGUI; nev-ertheless, the WebGUI of the PRTG Net-work Monitor will definitely remain the preferred working environment for most administrators.
The entire web interface has been jazzed up, not only visually, but technical-ly as well. Of course, the new look is the first to catch the user’s eye. Everything has been made more accommodating, and new icons make navigation even more intuitive. Several new functions increase productivity, including multi-edit for sen-sor channel settings, acknowledging an alert and pausing sensors for a specific time period, or even the newly written Welcome Assistant, which improves user guidance right from the initial setup. The Welcome page makes it impossible to miss the tip to change the administrator password and switch on SSL encryption for the PRTG website. It was a bit annoy-ing, however, that we weren’t able to get rid of the password tip even after chang-ing the password. The pages regarding editing the notification trigger, the sensor selection and the configuration have been
rewritten as well. All of these are now much more clearly arranged and easier to use. Updated Ajax functionality makes for improved speed and Google Chrome browsers are now better supported by of-fering desktop notifications.
One of the first exercises after the PRTG setup was adding the devices to be moni-tored. This is most simply done using the automatic network search, which can be started directly from the Welcome page. The search can be performed via lists of individual IP addresses, IP address ranges with a given base address, IP addresses plus subnet information, IP addresses with octet ranges and most recently, lists of IPv6 addresses. PRTG does not only re-turn the IP addresses and DNS names of found devices, but attempts to determine the manufacturer of the device using the MAC address. Of course, this search rou-tine does not merely find devices in the network. It also installs suitable sensors on the device as desired. Allowing the routine to do this is highly recommended, although the entire discovery takes quite some time in a large network. For faster results, the user can simply let the routine find devices and later add sensors manu-ally, or allow only selected sensors to be added by using device templates. The automatic search uses mainly Ping, SNMP and WMI and functions only in the LAN. The search can also be started and repeat-ed automatically according to a schedule; previously found devices can be skipped as desired.
The PRTG Network Monitor’s alert sys-tem functions flawlessly. Alerts and warn-ings are clearly reported by the program and are meticulously logged. Administra-tors that are not constantly at the console receive notifications via email and/or text message. The program is generally very communicative and is constantly provid-ing useful information and assistance.
Ipswitch WhatsUp Gold 15WhatsUp Gold is an independent moni-toring product that monitors the status of network devices and services, sending alerts and initiating actions if deviations from the norm are discovered. The prod-uct is only really rounded out, however, when supplemented with other products from the WhatsUp Gold product family, like the WhatsUp Flow Monitor, for exam-ple, as support for NetFLow, with Whats-Connected for layer 2/3 network discovery and topology mapping or WhatsVirtual, which contributes additional aptitude for monitoring VMware environments. And on top of that, WhatsUp Gold itself, which is effectively the basic product, is available in four different editions, which
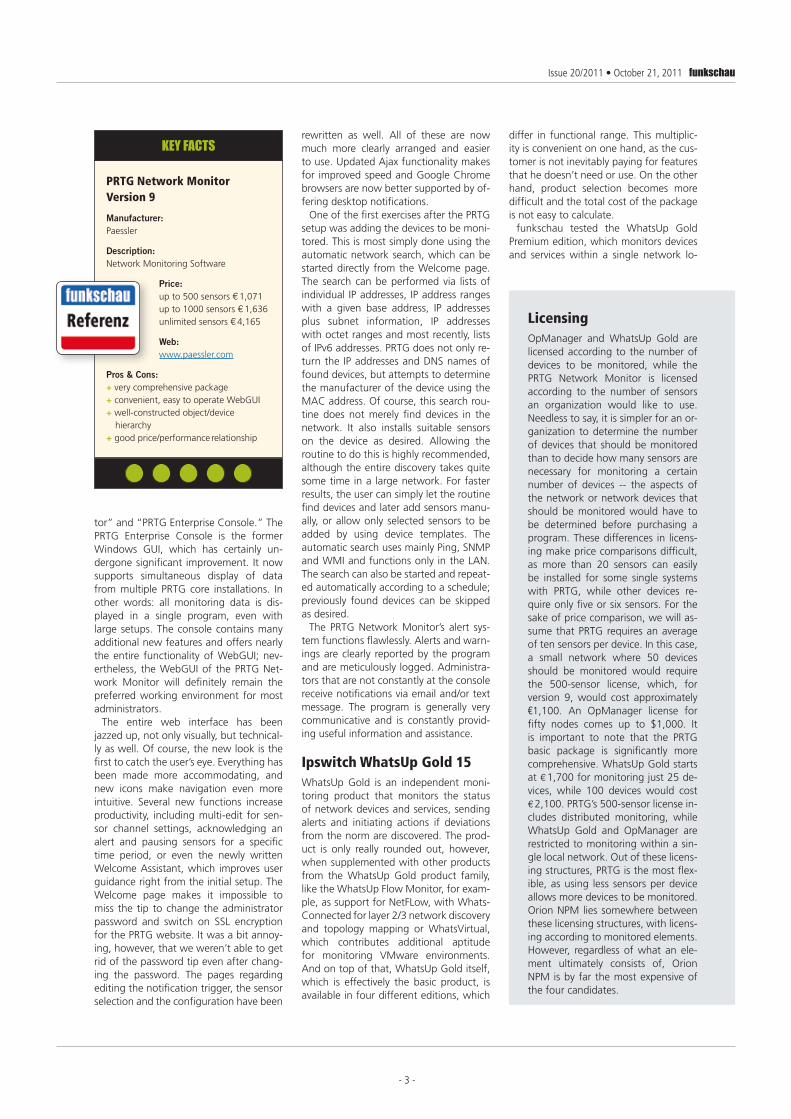
LicensingOpManager and WhatsUp Gold are licensed according to the number of devices to be monitored, while the PRTG Network Monitor is licensed according to the number of sensors an organization would like to use. Needless to say, it is simpler for an or-ganization to determine the number of devices that should be monitored than to decide how many sensors are necessary for monitoring a certain number of devices -- the aspects of the network or network devices that should be monitored would have to be determined before purchasing a program. These differences in licens-ing make price comparisons difficult, as more than 20 sensors can easily be installed for some single systems with PRTG, while other devices re-quire only five or six sensors. For the sake of price comparison, we will as-sume that PRTG requires an average of ten sensors per device. In this case, a small network where 50 devices should be monitored would require the 500-sensor license, which, for version 9, would cost approximately €1,100. An OpManager license for fifty nodes comes up to $1,000. It is important to note that the PRTG basic package is significantly more comprehensive. WhatsUp Gold starts at € 1,700 for monitoring just 25 de-vices, while 100 devices would cost € 2,100. PRTG’s 500-sensor license in-cludes distributed monitoring, while WhatsUp Gold and OpManager are restricted to monitoring within a sin-gle local network. Out of these licens-ing structures, PRTG is the most flex-ible, as using less sensors per device allows more devices to be monitored. Orion NPM lies somewhere between these licensing structures, with licens-ing according to monitored elements. However, regardless of what an ele-ment ultimately consists of, Orion NPM is by far the most expensive of the four candidates.
PRTG Network Monitor Version 9
Manufacturer: Paessler
Description: Network Monitoring Software
Price: up to 500 sensors € 1,071 up to 1000 sensors € 1,636 unlimited sensors € 4,165
Web: www.paessler.com
Pros & Cons: + very comprehensive package + convenient, easy to operate WebGUI + well-constructed object/device hierarchy + good price/performance relationship
KEY FACTSdiffer in functional range. This multiplic-ity is convenient on one hand, as the cus-tomer is not inevitably paying for features that he doesn’t need or use. On the other hand, product selection becomes more difficult and the total cost of the package is not easy to calculate.
funkschau tested the WhatsUp Gold Premium edition, which monitors devices and services within a single network lo-

- 4 -
funkschau Issue 20/2011 • October 21, 2011
cation, offers extended management for Microsoft Exchange, Microsoft SQL and SMTP Mail servers, delivers performance data in real-time and supports applica-tion monitoring via Microsoft’s WMI. This edition does not support monitoring of remote networks from a central location; for that, Ipswitch offers the expensive Dis-tributed edition or the MSP edition, which is intended for solution providers.
The 300 MByte downloadable WhatsUp Gold Premium package is heavyweight, but WhatsConnected is included. Before the administrator starts installation, the network or network devices should be prepared in that SNMP and/or WMI are enabled. If this is not done, the results of the later Network discovery will turn out to be very modest. The setup for the test does not cause any difficulties itself, but does take relatively long, although it does not take quite as long as Orion NPM. If the user chooses a typical setup, the setup routine automatically installs Micro-soft SQL Server Express (2005), which the product uses for data storage. This server, however, would not start in the test set-up. A second, user-defined setup allowed us to select Microsoft SQL Server 2008, which was installed on the test machine, and proved to be more successful.
At the end of the setup routine, a web interface starts automatically, which pre-sents a kind of assistant. The user can ask simple questions about the desired ad-ministrator password and email settings, for example. Then comes the network discovery, which functions via IP Address ranges or executes a SNMP smart scan. Here we saw a problem: every administra-tor expects the network discovery to start with a simple click. With the standard settings, the routine finds all devices and performs name resolution flawlessly, but no performance monitors or active and passive monitors are installed or activated for the discovered devices. For those who want more than to poll the devices using Ping, many monitors must be manually assigned. This is unpleasant, even though it can be executed as a bulk operation. On top of that, it is unnecessary, as exactly this assignment can actually be performed automatically and relatively easily. The de-vice roles in the WhatsUp Gold console simply need to be adjusted. In the course of this adjustment, the user simply speci-fies the performance monitors as well as the active and passive monitors that he would like to have activated automatically according to the device’s role. He can also configure actions, such as setting up how he would like to be alerted when Whats- Up Gold discovers an error on a device. These settings cannot be executed via the Web Discovery console, which makes it
rather absurd that Ipswitch automatically presents exactly this console at the end of the setup.
The new setup/configuration dialog and the new WebGUI for Version 15 are very posh and modern, and the web interface is comfortable and efficient to use. Ac-cording to the network discovery via Win-dows or web console, the home work-
The web interface for WhatsUp Gold hasn’t only improved visually, it also has new load counters. Virtualization and wireless links, however, only make sense with existing VMware installations or Cisco AiroPeek products.
Picture: Ipswitch
space exhibits several summary counters that show, for example, the number of monitored devices, the number of run-ning and failed devices and interfaces or the number of devices in service mode. Navigation to other views, including de-vice and monitoring views, logs, or the alert center, is quick and easy. Ipswitch describes the new WebGUI as a task-
WhatsUp Gold’s map view could use some improvement. If the user doesn’t adjust the layout manually, the labels are nearly undecipherable.
Picture: Ipswitch

Issue 20/2011 • October 21, 2011 funkschau
- 5 -
oriented interface, which is completely accurate.
WhatsUp Gold displays a tree structure in the device view with the heading “My Network.” Several dynamic groups are found here, including “All Devices,” “All Routers,” “Cisco Devices” or “Windows Devices” and other device groups for each executed network discovery. The se-lected group is displayed by the program in a detail or map view. In connection with WhatsConnected, WhatsUp Gold executes layer 2 discovery and mapping. In this case, the map view displays the relationships between the devices graphi-cally. The standard map view is, however, anything but clear, as headings are par-tially overlapping and descriptions of the devices and their roles, displayed using icons, are tiny and hardly decipherable. The automatic spacing between icons and the font size should be improved here. Apart from that, these maps are in-teractive and errors are marked red, just as they should be.
WhatsUp Gold polls devices in the net-work regularly in order to identify status changes. The program uses the previously mentioned monitors for this. Performance monitors keep track of the resources of a device including disks, interfaces and stor-age. Examples of active monitors are Ping, DNS, HTTP and interface monitors, while passive monitors include SNMP traps, Sys-log and the Windows Event Log. Whats-
Up Gold will execute actions dependent on the poll results; for example, notifying the administrator or restarting a service. Ipswitch had already updated the alert center in WhatsUp Gold Version 14; it still functions flawlessly. The program can also monitor virtual infrastructures (with WhatsVirtual), but is limited to VMware. It behaves similarly with wireless networks, where WhatsUp Gold revolves around Cisco Aeronet products.
WhatsUp Gold’s dashboard application is unique among all tested products. This independent application, available as a part of the complete package starting from the Premium edition, runs repeat-edly through and displays report pages of the WhatsUp Gold web interface. Admin-istrators thus gain continuous insight into the condition and health of the network. The administrator must first determine which pages should be displayed in a type of “playlist,” but this isn’t difficult, and these settings can be saved.
WhatsUp Gold comes with a series of ad-ditional tools, among which are an SNMP MIB Walker and file explorer, traceroute, Lookup, a web performance monitor and task manager as well as a diagnosis tool, which executes numerous system and ap-plication checks and creates a report from the results. In addition, a complete TFTP server application is included, which left a good impression, except for the constant “Try WhatsConfigured” commercials.
SolarWinds Orion Network Performance Monitor 10.1The Orion Network Performance Moni-tor (Orion NPM for short) is SolarWinds’ flagship product and as such, focuses less on smaller network environments and more on application in larger company networks. As can be guessed from the product name, Orion NPM concentrates mainly on monitoring network perfor-mance. Network applications, for exam-ple, are not considered in the process. For a product that is more or less concen-trated on one specific task, it’s remarkable how large the package is -- none of the other tested products installed such a huge amount of files, services and individ-ual applications. Orion NPM is anything but streamlined, and users must consider this even while selecting a machine for the installation. SolarWinds recommends a minimum of 2 GHz dual core CPU, 2 GByte free hard drive storage -- on a RAID 1 drive, if possible -- and 3 GByte RAM. This sounds modest at first, but these recommendations evidently only apply to server systems on which other applica-tions and services are not run. SolarWinds explicitly recommends that Microsoft SQL
Server, necessary for operation of Orion NPM, should be run on a separate serv-er. The product makes similar demands on this server as well. First attempts at getting the product to run on a weaker system were given up quickly. The other competitors named similar minimum re-quirements to those of SolarWinds, but were more frugal in reality. Orion NPM runs flawlessly inside virtual machines un-der VMware or Microsoft Virtual Server as well. The same system requirements ap-ply for virtual machines as for the physical server.
As far as software is concerned, Orion NPM does not have any special require-ments. Windows Server 2003 or 2008 should be set as the operating system for productive operation with IIS, Net-Frame-work and SNMP Trap Service. SolarWinds recommends Internet Explorer from ver-sion 6 with active scripting or Firefox from version 3 as the web console browser. With Firefox, however, the toolset inte-gration is not supported. The Orion data-base requires Microsoft SQL Server 2005 SP1 or SQL Server 2008 Express, Stand-ard, or Enterprise. The setup routine auto-matically installs the 2005 Express Edition during a typical installation, or if an SQL server is not available. It’s a good thing, too, because the test setup on a Windows 7 machine (this Windows version is sup-ported by SolarWinds’ evaluation version) did not exactly want to cooperate with SQL Server 2008, which was already in-stalled on the machine.
We’ve already mentioned that Orion NPM concentrates on monitoring net-work performance. If an administrator would like to monitor the performance of his network applications or maintain the network configuration, he or she would need to fall back on a separate product or module. Optional expansions are also available for NetFlow traffic analysis, IP- Address and IP-SLA management and for many other tasks. Even without these expansions, Orion NPM is a complex prod-uct that requires patience even at setup. Installation and configuration of the basis system take a long time. The administra-tor themself doesn’t actually have to do anything during this process except wait.
Network discovery started automati-cally as soon as the setup finished, which searched the local sub network very quickly in the test. The discovery works perfectly, even identifying every single network interface as well as all protocols, and cleanly resolves all names. Thus, the first time the System Manager or web console is started, the user is not look-ing at nothing; instead, both user inter-faces are immediately populated. And not only that: Orion NPM had already started
WhatsUp Gold Premium v15
Manufacturer: Ipswitch
Description: Network Monitoring Software
Price: 25 devices € 1,712 100 devices € 2,102 300 devices € 3,896 500 devices € 5,846
Web: www.whatsupgold.com
Pros & Cons: + extremely comprehensive package (with options and plugins) + dashboard application – requires more adjustment and practice than other products – becomes very expensive if several options are required
KEY FACTS

- 6 -
funkschau Issue 20/2011 • October 21, 2011
working and the first performance infor-mation were available, which consisted mainly of response times and packet loss, availabilities, CPU loads and storage use as well as network adapter information (error and traffic charts). It is also possible to call up the first overarching network summary charts and “Top 10” summary charts. Keyword: charts -- Orion NPM loves to display different performance data graphically, and is good at it. Of course, detailed information can be called in tabular form as well.
Two user interfaces are available to the administrator; the system manager as a Windows-GUI and a web console. Most administrators will resort to the web console, which the manufacturer prefers to refer to as a LUCID interface. LUCID stands for Logical, Usable, Cus-tomizable, Interactive and Drill-down. These characteristics do apply to this web console, but they are characteristics that every web console for a management ap-plication should, and usually does, have, making this console nothing special. But Orion NPM’s web console allows simple navigation and is very user-friendly. It also enables data to be displayed and edited in graphs, tables, maps and “Top 10” lists. It is commendable that the interface also supports mobile browsers. This interface
is fun to work with; it is very reactive, well arranged, customizable and does not present the user with riddles, but quickly provides answers to questions regarding the condition of the network.
Several other new entries can be found in the Windows Start menu after the Orion NPM installation besides these two interfaces or applications. Among these are programs for adjusting the Orion NPM configuration, maintaining the database, manually starting network discovery and for the network atlas. Speaking of manu-ally starting network discovery: it isn’t actually necessary, as Orion NPM periodi-cally searches the network for changes, suggests new devices to the user for monitoring and allows the user to update network maps per drag & drop.
Orion NPM’s alert system is flexible, functioned as flawlessly as network dis-covery in the test, and is easy to use. Like the other products, Orion NPM generates alerts if an event occurs or a threshold is crossed. The program offers many options for reaction to alerts, among which are the regular notification options, an au-tomatic script or program execution and an escalation sequence. It is not difficult to configure network alerts. The product enables the administrator to define de-pendencies between devices or elements and to configure alerts for interrelated in-cidents and/or for conditions that remain constant over a specific time period. This sounds more complicated than it actu-ally is: the administrator configures the system in such a way that it does not sound the alarm as soon a CPU utiliza-tion exceeds 90%, for example, but only if the high utilization level stays constant
Orion NPM’s LUCID interface: Logical, Usable, Customizable, Interactive, Drill-down. A convenient web console that answers more questions than it creates.
Picture: Solarwinds
for five minutes. The message center acts as a control center and presents the alerts created in the network as well as all inci-dents, Syslog entries and traps.
Virtualization is still as much a trend as ever. Orion NPM is now not only able to be executed smoothly on virtual machines and used to monitor virtual data, but also supports monitoring of virtual infrastruc-tures. The product communicates directly with the VMware infrastructure and de-termines the server’s performance and health status. Support from VSAM and Fibre Channel for monitoring and report-ing is new and very welcome, as is the integration of a wireless polling device, which simplifies management of access points and the clients connected by these access points. Wireless and wired devices: network monitoring has become even more complete.
The standard installation of Orion NPM is by all means capable of monitoring more than 2000 elements, provided that the hardware is configured accordingly. An element can be a node, interface or volume. Additional polling engines can be added in order to successfully moni-tor more than 8000 elements. It is also possible and, according to the network size, occasionally necessary, to install ad-ditional web servers or to manage multi-ple instances of Orion NPM for distributed monitoring via the optional Enterprise Operations Console in an interface.
ManageEngine OpManager 8 (Build 8812)OpManager surprised us in a good way. We originally wanted to leave this moni-
Orion Network Performance Monitor 10.1
Manufacturer: SolarWinds
Description: Network Monitoring Software
Price: 100 elements € 2,015 250 elements € 4,460 500 elements € 6,905 unlimited elements € 20,350 Prices exclude options such as Enterprise Options console or scalability engines.
Web: www.solarwinds.com
Pros & Cons: + excellent web console (LUCID interface) + flexible alert system with central message center – drawn-out, not always problem-free setup – a size too large for smaller environments or inexperienced users
KEY FACTS

Issue 20/2011 • October 21, 2011 funkschau
- 7 -
toring software out of the comparison altogether, due to the multitude of prob-lems that arose in a similar test several years ago. We could not imagine that it would be very different this time. How-ever, ManageEngine has managed to improve its flagship product enormously in a short time. The setup, which previ-ously caused so much difficulty, worked straightaway, even on a Windows 7 com-puter. We selected the standard installa-tion with the included MySQL database software, which ran problem-free. A later installation on a Windows Server machine with Microsoft SQL Server 2008 ran flaw-lessly as well.
The installation was fast and required little user interaction. The “Read Me” file was displayed at the end of installation, which offers a good introduction to the system and attempts to sell several add-ons to the user. The OpManager services and web console can also be started on demand. It then continues with the net-work discovery, which is called “recogni-tion” here. The administrator has to make a few entries here, including standard reg-istration information for SNMP (SNMP 1, 2 and 3) and Windows devices, the services or ports that should be checked and the IP address range that should be searched. Recognition can also use imported files or CIDR instead of an IP range. Recognition is executed quickly by the program and presents the found devices in a tree struc-ture. This time, the network discovery
worked nearly perfectly. The program rec-ognized all device types except for a Linux system, although it still classified Win-dows 7 computers generally as “servers” -- other programs are more precise. The administrator can import all devices to the database with a single click, which are subsequently available in a wide variety of web console views. The web console, however, first displays the “Introduction” page, which quickly and succinctly takes the user through the first steps for man-
The device snapshot in the OpManager console displays the most important performance information as colorful charts. Not all administrators prefer this, but it is definitely clearly arranged.
Picture: Manage Engine
Videos and special text information make starting with OpManager easy.
Picture: Manage Engine
OpManager 8 (Build 8812)
Manufacturer: ManageEngine
Description: Network Monitoring Software
Price: (Professional Edition): 50 devices $ 995 250 devices $ 3,495 1000 devices $ 9,995 Prices exclude optional add-ons and plugins.
Web: www.manageengine.com
Pros & Cons: + very good user interface + quick, easy setup – becomes very expensive if several options are required
KEY FACTS
aging networks using text and/or video. Recognition is explained here (which has already been executed once by this point), as well as the dashboard, how device de-pendencies can be configured and how basis values for monitors, device types, interfaces, etc. can be set.
OpManager’s web console looks great, reacts quickly and is easy to navigate. This time, there were hardly opportunities for complaint with Windows 7 -- compat-ibility problems are now nonexistent.
- 8 -
funkschau Issue 20/2011 • October 21, 2011
Browsers other than Internet Explorer, including Firefox and Chrome, now work well with the program as well. The tab headings on the device snapshot page in Firefox overlap somewhat -- bothersome, but not exactly problematic. The many graphic displays and the automatically generated layer 2 and layer 3 maps are excellent. In the dashboard and device display, the console shows the device and service availability, response times, pack-et loss and CPU, storage and hard drive utilization. Problems including exceeding thresholds or failed or paused services are clearly displayed by the system. Of course, notifications can also be set, so that ad-ministrators can be alerted immediately of deviations from norms by email, text message, or even Twitter. The product is altogether very powerful and able to monitor networks, network devices and services, detect performance bottlenecks, alert administrators and generate reports, but in order to use OpManager to its full potential, many settings must be set up manually, as there are often no defaults (for example, for thresholds). However, it is not difficult to configure the various service, Windows service, URL, perfor-mance, process, file and folder monitors. There is one element that is rather asinine: the web console itself, including all field names and other labels, are displayed in perfect German, while the help is in Eng-lish. For German-speaking users, this is anything but helpful.
ManageEngine still offers OpManager in various editions with numerous add-ons and plugins. The VMware monitor, Cisco IPSLA monitor, exchange and MS SQL monitors, WAN and active directory monitors, the NetFlow analyzer plug-in and even the text message notification generator are all only available as special add-ons or plugins. This makes it difficult to calculate a final price for the product. It is, however, commendable that the prod-uct starts out free, just like PRTG, but the free version only monitors a maximum of ten nodes and is therefore only suitable for short product tests. For monitoring only 50 devices, the Professional Edition, which is effectively the basic package, costs $995, and 500 devices cost $5,995. An optional VMware monitor for up to ten virtual hosts is estimated at $1,495, while an exchange monitor is priced at $995. These are just a few price examples that demonstrate how quickly the costs of a complete solution can add up.
ResultsThe PRTG Network monitor remains the front-runner, with the OpManager fol-lowing as a close second. In spite of iden-tical A grades, OpManager “only” gets a recommendation, as this product is not quite on par with PRTG when it comes to pure monitoring and can become very expensive very quickly. This test was fo-cused on evaluating monitoring products
on their usability in small and middle-sized company environments, including small companies that do not have large IT departments. Here, Orion NPM, as a product of the enterprise class, does not fit as flexibly as PRTG and OpManager. We would absolutely recommend Orion NPM to experienced administrators that don’t shy away from large, complex prod-ucts, if their budgets can allow it. PRTG and Orion NPM each come with a mul-titude of sensors, which monitor a huge palette of system conditions, properties, performance values and other param-eters. They also use extensive amounts of information made available by SNMP and WMI. Both products are easy to operate. This also applies to OpManager, whereas we often found ourselves searching for certain functions or information when us-ing WhatsUp Gold. Administrators should generally schedule more time for learning the ropes with Orion NPM and WhatsUp Gold as for the other two products. Whats- Up Gold Premium came in behind PRTG and OpManager because it is expensive, restricted to a single network and gener-ally requires more adjustment and prac-tice. WhatsUp Gold followed Orion NPM, as Orion NPM has raised the bar with the last two versions and we found it much easier to find our way through Orion’s consoles.
By Dirk Jarzyna Redaktion funkschau
Ralf Ladner © 2011 WEKA FACHMEDIEN GmbH