STATUTORY REQUIREMENTS - Bank Negara Malaysia ANNUAL REPORT BOARD OF DIRECTORS SHARIAH ADVISORY...
160
STATUTORY REQUIREMENTS In accordance with section 13 of the Central Bank of Malaysia Act 2009, Bank Negara Malaysia hereby publishes and has transmitted to the Minister of Finance a copy of this Annual Report together with a copy of its Financial Statements for the year ended 31 December 2013, which have been examined and certified by the Auditor-General. The Financial Statements will also be published in the Gazette. For the purposes of section 115 of the Development Financial Institutions Act 2002, the annual report on the administration of the Development Financial Institutions Act 2002 and other related matters for the year ended 2013 is incorporated in Bank Negara Malaysia’s Financial Stability and Payment Systems Report 2013 which forms an integral part of this Annual Report 2013. Zeti Akhtar Aziz Chairman Board of Directors 19 March 2014
Transcript of STATUTORY REQUIREMENTS - Bank Negara Malaysia ANNUAL REPORT BOARD OF DIRECTORS SHARIAH ADVISORY...
STATUTORY REQUIREMENTS
In accordance with section 13 of the Central Bank of Malaysia Act 2009, Bank Negara Malaysia hereby publishes and has transmitted to the Minister of Finance a copy of this Annual Report together with a copy of its Financial Statements for the year ended 31 December 2013, which have been examined and certified by the Auditor-General. The Financial Statements will also be published in the Gazette.
For the purposes of section 115 of the Development Financial Institutions Act 2002, the annual report on the administration of the Development Financial Institutions Act 2002 and other related matters for the year ended 2013 is incorporated in Bank Negara Malaysia’s Financial Stability and Payment Systems Report 2013 which forms an integral part of this Annual Report 2013.
Zeti Akhtar AzizChairman
Board of Directors
19 March 2014

3A
NN
UA
L R
EPO
RT
BO
AR
D O
F D
IREC
TOR
S
BOARD OF DIRECTORS
Tan Sri Dato’ Sri Dr. Zeti Akhtar AzizD.K. (Johor), P.S.M., S.S.A.P., S.U.M.W., D.P.M.J.Governor and Chairman
Dato’ Muhammad bin IbrahimP.J.N., D.P.M.S.Deputy Governor
Datuk Nor Shamsiah binti Mohd YunusP.M.W.Deputy Governor
Dr. Sukhdave SinghDeputy Governor
Tan Sri Dr. Mohd Irwan Serigar bin AbdullahP.S.M., S.S.A.P., D.C.S.M., D.P.S.K., D.I.M.P., S.A.P.
Datuk Oh Siew Nam P.J.N.
Tan Sri Datuk Amar Haji Bujang bin Mohd. Nor P.S.M., D.A., P.N.B.S., J.S.M., J.B.S., A.M.N., P.B.J., P.P.D.(Emas)
Dato’ N. Sadasivan D.P.M.P., J.S.M., K.M.N.
Tan Sri Dato’ Seri Dr. Sulaiman bin MahbobP.S.M., P.J.N., S.S.A.P., D.J.B.S., J.S.M., S.M.J., P.M.P., K.M.N., A.M.N.
Encik Chin Kwai Yoong
Encik Chin Kwai Yoong was reappointed as a member of the Board effective 1 March 2013.
Dr. Sukhdave Singh was appointed as a member of the Board effective 16 April 2013.
Dato’ Muhammad bin Ibrahim was reappointed as a member of the Board effective 16 June 2013.
Datuk Nor Shamsiah binti Mohd Yunus was reappointed as a member of the Board effective 16 November 2013.

4A
NN
UA
L REPO
RT
BO
AR
D O
F DIR
ECTO
RS

5A
NN
UA
L R
EPO
RT
BO
AR
D O
F D
IREC
TOR
S
SHARIAH ADVISORY COUNCIL MEMBERS
Dr. Mohd Daud bin Bakar Chairman
Prof. Madya Dr. Mohamad Akram bin Laldin Deputy Chairman
Tun Abdul Hamid bin Mohamad S.S.M, D.U.P.N, S.P.C.M, D.M.P.N, D.P.C.M, K.M.N, P.J.K
Tan Sri Sheikh Ghazali bin Abdul RahmanP.S.M, P.J.N, D.S.D.K, S.D.K, A.M.N
YB Dato’ Seri Haji Hassan bin Haji AhmadP.M.P, D.S.P.N, P.J.N, D.G.P.N
Prof. Dr. Ashraf bin Md. Hashim
Prof. Dr. Engku Rabiah Adawiah binti Engku Ali
Prof. Madya Dr. Rusni binti Hassan
Prof. Madya Dr. Asmadi bin Mohamed Naim
Dr. Shamsiah binti Mohamad
En. Burhanuddin bin Lukman

6A
NN
UA
L REPO
RT
BO
AR
D O
F DIR
ECTO
RS

Governor Tan Sri Dr. Zeti Akhtar Aziz Deputy Governor Dato’ Muhammad bin Ibrahim Deputy Governor Datuk Nor Shamsiah binti Mohd Yunus Deputy Governor Dr. Sukhdave Singh Secretary to the Board Abu Hassan Alshari bin Yahaya Assistant Governor Bakarudin bin IshakAssistant Governor Norzila binti Abdul AzizAssistant Governor Jessica Chew Cheng Lian Assistant Governor Donald Joshua Jaganathan Assistant Governor Abu Hassan Alshari bin Yahaya Assistant Governor Marzunisham bin Omar Director Governor’s Office Vivienne Leong Sook Leng Strategic Communications Shariffuddin bin Khalid Internal Audit Mohamad Muhsin bin Mohd AnasEconomics Economics Fraziali bin Ismail Monetary Assessment and Strategy Dr. Norhana binti Endut International Nazrul Hisyam bin Mohd Noh Statistical Services Toh Hock ChaiRegulation Financial Sector Development Aznan bin Abdul Aziz Islamic Banking and Takaful Wan Mohd Nazri bin Wan Osman Financial Surveillance Madelena binti Mohamed Prudential Financial Policy Mohd Zabidi bin Md Nor Development Finance and Enterprise Marina binti Abdul Kahar Payment Systems Policy Tan Nyat Chuan Consumer and Market Conduct Suhaimi bin Ali Money Services Business Regulation Shahariah binti OthmanSupervision Financial Conglomerates Supervision Che Zakiah binti Che Din Insurance and Takaful Supervision Yap Lai Kuen Banking Supervision Cindy Siah Hooi Hoon Specialist Risk Unit Charles Sandanasamy* Financial Intelligence and Enforcement Abd. Rahman bin Abu Bakar Investment and Operations Investment Operations and Financial Markets Adnan Zaylani bin Mohamad Zahid Foreign Exchange Administration Shamsuddin bin Mohd Mahayidin Currency Management and Operations Azman bin Mat AliOrganisational Development Strategic and Risk Management Mohd. Adhari bin Belal Din Strategic Human Capital Jennora Bahari Finance Eugene Hon Kah Weng Legal - Human Capital Development Centre Thomas Tan Koon Peng LINK and Regional Offices Arlina binti Ariff IT Services Alizah binti Ali MIFC Promotion Unit Nik Mohamed Din bin Nik Musa Centralised Shared Services General Manager Dato’ Mohd Nor bin Mashor CSS Management Office Azmi bin Abd Hamid Facility Management Services Myrzela binti Sabtu Hospitality Services Lim Foo Thai Security Services Dato’ Badaruddin bin Mohd Isa Museum, Art Gallery and KM Centre Services Lucien de Guise Chief Representative Beijing Representative Office Albert See Choon Kwang London Representative Office Azizul bin Amiludin* New York Representative Office Harris bin Hassan Regional Office Johor Bahru Raman A/L Krishnan Pulau Pinang Mohd Daud bin Dahar Branch Manager Kota Kinabalu Kamalullail bin Ramli Kuching Rosnani binti Mahamad Zain Shah Alam Yusoff bin Yahaya Kuala Terengganu Omar bin Moin * Administrative Head

Contents
GOVERNOR’S STATEMENT
EXECUTIVE SUMMARY
ECONOMIC DEVELOPMENTS IN 201311 The International Economic Environment16 The Malaysian Economy21 External Sector 22 Box Article: Further Diversification of Malaysia’s Resource-Based Industries 31 Box Article: Broadening Economic Surveillance through Bank Negara Malaysia’s Regional Offices33 Inflation Developments
MONETARY AND FINANCIAL CONDITIONS39 International Monetary and Financial Conditions40 Domestic Monetary and Financial Conditions 41 Box Article: Spillovers of Quantitative Easing on Asia50 Financing of the Economy
MONETARY POLICY IN 201355 Monetary Policy57 Monetary Operations
OUTLOOK AND POLICY IN 2014 63 The International Economic Outlook66 The Malaysian Economy70 Box Article: Evolving Household Balance Sheets and Implications for Private Consumption 77 Box Article: Estimating Malaysia’s Potential Output80 Monetary Policy Outlook81 Fiscal Policy Outlook
GOVERNANCE, ORGANISATIONAL DEVELOPMENT AND COMMUNICATIONS 85 Governance89 Organisational Development 93 Communications 97 Organisation Structure
ANNUAL FINANCIAL STATEMENTS105 Statement of Financial Position as at 31 December 2013106 Income Statement for the Year Ended 31 December 2013107 Notes to the Financial Statements
ANNEX

GOVERNOR’S STATEMENT
The year 2014 marks a year of transition for the world economy. As the recovery in the major advanced economies is sustained, the prolonged period of monetary accommodation will shift towards normalisation. While the structural adjustments and institutional changes being implemented will also contribute towards strengthening the growth process, challenges remain in managing this period of transition so as not to undermine the recovery. The emerging economies, in particular in Asia, have been resilient during this period of prolonged global slowdown, and will benefit from the global recovery. Most emerging economies have continued with the reforms to strengthen the medium-term growth outlook, while addressing the areas of vulnerabilities.
While the normalisation of monetary conditions in the advanced economies will be positive for the world economy given that it reflects improved economic conditions, this has been followed by heightened volatility in the international financial markets. During this period, the emerging economies have experienced sharp reversals of capital flows. The policy spillovers and contagion effects are potential risks confronting the emerging economies in this year of transition. The emerging economies have been affected by these developments in varying degrees. The earlier reforms and a broader policy toolkit have, however, allowed most emerging economies to more effectively manage these highly uncertain and volatile conditions.
Economic conditions in Malaysia have also continued to improve, and the Malaysian economy is expected to remain on a steady growth path going into 2014 and 2015. While the economy will continue to benefit from the gradual global recovery, the private sector-led domestic demand remains the key driver of growth. The economy has benefitted from the earlier reforms and initiatives introduced, which have provided a conducive environment for private investment. Projected to register its fifth consecutive year of strong growth, the broad-based capital spending across the economic sectors and geographical areas reflects the ongoing efforts to transition towards becoming a higher value-added economy. The household sector has also remained resilient. Private consumption activity is supported by the sustained income growth and stable labour market conditions.
As a highly open economy and an increasingly more liberalised financial system, Malaysia is significantly affected by external developments. Despite the increased capital flow volatility during the recent months, the domestic financial markets have remained orderly, and financial intermediation has not experienced any disruptions. This is largely from the payoffs from the decade of reforms to develop a more resilient domestic financial system. Additionally, the high level of international reserves, the low level of external indebtedness
and the balance of payments current account surplus continue to reinforce the strength of the Malaysian economy and its capacity to cope with external shocks. Beyond the prevailing short-term volatility, structural adjustments and economic transformation efforts currently being implemented will strengthen the fundamentals and growth prospects over the medium term.
In the domestic economy, the focus has been on the management of a number of key challenges to strengthen the potential for the sustainability of our medium-term growth prospects. Following rising costs, the domestic economy is entering a period of higher prices. Inflation in 2014 and 2015 is projected to be above its historical average, and to be between 3-4%. The revisions to a number of administered prices, higher domestic cost factors and the implementation of the Goods and Services Tax (GST) in 2015, are taking place at a time of modest global commodity prices, moderate domestic demand pressures and anchored inflationary expectations. These price adjustments are, therefore, expected to have a transitory effect on inflation. The impact of these adjustments is projected to diminish over time, and inflation is expected to stabilise in the region of its long-term average of 3%. The continued productivity enhancements and efficiency improvements by businesses will contribute towards containing the pass-through of the higher costs to consumers.
As the Government proceeds with its ongoing plans to contain the fiscal deficit and the level of public sector indebtedness, the challenge is to achieve these fiscal sustainability efforts while remaining supportive of growth. These fiscal reforms are essential to strengthen the overall resilience of the economy, and to increase the fiscal space to manage future unanticipated shocks. The fiscal consolidation process has, for the main part, been implemented gradually to minimise its potential adverse implications on the economy, with some supporting pro-growth measures to avoid disruptions in economic activity and dislocations to the vulnerable segments of society. The improved revenue position and the more efficient public sector spending will increase the potential for the development of a more comprehensive social protection system and further investments in infrastructure development in Malaysia.
In this more complex and challenging environment, the focus of attention of the appropriate policy mix by the Bank has been on preserving macroeconomic and financial stability, while also addressing the risks arising from the build-up of destabilising financial imbalances, and at the same time, supporting an inclusive growth. While monetary policy is an important policy lever, the Bank has also relied on a range of policy tools to achieve these objectives. The focus of monetary policy remains on preserving price stability in an environment of sustainable growth. However, also embedded within the considerations for the policy is to ensure that the interest rate setting does not result in widespread financial distortions or excessive risk-taking behaviour in the economy. For sector-specific risks of financial imbalances, a specifically more targeted approach, in the form of macroprudential and microprudential measures, has been implemented. While this broader policy toolkit has been relied upon, these measures are not a substitute for the monetary policy stance that is consistent with the prospective economic and financial conditions in the country.
During the year, initiatives were also continuously undertaken to further enhance the structure of the financial system, to facilitate more effective intermediation and to improve the risk management practices. In the further development of the bond market, the issuance of notes with a 30-year maturity period by the Government strengthens the depth of our bond market, and provides a benchmark for long-term project financing by the private sector. Another important development that is set to come into effect in 2015 is the introduction of a new reference rate, the Base Rate, for the pricing of floating-rate bank loans, to replace the Base Lending Rate that has been in place for more than 30 years. This enhancement to the interest rate framework aims to increase the relevance of the reference rate to the financial sector, improve the pricing mechanism that is more market-based, and at the same time, ensure greater transparency for households and businesses.
As financial integration in the region deepens, central bank cooperation to enhance collective resilience has also been strengthened further during the year. The cooperation has been strengthened in the area of cross-border surveillance, and in the development of an integrated crisis management framework to address pre-emptively threats to regional macroeconomic and financial stability. Financial resources available for crisis management have been, and will continue to be, enlarged through cross-border collateral arrangements and new bilateral swap arrangements. The Chiang Mai Initiative Multilateralisation (CMIM) is also being enhanced to strengthen the regional financial safety net. Cumulatively, these initiatives advance and strengthen the institutional arrangements and mechanisms, as part of the overall regional financial architecture to support regional stability.
During the year, the Bank established the Bank Negara Malaysia Representative Office in Beijing. This marks a significant milestone for the Bank. As the third overseas representative office after London and New York, it serves as an important liaison point with China’s regulators and financial market participants to support a deeper understanding of the country’s economic and financial developments.
In the Bank, efforts continued in enhancing organisational capacity to ensure that the Bank continues to remain effective in delivering our mandates. Equally important is that we are in a state of readiness to deal with future eventualities. Ongoing investments in talent management practices, over the years, have contributed to strengthening our institutional resilience. During the year, more structured programmes have been introduced to accelerate the time to competence, while more targeted leadership development programmes were provided for the mission critical positions. Guided by the Bank’s business planning and enhanced risk management practices, the clear focus on strategic outcomes and awareness of potential risk areas ensure that mitigating and contingency measures have been put in place to facilitate the management of these risks and unexpected developments. Rigorous financial and operational management further supports the effective allocation of resources, and the management of multiple demands with varying priorities. During the year, our engagement and interface with partner institutions, including across borders, was also strengthened further, with several formal arrangements entered into to enhance greater collaboration efforts.
Going forward, the international and domestic environment will continue to place significant demands on the capacity and capability of the Bank. The continued readiness and effectiveness of the Bank in fulfilling our responsibilities will require a cohesive workforce that is dedicated to performance and strong collaboration with our institutional partners. On behalf of the Board and the management, I wish to express our appreciation to all staff of the Bank for their commitment and professionalism to ensure that the Bank continues to serve the best interests of the nation. I am also grateful for the unwavering support and guidance of the Board of Directors, who is an integral part of the governance at the Bank. The Bank will continue to strive towards achieving the highest standards of excellence in fulfilling our responsibilities and upholding the trust that is placed upon us.
Zeti Akhtar AzizGovernor19 March 2014

AN
NU
AL
REP
OR
T 20
13EX
ECU
TIV
E SU
MM
AR
Y1
EXECUTIVE SUMMARY

AN
NU
AL R
EPOR
T 2013EX
ECU
TIVE SU
MM
AR
Y2

AN
NU
AL
REP
OR
T 20
133
EXECUTIVE SUMMARY
In 2013, the global economy expanded at a modest pace amid an uneven growth environment across economies. In the advanced economies, growth continued to improve gradually. The pace of recovery, however, was modest as policy uncertainties and structural constraints continued to weigh on overall demand. Growth in emerging economies moderated as domestic demand was affected by the prolonged weakness in external demand. In a number of emerging economies, growth was also affected by policy measures introduced to manage domestic vulnerabilities. In addition, the shift in market expectations for reduction in monetary accommodation in the US towards the second half of the year led to large capital flow reversals from the emerging economies. Against this backdrop, global inflation slowed, reflecting the moderate demand conditions in many economies and lower non-energy commodity prices.
Despite the weaker external environment, the Malaysian economy continued to expand in 2013, driven by the continued strong growth in domestic demand. The Annual Report provides an analysis of the developments in the Malaysian economy and the policies pursued by the Bank during the year. It also provides an assessment of the prospects of the Malaysian economy amid the ongoing global economic and financial developments and the key challenges going forward. The report also highlights the organisational changes in the Bank to further strengthen its governance and capacity through enhancements in strategic management, risk management and talent development. The Malaysian Economy in 2013The Malaysian economy expanded by 4.7% in 2013 (2012: 5.6%), driven by the continued strong growth in domestic demand. Despite the weaker external environment in the first half of the year, domestic demand remained resilient throughout the year, led by robust private sector activity. Private consumption was supported mainly by favourable employment conditions and wage growth. Private investment was underpinned by capital spending in the mining, services and manufacturing sectors. The more moderate growth performance in 2013 was, to a
large extent, attributable to developments in the external sector. Slower demand from the advanced and regional economies in the first half of the year contributed to the overall decline in real exports during the year. This was compounded by the continued expansion in real imports throughout 2013 arising from the sustained growth in domestic investment and consumption, which contributed to the contraction in net exports.
Private consumption growth remained strong at 7.6% in 2013, underpinned mainly by the favourable employment conditions and wage growth. Private consumption was also supported by Government transfers to low- and middle-income households and continued access to financing for creditworthy borrowers. Public consumption recorded a higher growth of 6.3% in 2013 due mainly to higher expenditure on supplies and services.
Although the pace of investment activity moderated from the exceptionally strong growth in 2012, it continued to be supported by private sector capital expenditure. Private investment continued to register double-digit growth of 13.6%, driven by capital spending by both the domestic and foreign investors in the mining, services and manufacturing sectors. Public investment recorded a small positive growth of 0.7%, following the decline in the Federal Government development expenditure. Nevertheless, this was offset by higher capital spending by the public enterprises, which was channelled mainly into the oil and gas, transportation and energy sectors.
From the supply perspective, the continued firm growth in domestic demand contributed to the expansion in the domestic-related activity in the services and manufacturing sectors during the year. The export-oriented industries in the manufacturing sector benefited from the improvement in external conditions in the second half of the year. The robust activity in the residential and civil engineering sub-sectors contributed to the continued strong growth of the construction sector.
Labour market conditions remained favourable in 2013, as the continued expansion in economic
AN
NU
AL R
EPOR
T 2013EX
ECU
TIVE SU
MM
AR
Y4
activity across all sectors supported the demand for labour. Employment recorded a strong growth of 4.8% while total retrenchments decreased, suggesting that most firms were able to adapt to the minimum wage policy. During the year, the unemployment rate remained low at 3.1%.
Headline inflation, as measured by the annual percentage change in the Consumer Price Index (CPI), remained modest at 2.1% in 2013 (2012: 1.6%). The average inflation was low at 1.7% in the first eight months of the year before increasing to 2.9% in the remaining four months of 2013. The higher inflation in the latter part of the year was driven by domestic cost and supply factors, arising from upward adjustments to administered prices and weather-related domestic supply shortages. Despite the strong growth in private consumption and sustained wage growth during the year, adequate productive capacity in the economy helped contain demand pressures. Hence, core inflation, an indicator of demand-driven pressures, moderated to 1.8% in 2013.
Malaysia’s external sector remained resilient in 2013 amid a challenging global economic and financial environment. The overall balance of payments remained strong, as the current account surplus more than offset the net outflows in the financial account. In the first half of the year, the current account recorded a smaller surplus of RM11.2 billion, on account of a smaller trade surplus amid lower services and income deficits. The continued economic weakness in the advanced countries, slower-than-expected growth in regional economies and the lower prices of Malaysia’s key commodities resulted in a marked decline in Malaysia’s exports. The services and income deficits narrowed due mainly to higher net travel receipts following stronger intra-regional tourism, and lower net primary income payments, reflecting higher profits of Malaysian companies investing abroad. In the second half of the year, the current account surplus widened to RM26.1 billion as export growth returned to positive territory, driven by higher demand across both manufactured products and commodities. This was further reinforced by the more favourable prices of CPO and LNG relative to the first half of 2013. Growth in imports remained strong throughout the year, given the robust domestic demand. For the year as a whole, the current account registered a surplus of RM37.3 billion (2012: RM57.3 billion).
The financial account continued to experience sustained two-way flows involving cross-border financial transactions by both residents and non-residents. The economy’s performance and growth prospects continued to support international investors’ confidence, leading to significantly higher inward direct investment flows. Foreign direct investment (FDI) inflows were fairly broad-based across sectors, with significant inflows into the manufacturing and mining sectors. Outward direct investment, however, moderated in tandem with the moderation in the growth outlook for regional economies. Malaysia’s deep capital markets and relatively favourable growth prospects remained attractive to foreign portfolio investors. These portfolio flows, however, exhibited considerable volatility during the year. Net inflows of non-resident portfolio investment was strong in the early part of 2013, but following the indication by the Federal Reserve (Fed) of a possible scale-back of its asset purchase programme in May, there were strong portfolio outflows between May and August. For the year, non-resident portfolio investment recorded a smaller net inflow. Overall, the financial account registered a net outflow of RM15 billion in 2013.
Malaysia’s external debt amounted to RM318.1 billion (USD95.8 billion) as at end-2013 (2012: RM252.8 billion), equivalent to 33.5% of GNI (2012: 27.9% of GNI). Higher medium- and long-term external debt during the year mainly reflected the net drawdown of external borrowing by the public enterprises and the non-bank private sector. The Federal Government continued to register net repayment of external debt. The higher short-term external debt in 2013 was largely the outcome of the net drawdown of interbank borrowing, mainly for the management of foreign exchange liquidity positions. The appreciation of some major and regional currencies against the ringgit during the year also contributed to the higher external debt in ringgit terms. Overall, Malaysia’s external debt remained manageable. The debt profile continued to be skewed towards a longer maturity structure, with medium- and long-term debt accounting for 59.7% of total external debt.
The international reserves of Bank Negara Malaysia increased by RM14.6 billion to RM441.9 billion at end-2013 (end-2012: RM427.2 billion). As at 28 February 2014, the reserves level amounted to RM427.6 billion (equivalent to USD130.6 billion), which is sufficient to finance 9 months of retained
AN
NU
AL
REP
OR
T 20
13EX
ECU
TIV
E SU
MM
AR
Y5
imports and is 3.3 times the short-term external debt. The international reserves held by the Bank remain usable and unencumbered.
Economic and Monetary Management in 2013Monetary policy in 2013 was focused on balancing the risks surrounding the outlook for domestic growth and inflation. Against a backdrop of increased uncertainties on the balance of risks to the growth and inflation outlook, the Monetary Policy Committee (MPC) maintained the Overnight Policy Rate (OPR) at 3.00% during the year. Although the risks to domestic growth and inflation was assessed to be broadly in balance in the earlier part of the year, the uncertainties surrounding the balance of risks increased towards the second half. While the growth momentum was expected to improve in the second half of the year and into 2014, uncertainties on the strength of the global recovery and the extent to which the fiscal consolidation and subsidy rationalisation would affect domestic demand, remained as the key downside risks to growth. Following the upward adjustments to administered prices in the later part of the year, the inflation dynamics shifted and inflation was expected to increase for the remainder of year and into 2014. Based on its assessment of the possible downside risks to growth and upside risks to inflation, the MPC viewed that holding the OPR steady would provide the best outcome for its monetary policy objectives. Also, given that the risks of financial imbalances were confined to certain segments of the economy, the MPC decided that other tools would be better suited to address these risks. Consequently, macroprudential measures were introduced in July to manage such financial risks in a more targeted manner.
A key development in the second half of the year was the capital flow reversals from the emerging market economies following the Fed’s indication of a possible scale-back of its asset purchase programme. Despite the increase in the size and volatility of capital outflows since May 2013, adjustments in the domestic currency and financial markets were orderly. The managed float exchange rate system accorded flexibility for the ringgit exchange rate to facilitate adjustments. The depth of the financial system also ensured that these volatile flows were intermediated without causing disruptions to economic activity. The growing demand from the domestic institutional investors provided the underlying support to the bond market and contained the increase in borrowing costs that were benchmarked against the bond
yields. There were consequently minimal spillovers to the real economy.
The performance of the ringgit during the year was influenced mainly by two-way portfolio and trade flows, reflecting both international and domestic developments. In the first four months of the year, the ringgit was relatively stable. Subsequently, the indication of a possible scale-back in the Fed’s asset purchase programme shifted market expectations and prompted a reversal of portfolio flows from most regional markets, resulting in the depreciation of most regional currencies, including the ringgit. For the year as a whole, the ringgit depreciated by 6.8% to end the year at RM3.2815 against the US dollar.
During the year, yields on Malaysian Government Securities (MGS) were driven primarily by external factors. While the Fed’s indication of a possible scale-back of its asset purchase programme led to significant portfolio reversals in the bond market, the increases in MGS yields were generally smaller compared to markets across the region, due to the support of domestic institutions in the MGS market. In the private debt securities (PDS) market, the cost of private debt financing increased but remained supportive of fund raising activity. The FTSE Bursa Malaysia Kuala Lumpur Composite Index (FBM KLCI) increased by 10.5% (2012: 10.3%) to close at 1867.0 points. The underlying performance of the market was supported by investors’ confidence in the positive economic outlook for the Malaysian economy.
Liquidity conditions remained stable throughout 2013, despite heightened volatility in the global financial markets and capital flow reversals. Notwithstanding the net withdrawal of liquidity due to net foreign outflows during the year, surplus liquidity placed with Bank Negara Malaysia remained high. Private sector liquidity, as measured by broad money or M3, continued to expand, albeit at a more moderate pace of 8.1% during the year (2012: 9.0%).
Financing continued to support domestic economy activity. While growth in net financing moderated, the level of loans disbursed and funds raised in the capital market remained favourable. The overall demand for gross financing by businesses was sustained following continued strength in private consumption and investment activity. Demand for loans by households was also sustained, supported
AN
NU
AL R
EPOR
T 2013EX
ECU
TIVE SU
MM
AR
Y6
by favourable employment conditions and wage growth. Of significance, the growth rate of outstanding loans for personal use moderated to 4.6% in 2013 (2012: 9.1%), partly as a result of the pre-emptive measures introduced by the Bank in July 2013 to reinforce responsible lending practices. For the year, net financing to the private sector through the banking system and the PDS market expanded at an annual rate of 9.8% (2012: 12.4%).
Outlook for the Malaysian Economy in 2014The Malaysian economy is expected to remain on a steady growth path in 2014, expanding by 4.5%-5.5%. Domestic demand will remain the key driver of growth, albeit at a more moderate pace. Private investment is forecast to register robust growth for the fifth consecutive year, driven by the ongoing implementation of multi-year projects and the improvement in external demand. Public investment is projected to register a higher growth, supported by both Government and public enterprise capital spending. Private consumption will be underpinned by healthy labour market conditions and sustained income growth. Public consumption is anticipated to record a lower growth due to the ongoing fiscal consolidation. In line with the improvement in external demand, Malaysia’s export performance across most product categories is expected to pick up in 2014. Exports is expected to be further supported by a small positive growth in commodity exports and the stronger services exports, supported by Visit Malaysia Year 2014. At the same time, gross imports is projected to increase at a faster pace, driven mainly by higher intermediate imports. With import growth remaining robust, the current account surplus is projected to narrow in 2014.
On the supply side, all economic sectors are expected to register positive growth in 2014. The services and manufacturing sectors will be the key drivers to the overall growth, benefiting from the improvement in the global economic environment. The construction sector is expected to continue recording high growth, albeit at a more moderate pace, as the completion of several large civil engineering projects will more than offset the progress in existing projects in the transport, utility, and oil and gas sectors. The growth in the agriculture sector is expected to improve on account of higher production of palm oil as both yields and the number of matured palm trees increase. In the mining sector, better performance is projected due to higher crude oil and natural
gas production from deepwater and marginal fields; and enhanced oil recovery.
Headline inflation is projected to average 3%-4% in 2014, due mainly to domestic cost factors. These include the recent price adjustments arising from the subsidy rationalisation and the spillover effects of these adjustments on the prices of other goods and services. The higher cost pressures, however, will be partly contained by subdued external price pressures, continued expansion in domestic capacity and a moderation in domestic demand.
Notwithstanding the moderation in domestic demand, the underlying fundamentals of the Malaysian economy remain strong. Growth will be driven by the private sector across a diversified range of economic activities. Of importance, employment remains strong and incomes are rising. The financial system is resilient with financial intermediation expected to provide continued support to investment and consumption. The strength of Malaysia’s external position also remains intact, with international reserves at healthy levels and external debt within prudent limits.
Downside risks to global growth, however, could affect the performance of the domestic economy in 2014. The advanced economies will continue to experience excess capacity in the labour and product markets, while fiscal uncertainties may affect the pace of recovery. In several of the emerging economies, there could be slower-than-expected domestic demand amid policy measures to address risks arising from high growth in credit and asset prices. In addition, volatility in global financial markets could contribute to large and volatile capital flows. While the environment will continue to be challenging, the economy could also register stronger growth performance if the pace of global recovery exceeds expectations.
Economic and Monetary Management in 2014The focus of policies by the Government and the Bank will be on supporting the Malaysian economy to grow at a sustainable level, while mitigating the risks arising from the global environment, inflation and the buildup of financial imbalances.
Monetary policy in 2014 will aim to support the sustainable growth of the Malaysian economy while mitigating any potential vulnerabilities arising from inflation and the buildup of financial imbalances. While price pressures are expected to be stronger,
AN
NU
AL
REP
OR
T 20
13EX
ECU
TIV
E SU
MM
AR
Y7
the source of inflation is primarily due to cost-push factors. Monetary surveillance, however, will remain focused on identifying signs of inflation becoming more pervasive and persistent, whereby a monetary policy response would become appropriate. Of significance, the prolonged period of relatively low international and domestic interest rates could encourage excessive risk-taking behaviour. To the extent that this occurs within specific segments of the economy, other targeted policy instruments such as macroprudential measures would be deployed to address these risks. Such measures are, however, complementary in nature and not a substitute for interest rate policy. Given the expected large shifts in global liquidity and capital flows, it is important to ensure that the monetary and financing conditions do not become destabilising and continue to be supportive of the economy.
Fiscal policy in 2014 is aimed at strengthening and consolidating the fiscal position, while ensuring continued support for domestic growth and the protection of the well-being of the society. Fiscal reforms are being pursued gradually to avoid undermining growth. Concurrently, fiscal resources will be directed towards key economic sectors to accelerate the shift towards a high value-added, high-income economy. In June 2013, the Fiscal Policy Committee (FPC) was established to serve as the central policy-making committee for the formulation and implementation of fiscal strategies and giving due consideration to their impact on overall macroeconomy.
Organisational Development and GovernanceIn 2013, the Bank completed most of the targeted initiatives for the year and sustained the progress of its three-year Business Plan. During the year, the Board of Directors met monthly to consider key economic and financial conditions and the Bank’s policy responses, as well as to deliberate on the Bank’s financial condition, reserves and currency management, and talent management issues. The official opening of the Bank’s Beijing Representative Office witnessed the first occasion where a Board meeting was conducted abroad, in conjunction with other activities to further strengthen bilateral ties with PR China. The Board is supported by three non-executive Board Committees, namely the Board Governance Committee (BGC), the Board Audit Committee (BAC) and the Board Risk Committee (BRC).
The Bank’s organisational development strategies were aimed at sustainability and preparedness as it continues to deliver the core mandates amid the challenging global economic and financial environment. This was achieved through organisation-wide clarity and focus on key outcomes and deliverables anchored to the Business Plan. During the year, steps were taken to further integrate elements of business strategy, risk, human capital and financial resources for a more holistic view of organisation performance management and more informed decision-making.
The Bank’s communications role was intensified in 2013 in view of heightened challenges and uncertainties, especially in the global environment. More intensive engagements were carried out with various stakeholders, explaining the international and domestic economic and financial developments and their implications on the Malaysian economy and the financial system. Communication efforts were also focused in driving the Bank’s strategic initiatives, including explaining the new Financial Services Act 2013 and the Islamic Financial Services Act 2013, and a nationwide campaign on `Experience IBG´, or Interbank GIRO, to encourage the switch from cheques to IBG services.
The Bank continues to engage with the global central banking community including in the area of capacity building. To enhance the knowledge and skills of policymakers and regulators globally in their pursuit of greater financial inclusion, the Bank and the Alliance for Financial Inclusion (AFI) signed a Letter of Cooperation for capacity building in August 2013. The Bank also intensified its capacity building efforts to support the Association of South East Asian Nations (ASEAN) financial integration agenda through the conduct of technical cooperation programmes. Capacity building programmes in the development of an effective and well-regulated Islamic financial system also continued to be a major focus area in 2013.
Bank Negara Malaysia’s Audited Financial Statements for 2013The financial position of Bank Negara Malaysia, as audited and certified by the Auditor General, remained strong in 2013. The total assets of Bank Negara Malaysia amounted to RM474.2 billion, with a net profit of RM5.5 billion for the financial year ending 31 December 2013. Bank Negara Malaysia declared a dividend of RM1.5 billion to the Government for the year 2013.

AN
NU
AL R
EPOR
T 2013EX
ECU
TIVE SU
MM
AR
Y8
AN
NU
AL
REP
OR
T 20
13EC
ON
OM
IC D
EVEL
OPM
ENTS
IN 2
013
9
11 The International Economic Environment
16 The Malaysian Economy
21 External Sector
22 Box Article: Further Diversification of Malaysia’s Resource-Based Industries
31 Box Article: Broadening Economic Surveillance Through Bank Negara
Malaysia’s Regional Offices
33 Inflation Developments
ECONOMIC DEVELOPMENTS IN 2013

AN
NU
AL R
EPOR
T 2013EC
ON
OM
IC D
EVELO
PMEN
TS IN 2013
10
AN
NU
AL
REP
OR
T 20
1311
ECONOMIC DEVELOPMENTS IN 2013
THE INTERNATIONAL ECONOMIC ENVIRONMENT
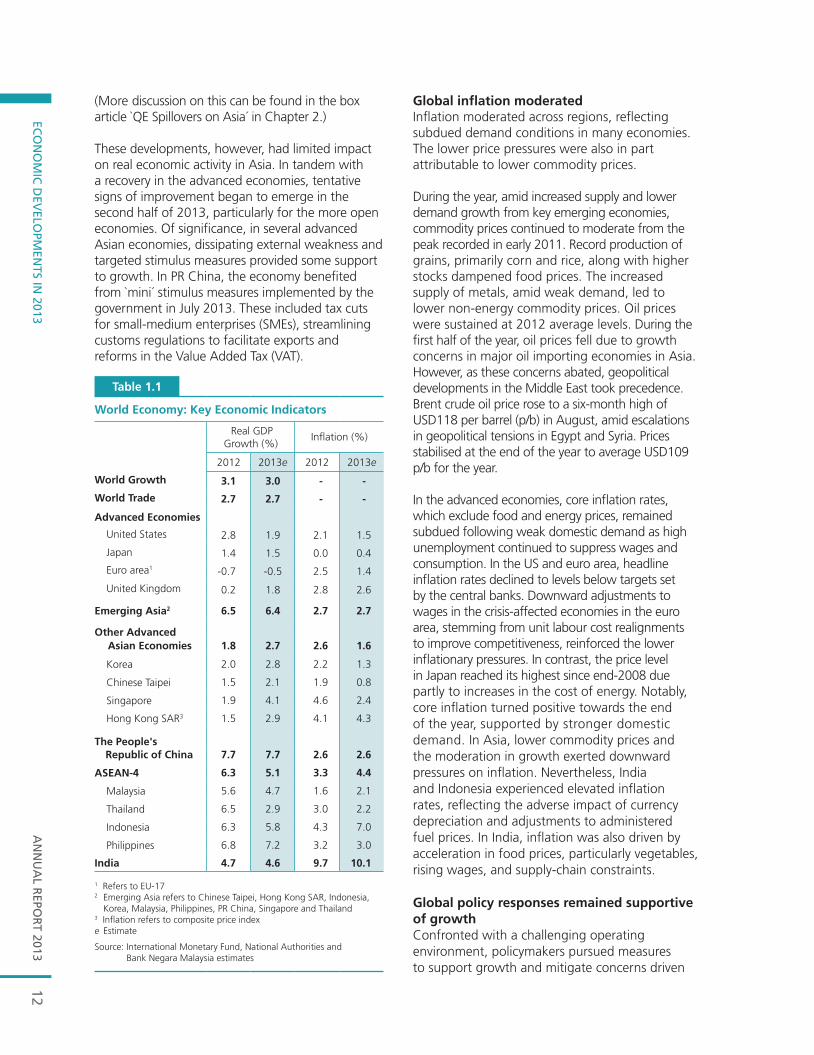
The global economy expanded at a modest pace in 2013, with uneven momentum across economies. In the advanced economies, growth remained on a path of gradual improvement, led by a private-sector recovery in the US. The euro area emerged from recession while economic activity improved in Japan following the introduction of stimulative policies. The pace of recovery, however, was modest as policy uncertainties and structural constraints continued to weigh on overall demand. Following the above-trend growth over the last few years, growth in the emerging economies moderated as a prolonged weakness in external demand spilled over to the domestic economy. A number of emerging economies had also introduced policy measures to manage potential domestic vulnerabilities, which led to some moderation in domestic demand. In addition, the shift in market expectations of a normalisation in US monetary policy towards the second half of the year led to large capital flow reversals from the emerging economies. Against this backdrop, global inflation slowed, reflecting the moderate demand conditions in many economies and lower non-energy commodity prices.
The global economy expanded at a modest pace in 2013, with uneven momentum across economies
A modest and uneven global recovery While the global economic environment experienced gradual improvement throughout the year, growth was weak at the start of 2013. Policy uncertainties weighed on the pace of expansion in the advanced economies. The increase in payroll tax and the automatic government spending cuts in the US dampened consumption activity and resulted in a further decline in government spending. In the euro area, uncertainties emanating from the crisis in Cyprus reignited
sovereign debt concerns and exacerbated the existing weakness in private-sector sentiments. In Asia, the prolonged weakness in the external environment, coupled with country-specific factors, affected the strength of domestic economic activity. In PR China, ongoing efforts to re-balance growth to a more sustainable and consumption-driven path also led to more moderate growth. While domestic demand remained as the key contributor to growth in the ASEAN economies, the waning effect of previous stimulus measures amid weak external demand weighed on economic activity. Overall global growth began to gain momentum in the second quarter of 2013. The improvement in the advanced economies was driven by different underlying factors, underscoring a divergence in growth dynamics. Economic recovery in the US benefitted from gradual improvements in the labour and housing markets. In spite of fiscal risks from the debt ceiling debate and government shutdown in late 2013, private investment began to rise, providing further support to the private sector-led growth. In the euro area, economic activity improved marginally, supported by a slower pace of fiscal consolidation. However, private sector demand remained weak, constrained by post-crisis structural impediments such as high unemployment, tight credit conditions and elevated debt levels. In Japan, the coordinated introduction of fiscal and monetary stimulus under a new leadership (`Abenomics´) led to improved business and consumer sentiments, and subsequently, a reduction in deflationary pressures.
Amid signs of more entrenched improvements in the labour market, the Federal Reserve (Fed) indicated a possible scale-back of quantitative easing (QE) in May 2013. The news caused investors to reassess and rebalance their portfolio positions in the emerging markets in response to expectations of tighter financial conditions and narrowing interest rate differentials. This led to capital outflows from the emerging economies and triggered large movements in the global financial markets, with adverse effects on the foreign exchange, equity and bond markets in the emerging economies.
AN
NU
AL R
EPOR
T 2013EC
ON
OM
IC D
EVELO
PMEN
TS IN 2013
12
(More discussion on this can be found in the box article `QE Spillovers on Asia´ in Chapter 2.)
These developments, however, had limited impact on real economic activity in Asia. In tandem with a recovery in the advanced economies, tentative signs of improvement began to emerge in the second half of 2013, particularly for the more open economies. Of significance, in several advanced Asian economies, dissipating external weakness and targeted stimulus measures provided some support to growth. In PR China, the economy benefited from `mini´ stimulus measures implemented by the government in July 2013. These included tax cuts for small-medium enterprises (SMEs), streamlining customs regulations to facilitate exports and reforms in the Value Added Tax (VAT).
Global inflation moderatedInflation moderated across regions, reflecting subdued demand conditions in many economies. The lower price pressures were also in part attributable to lower commodity prices.
During the year, amid increased supply and lower demand growth from key emerging economies, commodity prices continued to moderate from the peak recorded in early 2011. Record production of grains, primarily corn and rice, along with higher stocks dampened food prices. The increased supply of metals, amid weak demand, led to lower non-energy commodity prices. Oil prices were sustained at 2012 average levels. During the first half of the year, oil prices fell due to growth concerns in major oil importing economies in Asia. However, as these concerns abated, geopolitical developments in the Middle East took precedence. Brent crude oil price rose to a six-month high of USD118 per barrel (p/b) in August, amid escalations in geopolitical tensions in Egypt and Syria. Prices stabilised at the end of the year to average USD109 p/b for the year.
In the advanced economies, core inflation rates, which exclude food and energy prices, remained subdued following weak domestic demand as high unemployment continued to suppress wages and consumption. In the US and euro area, headline inflation rates declined to levels below targets set by the central banks. Downward adjustments to wages in the crisis-affected economies in the euro area, stemming from unit labour cost realignments to improve competitiveness, reinforced the lower inflationary pressures. In contrast, the price level in Japan reached its highest since end-2008 due partly to increases in the cost of energy. Notably, core inflation turned positive towards the end of the year, supported by stronger domestic demand. In Asia, lower commodity prices and the moderation in growth exerted downward pressures on inflation. Nevertheless, India and Indonesia experienced elevated inflation rates, reflecting the adverse impact of currency depreciation and adjustments to administered fuel prices. In India, inflation was also driven by acceleration in food prices, particularly vegetables, rising wages, and supply-chain constraints.
Global policy responses remained supportive of growth Confronted with a challenging operating environment, policymakers pursued measures to support growth and mitigate concerns driven
1
World Economy: Key Economic Indicators
Real GDP Growth (%)
Infl ation (%)
2012 2013e 2012 2013e
World Growth 3.1 3.0 - -
World Trade 2.7 2.7 - -
Advanced Economies
United States 2.8 1.9 2.1 1.5
Japan 1.4 1.5 0.0 0.4
Euro area1 -0.7 -0.5 2.5 1.4
United Kingdom 0.2 1.8 2.8 2.6
Emerging Asia2 6.5 6.4 2.7 2.7
Other Advanced
Asian Economies 1.8 2.7 2.6 1.6
Korea 2.0 2.8 2.2 1.3
Chinese Taipei 1.5 2.1 1.9 0.8
Singapore 1.9 4.1 4.6 2.4
Hong Kong SAR3 1.5 2.9 4.1 4.3
The People's Republic of China 7.7 7.7 2.6 2.6
ASEAN-4 6.3 5.1 3.3 4.4
Malaysia 5.6 4.7 1.6 2.1
Thailand 6.5 2.9 3.0 2.2
Indonesia 6.3 5.8 4.3 7.0
Philippines 6.8 7.2 3.2 3.0
India 4.7 4.6 9.7 10.1
1 Refers to EU-172 Emerging Asia refers to Chinese Taipei, Hong Kong SAR, Indonesia,
Korea, Malaysia, Philippines, PR China, Singapore and Thailand3 Infl ation refers to composite price indexe Estimate
Source: International Monetary Fund, National Authorities and Bank Negara Malaysia estimates
Table 1.1
AN
NU
AL
REP
OR
T 20
13EC
ON
OM
IC D
EVEL
OPM
ENTS
IN 2
013
13
1 ‘Fiscal cliff’ refers to a set of tax increases and spending cuts that were estimated to reduce the US fiscal deficit by USD502bn in FY2013. The Congressional Budget Office (CBO) projected that if these policies had taken effect, the US economy would have returned to recession in FY2013. The American Taxpayer Relief Act in January 2013 eliminated part of the fiscal cliff.
by domestic factors. Monetary policy remained accommodative across regions. In the advanced economies, monetary authorities placed greater emphasis on forward guidance to minimise market uncertainties on future policy directions. The pace of fiscal consolidation moderated in some advanced economies, while targeted fiscal support was introduced in some Asian economies. Macroprudential measures were also undertaken in Asia to address financial imbalances such as rapid credit growth and rising asset prices.
In the advanced economies, policies were geared towards supporting the economic recovery. Amid low policy rates, monetary authorities used `forward guidance´, a communication tool to manage market expectations of future interest rates. While the Fed maintained its numerical thresholds for unemployment and inflation rates introduced in December 2012, it highlighted at the end of 2013 that interest rates would be kept low, well beyond the threshold where the unemployment rate falls below 6.5%. Following cumulative improvement in labour market conditions, the Fed announced that it would reduce its asset purchases by USD10 billion in December 2013 and subsequently, in January 2014 to USD65 billion per month. Similarly, the Bank of England (BOE) indicated that an unemployment rate threshold of 7% would apply before it considered adjustments to the Bank Rate. In addition, it announced changes to the Funding for Lending Scheme, by refocusing incentives from households to SMEs. The European Central Bank (ECB) lowered its key policy rate in May and November by a total of 50 basis points (bps) to 0.25% on account of low underlying price pressures. Further, the ECB stated that key interest rates would remain at prevailing or lower levels for an extended period of time with no explicit thresholds.
On the fiscal front, consolidation remained in place, albeit at varying speeds across economies. The US averted the fiscal cliff1 through the American Taxpayer Relief Act which provided for permanent and temporary extensions of fiscal measures including tax relief. However, the
government allowed automatic spending cuts to take effect in March under the Budget Control Act 2011. In the euro area, the pace of fiscal consolidation slowed as policymakers initiated pro-growth strategies, including measures to improve lending to SMEs and to increase youth employment. Of significance, countries such as France, Spain and Portugal were given extensions in timelines to reduce budget deficits.
In Japan, `Abenomics´ was introduced, consisting of a three-pronged plan of fiscal stimulus, monetary easing and structural reforms. A fiscal stimulus was announced in January, directed at accelerating post-disaster reconstruction, disaster prevention and stimulating private investment. A supplementary budget, unveiled in December, was aimed at offsetting the potential impact from an increase in consumption tax in April 2014. This underscored the government’s efforts in balancing between supporting growth and reducing the high public debt. On the monetary policy front, the Bank of Japan introduced the Quantitative and Qualitative Monetary Easing in April to achieve the inflation target of 2% within two years. By the second half of the year, structural reforms encompassing measures for the labour market, private investment and competitiveness were laid out.
Policies in Asia were shaped primarily by domestic concerns amid a challenging external environment. Throughout most of the first half of 2013, growth concerns arising from protracted weakness in the external environment led most national authorities to adopt accommodative monetary policies to support growth against the backdrop of benign inflationary pressures. Central banks in India, Thailand and Korea lowered their policy rates by between 25 bps and 75 bps. However, in May 2013, following the Fed’s indication of a possible QE scale-back, investors began to reassess their investment strategies. Asia’s fundamentals came under greater scrutiny and countries with both current account and fiscal deficits experienced large capital reversals. Bank Indonesia increased its benchmark rate to reinforce its policy mix, which was aimed at anchoring inflation expectations, while stabilising the rupiah and ensuring the sustainability of the current account position. The Reserve Bank of India also raised interest rates on inflationary concerns and instituted measures to narrow the current account deficit. Most Asian economies have demonstrated resilience in managing the volatility arising from capital flows, due in part to the enhanced buffers built post-Asian Financial Crisis

AN
NU
AL R
EPOR
T 2013EC
ON
OM
IC D
EVELO
PMEN
TS IN 2013
14
Malaysia - Key Economic Indicators
2011 2012 2013p 2014f
Population (million persons) 29.1 29.5 29.9 30.4
Labour force (million persons) 12.7 13.1 13.8 14.3
Employment (million persons) 12.3 12.7 13.3 13.8
Unemployment (as % of labour force) 3.1 3.0 3.1 3.1
Per Capita Income (RM) 29,683 30,667 31,698 34,175
(USD) 9,700 9,928 10,060 10,3376
NATIONAL PRODUCT (% change)
Real GDP at 2005 prices1 5.1 5.6 4.7 4.5 ~ 5.5
(RM billion) 711.4 751.5 786.7 828.1
Agriculture, forestry and fi shery 5.8 1.0 2.1 3.8
Mining and quarrying -5.5 1.4 0.5 1.6
Manufacturing 4.7 4.8 3.4 3.5
Construction 4.7 18.1 10.9 10.0
Services 7.0 6.4 5.9 6.2
Nominal GNI 11.9 4.9 4.9 9.4
(RM billion) 862.7 905.2 949.3 1,038.8
Real GNI 4.9 3.9 5.1 5.8
(RM billion) 666.9 693.1 728.3 770.2
Real aggregate domestic demand2 7.9 10.6 7.6 6.9
Private expenditure 7.6 10.7 9.0 8.3
Consumption 6.8 7.7 7.6 6.9
Investment 10.5 21.9 13.6 12.6
Public expenditure 8.9 10.3 3.7 2.9
Consumption 15.8 5.1 6.3 3.0
Investment 1.0 17.1 0.7 2.9
Gross national savings (as % of GNI) 35.7 33.1 31.2 31.4
BALANCE OF PAYMENTS (RM billion)
Goods balance 151.6 125.6 102.7 93.7
Exports 699.6 703.2 690.9 714.6
Imports 548.0 577.5 588.2 620.9
Services balance -6.3 -14.0 -15.0 -11.9
Primary income, net -21.8 -36.0 -35.2 -34.9
Secondary income, net -21.1 -18.2 -15.2 -16.0
Current account balance 102.4 57.3 37.3 30.8
(as % of GNI) 11.9 6.3 3.9 3.0
Bank Negara Malaysia international reserves, net3 423.3 427.2 441.9 -
(in months of retained imports) 9.6 9.5 9.5 -
PRICES (% change)
CPI (2010=100)4 3.2 1.6 2.1 3.0 ~ 4.0
PPI (2005=100)5 9.0 0.1 -1.9 -
Real wage per employee in the manufacturing sector 0.6 4.7 5.6 -
1 Beginning 2012, real GDP has been rebased to 2005 prices, from 2000 prices previously2 Exclude stocks3 All assets and liabilities in foreign currencies have been revalued into ringgit at rates of exchange ruling on the balance sheet date and the gain/loss has
been refl ected accordingly in the Bank’s account4 Effective from 2011, the Consumer Price Index has been revised to the new base year 2010=100, from 2005=100 previously5 Effective from 2010, the Producer Price Index has been revised to the new base year 2005=100, from 2000=100 previously6 Based on average USD exchange rate for the period of January-February 2014p Preliminaryf Forecast
Note: Numbers may not necessarily add up due to rounding
Table 1.2
AN
NU
AL
REP
OR
T 20
13EC
ON
OM
IC D
EVEL
OPM
ENTS
IN 2
013
15
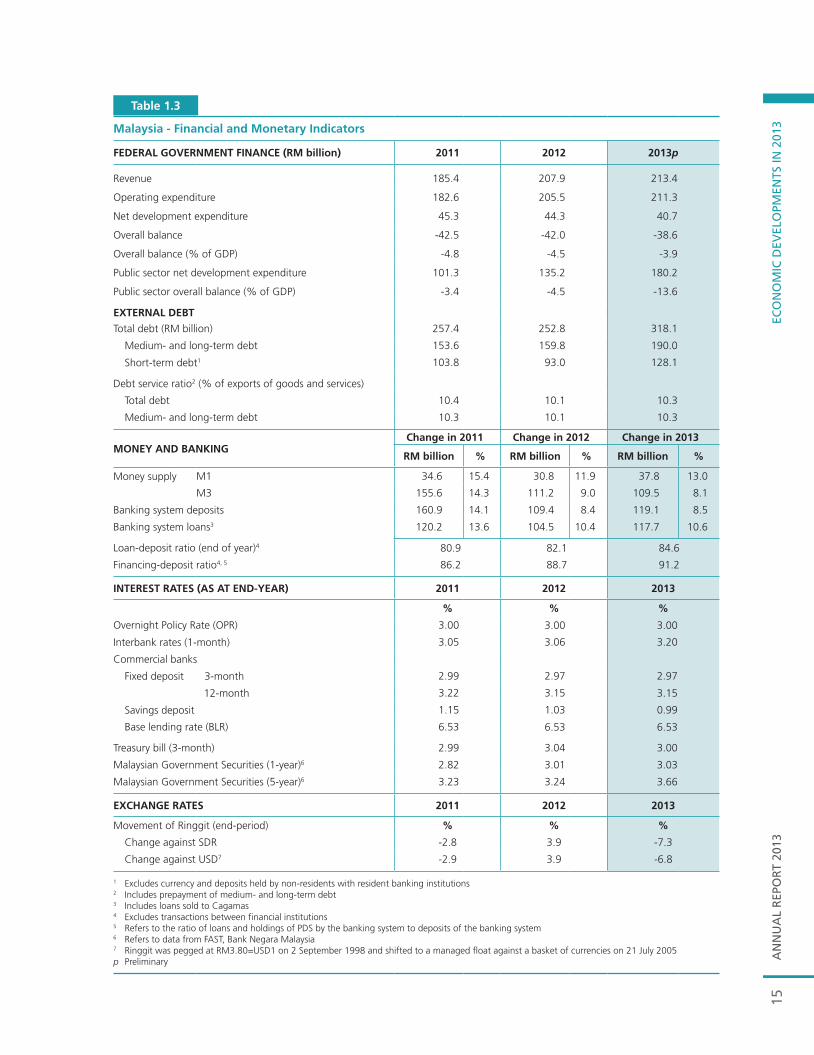
Malaysia - Financial and Monetary Indicators
FEDERAL GOVERNMENT FINANCE (RM billion) 2011 2012 2013p
Revenue 185.4 207.9 213.4
Operating expenditure 182.6 205.5 211.3
Net development expenditure 45.3 44.3 40.7
Overall balance -42.5 -42.0 -38.6
Overall balance (% of GDP) -4.8 -4.5 -3.9
Public sector net development expenditure 101.3 135.2 180.2
Public sector overall balance (% of GDP) -3.4 -4.5 -13.6
EXTERNAL DEBT
Total debt (RM billion) 257.4 252.8 318.1
Medium- and long-term debt 153.6 159.8 190.0
Short-term debt1 103.8 93.0 128.1
Debt service ratio2 (% of exports of goods and services)
Total debt 10.4 10.1 10.3
Medium- and long-term debt 10.3 10.1 10.3
Change in 2011 Change in 2012 Change in 2013MONEY AND BANKING
RM billion % RM billion % RM billion %
Money supply M1 34.6 15.4 30.8 11.9 37.8 13.0
M3 155.6 14.3 111.2 9.0 109.5 8.1
Banking system deposits 160.9 14.1 109.4 8.4 119.1 8.5
Banking system loans3 120.2 13.6 104.5 10.4 117.7 10.6
Loan-deposit ratio (end of year)4 80.9 82.1 84.6
Financing-deposit ratio4, 5 86.2 88.7 91.2
INTEREST RATES (AS AT END-YEAR) 2011 2012 2013
% % %
Overnight Policy Rate (OPR) 3.00 3.00 3.00
Interbank rates (1-month) 3.05 3.06 3.20
Commercial banks
Fixed deposit 3-month 2.99 2.97 2.97
12-month 3.22 3.15 3.15
Savings deposit 1.15 1.03 0.99
Base lending rate (BLR) 6.53 6.53 6.53
Treasury bill (3-month) 2.99 3.04 3.00
Malaysian Government Securities (1-year)6 2.82 3.01 3.03
Malaysian Government Securities (5-year)6 3.23 3.24 3.66
EXCHANGE RATES 2011 2012 2013
Movement of Ringgit (end-period) % % %
Change against SDR -2.8 3.9 -7.3
Change against USD7 -2.9 3.9 -6.8
1 Excludes currency and deposits held by non-residents with resident banking institutions2 Includes prepayment of medium- and long-term debt3 Includes loans sold to Cagamas4 Excludes transactions between fi nancial institutions5 Refers to the ratio of loans and holdings of PDS by the banking system to deposits of the banking system6 Refers to data from FAST, Bank Negara Malaysia7 Ringgit was pegged at RM3.80=USD1 on 2 September 1998 and shifted to a managed fl oat against a basket of currencies on 21 July 2005
p Preliminary
Table 1.3
AN
NU
AL R
EPOR
T 2013EC
ON
OM
IC D
EVELO
PMEN
TS IN 2013
16
and the pre-emptive measures undertaken to ensure that capital outflows would not be disruptive.
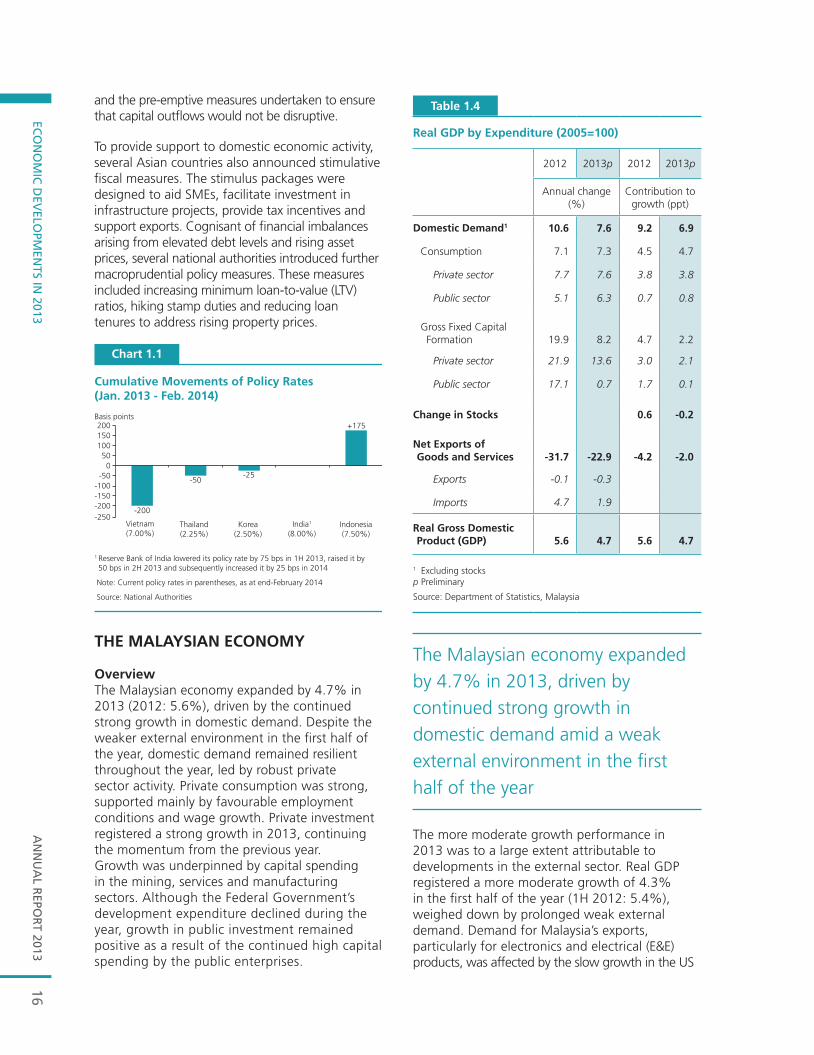
To provide support to domestic economic activity, several Asian countries also announced stimulative fiscal measures. The stimulus packages were designed to aid SMEs, facilitate investment in infrastructure projects, provide tax incentives and support exports. Cognisant of financial imbalances arising from elevated debt levels and rising asset prices, several national authorities introduced further macroprudential policy measures. These measures included increasing minimum loan-to-value (LTV) ratios, hiking stamp duties and reducing loan tenures to address rising property prices.
The Malaysian economy expanded by 4.7% in 2013, driven by continued strong growth in domestic demand amid a weak external environment in the first half of the year
The more moderate growth performance in 2013 was to a large extent attributable to developments in the external sector. Real GDP registered a more moderate growth of 4.3% in the first half of the year (1H 2012: 5.4%), weighed down by prolonged weak external demand. Demand for Malaysia’s exports, particularly for electronics and electrical (E&E) products, was affected by the slow growth in the US
1 Reserve Bank of India lowered its policy rate by 75 bps in 1H 2013, raised it by 50 bps in 2H 2013 and subsequently increased it by 25 bps in 2014
Note: Current policy rates in parentheses, as at end-February 2014
Source: National Authorities
Chart 1.1
Cumulative Movements of Policy Rates (Jan. 2013 - Feb. 2014)
-250-200-150-100-50
050
100150200
Basis points
Korea(2.50%)
Thailand(2.25%)
Indonesia(7.50%)
India1
(8.00%)Vietnam(7.00%)
-200
-50-25
+175
THE MALAYSIAN ECONOMY
OverviewThe Malaysian economy expanded by 4.7% in 2013 (2012: 5.6%), driven by the continued strong growth in domestic demand. Despite the weaker external environment in the first half of the year, domestic demand remained resilient throughout the year, led by robust private sector activity. Private consumption was strong, supported mainly by favourable employment conditions and wage growth. Private investment registered a strong growth in 2013, continuing the momentum from the previous year. Growth was underpinned by capital spending in the mining, services and manufacturing sectors. Although the Federal Government’s development expenditure declined during the year, growth in public investment remained positive as a result of the continued high capital spending by the public enterprises.
1
Real GDP by Expenditure (2005=100)
2012 2013p 2012 2013p
Annual change (%)
Contribution to growth (ppt)
Domestic Demand1 10.6 7.6 9.2 6.9
Consumption 7.1 7.3 4.5 4.7
Private sector 7.7 7.6 3.8 3.8
Public sector 5.1 6.3 0.7 0.8
Gross Fixed Capital Formation 19.9 8.2 4.7 2.2
Private sector 21.9 13.6 3.0 2.1
Public sector 17.1 0.7 1.7 0.1
Change in Stocks 0.6 -0.2
Net Exports of Goods and Services -31.7 -22.9 -4.2 -2.0
Exports -0.1 -0.3
Imports 4.7 1.9
Real Gross Domestic Product (GDP) 5.6 4.7 5.6 4.7
1 Excluding stocksp Preliminary
Source: Department of Statistics, Malaysia
Table 1.4

AN
NU
AL
REP
OR
T 20
13EC
ON
OM
IC D
EVEL
OPM
ENTS
IN 2
013
171
Real GDP by Sector (2005=100)
2012 2013p 2012 2013p
Annual change (%)
Contributionto growth (ppt)1
Agriculture 1.0 2.1 0.1 0.2
Mining & quarrying 1.4 0.5 0.1 0.0
Manufacturing 4.8 3.4 1.2 0.8
Construction 18.1 10.9 0.6 0.4
Services 6.4 5.9 3.5 3.2
Real Gross Domestic Product (GDP) 5.6 4.7 5.6 4.7
1 Numbers do not add up due to rounding and exclusion of import duties componentp Preliminary
Source: Department of Statistics, Malaysia
Table 1.5
and weak economic activity in most of the European economies. The prolonged weak demand from the advanced economies had also affected several regional economies, which in turn led to slower demand for Malaysia’s non-E&E products. As a result, real exports of goods and services declined by 2.9% in the first half of 2013. Real imports of goods and services, on the other hand, expanded further in the first half-year following sustained growth in domestic investment and consumption. This contributed to a bigger contraction in net exports. As a result of the weak export performance, Malaysia’s growth forecast for 2013 was revised downward to 4.5%-5% in August, from the earlier projection of 5%-6%. Growth forecasts were also revised downwards in some other regional economies. As the overall global growth gained momentum at the onset of the second quarter of the year, Malaysia’s real exports improved to register a positive growth of 2.3% in the second half of the year. Consequently, despite the stronger expansion in real imports, net exports recorded a smaller contraction in the second half of 2013.
From the supply perspective, the continued firm growth in domestic demand contributed to the expansion in domestic-related activities in the services and manufacturing sectors during the year, while the export-oriented industries in the manufacturing sector benefitted from the improvement in external conditions in the second half-year. Meanwhile, the robust activity in the residential and civil engineering sub-sectors contributed to the continued strong growth in the construction sector.
Domestic demand remained the key driver of growthDomestic demand remained the key driver of Malaysia’s economy, expanding by 7.6% in 2013 (2012: 10.6%). This was attributable to the robust growth in private consumption and investment. Public expenditure growth moderated but remained supportive of overall growth.
Private consumption remained strong, supported mainly by favourable employment conditions and wage growth
Private consumption continued to register a strong growth of 7.6% in 2013. Spending was underpinned mainly by favourable employment conditions and wage growth. During the year, wages in the domestic-oriented industries in the manufacturing sector recorded a stronger growth (10.3%; 2012: 6.6%), whilst those in the export-oriented industries registered sustained growth (5%; 2012: 5.2%). The implementation of the minimum wage policy on 1 January 2013 also contributed to the higher wage levels. The new policy had minimal adverse effects on employment, and was confined mostly to the fourth quarter of 2012, during which, retrenchments were temporarily higher as companies started to implement the policy. Government transfers to low- and middle-income households continued to support private consumption, albeit to a lesser extent compared to 2012. These included Bantuan Rakyat 1Malaysia (BR1M), Baucar Buku 1Malaysia (BB1M), and schooling assistance to primary and secondary school students, which in total amounted to RM3.8 billion. Private consumption was also supported by continued access to financing for creditworthy households. Outstanding consumption credit to households continued to grow, albeit at a slower pace of 8.5% (2012: 13.3%), which was in part attributable to the pre-emptive macroprudential measures introduced by the Bank in July 2013.
Public consumption recorded a higher growth of 6.3% in 2013 (2012: 5.1%) due mainly to higher expenditure on supplies and services. Expenditure on emoluments was sustained.
AN
NU
AL R
EPOR
T 2013EC
ON
OM
IC D
EVELO
PMEN
TS IN 2013
18
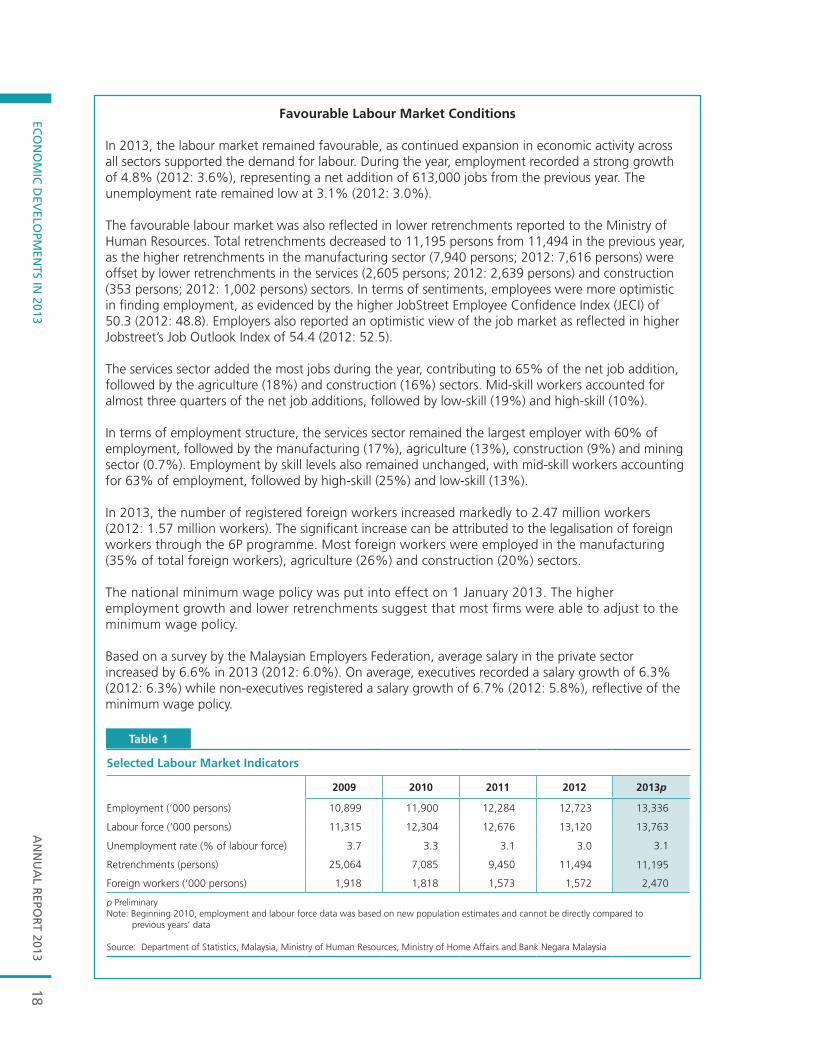
Favourable Labour Market Conditions
In 2013, the labour market remained favourable, as continued expansion in economic activity across all sectors supported the demand for labour. During the year, employment recorded a strong growth of 4.8% (2012: 3.6%), representing a net addition of 613,000 jobs from the previous year. The unemployment rate remained low at 3.1% (2012: 3.0%).
The favourable labour market was also reflected in lower retrenchments reported to the Ministry of Human Resources. Total retrenchments decreased to 11,195 persons from 11,494 in the previous year, as the higher retrenchments in the manufacturing sector (7,940 persons; 2012: 7,616 persons) were offset by lower retrenchments in the services (2,605 persons; 2012: 2,639 persons) and construction (353 persons; 2012: 1,002 persons) sectors. In terms of sentiments, employees were more optimistic in finding employment, as evidenced by the higher JobStreet Employee Confidence Index (JECI) of 50.3 (2012: 48.8). Employers also reported an optimistic view of the job market as reflected in higher Jobstreet’s Job Outlook Index of 54.4 (2012: 52.5).
The services sector added the most jobs during the year, contributing to 65% of the net job addition, followed by the agriculture (18%) and construction (16%) sectors. Mid-skill workers accounted for almost three quarters of the net job additions, followed by low-skill (19%) and high-skill (10%).
In terms of employment structure, the services sector remained the largest employer with 60% of employment, followed by the manufacturing (17%), agriculture (13%), construction (9%) and mining sector (0.7%). Employment by skill levels also remained unchanged, with mid-skill workers accounting for 63% of employment, followed by high-skill (25%) and low-skill (13%).
In 2013, the number of registered foreign workers increased markedly to 2.47 million workers (2012: 1.57 million workers). The significant increase can be attributed to the legalisation of foreign workers through the 6P programme. Most foreign workers were employed in the manufacturing (35% of total foreign workers), agriculture (26%) and construction (20%) sectors.
The national minimum wage policy was put into effect on 1 January 2013. The higher employment growth and lower retrenchments suggest that most firms were able to adjust to the minimum wage policy.
Based on a survey by the Malaysian Employers Federation, average salary in the private sector increased by 6.6% in 2013 (2012: 6.0%). On average, executives recorded a salary growth of 6.3% (2012: 6.3%) while non-executives registered a salary growth of 6.7% (2012: 5.8%), reflective of the minimum wage policy.
Table 1
Selected Labour Market Indicators
2009 2010 2011 2012 2013p
Employment (‘000 persons) 10,899 11,900 12,284 12,723 13,336
Labour force (‘000 persons) 11,315 12,304 12,676 13,120 13,763
Unemployment rate (% of labour force) 3.7 3.3 3.1 3.0 3.1
Retrenchments (persons) 25,064 7,085 9,450 11,494 11,195
Foreign workers (‘000 persons) 1,918 1,818 1,573 1,572 2,470
p PreliminaryNote: Beginning 2010, employment and labour force data was based on new population estimates and cannot be directly compared to
previous years’ data
Source: Department of Statistics, Malaysia, Ministry of Human Resources, Ministry of Home Affairs and Bank Negara Malaysia
AN
NU
AL
REP
OR
T 20
13EC
ON
OM
IC D
EVEL
OPM
ENTS
IN 2
013
19
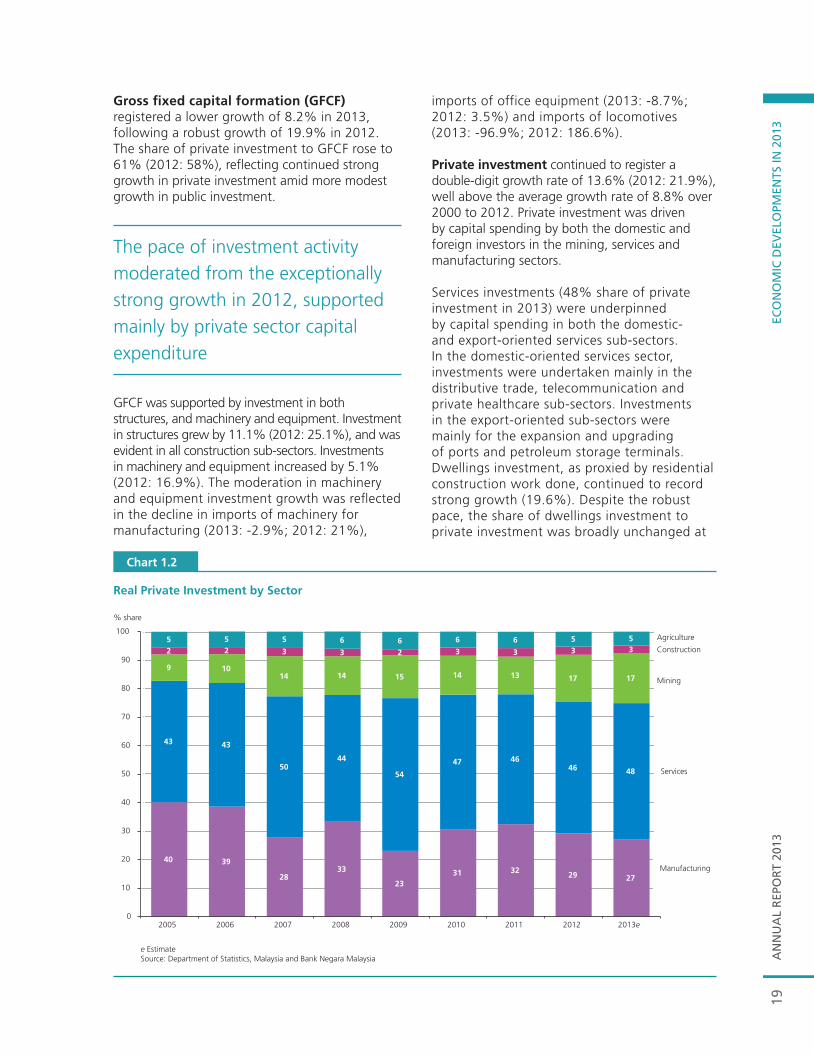
Gross fixed capital formation (GFCF) registered a lower growth of 8.2% in 2013, following a robust growth of 19.9% in 2012. The share of private investment to GFCF rose to 61% (2012: 58%), reflecting continued strong growth in private investment amid more modest growth in public investment.
The pace of investment activity moderated from the exceptionally strong growth in 2012, supported mainly by private sector capital expenditure
GFCF was supported by investment in both structures, and machinery and equipment. Investment in structures grew by 11.1% (2012: 25.1%), and was evident in all construction sub-sectors. Investments in machinery and equipment increased by 5.1% (2012: 16.9%). The moderation in machinery and equipment investment growth was reflected in the decline in imports of machinery for manufacturing (2013: -2.9%; 2012: 21%),
imports of office equipment (2013: -8.7%; 2012: 3.5%) and imports of locomotives (2013: -96.9%; 2012: 186.6%).
Private investment continued to register a double-digit growth rate of 13.6% (2012: 21.9%), well above the average growth rate of 8.8% over 2000 to 2012. Private investment was driven by capital spending by both the domestic and foreign investors in the mining, services and manufacturing sectors.
Services investments (48% share of private investment in 2013) were underpinned by capital spending in both the domestic- and export-oriented services sub-sectors. In the domestic-oriented services sector, investments were undertaken mainly in the distributive trade, telecommunication and private healthcare sub-sectors. Investments in the export-oriented sub-sectors were mainly for the expansion and upgrading of ports and petroleum storage terminals. Dwellings investment, as proxied by residential construction work done, continued to record strong growth (19.6%). Despite the robust pace, the share of dwellings investment to private investment was broadly unchanged at
Chart 1.2
Real Private Investment by Sector
e EstimateSource: Department of Statistics, Malaysia and Bank Negara Malaysia
% share
Agriculture
Construction
Mining
40 39
2833
2331 32 29 27
43 43
5044
54
47 4646 48
9 1014 14 15 14 13 17 17
2 2 3 3 2 3 3 3 35 5 5 6 6 6 6 5 5
0
10
20
30
40
50
60
70
80
90
100
2005 2006 2007 2008 2009 2010 2011 2012 2013e
Services
Manufacturing
AN
NU
AL R
EPOR
T 2013EC
ON
OM
IC D
EVELO
PMEN
TS IN 2013
20
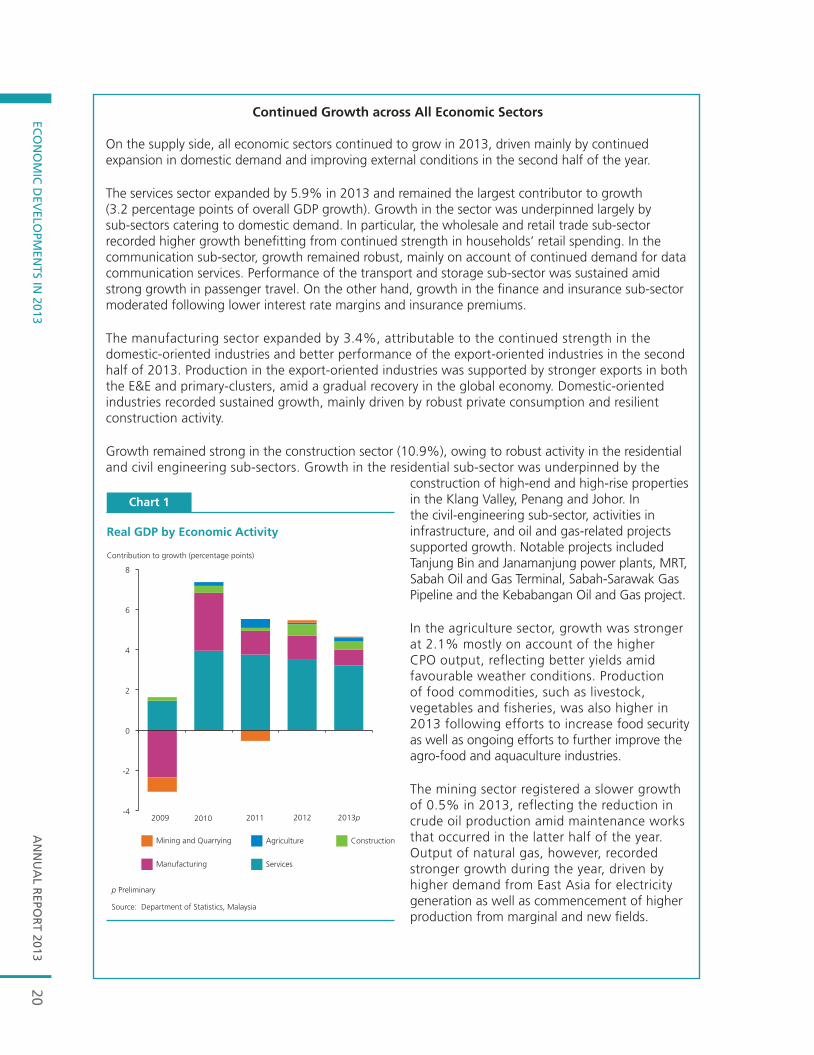
Continued Growth across All Economic Sectors
On the supply side, all economic sectors continued to grow in 2013, driven mainly by continued expansion in domestic demand and improving external conditions in the second half of the year.
The services sector expanded by 5.9% in 2013 and remained the largest contributor to growth (3.2 percentage points of overall GDP growth). Growth in the sector was underpinned largely by sub-sectors catering to domestic demand. In particular, the wholesale and retail trade sub-sector recorded higher growth benefitting from continued strength in households’ retail spending. In the communication sub-sector, growth remained robust, mainly on account of continued demand for data communication services. Performance of the transport and storage sub-sector was sustained amid strong growth in passenger travel. On the other hand, growth in the finance and insurance sub-sector moderated following lower interest rate margins and insurance premiums.
The manufacturing sector expanded by 3.4%, attributable to the continued strength in the domestic-oriented industries and better performance of the export-oriented industries in the second half of 2013. Production in the export-oriented industries was supported by stronger exports in both the E&E and primary-clusters, amid a gradual recovery in the global economy. Domestic-oriented industries recorded sustained growth, mainly driven by robust private consumption and resilient construction activity.
Growth remained strong in the construction sector (10.9%), owing to robust activity in the residential and civil engineering sub-sectors. Growth in the residential sub-sector was underpinned by the
construction of high-end and high-rise properties in the Klang Valley, Penang and Johor. In the civil-engineering sub-sector, activities in infrastructure, and oil and gas-related projects supported growth. Notable projects included Tanjung Bin and Janamanjung power plants, MRT, Sabah Oil and Gas Terminal, Sabah-Sarawak Gas Pipeline and the Kebabangan Oil and Gas project.
In the agriculture sector, growth was stronger at 2.1% mostly on account of the higher CPO output, reflecting better yields amid favourable weather conditions. Production of food commodities, such as livestock, vegetables and fisheries, was also higher in 2013 following efforts to increase food security as well as ongoing efforts to further improve the agro-food and aquaculture industries.
The mining sector registered a slower growth of 0.5% in 2013, reflecting the reduction in crude oil production amid maintenance works that occurred in the latter half of the year. Output of natural gas, however, recorded stronger growth during the year, driven by higher demand from East Asia for electricity generation as well as commencement of higher production from marginal and new fields.
Chart 1
Real GDP by Economic Activity
Contribution to growth (percentage points)
2009 2010 2011 2012 2013p-4
-2
0
2
4
6
8
p Preliminary
Source: Department of Statistics, Malaysia
Mining and Quarrying Agriculture
Manufacturing Services
Construction
AN
NU
AL
REP
OR
T 20
13EC
ON
OM
IC D
EVEL
OPM
ENTS
IN 2
013
21
17% as investments in other sectors also recorded strong growth rates.
Mining investment (17% share of private investment) remained strong in 2013, reflecting continued capital spending in major upstream projects, such as the Gumusut-Kakap deepwater field, Enhanced Oil Recovery of the Tapis oil field and the Berantai and Balai marginal fields. In the manufacturing sector (27% of private investment), investments were undertaken in both the export-oriented industries such as the E&E and medical devices, and the domestic-oriented industries, particularly in food manufacturing. This expansion reflected improving business sentiment following the gradual improvement in external demand and sustained strong domestic consumption.
Public investment recorded a small positive growth of 0.7% (2012: 17.1%), following the decline in the Federal Government’s development expenditure. Nevertheless, this was offset by higher capital spending by the public enterprises, which were channelled mainly into the oil and gas, transportation and energy sectors. The major projects in the oil and gas sector were Sabah Ammonia-Urea Plant, Sabah-Sarawak Gas Pipeline and Kinabalu Non-Associated Gas (NAG) upstream development. Investment in the transportation sub-sector was supported by the construction of the MY Rapid Transit (MRT) and further work on the Light Rapid Transit (LRT) extension. Investment in the utilities sub-sector included the building of power plants, such as in Tanjung Bin and Janamanjung. The Federal Government’s development expenditure in the economic sector was directed mainly to transportation, and trade and industry, particularly to upgrade infrastructure facilities in industrial areas.
EXTERNAL SECTOR
In 2013, Malaysia’s external sector remained resilient amid a challenging global economic and financial environment. The current account surplus narrowed, but more than offset the net outflows in the financial account. The level of international reserves of Bank Negara Malaysia remained high and was more than sufficient to meet short-term external obligations and to provide a buffer against external shocks.
Developments in the external sector in 2013 were broadly characterised by two distinct periods. In the first half of the year, the current account recorded a smaller surplus of RM11.2 billion (1H 2012: RM24.8 billion), on account of a
smaller trade surplus amid lower services and income deficits. The continued economic weakness in the advanced countries resulted in a marked decline in Malaysia’s exports (1H 2013: -4%). Demand for E&E products remained weak (1H 2013: -3.9%), as exports of personal computers (PC) and electrical products were weighed down by a delay in the global IT replacement cycle. Lower-than-expected growth in regional economies also affected demand for non-E&E manufactured products (1H 2013: 3.4%) such as iron and steel, optical and scientific equipment, wood and rubber products. In addition, the lower prices of Malaysia’s key commodities in the first half of the year also dampened the export performance. On the other hand, robust domestic investment and consumption activities continued to drive the growth of imports (1H 2013: 4.4%). The services and income deficits narrowed due mainly to higher net travel receipts and lower net primary income payments. The increase in net travel receipts was attributed to stronger intra-regional tourism, while higher profits of Malaysian companies investing abroad, particularly in the financial services sub-sector, contributed to the decrease in net primary income payments.
The external sector remained resilient amid a challenging global economic environment
In the second half of the year, the current account surplus widened to RM26.1 billion as export growth returned to positive territory. The improvement in Malaysia’s exports (2H 2013: 8.9%) was due to an increase in demand across both manufactured products and commodities. This was further reinforced by more favourable prices of CPO and LNG relative to the first half of 2013. Exports to the EU and the region were higher, in tandem with the improvement in economic activity in these economies. Imports grew at a stronger pace (2H 2013: 9.5%) as firm domestic demand contributed to imports of capital and consumption goods. In particular, sustained investment activity in the domestic-oriented sectors led to higher imports of telecommunication and construction services. The expansion in trade activity also resulted in higher payments for freight services. Net payments for other services components were sustained as the improvement in receipts offset the higher payments.
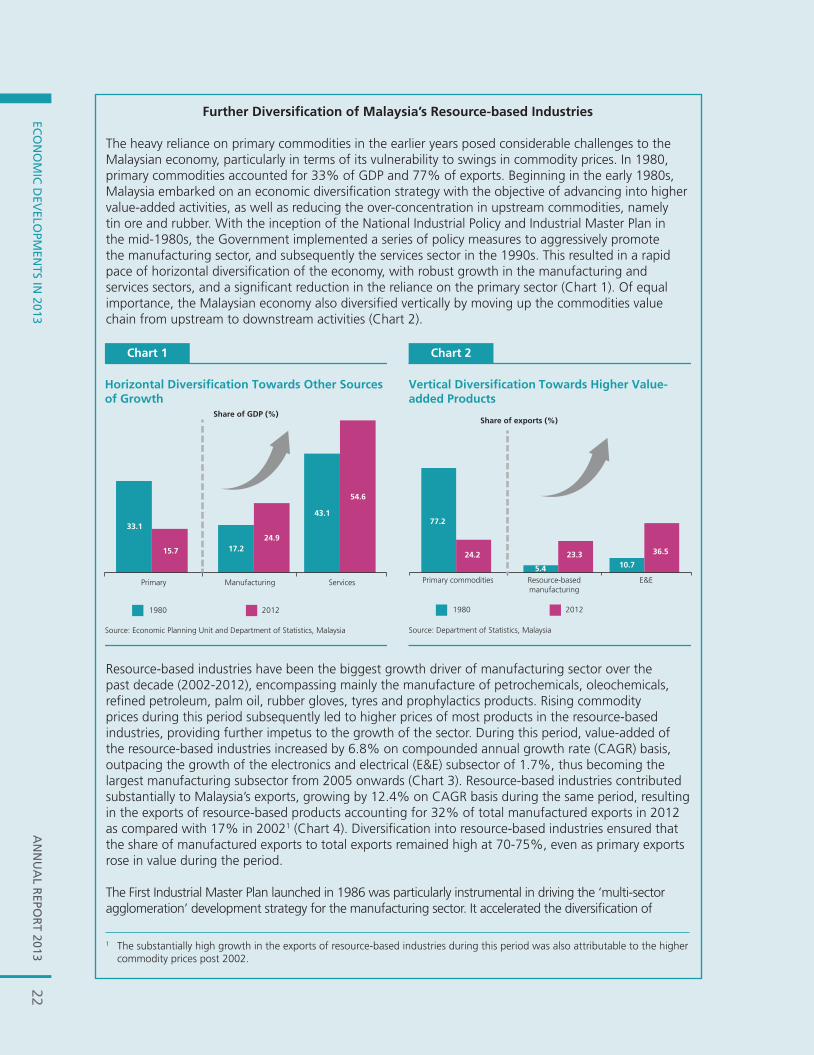
22A
NN
UA
L REPO
RT 2013
ECO
NO
MIC
DEV
ELOPM
ENTS IN
20132
AN
NU
AL R
EPOR
T 2013EC
ON
OM
IC D
EVELO
PMEN
TS IN 2013
Further Diversifi cation of Malaysia’s Resource-based Industries
The heavy reliance on primary commodities in the earlier years posed considerable challenges to the Malaysian economy, particularly in terms of its vulnerability to swings in commodity prices. In 1980, primary commodities accounted for 33% of GDP and 77% of exports. Beginning in the early 1980s, Malaysia embarked on an economic diversifi cation strategy with the objective of advancing into higher value-added activities, as well as reducing the over-concentration in upstream commodities, namely tin ore and rubber. With the inception of the National Industrial Policy and Industrial Master Plan in the mid-1980s, the Government implemented a series of policy measures to aggressively promote the manufacturing sector, and subsequently the services sector in the 1990s. This resulted in a rapid pace of horizontal diversifi cation of the economy, with robust growth in the manufacturing and services sectors, and a signifi cant reduction in the reliance on the primary sector (Chart 1). Of equal importance, the Malaysian economy also diversifi ed vertically by moving up the commodities value chain from upstream to downstream activities (Chart 2).
1 The substantially high growth in the exports of resource-based industries during this period was also attributable to the higher commodity prices post 2002.
Chart 1
Horizontal Diversification Towards Other Sourcesof Growth
Share of GDP (%)
33.1
17.2
43.1
15.7
24.9
54.6
Manufacturing Services
1980 2012
Source: Economic Planning Unit and Department of Statistics, Malaysia
Primary
Chart 2
Vertical Diversification Towards Higher Value-added Products
1980 2012
Source: Department of Statistics, Malaysia
Share of exports (%)
Resource-basedmanufacturing
E&EPrimary commodities
77.2
5.4 10.724.2 23.3 36.5
Resource-based industries have been the biggest growth driver of manufacturing sector over the past decade (2002-2012), encompassing mainly the manufacture of petrochemicals, oleochemicals, refi ned petroleum, palm oil, rubber gloves, tyres and prophylactics products. Rising commodity prices during this period subsequently led to higher prices of most products in the resource-based industries, providing further impetus to the growth of the sector. During this period, value-added of the resource-based industries increased by 6.8% on compounded annual growth rate (CAGR) basis, outpacing the growth of the electronics and electrical (E&E) subsector of 1.7%, thus becoming the largest manufacturing subsector from 2005 onwards (Chart 3). Resource-based industries contributed substantially to Malaysia’s exports, growing by 12.4% on CAGR basis during the same period, resulting in the exports of resource-based products accounting for 32% of total manufactured exports in 2012 as compared with 17% in 20021 (Chart 4). Diversifi cation into resource-based industries ensured that the share of manufactured exports to total exports remained high at 70-75%, even as primary exports rose in value during the period.
The First Industrial Master Plan launched in 1986 was particularly instrumental in driving the ‘multi-sector agglomeration’ development strategy for the manufacturing sector. It accelerated the diversifi cation of
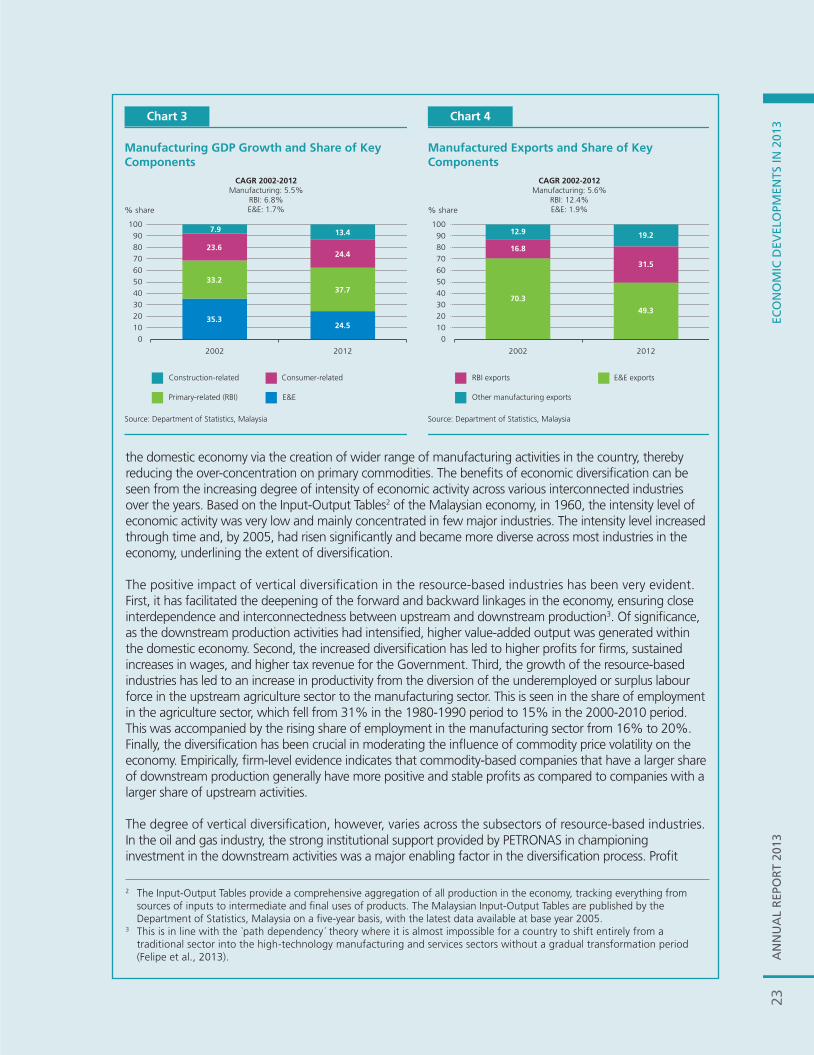
23A
NN
UA
L R
EPO
RT
2013
ECO
NO
MIC
DEV
ELO
PMEN
TS IN
201
33
AN
NU
AL
REP
OR
T 20
13EC
ON
OM
IC D
EVEL
OPM
ENTS
IN 2
013
the domestic economy via the creation of wider range of manufacturing activities in the country, thereby reducing the over-concentration on primary commodities. The benefi ts of economic diversifi cation can be seen from the increasing degree of intensity of economic activity across various interconnected industries over the years. Based on the Input-Output Tables2 of the Malaysian economy, in 1960, the intensity level of economic activity was very low and mainly concentrated in few major industries. The intensity level increased through time and, by 2005, had risen signifi cantly and became more diverse across most industries in the economy, underlining the extent of diversifi cation.
The positive impact of vertical diversifi cation in the resource-based industries has been very evident. First, it has facilitated the deepening of the forward and backward linkages in the economy, ensuring close interdependence and interconnectedness between upstream and downstream production3. Of signifi cance, as the downstream production activities had intensifi ed, higher value-added output was generated within the domestic economy. Second, the increased diversifi cation has led to higher profi ts for fi rms, sustained increases in wages, and higher tax revenue for the Government. Third, the growth of the resource-based industries has led to an increase in productivity from the diversion of the underemployed or surplus labour force in the upstream agriculture sector to the manufacturing sector. This is seen in the share of employment in the agriculture sector, which fell from 31% in the 1980-1990 period to 15% in the 2000-2010 period. This was accompanied by the rising share of employment in the manufacturing sector from 16% to 20%. Finally, the diversifi cation has been crucial in moderating the infl uence of commodity price volatility on the economy. Empirically, fi rm-level evidence indicates that commodity-based companies that have a larger share of downstream production generally have more positive and stable profi ts as compared to companies with a larger share of upstream activities.
The degree of vertical diversifi cation, however, varies across the subsectors of resource-based industries. In the oil and gas industry, the strong institutional support provided by PETRONAS in championing investment in the downstream activities was a major enabling factor in the diversifi cation process. Profi t
2 The Input-Output Tables provide a comprehensive aggregation of all production in the economy, tracking everything from sources of inputs to intermediate and fi nal uses of products. The Malaysian Input-Output Tables are published by the Department of Statistics, Malaysia on a fi ve-year basis, with the latest data available at base year 2005.
3 This is in line with the `path dependency´ theory where it is almost impossible for a country to shift entirely from a traditional sector into the high-technology manufacturing and services sectors without a gradual transformation period (Felipe et al., 2013).
Chart 4
Manufactured Exports and Share of KeyComponents
RBI exports E&E exports
Other manufacturing exports
Source: Department of Statistics, Malaysia
CAGR 2002-2012Manufacturing: 5.6%
RBI: 12.4%E&E: 1.9%
2002 2012
% share
0
10
20
30
40
50
60
70
80
90
100
31.5
70.3
16.8
19.212.9
49.3
Chart 3
Manufacturing GDP Growth and Share of KeyComponents
Construction-related Consumer-related
Primary-related (RBI) E&E
Source: Department of Statistics, Malaysia
CAGR 2002-2012Manufacturing: 5.5%
RBI: 6.8%E&E: 1.7%
1035.3
24.5
33.237.7
23.624.4
7.9 13.4
2002 2012
% share
0
20
30
40
50
60
70
80
90
100
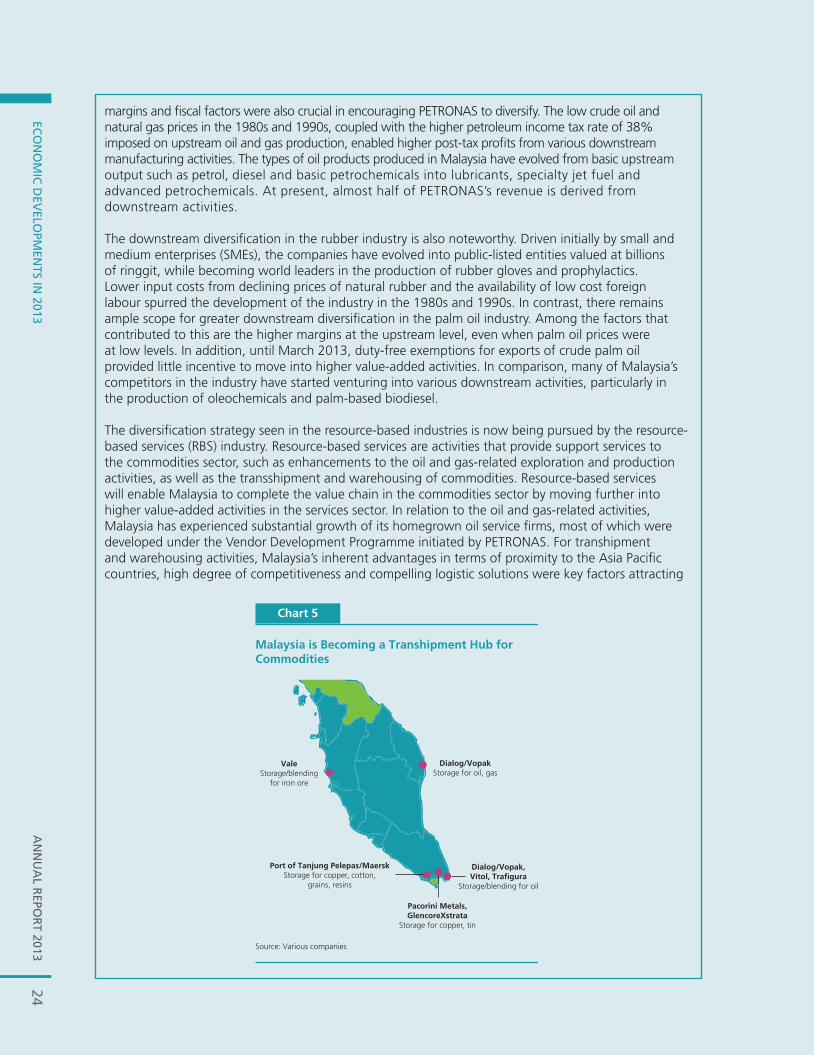
24A
NN
UA
L REPO
RT 2013
ECO
NO
MIC
DEV
ELOPM
ENTS IN
20134
AN
NU
AL R
EPOR
T 2013EC
ON
OM
IC D
EVELO
PMEN
TS IN 2013
margins and fi scal factors were also crucial in encouraging PETRONAS to diversify. The low crude oil and natural gas prices in the 1980s and 1990s, coupled with the higher petroleum income tax rate of 38% imposed on upstream oil and gas production, enabled higher post-tax profi ts from various downstream manufacturing activities. The types of oil products produced in Malaysia have evolved from basic upstream output such as petrol, diesel and basic petrochemicals into lubricants, specialty jet fuel and advanced petrochemicals. At present, almost half of PETRONAS’s revenue is derived from downstream activities.
The downstream diversifi cation in the rubber industry is also noteworthy. Driven initially by small and medium enterprises (SMEs), the companies have evolved into public-listed entities valued at billions of ringgit, while becoming world leaders in the production of rubber gloves and prophylactics. Lower input costs from declining prices of natural rubber and the availability of low cost foreign labour spurred the development of the industry in the 1980s and 1990s. In contrast, there remains ample scope for greater downstream diversifi cation in the palm oil industry. Among the factors that contributed to this are the higher margins at the upstream level, even when palm oil prices were at low levels. In addition, until March 2013, duty-free exemptions for exports of crude palm oil provided little incentive to move into higher value-added activities. In comparison, many of Malaysia’s competitors in the industry have started venturing into various downstream activities, particularly in the production of oleochemicals and palm-based biodiesel.
The diversifi cation strategy seen in the resource-based industries is now being pursued by the resource-based services (RBS) industry. Resource-based services are activities that provide support services to the commodities sector, such as enhancements to the oil and gas-related exploration and production activities, as well as the transshipment and warehousing of commodities. Resource-based services will enable Malaysia to complete the value chain in the commodities sector by moving further into higher value-added activities in the services sector. In relation to the oil and gas-related activities, Malaysia has experienced substantial growth of its homegrown oil service fi rms, most of which were developed under the Vendor Development Programme initiated by PETRONAS. For transhipment and warehousing activities, Malaysia’s inherent advantages in terms of proximity to the Asia Pacifi c countries, high degree of competitiveness and compelling logistic solutions were key factors attracting
Chart 5
Malaysia is Becoming a Transhipment Hub forCommodities
Source: Various companies
Dialog/VopakStorage for oil, gas
Dialog/Vopak,Vitol, Trafigura
Storage/blending for oil
Pacorini Metals,GlencoreXstrata
Storage for copper, tin
ValeStorage/blending
for iron ore
Port of Tanjung Pelepas/MaerskStorage for copper, cotton,
grains, resins

25A
NN
UA
L R
EPO
RT
2013
ECO
NO
MIC
DEV
ELO
PMEN
TS IN
201
35
AN
NU
AL
REP
OR
T 20
13EC
ON
OM
IC D
EVEL
OPM
ENTS
IN 2
013
many fi rms to set up their operations in Malaysia (Chart 5). Replicating the success of resource-based industries, the Government has taken the lead in promoting resource-based services. As an example, the Global Incentive for Trading (GIFT) programme was recently introduced to accelerate commodities trading in the country. The programme is targeted at attracting international trading companies to locate their regional operations, with the aim of establishing Malaysia as the key offshore trading hub in the region.
Going forward, resource-based industries and resource-based services are important sectors that can advance Malaysia’s goal of becoming a high income nation by 2020. Even now, there is substantial evidence that Malaysia is already progressing in the right direction. Several manufacturers in the resource-based industries have already moved into producing higher value-added products, such as nitrile-based gloves for the healthcare industry. In terms of resource-based services, the rise in transshipment activities has been refl ected in the sharp 44% year-on-year rise in re-exports in 2012 and a further 40% in 2013. This development will contribute towards further improving the country’s fundamentals by creating higher value-added activities and by diversifying the sources of growth in the economy.
Reference
Felipe J., R. Briones, D.H. Brooks, A. Mehta and H. Verspagen (2013), `Asia’s Economic Transformation: Where to, How, and How Fast?´. Special chapter in Key Indicators for Asia and the Pacifi c 2013, Asian Development Bank (ADB).
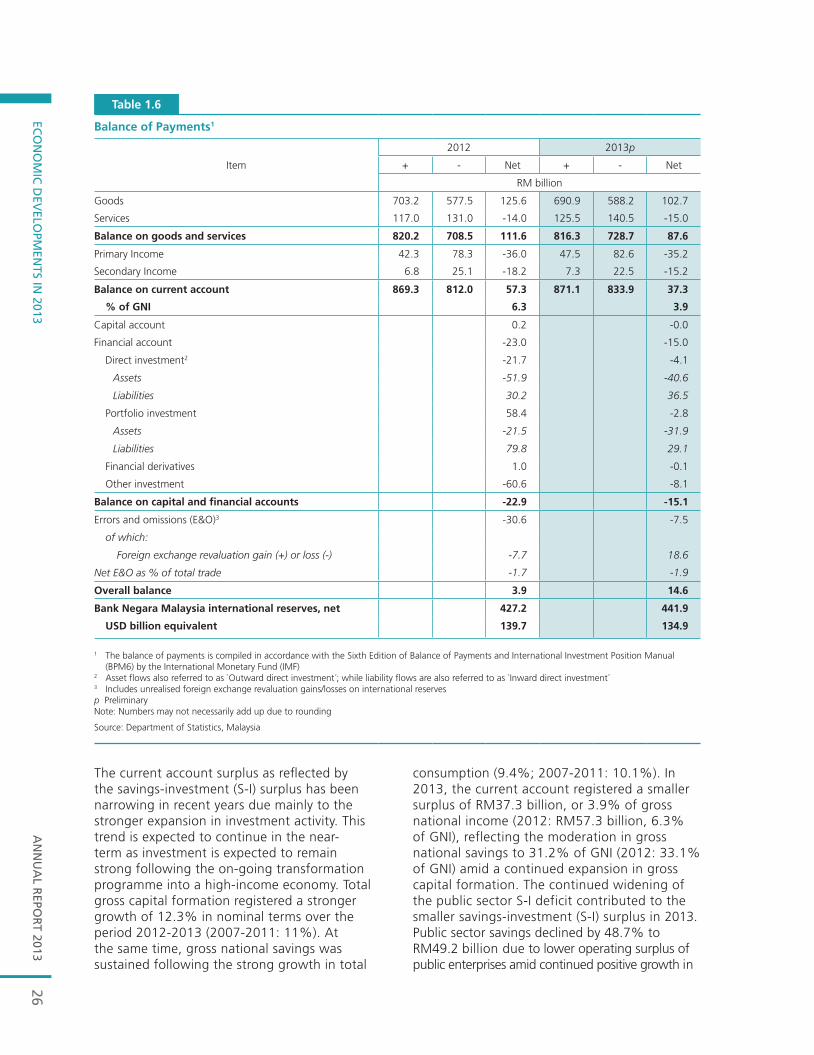
AN
NU
AL R
EPOR
T 2013EC
ON
OM
IC D
EVELO
PMEN
TS IN 2013
26
Balance of Payments1
2012 2013p
Item + - Net + - Net
RM billion
Goods 703.2 577.5 125.6 690.9 588.2 102.7
Services 117.0 131.0 -14.0 125.5 140.5 -15.0
Balance on goods and services 820.2 708.5 111.6 816.3 728.7 87.6
Primary Income 42.3 78.3 -36.0 47.5 82.6 -35.2
Secondary Income 6.8 25.1 -18.2 7.3 22.5 -15.2
Balance on current account 869.3 812.0 57.3 871.1 833.9 37.3
% of GNI 6.3 3.9
Capital account 0.2 -0.0
Financial account -23.0 -15.0
Direct investment2 -21.7 -4.1
Assets -51.9 -40.6
Liabilities 30.2 36.5
Portfolio investment 58.4 -2.8
Assets -21.5 -31.9
Liabilities 79.8 29.1
Financial derivatives 1.0 -0.1
Other investment -60.6 -8.1
Balance on capital and fi nancial accounts -22.9 -15.1
Errors and omissions (E&O)3 -30.6 -7.5
of which:
Foreign exchange revaluation gain (+) or loss (-) -7.7 18.6
Net E&O as % of total trade -1.7 -1.9
Overall balance 3.9 14.6
Bank Negara Malaysia international reserves, net 427.2 441.9
USD billion equivalent 139.7 134.9
1 The balance of payments is compiled in accordance with the Sixth Edition of Balance of Payments and International Investment Position Manual (BPM6) by the International Monetary Fund (IMF)
2 Asset fl ows also referred to as `Outward direct investment´; while liability fl ows are also referred to as `Inward direct investment´3 Includes unrealised foreign exchange revaluation gains/losses on international reservesp Preliminary Note: Numbers may not necessarily add up due to rounding
Source: Department of Statistics, Malaysia
Table 1.6
The current account surplus as reflected by the savings-investment (S-I) surplus has been narrowing in recent years due mainly to the stronger expansion in investment activity. This trend is expected to continue in the near-term as investment is expected to remain strong following the on-going transformation programme into a high-income economy. Total gross capital formation registered a stronger growth of 12.3% in nominal terms over the period 2012-2013 (2007-2011: 11%). At the same time, gross national savings was sustained following the strong growth in total
consumption (9.4%; 2007-2011: 10.1%). In 2013, the current account registered a smaller surplus of RM37.3 billion, or 3.9% of gross national income (2012: RM57.3 billion, 6.3% of GNI), reflecting the moderation in gross national savings to 31.2% of GNI (2012: 33.1% of GNI) amid a continued expansion in gross capital formation. The continued widening of the public sector S-I deficit contributed to the smaller savings-investment (S-I) surplus in 2013. Public sector savings declined by 48.7% to RM49.2 billion due to lower operating surplus of public enterprises amid continued positive growth in
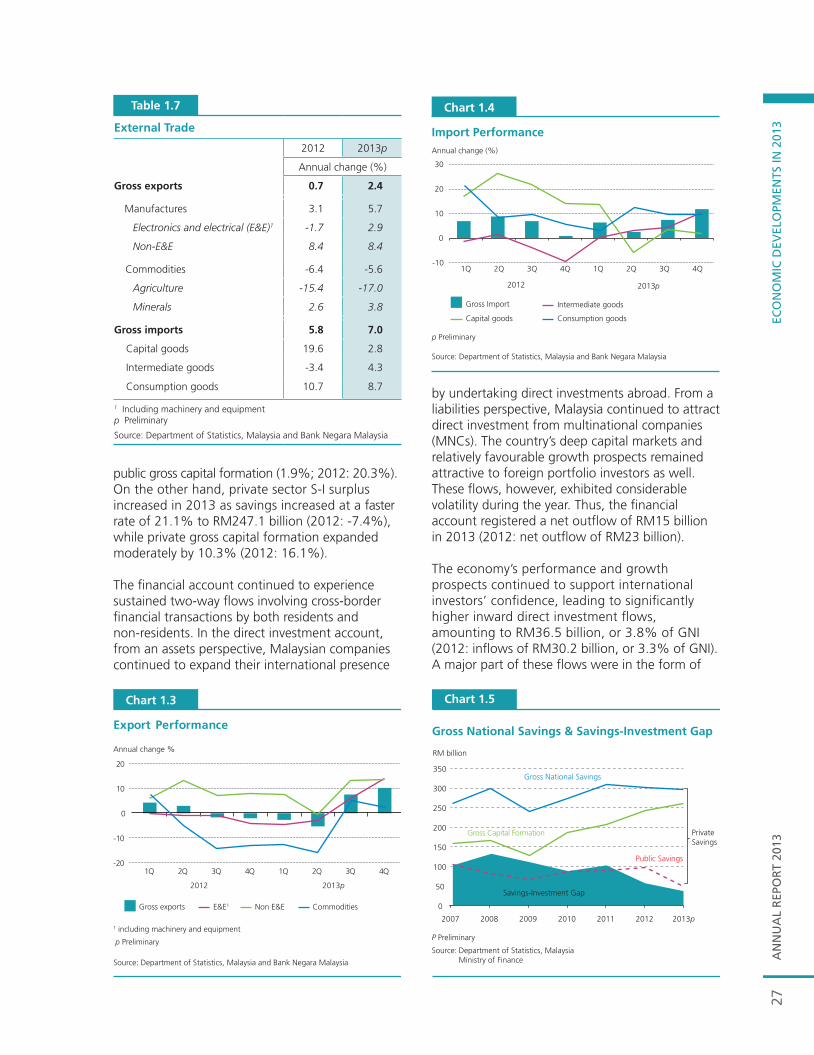
AN
NU
AL
REP
OR
T 20
13EC
ON
OM
IC D
EVEL
OPM
ENTS
IN 2
013
27
by undertaking direct investments abroad. From a liabilities perspective, Malaysia continued to attract direct investment from multinational companies (MNCs). The country’s deep capital markets and relatively favourable growth prospects remained attractive to foreign portfolio investors as well. These flows, however, exhibited considerable volatility during the year. Thus, the financial account registered a net outflow of RM15 billion in 2013 (2012: net outflow of RM23 billion).
The economy’s performance and growth prospects continued to support international investors’ confidence, leading to significantly higher inward direct investment flows, amounting to RM36.5 billion, or 3.8% of GNI (2012: inflows of RM30.2 billion, or 3.3% of GNI). A major part of these flows were in the form of
1
Table 1.7
External Trade
2012 2013p
Annual change (%)
Gross exports 0.7 2.4
Manufactures 3.1 5.7
Electronics and electrical (E&E)1 -1.7 2.9
Non-E&E 8.4 8.4
Commodities -6.4 -5.6
Agriculture -15.4 -17.0
Minerals 2.6 3.8
Gross imports 5.8 7.0
Capital goods 19.6 2.8
Intermediate goods -3.4 4.3
Consumption goods 10.7 8.7
1 Including machinery and equipmentp Preliminary
Source: Department of Statistics, Malaysia and Bank Negara Malaysia
Chart 1.3
Export Performance
E&E1 Non E&E Commodities
2012
Annual change %
Source: Department of Statistics, Malaysia and Bank Negara Malaysia
2013p
p Preliminary
-20
-10
0
10
20
1Q 2Q 3Q 4Q 1Q 2Q 3Q 4Q
Gross exports
1 including machinery and equipment
Chart 1.4
Import Performance
Gross Import Intermediate goods
Capital goods Consumption goods
Source: Department of Statistics, Malaysia and Bank Negara Malaysia
p Preliminary
-10
0
10
20
30
1Q 2Q 3Q 4Q 1Q 2Q 3Q 4Q
2012
Annual change (%)
2013p
public gross capital formation (1.9%; 2012: 20.3%). On the other hand, private sector S-I surplus increased in 2013 as savings increased at a faster rate of 21.1% to RM247.1 billion (2012: -7.4%), while private gross capital formation expanded moderately by 10.3% (2012: 16.1%). The financial account continued to experience sustained two-way flows involving cross-border financial transactions by both residents and non-residents. In the direct investment account, from an assets perspective, Malaysian companies continued to expand their international presence
Gross National Savings & Savings-Investment Gap
Chart 1.5
P Preliminary
Source: Department of Statistics, Malaysia Ministry of Finance
RM billion
2007 2008 2009 2010 2011 2012 2013p
0
50
100
150
200
250
300
350
Savings-Investment Gap
Gross National Savings
Gross Capital Formation
Public Savings
PrivateSavings
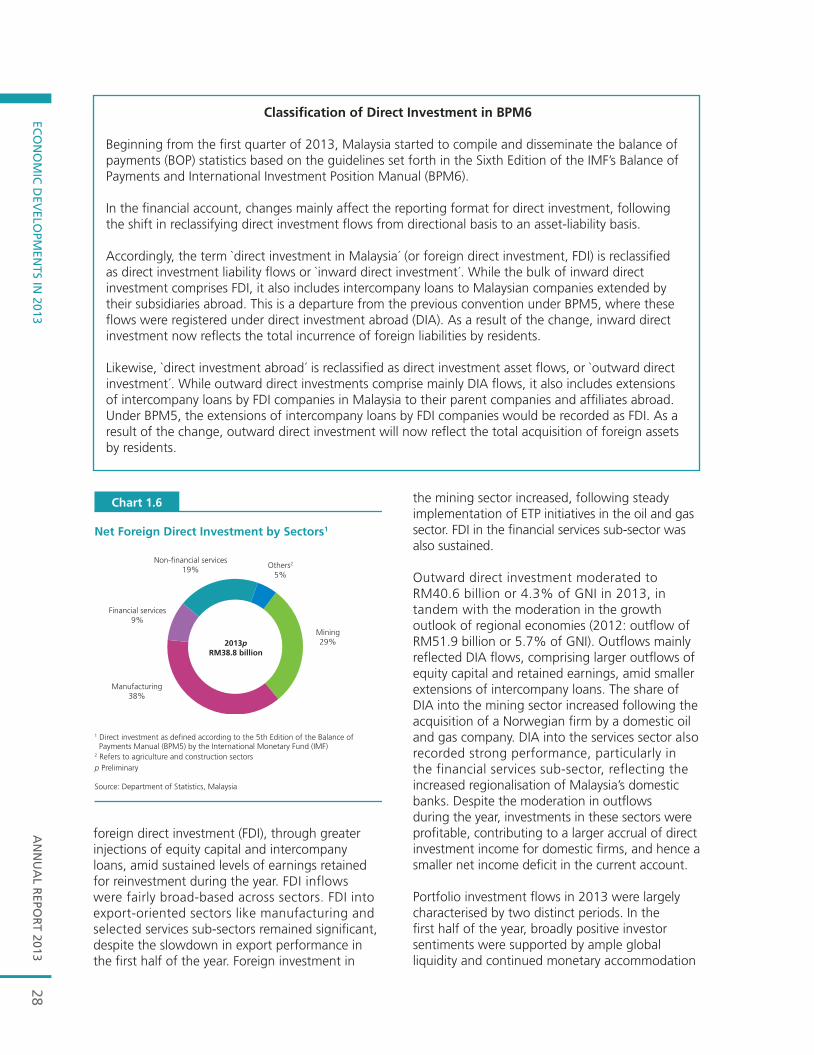
AN
NU
AL R
EPOR
T 2013EC
ON
OM
IC D
EVELO
PMEN
TS IN 2013
28
foreign direct investment (FDI), through greater injections of equity capital and intercompany loans, amid sustained levels of earnings retained for reinvestment during the year. FDI inflows were fairly broad-based across sectors. FDI into export-oriented sectors like manufacturing and selected services sub-sectors remained significant, despite the slowdown in export performance in the first half of the year. Foreign investment in
the mining sector increased, following steady implementation of ETP initiatives in the oil and gas sector. FDI in the financial services sub-sector was also sustained. Outward direct investment moderated to RM40.6 billion or 4.3% of GNI in 2013, in tandem with the moderation in the growth outlook of regional economies (2012: outflow of RM51.9 billion or 5.7% of GNI). Outflows mainly reflected DIA flows, comprising larger outflows of equity capital and retained earnings, amid smaller extensions of intercompany loans. The share of DIA into the mining sector increased following the acquisition of a Norwegian firm by a domestic oil and gas company. DIA into the services sector also recorded strong performance, particularly in the financial services sub-sector, reflecting the increased regionalisation of Malaysia’s domestic banks. Despite the moderation in outflows during the year, investments in these sectors were profitable, contributing to a larger accrual of direct investment income for domestic firms, and hence a smaller net income deficit in the current account.
Portfolio investment flows in 2013 were largely characterised by two distinct periods. In the first half of the year, broadly positive investor sentiments were supported by ample global liquidity and continued monetary accommodation
Classification of Direct Investment in BPM6
Beginning from the first quarter of 2013, Malaysia started to compile and disseminate the balance of payments (BOP) statistics based on the guidelines set forth in the Sixth Edition of the IMF’s Balance of Payments and International Investment Position Manual (BPM6).
In the financial account, changes mainly affect the reporting format for direct investment, following the shift in reclassifying direct investment flows from directional basis to an asset-liability basis.
Accordingly, the term `direct investment in Malaysia´ (or foreign direct investment, FDI) is reclassified as direct investment liability flows or `inward direct investment´. While the bulk of inward direct investment comprises FDI, it also includes intercompany loans to Malaysian companies extended by their subsidiaries abroad. This is a departure from the previous convention under BPM5, where these flows were registered under direct investment abroad (DIA). As a result of the change, inward direct investment now reflects the total incurrence of foreign liabilities by residents.
Likewise, `direct investment abroad´ is reclassified as direct investment asset flows, or `outward direct investment´. While outward direct investments comprise mainly DIA flows, it also includes extensions of intercompany loans by FDI companies in Malaysia to their parent companies and affiliates abroad. Under BPM5, the extensions of intercompany loans by FDI companies would be recorded as FDI. As a result of the change, outward direct investment will now reflect the total acquisition of foreign assets by residents.
Chart 1.6
Net Foreign Direct Investment by Sectors1
Source: Department of Statistics, Malaysia
1 Direct investment as defined according to the 5th Edition of the Balance of
Mining29%
Manufacturing38%
Financial services9%
Non-financial services19% Others2
5%
2013pRM38.8 billion
p Preliminary
2 Refers to agriculture and construction sectorsPayments Manual (BPM5) by the International Monetary Fund (IMF)
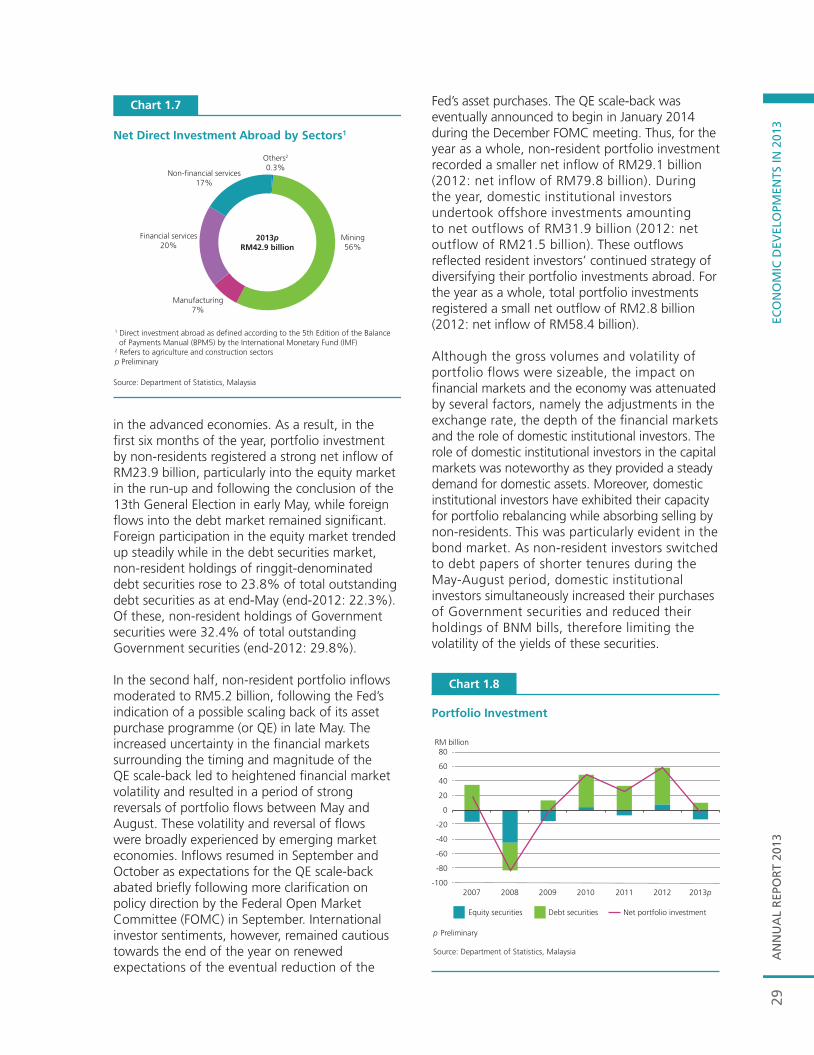
AN
NU
AL
REP
OR
T 20
13EC
ON
OM
IC D
EVEL
OPM
ENTS
IN 2
013
29
Fed’s asset purchases. The QE scale-back was eventually announced to begin in January 2014 during the December FOMC meeting. Thus, for the year as a whole, non-resident portfolio investment recorded a smaller net inflow of RM29.1 billion (2012: net inflow of RM79.8 billion). During the year, domestic institutional investors undertook offshore investments amounting to net outflows of RM31.9 billion (2012: net outflow of RM21.5 billion). These outflows reflected resident investors’ continued strategy of diversifying their portfolio investments abroad. For the year as a whole, total portfolio investments registered a small net outflow of RM2.8 billion (2012: net inflow of RM58.4 billion).
Although the gross volumes and volatility of portfolio flows were sizeable, the impact on financial markets and the economy was attenuated by several factors, namely the adjustments in the exchange rate, the depth of the financial markets and the role of domestic institutional investors. The role of domestic institutional investors in the capital markets was noteworthy as they provided a steady demand for domestic assets. Moreover, domestic institutional investors have exhibited their capacity for portfolio rebalancing while absorbing selling by non-residents. This was particularly evident in the bond market. As non-resident investors switched to debt papers of shorter tenures during the May-August period, domestic institutional investors simultaneously increased their purchases of Government securities and reduced their holdings of BNM bills, therefore limiting the volatility of the yields of these securities.
Chart 1.7
Net Direct Investment Abroad by Sectors1
Source: Department of Statistics, Malaysia
Mining56%
Financial services20%
Others2
0.3%
2013pRM42.9 billion
Non-financial services17%
Manufacturing7%
1 Direct investment abroad as defined according to the 5th Edition of the Balance of Payments Manual (BPM5) by the International Monetary Fund (IMF)2 Refers to agriculture and construction sectorsp Preliminary
in the advanced economies. As a result, in the first six months of the year, portfolio investment by non-residents registered a strong net inflow of RM23.9 billion, particularly into the equity market in the run-up and following the conclusion of the 13th General Election in early May, while foreign flows into the debt market remained significant. Foreign participation in the equity market trended up steadily while in the debt securities market, non-resident holdings of ringgit-denominated debt securities rose to 23.8% of total outstanding debt securities as at end-May (end-2012: 22.3%). Of these, non-resident holdings of Government securities were 32.4% of total outstanding Government securities (end-2012: 29.8%).
In the second half, non-resident portfolio inflows moderated to RM5.2 billion, following the Fed’s indication of a possible scaling back of its asset purchase programme (or QE) in late May. The increased uncertainty in the financial markets surrounding the timing and magnitude of the QE scale-back led to heightened financial market volatility and resulted in a period of strong reversals of portfolio flows between May and August. These volatility and reversal of flows were broadly experienced by emerging market economies. Inflows resumed in September and October as expectations for the QE scale-back abated briefly following more clarification on policy direction by the Federal Open Market Committee (FOMC) in September. International investor sentiments, however, remained cautious towards the end of the year on renewed expectations of the eventual reduction of the
Portfolio Investment
-100
-80
-60
-40
-20
0
20
40
60
80RM billion
Equity securities Debt securities Net portfolio investment
p Preliminary
Source: Department of Statistics, Malaysia
Chart 1.8
2007 2008 2009 2010 2011 2012 2013p
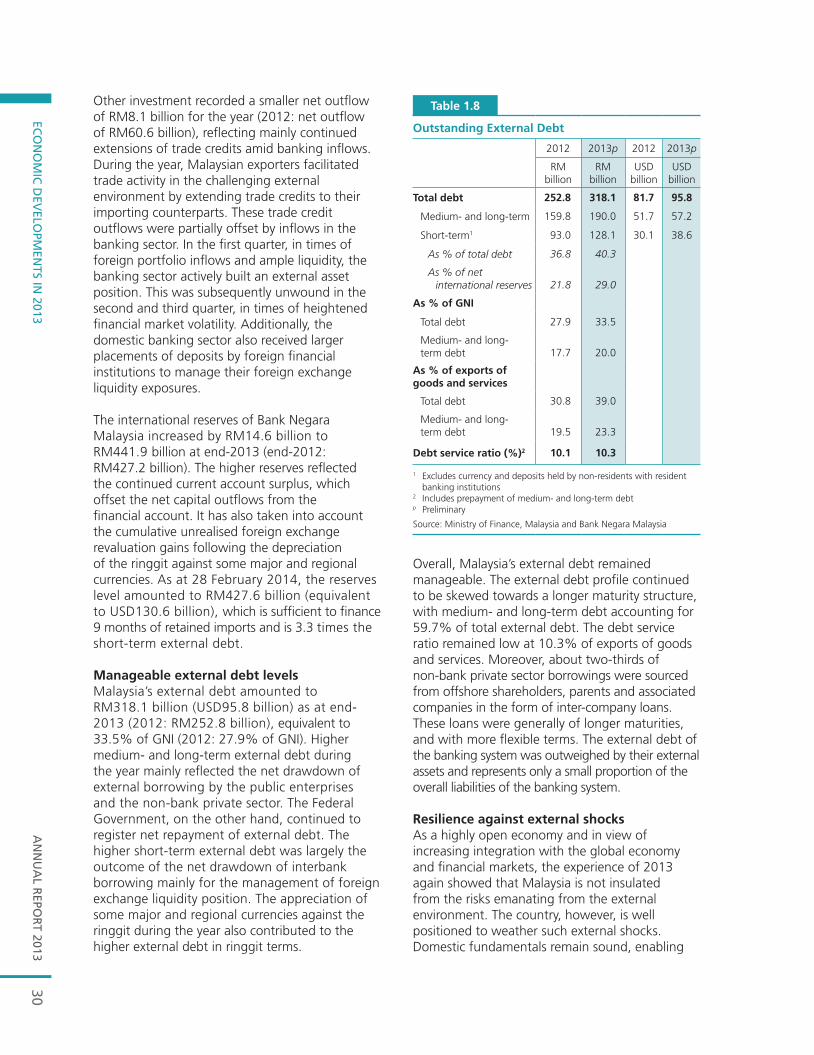
AN
NU
AL R
EPOR
T 2013EC
ON
OM
IC D
EVELO
PMEN
TS IN 2013
30 1A
NN
UA
L R
EPO
RT
2013
ECO
NO
MIC
DEV
ELO
PMEN
TS IN
201
3
Broadening Economic Surveillance through Bank Negara Malaysia’s Regional Offi ces
Economic surveillance by the Bank has in the recent years been strengthened by broadening the surveillance to the regional level through the Bank’s Regional Offi ces. Regional economic surveillance entails the gathering and synthesising of quantitative and qualitative information on current economic and fi nancial conditions at the regional level. The approach involves direct engagement with various economic agents in the different regions of the country. The regional surveillance complements the macro-level assessment of the economy by providing a perspective on the extent to which the regional conditions differ from, or refl ect, the national outlook. It also provides information about how economic and fi nancial conditions vary across regions and industries.
Strengthening economic analysis through regional economic surveillanceThe geographic concentration of economic activity in Malaysia has become wider and more dispersed over the years. This trend has been further accentuated by the acceleration of growth in the regional economic corridors. Thus, surveillance undertaken at the regional level allows for a closer and deeper monitoring of the pulse of economic activity and emerging trends (refer to fact box on `Re-export Activity Providing Growing Support to Malaysia’s Trade´ in Chapter 4). Direct and frequent engagements with businesses, industry associations, consumer groups and lead agencies provide a rich source of information for timely analysis of economic and fi nancial conditions. Often, key insights are obtained well ahead of the release of macro-level statistics, giving a greater lead time for analysis and policy response. Direct engagements with the relevant stakeholders also provide an opportunity for the Bank to communicate and obtain their feedback on policy issues.
Experience of policymakers in other economiesCentral banks around the world have expanded their surveillance framework to include regional economic surveillance, through a network of regional offi ces (Chart 1). The Bank of England’s twelve regional offi ces (known as Agencies) are tasked to assess and provide lead assessments on economic conditions to the Monetary Policy Committee. Similarly, the Reserve Bank of Australia, through its four state offi ces, extensively monitors and analyses regional economic developments throughout Australia. In the ASEAN region, central banks such as the Bank of Thailand periodically report on domestic economic and monetary conditions from a regional perspective. The importance of expanding surveillance has also been recognised by multilateral agencies such as the International Monetary Fund, particularly when such surveillance incorporates a more active engagement with stakeholders to help promote an effective and timely policy response to emerging policy challenges and risks1.
Chart 1
Selected Central Banks with Regional Economic Surveillance
Source: Central Bank websitesNote: The branches and regional offices excludes overseas representative offices
Bank of Japan
Bank of Thailand
Bank Indonesia
Bank Negara Malaysia
The Federal Reserve
Bank of EnglandBank of CanadaSveriges Riksbank
Banco CentralDo Brasil
Reserve Bank of Australia
Norges Bank
1 Source: International Monetary Fund (2012), `The IMF’s Financial Surveillance Strategy´.
Other investment recorded a smaller net outflow of RM8.1 billion for the year (2012: net outflow of RM60.6 billion), reflecting mainly continued extensions of trade credits amid banking inflows. During the year, Malaysian exporters facilitated trade activity in the challenging external environment by extending trade credits to their importing counterparts. These trade credit outflows were partially offset by inflows in the banking sector. In the first quarter, in times of foreign portfolio inflows and ample liquidity, the banking sector actively built an external asset position. This was subsequently unwound in the second and third quarter, in times of heightened financial market volatility. Additionally, the domestic banking sector also received larger placements of deposits by foreign financial institutions to manage their foreign exchange liquidity exposures.
The international reserves of Bank Negara Malaysia increased by RM14.6 billion to RM441.9 billion at end-2013 (end-2012: RM427.2 billion). The higher reserves reflected the continued current account surplus, which offset the net capital outflows from the financial account. It has also taken into account the cumulative unrealised foreign exchange revaluation gains following the depreciation of the ringgit against some major and regional currencies. As at 28 February 2014, the reserves level amounted to RM427.6 billion (equivalent to USD130.6 billion), which is sufficient to finance 9 months of retained imports and is 3.3 times the short-term external debt.
Manageable external debt levelsMalaysia’s external debt amounted to RM318.1 billion (USD95.8 billion) as at end-2013 (2012: RM252.8 billion), equivalent to 33.5% of GNI (2012: 27.9% of GNI). Higher medium- and long-term external debt during the year mainly reflected the net drawdown of external borrowing by the public enterprises and the non-bank private sector. The Federal Government, on the other hand, continued to register net repayment of external debt. The higher short-term external debt was largely the outcome of the net drawdown of interbank borrowing mainly for the management of foreign exchange liquidity position. The appreciation of some major and regional currencies against the ringgit during the year also contributed to the higher external debt in ringgit terms.
Overall, Malaysia’s external debt remained manageable. The external debt profile continued to be skewed towards a longer maturity structure, with medium- and long-term debt accounting for 59.7% of total external debt. The debt service ratio remained low at 10.3% of exports of goods and services. Moreover, about two-thirds of non-bank private sector borrowings were sourced from offshore shareholders, parents and associated companies in the form of inter-company loans. These loans were generally of longer maturities, and with more flexible terms. The external debt of the banking system was outweighed by their external assets and represents only a small proportion of the overall liabilities of the banking system. Resilience against external shocks As a highly open economy and in view of increasing integration with the global economy and financial markets, the experience of 2013 again showed that Malaysia is not insulated from the risks emanating from the external environment. The country, however, is well positioned to weather such external shocks. Domestic fundamentals remain sound, enabling
1
Table 1.8
Outstanding External Debt
2012 2013p 2012 2013p
RM billion
RM billion
USDbillion
USDbillion
Total debt 252.8 318.1 81.7 95.8
Medium- and long-term 159.8 190.0 51.7 57.2
Short-term1 93.0 128.1 30.1 38.6
As % of total debt 36.8 40.3
As % of net international reserves 21.8 29.0
As % of GNI
Total debt 27.9 33.5
Medium- and long-term debt 17.7 20.0
As % of exports ofgoods and services
Total debt 30.8 39.0
Medium- and long-term debt 19.5 23.3
Debt service ratio (%)2 10.1 10.3
1 Excludes currency and deposits held by non-residents with resident banking institutions
2 Includes prepayment of medium- and long-term debtp Preliminary
Source: Ministry of Finance, Malaysia and Bank Negara Malaysia
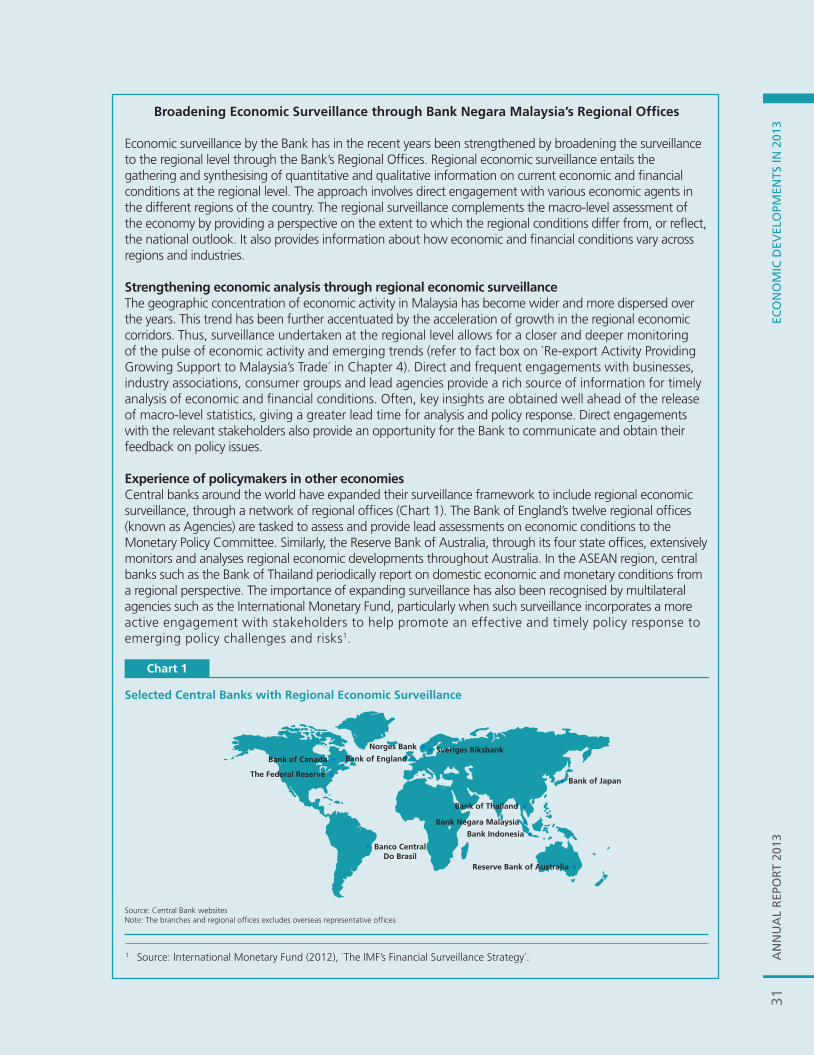
31A
NN
UA
L R
EPO
RT
2013
ECO
NO
MIC
DEV
ELO
PMEN
TS IN
201
31
AN
NU
AL
REP
OR
T 20
13EC
ON
OM
IC D
EVEL
OPM
ENTS
IN 2
013
Broadening Economic Surveillance through Bank Negara Malaysia’s Regional Offi ces
Economic surveillance by the Bank has in the recent years been strengthened by broadening the surveillance to the regional level through the Bank’s Regional Offi ces. Regional economic surveillance entails the gathering and synthesising of quantitative and qualitative information on current economic and fi nancial conditions at the regional level. The approach involves direct engagement with various economic agents in the different regions of the country. The regional surveillance complements the macro-level assessment of the economy by providing a perspective on the extent to which the regional conditions differ from, or refl ect, the national outlook. It also provides information about how economic and fi nancial conditions vary across regions and industries.
Strengthening economic analysis through regional economic surveillanceThe geographic concentration of economic activity in Malaysia has become wider and more dispersed over the years. This trend has been further accentuated by the acceleration of growth in the regional economic corridors. Thus, surveillance undertaken at the regional level allows for a closer and deeper monitoring of the pulse of economic activity and emerging trends (refer to fact box on `Re-export Activity Providing Growing Support to Malaysia’s Trade´ in Chapter 4). Direct and frequent engagements with businesses, industry associations, consumer groups and lead agencies provide a rich source of information for timely analysis of economic and fi nancial conditions. Often, key insights are obtained well ahead of the release of macro-level statistics, giving a greater lead time for analysis and policy response. Direct engagements with the relevant stakeholders also provide an opportunity for the Bank to communicate and obtain their feedback on policy issues.
Experience of policymakers in other economiesCentral banks around the world have expanded their surveillance framework to include regional economic surveillance, through a network of regional offi ces (Chart 1). The Bank of England’s twelve regional offi ces (known as Agencies) are tasked to assess and provide lead assessments on economic conditions to the Monetary Policy Committee. Similarly, the Reserve Bank of Australia, through its four state offi ces, extensively monitors and analyses regional economic developments throughout Australia. In the ASEAN region, central banks such as the Bank of Thailand periodically report on domestic economic and monetary conditions from a regional perspective. The importance of expanding surveillance has also been recognised by multilateral agencies such as the International Monetary Fund, particularly when such surveillance incorporates a more active engagement with stakeholders to help promote an effective and timely policy response to emerging policy challenges and risks1.
Chart 1
Selected Central Banks with Regional Economic Surveillance
Source: Central Bank websitesNote: The branches and regional offices excludes overseas representative offices
Bank of Japan
Bank of Thailand
Bank Indonesia
Bank Negara Malaysia
The Federal Reserve
Bank of EnglandBank of CanadaSveriges Riksbank
Banco CentralDo Brasil
Reserve Bank of Australia
Norges Bank
1 Source: International Monetary Fund (2012), `The IMF’s Financial Surveillance Strategy´.
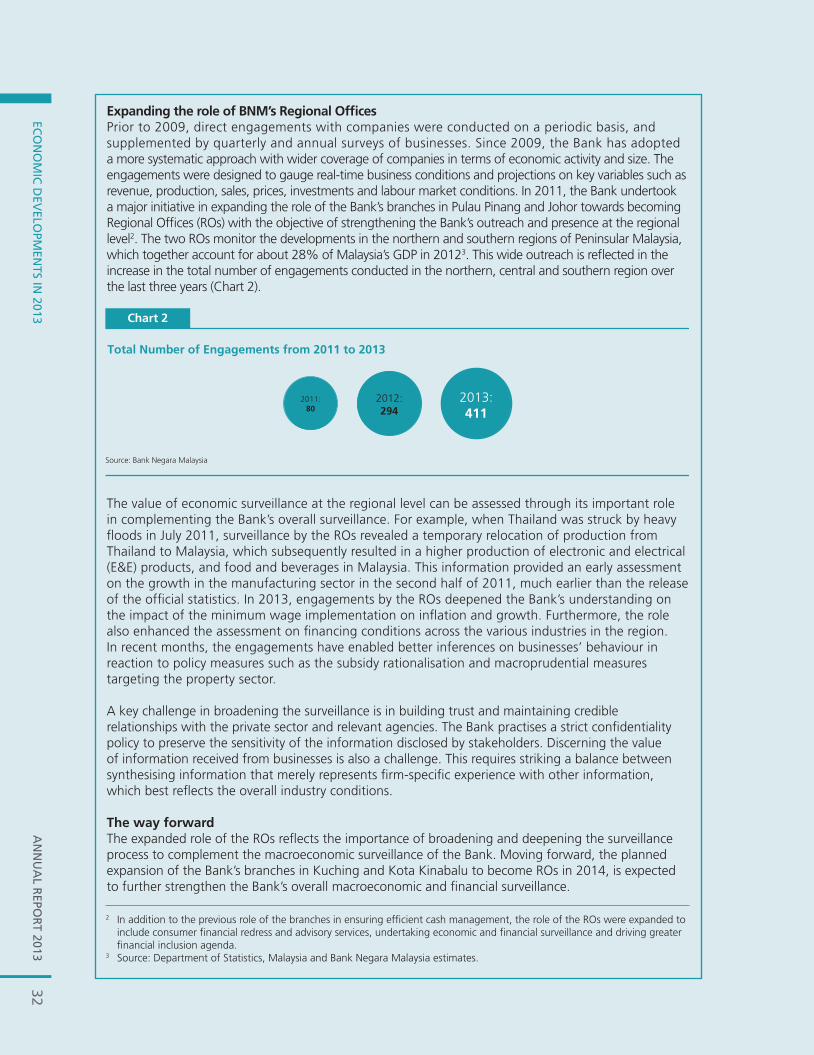
32A
NN
UA
L REPO
RT 2013
ECO
NO
MIC
DEV
ELOPM
ENTS IN
20132
AN
NU
AL R
EPOR
T 2013EC
ON
OM
IC D
EVELO
PMEN
TS IN 2013
Expanding the role of BNM’s Regional Offi cesPrior to 2009, direct engagements with companies were conducted on a periodic basis, and supplemented by quarterly and annual surveys of businesses. Since 2009, the Bank has adopted a more systematic approach with wider coverage of companies in terms of economic activity and size. The engagements were designed to gauge real-time business conditions and projections on key variables such as revenue, production, sales, prices, investments and labour market conditions. In 2011, the Bank undertook a major initiative in expanding the role of the Bank’s branches in Pulau Pinang and Johor towards becoming Regional Offi ces (ROs) with the objective of strengthening the Bank’s outreach and presence at the regional level2. The two ROs monitor the developments in the northern and southern regions of Peninsular Malaysia, which together account for about 28% of Malaysia’s GDP in 20123. This wide outreach is refl ected in the increase in the total number of engagements conducted in the northern, central and southern region over the last three years (Chart 2).
2 In addition to the previous role of the branches in ensuring effi cient cash management, the role of the ROs were expanded to include consumer fi nancial redress and advisory services, undertaking economic and fi nancial surveillance and driving greater fi nancial inclusion agenda.
3 Source: Department of Statistics, Malaysia and Bank Negara Malaysia estimates.
Total Number of Engagements from 2011 to 2013
Chart 2
Source: Bank Negara Malaysia
2011:80
2012:294
2013:411
The value of economic surveillance at the regional level can be assessed through its important role in complementing the Bank’s overall surveillance. For example, when Thailand was struck by heavy fl oods in July 2011, surveillance by the ROs revealed a temporary relocation of production from Thailand to Malaysia, which subsequently resulted in a higher production of electronic and electrical (E&E) products, and food and beverages in Malaysia. This information provided an early assessment on the growth in the manufacturing sector in the second half of 2011, much earlier than the release of the offi cial statistics. In 2013, engagements by the ROs deepened the Bank’s understanding on the impact of the minimum wage implementation on infl ation and growth. Furthermore, the role also enhanced the assessment on fi nancing conditions across the various industries in the region. In recent months, the engagements have enabled better inferences on businesses’ behaviour in reaction to policy measures such as the subsidy rationalisation and macroprudential measures targeting the property sector.
A key challenge in broadening the surveillance is in building trust and maintaining credible relationships with the private sector and relevant agencies. The Bank practises a strict confi dentiality policy to preserve the sensitivity of the information disclosed by stakeholders. Discerning the value of information received from businesses is also a challenge. This requires striking a balance between synthesising information that merely represents fi rm-specifi c experience with other information, which best refl ects the overall industry conditions.
The way forwardThe expanded role of the ROs refl ects the importance of broadening and deepening the surveillance process to complement the macroeconomic surveillance of the Bank. Moving forward, the planned expansion of the Bank’s branches in Kuching and Kota Kinabalu to become ROs in 2014, is expected to further strengthen the Bank’s overall macroeconomic and fi nancial surveillance.

AN
NU
AL
REP
OR
T 20
13EC
ON
OM
IC D
EVEL
OPM
ENTS
IN 2
013
33
2 Core inflation is a measure of the underlying inflation rate, after excluding volatile and price-administered items, whose price movements are not likely to be related to changes in demand conditions. However, as it is not possible to distinctively separate demand-related and supply-related inflation, prices of goods and services in the core CPI basket are likely to also reflect transitory changes in cost and supply factors, such as improvements in supply conditions, supply disruptions and price adjustments.
strong defence against potential vulnerabilities arising from the external front. Well-developed capital markets, strong financial intermediaries, and the presence of large domestic institutional investors provide the financial system with greater resilience. The wide range of monetary instruments, high level of international reserves and manageable level of external debt accorded policy flexibility to absorb external shocks.
INFLATION DEVELOPMENTS
Headline inflation, as measured by the annual percentage change in the Consumer Price Index (CPI), remained modest at 2.1% in 2013 (2012: 1.6%). The annual inflation rate averaged at the lower end of the Bank’s earlier forecast of 2%-3%. During the first eight months of the year, the average inflation rate was low at 1.7%, rising from 1.3% in January to 1.9% in August. The average inflation rate for the remaining four months of 2013, however, increased to 2.9%, following the upward adjustments made to administered prices. Core inflation2, an indicator of demand-driven price pressures, moderated to 1.8% in 2013 (2012: 2.1%).
In terms of components, the main contributors to inflation were food and non-alcoholic beverages;
transport; and housing, water, electricity, gas and other fuel. These three categories together accounted for 87% of the overall increase in consumer prices during the year. Inflation in the food and non-alcoholic beverages category rose to 3.6% (2012: 2.7%), due to higher prices in the fish and seafood, meat, and vegetables sub-categories. Inflation in the housing, water, electricity, gas and other fuels category averaged 1.7% (2012: 1.6%), reflecting higher rental for housing, particularly for apartments and condominiums, and properties in urban areas. Inflation in the transport category more than doubled to 2.0% (2012: 0.7%), stemming from higher prices of fuel. Higher inflation during the year was, however, partially mitigated by continued price declines in the communication and clothing and footwear categories (-0.7% and -0.6% respectively). On the whole, only four categories of consumer goods and services registered higher inflation rates. Six categories recorded lower inflation, while two remained stable. In terms of determinants, inflation during the year was driven mainly by domestic cost and supply factors. Higher cost of poultry feed in the early part of 2013 and disruptions in domestic food supply due to adverse weather conditions, such as floods in the east coast of Peninsular Malaysia, were the main factors that led to higher food inflation. Towards the end of the year, the upward adjustments made to prices of several administered items also
Chart 1.9
Consumer Price Inflation
Source: Department of Statistics, Malaysia and Bank Negara Malaysia
0.0
0.5
1.0
1.5
2.0
2.5
3.0
3.5
4.0
Headline Inflation Core Inflation
Annual growth (%)
2011 2012 2013
J F MA M J J A S O N D J F MA M J J A S O N D J F MA M J J A S O N D
0.0 0.5 1.0 1.5 2.0 2.5
Chart 1.10
Contribution to Inflation
TOTAL
Food and non-alcoholic
Housing, water, electricity,gas and other fuels
Transport
Alcoholic beveragesand tobacco
Others
beverages
2012 2013
Source: Department of Statistics, Malaysia and Bank Negara Malaysia
Note: Others refers to communication; clothing and footwear; health; recreation services and culture; furnishings, household equipment and routine household maintenance; restaurants and hotels; education; and miscellaneous goods and services
Percentage points
2A
NN
UA
L REPO
RT 2013
ECO
NO
MIC
DEV
ELOPM
ENTS IN
2013
Expanding the role of BNM’s Regional Offi cesPrior to 2009, direct engagements with companies were conducted on a periodic basis, and supplemented by quarterly and annual surveys of businesses. Since 2009, the Bank has adopted a more systematic approach with wider coverage of companies in terms of economic activity and size. The engagements were designed to gauge real-time business conditions and projections on key variables such as revenue, production, sales, prices, investments and labour market conditions. In 2011, the Bank undertook a major initiative in expanding the role of the Bank’s branches in Pulau Pinang and Johor towards becoming Regional Offi ces (ROs) with the objective of strengthening the Bank’s outreach and presence at the regional level2. The two ROs monitor the developments in the northern and southern regions of Peninsular Malaysia, which together account for about 28% of Malaysia’s GDP in 20123. This wide outreach is refl ected in the increase in the total number of engagements conducted in the northern, central and southern region over the last three years (Chart 2).
2 In addition to the previous role of the branches in ensuring effi cient cash management, the role of the ROs were expanded to include consumer fi nancial redress and advisory services, undertaking economic and fi nancial surveillance and driving greater fi nancial inclusion agenda.
3 Source: Department of Statistics, Malaysia and Bank Negara Malaysia estimates.
Total Number of Engagements from 2011 to 2013
Chart 2
Source: Bank Negara Malaysia
2011:80
2012:294
2013:411
The value of economic surveillance at the regional level can be assessed through its important role in complementing the Bank’s overall surveillance. For example, when Thailand was struck by heavy fl oods in July 2011, surveillance by the ROs revealed a temporary relocation of production from Thailand to Malaysia, which subsequently resulted in a higher production of electronic and electrical (E&E) products, and food and beverages in Malaysia. This information provided an early assessment on the growth in the manufacturing sector in the second half of 2011, much earlier than the release of the offi cial statistics. In 2013, engagements by the ROs deepened the Bank’s understanding on the impact of the minimum wage implementation on infl ation and growth. Furthermore, the role also enhanced the assessment on fi nancing conditions across the various industries in the region. In recent months, the engagements have enabled better inferences on businesses’ behaviour in reaction to policy measures such as the subsidy rationalisation and macroprudential measures targeting the property sector.
A key challenge in broadening the surveillance is in building trust and maintaining credible relationships with the private sector and relevant agencies. The Bank practises a strict confi dentiality policy to preserve the sensitivity of the information disclosed by stakeholders. Discerning the value of information received from businesses is also a challenge. This requires striking a balance between synthesising information that merely represents fi rm-specifi c experience with other information, which best refl ects the overall industry conditions.
The way forwardThe expanded role of the ROs refl ects the importance of broadening and deepening the surveillance process to complement the macroeconomic surveillance of the Bank. Moving forward, the planned expansion of the Bank’s branches in Kuching and Kota Kinabalu to become ROs in 2014, is expected to further strengthen the Bank’s overall macroeconomic and fi nancial surveillance.
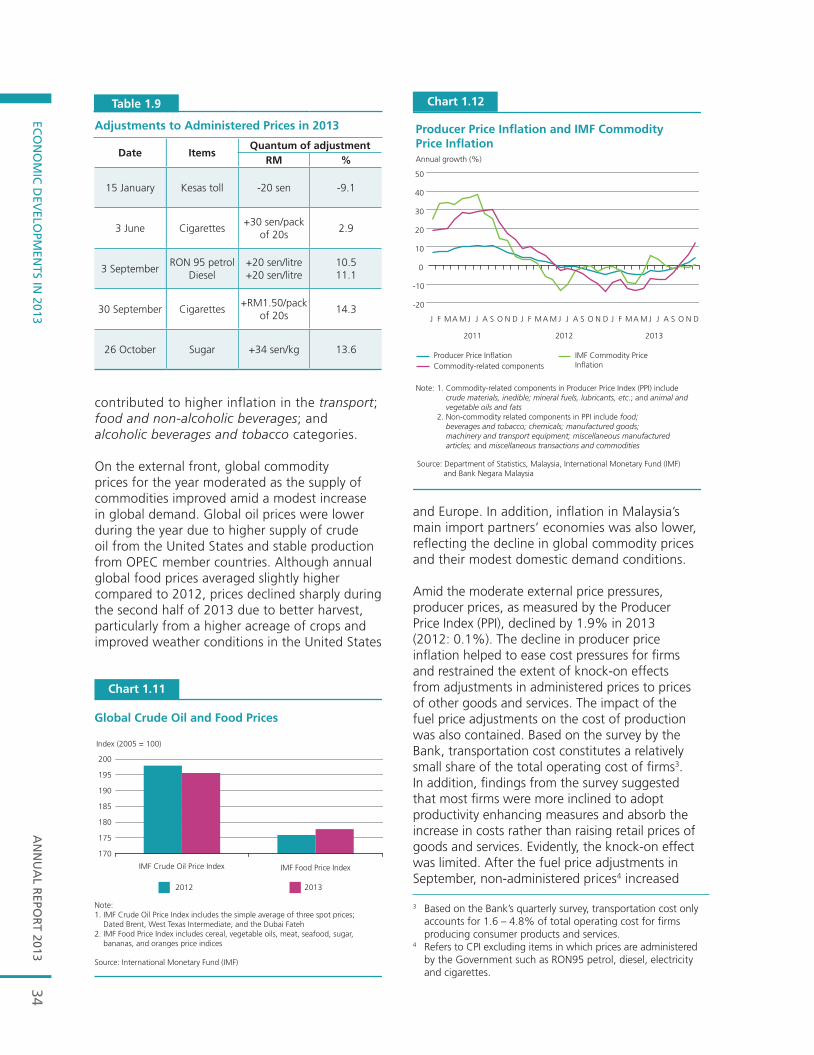
AN
NU
AL R
EPOR
T 2013EC
ON
OM
IC D
EVELO
PMEN
TS IN 2013
34
contributed to higher inflation in the transport; food and non-alcoholic beverages; and alcoholic beverages and tobacco categories.
On the external front, global commodity prices for the year moderated as the supply of commodities improved amid a modest increase in global demand. Global oil prices were lower during the year due to higher supply of crude oil from the United States and stable production from OPEC member countries. Although annual global food prices averaged slightly higher compared to 2012, prices declined sharply during the second half of 2013 due to better harvest, particularly from a higher acreage of crops and improved weather conditions in the United States
1
Table 1.9
Adjustments to Administered Prices in 2013
Date ItemsQuantum of adjustment
RM %
15 January Kesas toll -20 sen -9.1
3 June Cigarettes+30 sen/pack
of 20s2.9
3 SeptemberRON 95 petrol
Diesel+20 sen/litre+20 sen/litre
10.511.1
30 September Cigarettes+RM1.50/pack
of 20s14.3
26 October Sugar +34 sen/kg 13.6
Chart 1.11
IMF Crude Oil Price Index IMF Food Price Index
2012 2013
Global Crude Oil and Food Prices
Index (2005 = 100)
Note:1. IMF Crude Oil Price Index includes the simple average of three spot prices; Dated Brent, West Texas Intermediate, and the Dubai Fateh2. IMF Food Price Index includes cereal, vegetable oils, meat, seafood, sugar, bananas, and oranges price indices
Source: International Monetary Fund (IMF)
170
175
180
185
190
195
200
and Europe. In addition, inflation in Malaysia’s main import partners’ economies was also lower, reflecting the decline in global commodity prices and their modest domestic demand conditions. Amid the moderate external price pressures, producer prices, as measured by the Producer Price Index (PPI), declined by 1.9% in 2013 (2012: 0.1%). The decline in producer price inflation helped to ease cost pressures for firms and restrained the extent of knock-on effects from adjustments in administered prices to prices of other goods and services. The impact of the fuel price adjustments on the cost of production was also contained. Based on the survey by the Bank, transportation cost constitutes a relatively small share of the total operating cost of firms3. In addition, findings from the survey suggested that most firms were more inclined to adopt productivity enhancing measures and absorb the increase in costs rather than raising retail prices of goods and services. Evidently, the knock-on effect was limited. After the fuel price adjustments in September, non-administered prices4 increased
Chart 1.12
Producer Price Inflation and IMF CommodityPrice Inflation
Source: Department of Statistics, Malaysia, International Monetary Fund (IMF) and Bank Negara Malaysia
Annual growth (%)
1. Commodity-related components in Producer Price Index (PPI) include crude materials, inedible; mineral fuels, lubricants, etc.; and animal and vegetable oils and fats2. Non-commodity related components in PPI include food; beverages and tobacco; chemicals; manufactured goods; machinery and transport equipment; miscellaneous manufactured articles; and miscellaneous transactions and commodities
Note:
Producer Price Inflation IMF Commodity PriceInflationCommodity-related components
-20
-10
0
10
20
30
40
50
J F MA M J J A S O N D J F MA M J J A S O N D J F MA M J J A S O N D
2011 20132012
3 Based on the Bank’s quarterly survey, transportation cost only accounts for 1.6 – 4.8% of total operating cost for firms producing consumer products and services.
4 Refers to CPI excluding items in which prices are administered by the Government such as RON95 petrol, diesel, electricity and cigarettes.
AN
NU
AL
REP
OR
T 20
13EC
ON
OM
IC D
EVEL
OPM
ENTS
IN 2
013
35
by only an average of 0.2% during the last four months of 2013, with close to 78% of the CPI items registering an inflation rate of 3% and below.
Despite the strong growth in private consumption and sustained wage growth during the year, demand-driven price pressures remained moderate with core inflation rising gradually from 1.6% in
January to 2.3% in December 2013. During the year, there was adequate productive capacity in the economy to help contain demand pressures. This was reflected in real GDP remaining at close to its potential in 2013, and the capacity utilisation rate in the manufacturing sector tapering to 79% (2012: 81%). In addition, the benign cost pressures have also helped to mitigate price pressures.

AN
NU
AL R
EPOR
T 2013EC
ON
OM
IC D
EVELO
PMEN
TS IN 2013
36
AN
NU
AL
REP
OR
T 20
13M
ON
ETA
RY
AN
D F
INA
NC
IAL
CO
ND
ITIO
NS
37
39 International Monetary and Financial Conditions
40 Domestic Monetary and Financial Conditions
41 Box Article: Spillovers of Quantitative Easing on Asia
50 Financing of the Economy
MONETARY AND FINANCIAL CONDITIONS

AN
NU
AL R
EPOR
T 2013M
ON
ETAR
Y A
ND
FINA
NC
IAL C
ON
DITIO
NS
38
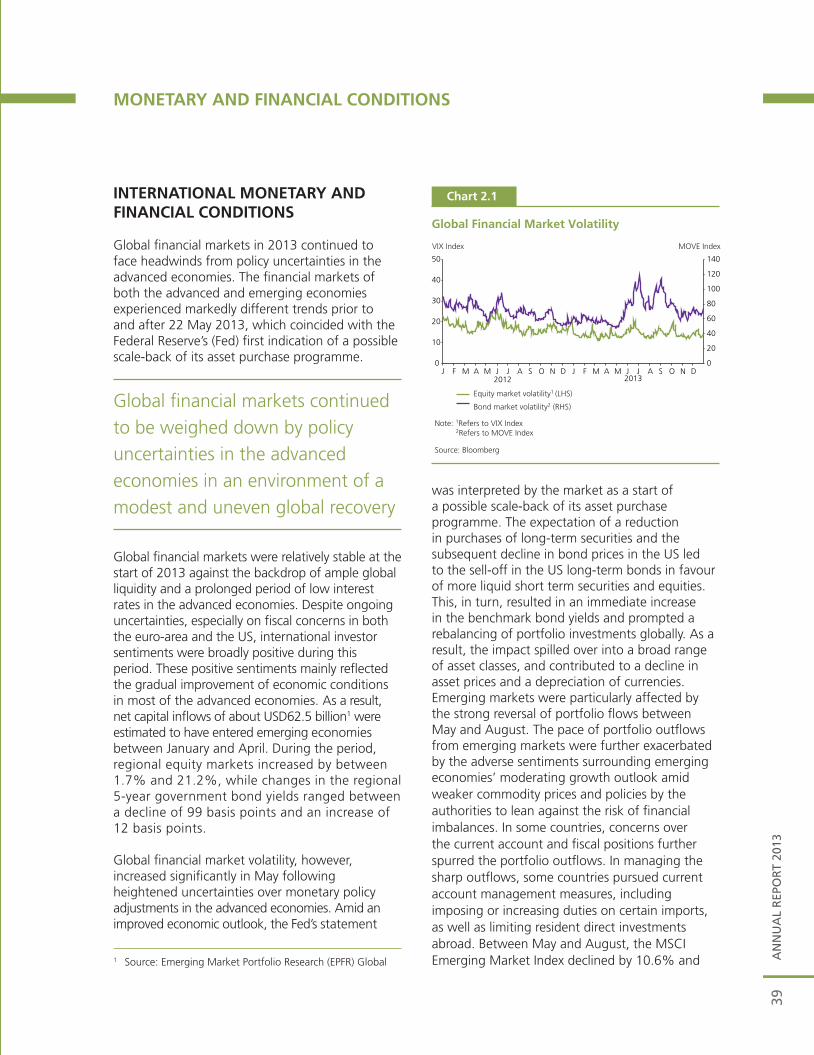
AN
NU
AL
REP
OR
T 20
1339
MONETARY AND FINANCIAL CONDITIONS
INTERNATIONAL MONETARY AND FINANCIAL CONDITIONS
Global financial markets in 2013 continued to face headwinds from policy uncertainties in the advanced economies. The financial markets of both the advanced and emerging economies experienced markedly different trends prior to and after 22 May 2013, which coincided with the Federal Reserve’s (Fed) first indication of a possible scale-back of its asset purchase programme.
Global financial markets continued to be weighed down by policy uncertainties in the advanced economies in an environment of a modest and uneven global recovery
Global financial markets were relatively stable at the start of 2013 against the backdrop of ample global liquidity and a prolonged period of low interest rates in the advanced economies. Despite ongoing uncertainties, especially on fiscal concerns in both the euro-area and the US, international investor sentiments were broadly positive during this period. These positive sentiments mainly reflected the gradual improvement of economic conditions in most of the advanced economies. As a result, net capital inflows of about USD62.5 billion1 were estimated to have entered emerging economies between January and April. During the period, regional equity markets increased by between 1.7% and 21.2%, while changes in the regional 5-year government bond yields ranged between a decline of 99 basis points and an increase of 12 basis points.
Global financial market volatility, however, increased significantly in May following heightened uncertainties over monetary policy adjustments in the advanced economies. Amid an improved economic outlook, the Fed’s statement
was interpreted by the market as a start of a possible scale-back of its asset purchase programme. The expectation of a reduction in purchases of long-term securities and the subsequent decline in bond prices in the US led to the sell-off in the US long-term bonds in favour of more liquid short term securities and equities. This, in turn, resulted in an immediate increase in the benchmark bond yields and prompted a rebalancing of portfolio investments globally. As a result, the impact spilled over into a broad range of asset classes, and contributed to a decline in asset prices and a depreciation of currencies. Emerging markets were particularly affected by the strong reversal of portfolio flows between May and August. The pace of portfolio outflows from emerging markets were further exacerbated by the adverse sentiments surrounding emerging economies’ moderating growth outlook amid weaker commodity prices and policies by the authorities to lean against the risk of financial imbalances. In some countries, concerns over the current account and fiscal positions further spurred the portfolio outflows. In managing the sharp outflows, some countries pursued current account management measures, including imposing or increasing duties on certain imports, as well as limiting resident direct investments abroad. Between May and August, the MSCI Emerging Market Index declined by 10.6% and 1 Source: Emerging Market Portfolio Research (EPFR) Global
Chart 2.1
Global Financial Market Volatility
VIX Index MOVE Index
Source: Bloomberg
Equity market volatility1 (LHS)
Bond market volatility2 (RHS)
Note: 1Refers to VIX Index 2Refers to MOVE Index
0
20
40
60
80
100
120
140
0
10
20
30
40
50
J F M A M J J A S O N D J F M A M J J A S O N D2012 2013
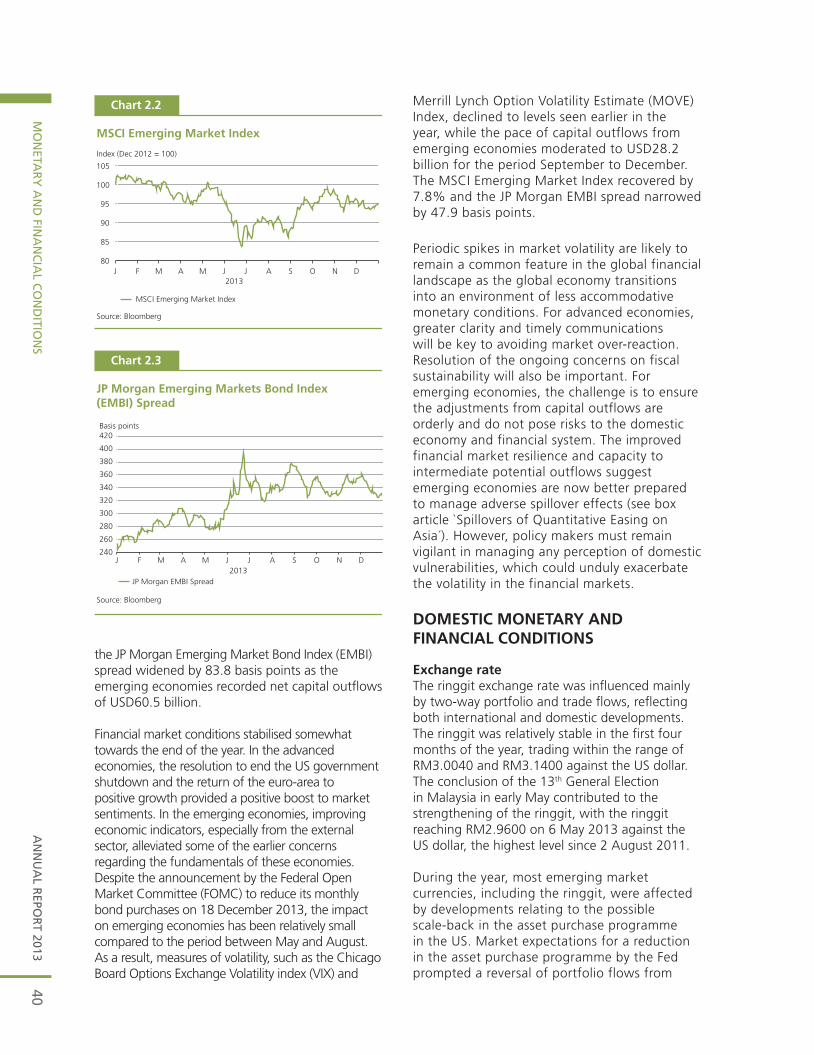
AN
NU
AL R
EPOR
T 2013M
ON
ETAR
Y A
ND
FINA
NC
IAL C
ON
DITIO
NS
40
the JP Morgan Emerging Market Bond Index (EMBI) spread widened by 83.8 basis points as the emerging economies recorded net capital outflows of USD60.5 billion.
Financial market conditions stabilised somewhat towards the end of the year. In the advanced economies, the resolution to end the US government shutdown and the return of the euro-area to positive growth provided a positive boost to market sentiments. In the emerging economies, improving economic indicators, especially from the external sector, alleviated some of the earlier concerns regarding the fundamentals of these economies. Despite the announcement by the Federal Open Market Committee (FOMC) to reduce its monthly bond purchases on 18 December 2013, the impact on emerging economies has been relatively small compared to the period between May and August. As a result, measures of volatility, such as the Chicago Board Options Exchange Volatility index (VIX) and
Merrill Lynch Option Volatility Estimate (MOVE) Index, declined to levels seen earlier in the year, while the pace of capital outflows from emerging economies moderated to USD28.2 billion for the period September to December. The MSCI Emerging Market Index recovered by 7.8% and the JP Morgan EMBI spread narrowed by 47.9 basis points.
Periodic spikes in market volatility are likely to remain a common feature in the global financial landscape as the global economy transitions into an environment of less accommodative monetary conditions. For advanced economies, greater clarity and timely communications will be key to avoiding market over-reaction. Resolution of the ongoing concerns on fiscal sustainability will also be important. For emerging economies, the challenge is to ensure the adjustments from capital outflows are orderly and do not pose risks to the domestic economy and financial system. The improved financial market resilience and capacity to intermediate potential outflows suggest emerging economies are now better prepared to manage adverse spillover effects (see box article `Spillovers of Quantitative Easing on Asia´). However, policy makers must remain vigilant in managing any perception of domestic vulnerabilities, which could unduly exacerbate the volatility in the financial markets.
DOMESTIC MONETARY AND FINANCIAL CONDITIONS
Exchange rateThe ringgit exchange rate was influenced mainly by two-way portfolio and trade flows, reflecting both international and domestic developments. The ringgit was relatively stable in the first four months of the year, trading within the range of RM3.0040 and RM3.1400 against the US dollar. The conclusion of the 13th General Election in Malaysia in early May contributed to the strengthening of the ringgit, with the ringgit reaching RM2.9600 on 6 May 2013 against the US dollar, the highest level since 2 August 2011.
During the year, most emerging market currencies, including the ringgit, were affected by developments relating to the possible scale-back in the asset purchase programme in the US. Market expectations for a reduction in the asset purchase programme by the Fed prompted a reversal of portfolio flows from
Chart 2.2
MSCI Emerging Market Index
Index (Dec 2012 = 100)
2013
Source: Bloomberg
80
85
90
95
100
105
J F M A M J J A S O N D
MSCI Emerging Market Index
Chart 2.3
JP Morgan Emerging Markets Bond Index (EMBI) Spread
Source: Bloomberg
240
260
280
300
320
340
360
380
400
420
J F M A M J J A S O N D
Basis points
JP Morgan EMBI Spread2013
AN
NU
AL
REP
OR
T 20
13M
ON
ETA
RY
AN
D F
INA
NC
IAL
CO
ND
ITIO
NS
1
Spillovers of Quantitative Easing on Asia
IntroductionThe Global Financial Crisis (GFC) triggered unprecedented policy interventions in the crisis-affected advanced economies. Major central banks reduced policy interest rates to close to zero and implemented unconventional monetary policies such as massive injections of liquidity through quantitative easing (QE). These measures have had a signifi cant spillover impact on global economic and fi nancial conditions. To some extent, these policies have contributed to stabilising fi nancial conditions and supporting the recovery that is gaining momentum in these economies. While the avoidance of a more severe global economic recession has benefi tted the emerging economies, there were unintended consequences from maintaining such policies for an extended period of time, particularly, large capital infl ows into many emerging economies in search for higher yields. As economic recovery in the advanced economies becomes more entrenched, policymakers will eventually need to unwind these unprecedented injections of liquidity to achieve more normal monetary conditions. This transition, nevertheless, is likely to have an impact on the rest of the world through various channels and in varying degrees. This article explores the spillovers of QE on Asia and assesses the region’s strengths and vulnerabilities in facing the challenges that will emerge from the reversal of the unconventional monetary policy measures by the advanced economies.
Impact of QE on Asia The introduction of QE has led to a massive injection of liquidity into the fi nancial systems of the advanced economies. The balance sheet of the Federal Reserve (Fed), for instance, grew by about four times between December 2006 and August 2013. The balance sheet of the Bank of England expanded by six times, while those of the European Central Bank and the Bank of Japan doubled. Cumulatively, global liquidity, as proxied by the GDP-weighted M2 of the US, euro area, Japan and the UK, increased from USD7.3 trillion in the third quarter of 2008 to about USD10 trillion in the fi rst quarter of 2013. The massive build-up of liquidity and the search for yields caused large capital infl ows into the emerging economies given their more favourable growth prospects and higher rates of return. Between 2009 and 2013, Asia received portfolio infl ows amounting to USD597.7 billion, equivalent to 2.4% of its combined GDP1 (Chart 1).
1 Asia includes Chinese Taipei, India, Indonesia, Korea, Malaysia, Philippines, PR China, Singapore and Thailand.
Chart 1
Impact of Quantitative Easing on AsiaCumulative net foreign portfolio flows,
Q1 2009 - Q1 2013
Source: Haver and National Authorities
9.8
19.1
21.5
33.5
49.6
71.9
100.3
145.8
146.2
0 50 100 150
Singapore
Philippines
Chinese Taipei
Thailand
Indonesia
Malaysia
India
PR China
Korea
USD billion
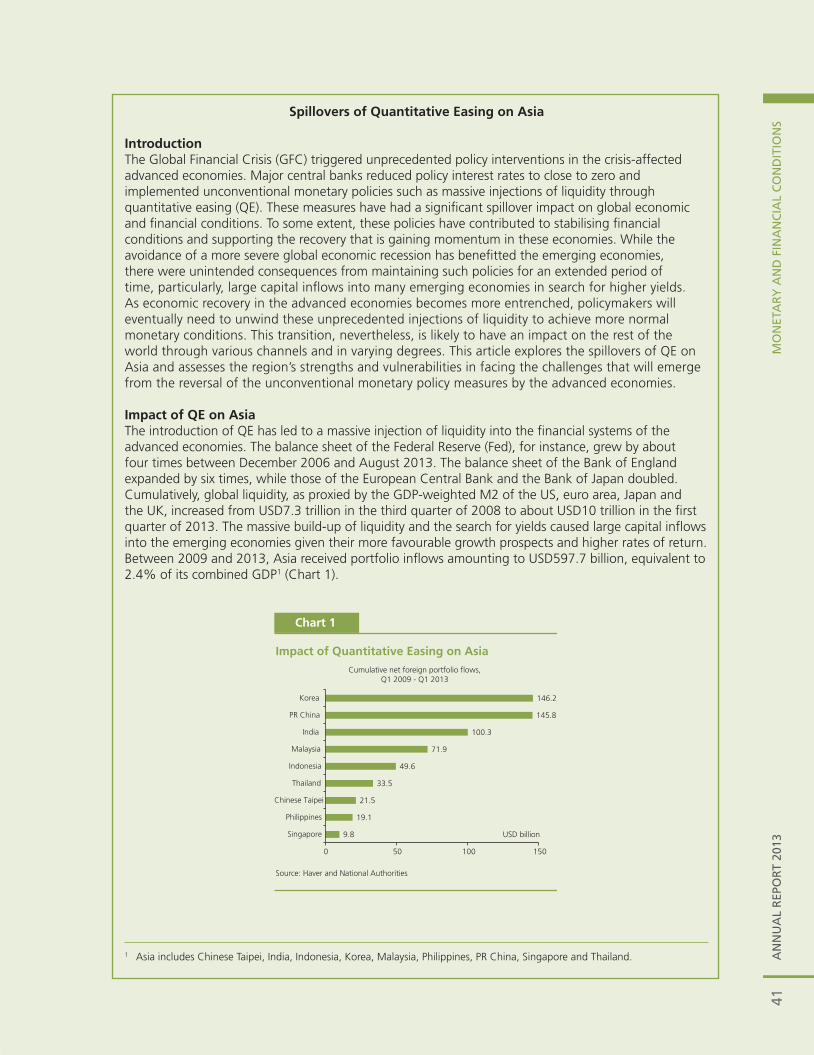
41A
NN
UA
L R
EPO
RT
2013
MO
NET
AR
Y A
ND
FIN
AN
CIA
L C
ON
DIT
ION
SA
NN
UA
L R
EPO
RT
2013
MO
NET
AR
Y A
ND
FIN
AN
CIA
L C
ON
DIT
ION
S1
Spillovers of Quantitative Easing on Asia
IntroductionThe Global Financial Crisis (GFC) triggered unprecedented policy interventions in the crisis-affected advanced economies. Major central banks reduced policy interest rates to close to zero and implemented unconventional monetary policies such as massive injections of liquidity through quantitative easing (QE). These measures have had a signifi cant spillover impact on global economic and fi nancial conditions. To some extent, these policies have contributed to stabilising fi nancial conditions and supporting the recovery that is gaining momentum in these economies. While the avoidance of a more severe global economic recession has benefi tted the emerging economies, there were unintended consequences from maintaining such policies for an extended period of time, particularly, large capital infl ows into many emerging economies in search for higher yields. As economic recovery in the advanced economies becomes more entrenched, policymakers will eventually need to unwind these unprecedented injections of liquidity to achieve more normal monetary conditions. This transition, nevertheless, is likely to have an impact on the rest of the world through various channels and in varying degrees. This article explores the spillovers of QE on Asia and assesses the region’s strengths and vulnerabilities in facing the challenges that will emerge from the reversal of the unconventional monetary policy measures by the advanced economies.
Impact of QE on Asia The introduction of QE has led to a massive injection of liquidity into the fi nancial systems of the advanced economies. The balance sheet of the Federal Reserve (Fed), for instance, grew by about four times between December 2006 and August 2013. The balance sheet of the Bank of England expanded by six times, while those of the European Central Bank and the Bank of Japan doubled. Cumulatively, global liquidity, as proxied by the GDP-weighted M2 of the US, euro area, Japan and the UK, increased from USD7.3 trillion in the third quarter of 2008 to about USD10 trillion in the fi rst quarter of 2013. The massive build-up of liquidity and the search for yields caused large capital infl ows into the emerging economies given their more favourable growth prospects and higher rates of return. Between 2009 and 2013, Asia received portfolio infl ows amounting to USD597.7 billion, equivalent to 2.4% of its combined GDP1 (Chart 1).
1 Asia includes Chinese Taipei, India, Indonesia, Korea, Malaysia, Philippines, PR China, Singapore and Thailand.
Chart 1
Impact of Quantitative Easing on AsiaCumulative net foreign portfolio flows,
Q1 2009 - Q1 2013
Source: Haver and National Authorities
9.8
19.1
21.5
33.5
49.6
71.9
100.3
145.8
146.2
0 50 100 150
Singapore
Philippines
Chinese Taipei
Thailand
Indonesia
Malaysia
India
PR China
Korea
USD billion
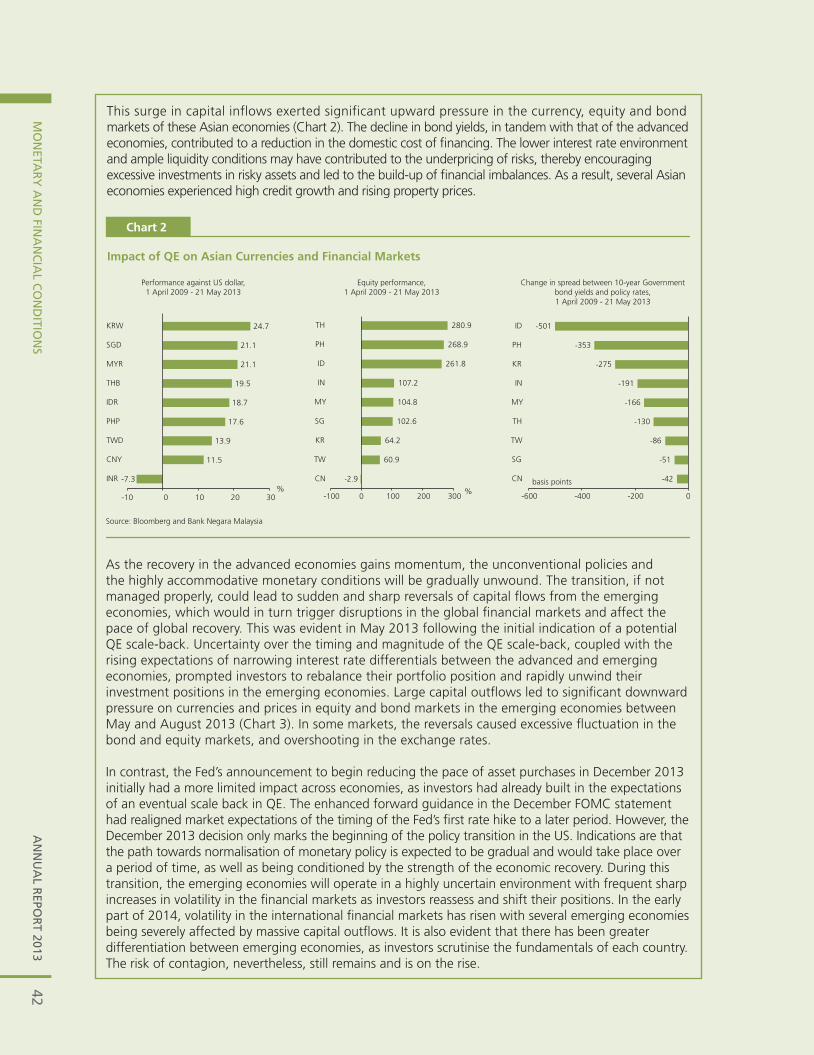
42A
NN
UA
L REPO
RT 2013
MO
NETA
RY
AN
D FIN
AN
CIA
L CO
ND
ITION
SA
NN
UA
L REPO
RT 2013
MO
NETA
RY
AN
D FIN
AN
CIA
L CO
ND
ITION
S2
This surge in capital inflows exerted significant upward pressure in the currency, equity and bond markets of these Asian economies (Chart 2). The decline in bond yields, in tandem with that of the advanced economies, contributed to a reduction in the domestic cost of fi nancing. The lower interest rate environment and ample liquidity conditions may have contributed to the underpricing of risks, thereby encouraging excessive investments in risky assets and led to the build-up of fi nancial imbalances. As a result, several Asian economies experienced high credit growth and rising property prices.
Impact of QE on Asian Currencies and Financial Markets
Source: Bloomberg and Bank Negara Malaysia
Chart 2
Performance against US dollar,1 April 2009 - 21 May 2013
Equity performance,1 April 2009 - 21 May 2013
Change in spread between 10-year Governmentbond yields and policy rates,1 April 2009 - 21 May 2013
11.5
13.9
17.6
18.7
19.5
21.1
21.1
24.7
-10 0 10 20 30
INR
CNY
TWD
PHP
IDR
THB
MYR
SGD
KRW
%-7.3 -2.9
60.9
64.2
102.6
104.8
107.2
261.8
268.9
280.9
-100 0 100 200 300
CN
TW
KR
SG
MY
IN
ID
PH
TH
%
-42
-51
-86
-130
-166
-191
-275
-353
-501
-600 -400 -200 0
CN
SG
TW
TH
MY
IN
KR
PH
ID
basis points
As the recovery in the advanced economies gains momentum, the unconventional policies and the highly accommodative monetary conditions will be gradually unwound. The transition, if not managed properly, could lead to sudden and sharp reversals of capital fl ows from the emerging economies, which would in turn trigger disruptions in the global fi nancial markets and affect the pace of global recovery. This was evident in May 2013 following the initial indication of a potential QE scale-back. Uncertainty over the timing and magnitude of the QE scale-back, coupled with the rising expectations of narrowing interest rate differentials between the advanced and emerging economies, prompted investors to rebalance their portfolio position and rapidly unwind their investment positions in the emerging economies. Large capital outfl ows led to signifi cant downward pressure on currencies and prices in equity and bond markets in the emerging economies between May and August 2013 (Chart 3). In some markets, the reversals caused excessive fl uctuation in the bond and equity markets, and overshooting in the exchange rates.
In contrast, the Fed’s announcement to begin reducing the pace of asset purchases in December 2013 initially had a more limited impact across economies, as investors had already built in the expectations of an eventual scale back in QE. The enhanced forward guidance in the December FOMC statement had realigned market expectations of the timing of the Fed’s fi rst rate hike to a later period. However, the December 2013 decision only marks the beginning of the policy transition in the US. Indications are that the path towards normalisation of monetary policy is expected to be gradual and would take place over a period of time, as well as being conditioned by the strength of the economic recovery. During this transition, the emerging economies will operate in a highly uncertain environment with frequent sharp increases in volatility in the fi nancial markets as investors reassess and shift their positions. In the early part of 2014, volatility in the international fi nancial markets has risen with several emerging economies being severely affected by massive capital outfl ows. It is also evident that there has been greater differentiation between emerging economies, as investors scrutinise the fundamentals of each country. The risk of contagion, nevertheless, still remains and is on the rise. A
NN
UA
L R
EPO
RT
2013
MO
NET
AR
Y A
ND
FIN
AN
CIA
L C
ON
DIT
ION
S3
Asia’s challenges and policy responses While Asia is in a better position relative to the period prior to the Asian Financial Crisis (AFC), recent developments have highlighted the key challenges faced by the emerging economies in an environment of highly volatile capital fl ows. These include the sustainability of external positions, adequacy of policy space and the health of domestic balance sheets. In particular, countries that have twin defi cits are judged to be more reliant on short-term funding and vulnerable to capital reversals (Chart 4). While the narrowing of the emerging economies’ current account surplus post-GFC was initially welcomed as a sign of global rebalancing, it has subsequently been seen as increasing the likelihood of potential funding stress if the economies rely heavily on external short-term fl ows.
Impact of Potential Scaling-back of QE on Asian Currencies and Financial Markets
Chart 3
Performance against US dollar,22 May - 28 August 2013
Equity performance,22 May - 28 August 2013
Change in spread between 10-year Governmentbond yields and policy rates,22 May - 28 August 2013
Source: Bloomberg and Bank Negara Malaysia
20 15 10 5 025
0.2
-0.5
-0.6
-2.2
-7.9
-7.9
-9.7
-10.8
-18.3
-20 -15 -10 -5 0 5
CNY
KRW
TWD
SGD
PHP
THB
MYR
IDR
INR
% -4.9
-5.7
-6.7
-8.8
-10.5
-12.8
-21.7
-22.4
-22.4
KR
MY
TW
CN
IN
SG
PH
ID
TH
% 38
41
58
69
82
124
129
161
247
0 50 100 150 200 250 300
PH
TW
CN
KR
MY
SG
TH
IN
ID
basis points
Chart 4
Exchange Rate and Bond Yield Movements versus Current Account Balances
Source: Bloomberg and Haver
PR China
IndiaIndonesia
MalaysiaPhilippines
Thailand
Korea
Chinese Taipei
-16
-12
-8
-4
0
4
8
-6.0 -4.0 -2.0 0.0 2.0 4.0 6.0 8.0 10.0 12.0
Current account balance (% of GDP, 1H 2013)
Exchange rate movement (%, end-May to end-August 2013)
PR ChinaIndia
Indonesia
Malaysia
Philippines
Thailand
Korea
-2
0
2
4
-6.0 -4.0 -2.0 0.0 2.0 4.0 6.0
Current account balance (% of GDP, 1H 2013)
Bond yield movement (ppt increase, end-May to end-August 2013)
Appreciation
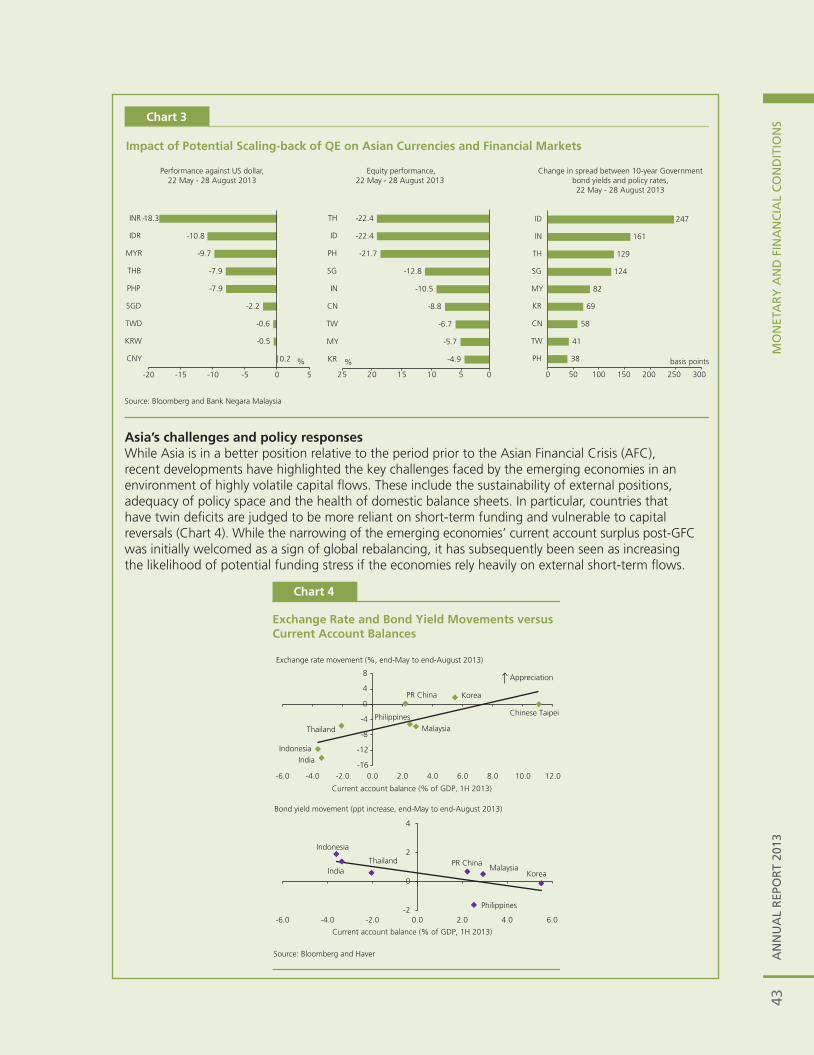
43A
NN
UA
L R
EPO
RT
2013
MO
NET
AR
Y A
ND
FIN
AN
CIA
L C
ON
DIT
ION
S
AN
NU
AL R
EPOR
T 2013M
ON
ETAR
Y A
ND
FINA
NC
IAL C
ON
DITIO
NS
2
This surge in capital inflows exerted significant upward pressure in the currency, equity and bond markets of these Asian economies (Chart 2). The decline in bond yields, in tandem with that of the advanced economies, contributed to a reduction in the domestic cost of fi nancing. The lower interest rate environment and ample liquidity conditions may have contributed to the underpricing of risks, thereby encouraging excessive investments in risky assets and led to the build-up of fi nancial imbalances. As a result, several Asian economies experienced high credit growth and rising property prices.
Impact of QE on Asian Currencies and Financial Markets
Source: Bloomberg and Bank Negara Malaysia
Chart 2
Performance against US dollar,1 April 2009 - 21 May 2013
Equity performance,1 April 2009 - 21 May 2013
Change in spread between 10-year Governmentbond yields and policy rates,1 April 2009 - 21 May 2013
11.5
13.9
17.6
18.7
19.5
21.1
21.1
24.7
-10 0 10 20 30
INR
CNY
TWD
PHP
IDR
THB
MYR
SGD
KRW
%-7.3 -2.9
60.9
64.2
102.6
104.8
107.2
261.8
268.9
280.9
-100 0 100 200 300
CN
TW
KR
SG
MY
IN
ID
PH
TH
%
-42
-51
-86
-130
-166
-191
-275
-353
-501
-600 -400 -200 0
CN
SG
TW
TH
MY
IN
KR
PH
ID
basis points
As the recovery in the advanced economies gains momentum, the unconventional policies and the highly accommodative monetary conditions will be gradually unwound. The transition, if not managed properly, could lead to sudden and sharp reversals of capital fl ows from the emerging economies, which would in turn trigger disruptions in the global fi nancial markets and affect the pace of global recovery. This was evident in May 2013 following the initial indication of a potential QE scale-back. Uncertainty over the timing and magnitude of the QE scale-back, coupled with the rising expectations of narrowing interest rate differentials between the advanced and emerging economies, prompted investors to rebalance their portfolio position and rapidly unwind their investment positions in the emerging economies. Large capital outfl ows led to signifi cant downward pressure on currencies and prices in equity and bond markets in the emerging economies between May and August 2013 (Chart 3). In some markets, the reversals caused excessive fl uctuation in the bond and equity markets, and overshooting in the exchange rates.
In contrast, the Fed’s announcement to begin reducing the pace of asset purchases in December 2013 initially had a more limited impact across economies, as investors had already built in the expectations of an eventual scale back in QE. The enhanced forward guidance in the December FOMC statement had realigned market expectations of the timing of the Fed’s fi rst rate hike to a later period. However, the December 2013 decision only marks the beginning of the policy transition in the US. Indications are that the path towards normalisation of monetary policy is expected to be gradual and would take place over a period of time, as well as being conditioned by the strength of the economic recovery. During this transition, the emerging economies will operate in a highly uncertain environment with frequent sharp increases in volatility in the fi nancial markets as investors reassess and shift their positions. In the early part of 2014, volatility in the international fi nancial markets has risen with several emerging economies being severely affected by massive capital outfl ows. It is also evident that there has been greater differentiation between emerging economies, as investors scrutinise the fundamentals of each country. The risk of contagion, nevertheless, still remains and is on the rise. A
NN
UA
L R
EPO
RT
2013
MO
NET
AR
Y A
ND
FIN
AN
CIA
L C
ON
DIT
ION
S3
Asia’s challenges and policy responses While Asia is in a better position relative to the period prior to the Asian Financial Crisis (AFC), recent developments have highlighted the key challenges faced by the emerging economies in an environment of highly volatile capital fl ows. These include the sustainability of external positions, adequacy of policy space and the health of domestic balance sheets. In particular, countries that have twin defi cits are judged to be more reliant on short-term funding and vulnerable to capital reversals (Chart 4). While the narrowing of the emerging economies’ current account surplus post-GFC was initially welcomed as a sign of global rebalancing, it has subsequently been seen as increasing the likelihood of potential funding stress if the economies rely heavily on external short-term fl ows.
Impact of Potential Scaling-back of QE on Asian Currencies and Financial Markets
Chart 3
Performance against US dollar,22 May - 28 August 2013
Equity performance,22 May - 28 August 2013
Change in spread between 10-year Governmentbond yields and policy rates,22 May - 28 August 2013
Source: Bloomberg and Bank Negara Malaysia
20 15 10 5 025
0.2
-0.5
-0.6
-2.2
-7.9
-7.9
-9.7
-10.8
-18.3
-20 -15 -10 -5 0 5
CNY
KRW
TWD
SGD
PHP
THB
MYR
IDR
INR
% -4.9
-5.7
-6.7
-8.8
-10.5
-12.8
-21.7
-22.4
-22.4
KR
MY
TW
CN
IN
SG
PH
ID
TH
% 38
41
58
69
82
124
129
161
247
0 50 100 150 200 250 300
PH
TW
CN
KR
MY
SG
TH
IN
ID
basis points
Chart 4
Exchange Rate and Bond Yield Movements versus Current Account Balances
Source: Bloomberg and Haver
PR China
IndiaIndonesia
MalaysiaPhilippines
Thailand
Korea
Chinese Taipei
-16
-12
-8
-4
0
4
8
-6.0 -4.0 -2.0 0.0 2.0 4.0 6.0 8.0 10.0 12.0
Current account balance (% of GDP, 1H 2013)
Exchange rate movement (%, end-May to end-August 2013)
PR ChinaIndia
Indonesia
Malaysia
Philippines
Thailand
Korea
-2
0
2
4
-6.0 -4.0 -2.0 0.0 2.0 4.0 6.0
Current account balance (% of GDP, 1H 2013)
Bond yield movement (ppt increase, end-May to end-August 2013)
Appreciation
44A
NN
UA
L REPO
RT 2013
MO
NETA
RY
AN
D FIN
AN
CIA
L CO
ND
ITION
SA
NN
UA
L REPO
RT 2013
MO
NETA
RY
AN
D FIN
AN
CIA
L CO
ND
ITION
S4
Widening fi scal defi cits and high public debt following large stimulus measures during the GFC raised concerns over the increase in debt servicing costs and the adequacy of fi scal space to embark on future counter-cyclical policies. Another concern is that rapid capital outfl ows could lead to sharp declines in asset prices with serious repercussions on household balance sheets.
The policy responses by Asian policymakers in addressing the challenges that have been highlighted can be segregated into two phases. Post-GFC, household balance sheet had been a core policy concern. Hence, policymakers in Asia have, since 2009, progressively implemented policies to tackle rising household indebtedness. In particular, countries such as Hong Kong SAR, Singapore and Malaysia have adopted pre-emptive measures including the implementation of macroprudential and demand management policies to address potential overheating in the property market and to slow the growth of credit. Beginning in 2013, the policy focus in several Asian countries has been extended to address the issue of twin defi cits. These countries introduced a series of policies which included easing of export rules and improved management of foreign exchange liquidity to strengthen their external positions. In several economies, policy rates have been raised. Fiscal consolidation plans, including tax reforms and subsidy rationalisation, are also being used to restore the health of the government balance sheet. The credibility of these plans has been reinforced by the commitment of clear milestones for fi scal targets in the short and medium term.
Building greater resilience against external shocks Beyond these immediate challenges, proactive efforts have been undertaken in the recent years to ensure that capital infl ows and their subsequent reversal do not signifi cantly disrupt the domestic fi nancial system and economic activity. This has been complemented by structural reforms that have been steadily rolled out since the AFC to increase the resilience of economies, both at the national and regional level.
The strength in the emerging economies’ growth in the five years after the GFC has been supported by more diversified sources of growth. In particular, Asia’s domestic demand accounted for 86% of GDP in 2012 (1990: 81%). At the same time, regional economies have diversified their trade partners, with intra-regional trade accounting for close to 50% of total trade in 2012 (1990: 37%). Asia’s resilience has also been enhanced by more flexible exchange rate regimes, as well as more developed and stronger financial sectors. Compared to the pre-AFC period, most Asian economies are now less reliant on short-term debt funding, have expanded the sources of funding for the economy and have higher level of foreign exchange reserves. In addition, the quality of foreign debt funding has also improved given the deeper and broader capital markets in many countries in the region. These have significantly improved the resilience of Asia in withstanding and responding to external shocks and safeguarding domestic financial and macroeconomic stability.
In addition, there is now greater regional financial integration and cooperation. Over the past decade, regional initiatives have been strengthened to provide a much stronger framework for cross-border financial assistance to improve the crisis readiness of the region. This includes the enhancement of multilateral liquidity support among the Asian economies, such as the Chiang Mai Initiative Multilateralisation (CMIM), which is complemented by economic surveillance conducted by the ASEAN+3 Macroeconomic Research Office (AMRO) and Monetary and Financial Stability Committee of the Executives’ Meeting of East Asia-Pacific Central Banks (EMEAP). The recently enhanced Crisis Management and Resolution Framework among EMEAP member countries also serves as a mechanism for collective policy response, surveillance and information sharing. New financial arrangements to facilitate trade financing and settlement in domestic currencies, primarily through local currency swap arrangements between regional central banks have also added a degree of resilience as these have reduced the vulnerability of regional trade to global financial market volatility.
AN
NU
AL
REP
OR
T 20
13M
ON
ETA
RY
AN
D F
INA
NC
IAL
CO
ND
ITIO
NS
5
ConclusionThe implementation of unconventional monetary stimulus in the advanced economies was premised upon achieving domestic policy objectives but has had wide-ranging global spillovers. As the pace of economic recovery in the advanced economies gains momentum, the shift towards policy normalisation will eventually take place. This shift will have implications for global capital fl ows, in particular through the rebalancing of portfolio fl ows from the emerging economies back to the advanced economies. Against this backdrop, policymakers in Asia face the challenge of managing the impact of capital fl ow reversals on their domestic economic and fi nancial conditions. Asia, as a whole, has exhibited greater resilience than in previous decades, refl ecting in part, the dividends from the post-AFC reforms. In addition, a broader and enhanced policy toolkit will help manage the potential negative externalities that may arise. All these will not necessarily insulate the Asian economies from the spillover effects from policy normalisation in the advanced economies. However, pre-emptive response will enable Asia to alleviate some of these effects and maintain the resilience of the region.
45A
NN
UA
L R
EPO
RT
2013
MO
NET
AR
Y A
ND
FIN
AN
CIA
L C
ON
DIT
ION
S
AN
NU
AL R
EPOR
T 2013M
ON
ETAR
Y A
ND
FINA
NC
IAL C
ON
DITIO
NS
4
Widening fi scal defi cits and high public debt following large stimulus measures during the GFC raised concerns over the increase in debt servicing costs and the adequacy of fi scal space to embark on future counter-cyclical policies. Another concern is that rapid capital outfl ows could lead to sharp declines in asset prices with serious repercussions on household balance sheets.
The policy responses by Asian policymakers in addressing the challenges that have been highlighted can be segregated into two phases. Post-GFC, household balance sheet had been a core policy concern. Hence, policymakers in Asia have, since 2009, progressively implemented policies to tackle rising household indebtedness. In particular, countries such as Hong Kong SAR, Singapore and Malaysia have adopted pre-emptive measures including the implementation of macroprudential and demand management policies to address potential overheating in the property market and to slow the growth of credit. Beginning in 2013, the policy focus in several Asian countries has been extended to address the issue of twin defi cits. These countries introduced a series of policies which included easing of export rules and improved management of foreign exchange liquidity to strengthen their external positions. In several economies, policy rates have been raised. Fiscal consolidation plans, including tax reforms and subsidy rationalisation, are also being used to restore the health of the government balance sheet. The credibility of these plans has been reinforced by the commitment of clear milestones for fi scal targets in the short and medium term.
Building greater resilience against external shocks Beyond these immediate challenges, proactive efforts have been undertaken in the recent years to ensure that capital infl ows and their subsequent reversal do not signifi cantly disrupt the domestic fi nancial system and economic activity. This has been complemented by structural reforms that have been steadily rolled out since the AFC to increase the resilience of economies, both at the national and regional level.
The strength in the emerging economies’ growth in the five years after the GFC has been supported by more diversified sources of growth. In particular, Asia’s domestic demand accounted for 86% of GDP in 2012 (1990: 81%). At the same time, regional economies have diversified their trade partners, with intra-regional trade accounting for close to 50% of total trade in 2012 (1990: 37%). Asia’s resilience has also been enhanced by more flexible exchange rate regimes, as well as more developed and stronger financial sectors. Compared to the pre-AFC period, most Asian economies are now less reliant on short-term debt funding, have expanded the sources of funding for the economy and have higher level of foreign exchange reserves. In addition, the quality of foreign debt funding has also improved given the deeper and broader capital markets in many countries in the region. These have significantly improved the resilience of Asia in withstanding and responding to external shocks and safeguarding domestic financial and macroeconomic stability.
In addition, there is now greater regional financial integration and cooperation. Over the past decade, regional initiatives have been strengthened to provide a much stronger framework for cross-border financial assistance to improve the crisis readiness of the region. This includes the enhancement of multilateral liquidity support among the Asian economies, such as the Chiang Mai Initiative Multilateralisation (CMIM), which is complemented by economic surveillance conducted by the ASEAN+3 Macroeconomic Research Office (AMRO) and Monetary and Financial Stability Committee of the Executives’ Meeting of East Asia-Pacific Central Banks (EMEAP). The recently enhanced Crisis Management and Resolution Framework among EMEAP member countries also serves as a mechanism for collective policy response, surveillance and information sharing. New financial arrangements to facilitate trade financing and settlement in domestic currencies, primarily through local currency swap arrangements between regional central banks have also added a degree of resilience as these have reduced the vulnerability of regional trade to global financial market volatility.
AN
NU
AL
REP
OR
T 20
13M
ON
ETA
RY
AN
D F
INA
NC
IAL
CO
ND
ITIO
NS
5
ConclusionThe implementation of unconventional monetary stimulus in the advanced economies was premised upon achieving domestic policy objectives but has had wide-ranging global spillovers. As the pace of economic recovery in the advanced economies gains momentum, the shift towards policy normalisation will eventually take place. This shift will have implications for global capital fl ows, in particular through the rebalancing of portfolio fl ows from the emerging economies back to the advanced economies. Against this backdrop, policymakers in Asia face the challenge of managing the impact of capital fl ow reversals on their domestic economic and fi nancial conditions. Asia, as a whole, has exhibited greater resilience than in previous decades, refl ecting in part, the dividends from the post-AFC reforms. In addition, a broader and enhanced policy toolkit will help manage the potential negative externalities that may arise. All these will not necessarily insulate the Asian economies from the spillover effects from policy normalisation in the advanced economies. However, pre-emptive response will enable Asia to alleviate some of these effects and maintain the resilience of the region.
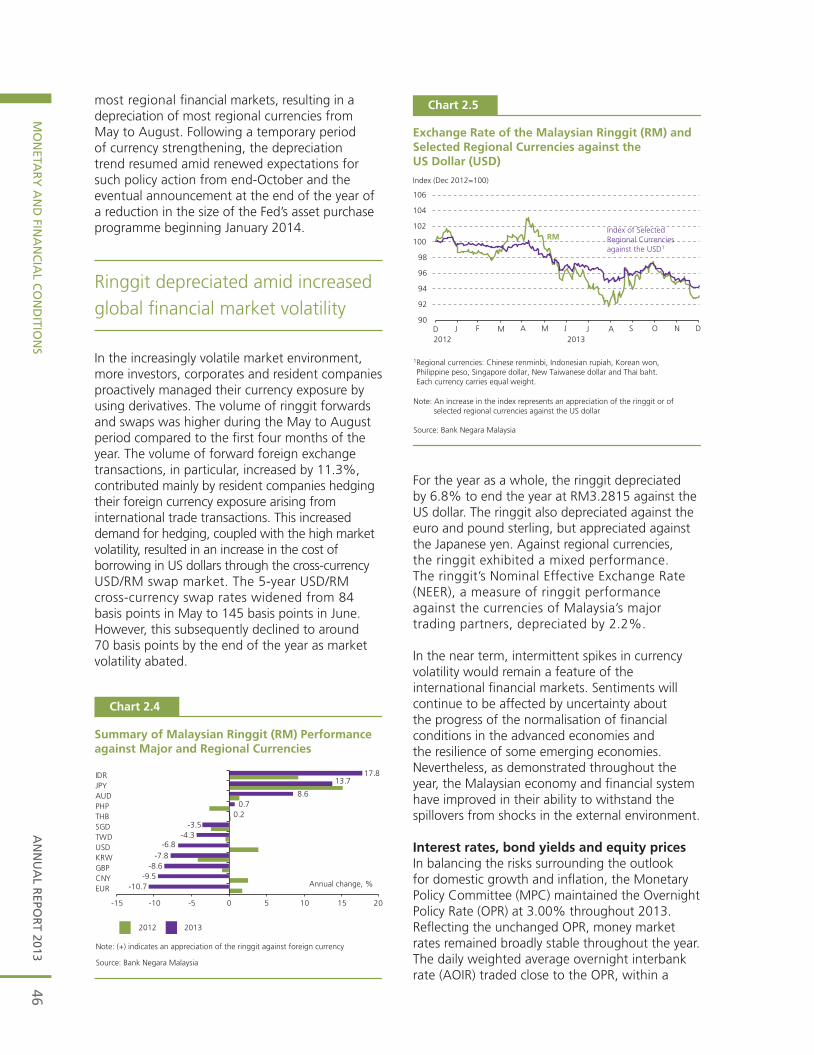
AN
NU
AL R
EPOR
T 2013M
ON
ETAR
Y A
ND
FINA
NC
IAL C
ON
DITIO
NS
46
most regional financial markets, resulting in a depreciation of most regional currencies from May to August. Following a temporary period of currency strengthening, the depreciation trend resumed amid renewed expectations for such policy action from end-October and the eventual announcement at the end of the year of a reduction in the size of the Fed’s asset purchase programme beginning January 2014.
Ringgit depreciated amid increased global financial market volatility
In the increasingly volatile market environment, more investors, corporates and resident companies proactively managed their currency exposure by using derivatives. The volume of ringgit forwards and swaps was higher during the May to August period compared to the first four months of the year. The volume of forward foreign exchange transactions, in particular, increased by 11.3%, contributed mainly by resident companies hedging their foreign currency exposure arising from international trade transactions. This increased demand for hedging, coupled with the high market volatility, resulted in an increase in the cost of borrowing in US dollars through the cross-currency USD/RM swap market. The 5-year USD/RM cross-currency swap rates widened from 84 basis points in May to 145 basis points in June. However, this subsequently declined to around 70 basis points by the end of the year as market volatility abated.
For the year as a whole, the ringgit depreciated by 6.8% to end the year at RM3.2815 against the US dollar. The ringgit also depreciated against the euro and pound sterling, but appreciated against the Japanese yen. Against regional currencies, the ringgit exhibited a mixed performance. The ringgit’s Nominal Effective Exchange Rate (NEER), a measure of ringgit performance against the currencies of Malaysia’s major trading partners, depreciated by 2.2%.
In the near term, intermittent spikes in currency volatility would remain a feature of the international financial markets. Sentiments will continue to be affected by uncertainty about the progress of the normalisation of financial conditions in the advanced economies and the resilience of some emerging economies. Nevertheless, as demonstrated throughout the year, the Malaysian economy and financial system have improved in their ability to withstand the spillovers from shocks in the external environment. Interest rates, bond yields and equity pricesIn balancing the risks surrounding the outlook for domestic growth and inflation, the Monetary Policy Committee (MPC) maintained the Overnight Policy Rate (OPR) at 3.00% throughout 2013. Reflecting the unchanged OPR, money market rates remained broadly stable throughout the year. The daily weighted average overnight interbank rate (AOIR) traded close to the OPR, within a
Chart 2.4
2012 2013
Source: Bank Negara Malaysia
Note: (+) indicates an appreciation of the ringgit against foreign currency
Summary of Malaysian Ringgit (RM) Performance against Major and Regional Currencies
Annual change, %-10.7-9.5
-8.6-7.8
-6.8-4.3
-3.50.2
0.78.6
13.717.8
-15 -10 -5 0 5 10 15 20
EURCNYGBPKRWUSDTWDSGDTHBPHPAUDJPYIDR
Chart 2.5
Exchange Rate of the Malaysian Ringgit (RM) andSelected Regional Currencies against theUS Dollar (USD)
1Regional currencies: Chinese renminbi, Indonesian rupiah, Korean won, Philippine peso, Singapore dollar, New Taiwanese dollar and Thai baht. Each currency carries equal weight.
Note: An increase in the index represents an appreciation of the ringgit or of selected regional currencies against the US dollar
Source: Bank Negara Malaysia
Index (Dec 2012=100)
RM
90
92
94
96
98
100
102
104
106
Index of Selected Regional Currenciesagainst the USD1
2012 2013D J F M JA M J A S O N D
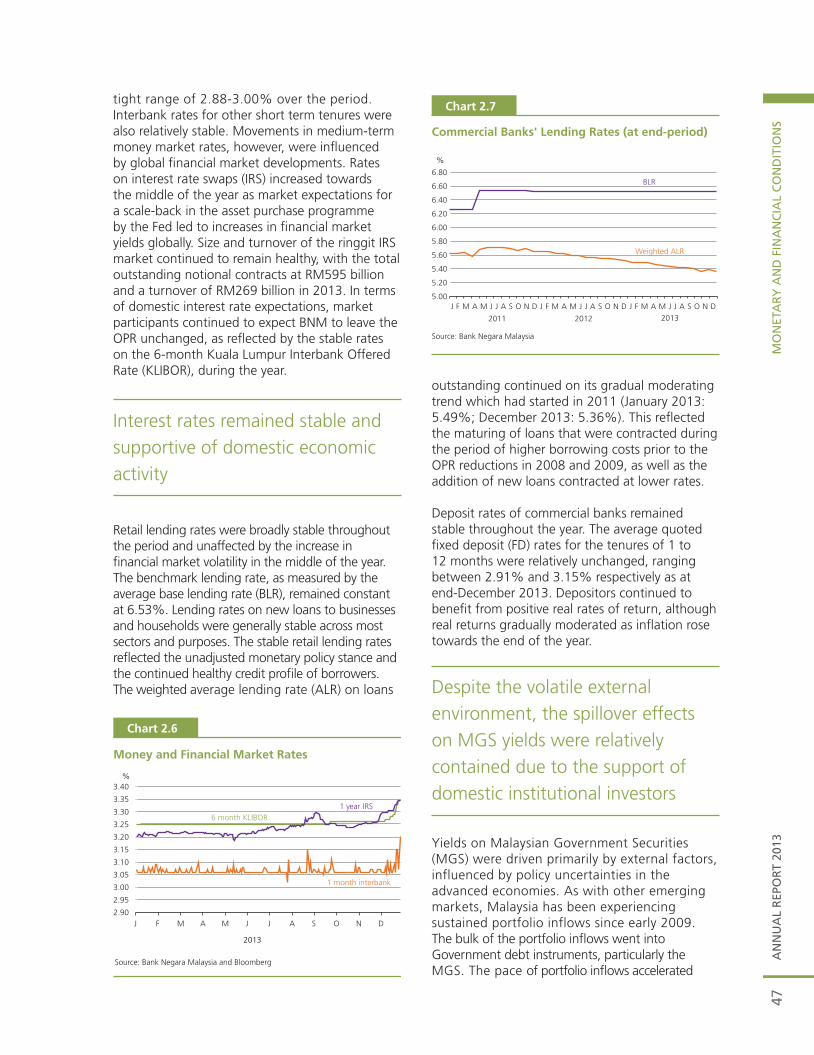
AN
NU
AL
REP
OR
T 20
13M
ON
ETA
RY
AN
D F
INA
NC
IAL
CO
ND
ITIO
NS
47
tight range of 2.88-3.00% over the period. Interbank rates for other short term tenures were also relatively stable. Movements in medium-term money market rates, however, were influenced by global financial market developments. Rates on interest rate swaps (IRS) increased towards the middle of the year as market expectations for a scale-back in the asset purchase programme by the Fed led to increases in financial market yields globally. Size and turnover of the ringgit IRS market continued to remain healthy, with the total outstanding notional contracts at RM595 billion and a turnover of RM269 billion in 2013. In terms of domestic interest rate expectations, market participants continued to expect BNM to leave the OPR unchanged, as reflected by the stable rates on the 6-month Kuala Lumpur Interbank Offered Rate (KLIBOR), during the year.
Interest rates remained stable and supportive of domestic economic activity
Retail lending rates were broadly stable throughout the period and unaffected by the increase in financial market volatility in the middle of the year.The benchmark lending rate, as measured by the average base lending rate (BLR), remained constant at 6.53%. Lending rates on new loans to businesses and households were generally stable across most sectors and purposes. The stable retail lending rates reflected the unadjusted monetary policy stance and the continued healthy credit profile of borrowers. The weighted average lending rate (ALR) on loans
Money and Financial Market Rates
Source: Bank Negara Malaysia and Bloomberg
%
2.90
2.95
3.00
3.05
3.10
3.15
3.20
3.25
3.30
3.35
3.40
J F M A M J J A S O N D
1 month interbank
6 month KLIBOR1 year IRS
2013
Chart 2.6
Chart 2.7
Commercial Banks' Lending Rates (at end-period)
Source: Bank Negara Malaysia
20122011 2013
Weighted ALR
BLR
J F M A M J J A S O N D J F M A M J J A S O N D J F M A M J J A S O N D5.00
5.20
5.40
5.60
5.80
6.00
6.20
6.40
6.60
6.80
%
outstanding continued on its gradual moderating trend which had started in 2011 (January 2013: 5.49%; December 2013: 5.36%). This reflected the maturing of loans that were contracted during the period of higher borrowing costs prior to the OPR reductions in 2008 and 2009, as well as the addition of new loans contracted at lower rates.
Deposit rates of commercial banks remained stable throughout the year. The average quoted fixed deposit (FD) rates for the tenures of 1 to 12 months were relatively unchanged, ranging between 2.91% and 3.15% respectively as at end-December 2013. Depositors continued to benefit from positive real rates of return, although real returns gradually moderated as inflation rose towards the end of the year.
Despite the volatile external environment, the spillover effects on MGS yields were relatively contained due to the support of domestic institutional investors
Yields on Malaysian Government Securities (MGS) were driven primarily by external factors, influenced by policy uncertainties in the advanced economies. As with other emerging markets, Malaysia has been experiencing sustained portfolio inflows since early 2009. The bulk of the portfolio inflows went into Government debt instruments, particularly the MGS. The pace of portfolio inflows accelerated
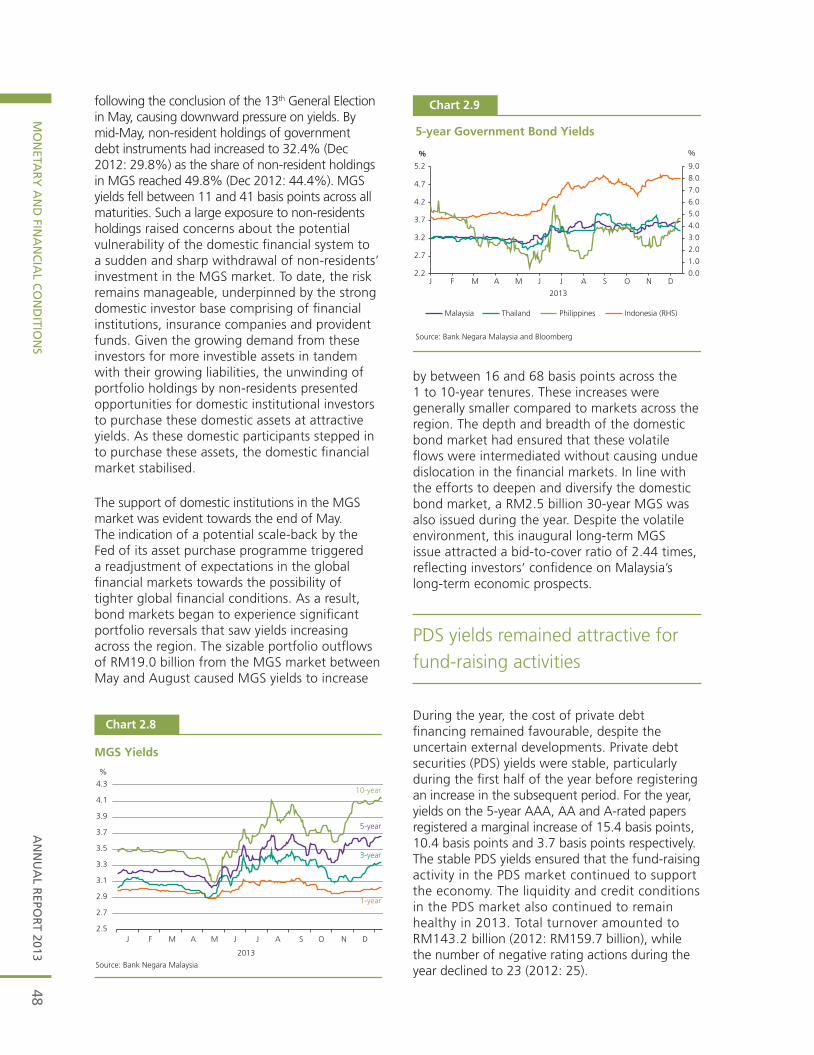
AN
NU
AL R
EPOR
T 2013M
ON
ETAR
Y A
ND
FINA
NC
IAL C
ON
DITIO
NS
48
following the conclusion of the 13th General Election in May, causing downward pressure on yields. By mid-May, non-resident holdings of government debt instruments had increased to 32.4% (Dec 2012: 29.8%) as the share of non-resident holdings in MGS reached 49.8% (Dec 2012: 44.4%). MGS yields fell between 11 and 41 basis points across all maturities. Such a large exposure to non-residents holdings raised concerns about the potential vulnerability of the domestic financial system to a sudden and sharp withdrawal of non-residents’ investment in the MGS market. To date, the risk remains manageable, underpinned by the strong domestic investor base comprising of financial institutions, insurance companies and provident funds. Given the growing demand from these investors for more investible assets in tandem with their growing liabilities, the unwinding of portfolio holdings by non-residents presented opportunities for domestic institutional investors to purchase these domestic assets at attractive yields. As these domestic participants stepped in to purchase these assets, the domestic financial market stabilised.
The support of domestic institutions in the MGS market was evident towards the end of May. The indication of a potential scale-back by the Fed of its asset purchase programme triggered a readjustment of expectations in the global financial markets towards the possibility of tighter global financial conditions. As a result, bond markets began to experience significant portfolio reversals that saw yields increasing across the region. The sizable portfolio outflows of RM19.0 billion from the MGS market between May and August caused MGS yields to increase
Chart 2.8
MGS Yields
2013
Source: Bank Negara Malaysia
2.5
2.7
2.9
3.1
3.3
3.5
3.7
3.9
4.1
4.3
J F M A M J J A S O N D
%
10-year
5-year
3-year
1-year
Chart 2.9
5-year Government Bond Yields
Source: Bank Negara Malaysia and Bloomberg
2013
Malaysia Indonesia (RHS)Thailand Philippines
% %
0.0
1.0
2.0
3.0
4.0
5.0
6.0
7.0
8.0
9.0
2.2
2.7
3.2
3.7
4.2
4.7
5.2
J F M A M J J A S O N D
by between 16 and 68 basis points across the 1 to 10-year tenures. These increases were generally smaller compared to markets across the region. The depth and breadth of the domestic bond market had ensured that these volatile flows were intermediated without causing undue dislocation in the financial markets. In line with the efforts to deepen and diversify the domestic bond market, a RM2.5 billion 30-year MGS was also issued during the year. Despite the volatile environment, this inaugural long-term MGS issue attracted a bid-to-cover ratio of 2.44 times, reflecting investors’ confidence on Malaysia’s long-term economic prospects.
PDS yields remained attractive for fund-raising activities
During the year, the cost of private debt financing remained favourable, despite the uncertain external developments. Private debt securities (PDS) yields were stable, particularly during the first half of the year before registering an increase in the subsequent period. For the year, yields on the 5-year AAA, AA and A-rated papers registered a marginal increase of 15.4 basis points, 10.4 basis points and 3.7 basis points respectively. The stable PDS yields ensured that the fund-raising activity in the PDS market continued to support the economy. The liquidity and credit conditions in the PDS market also continued to remain healthy in 2013. Total turnover amounted to RM143.2 billion (2012: RM159.7 billion), while the number of negative rating actions during the year declined to 23 (2012: 25).
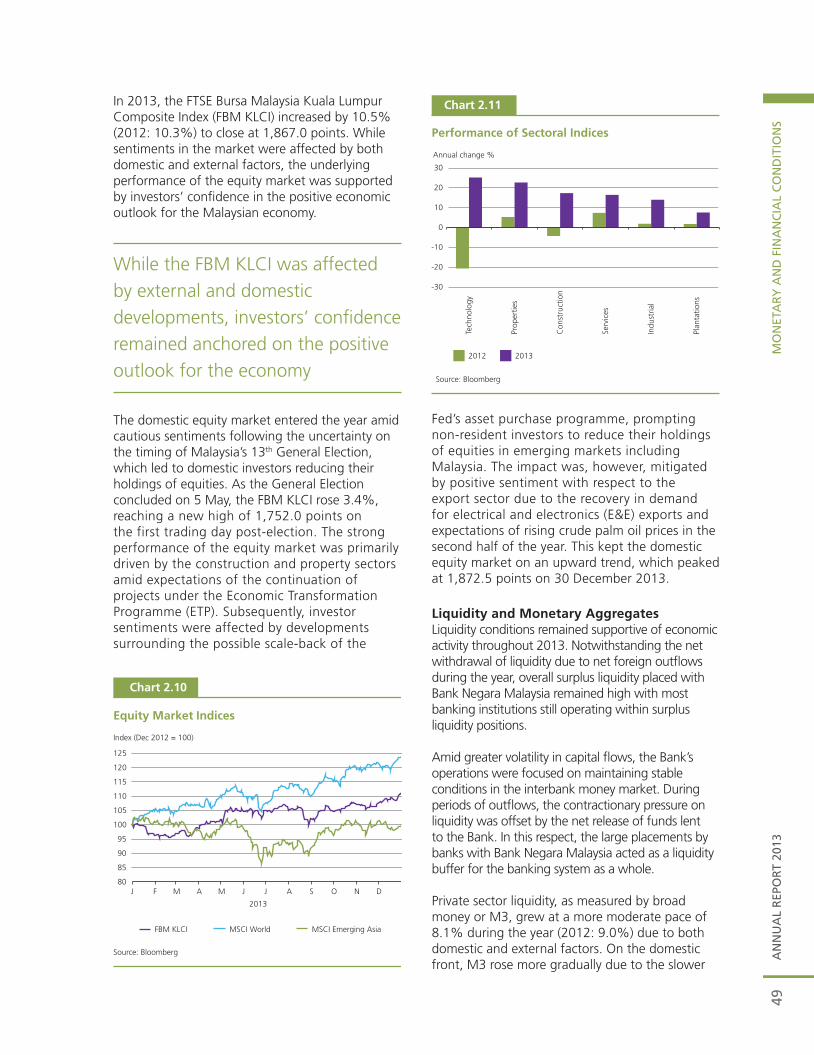
AN
NU
AL
REP
OR
T 20
13M
ON
ETA
RY
AN
D F
INA
NC
IAL
CO
ND
ITIO
NS
49
In 2013, the FTSE Bursa Malaysia Kuala Lumpur Composite Index (FBM KLCI) increased by 10.5% (2012: 10.3%) to close at 1,867.0 points. While sentiments in the market were affected by both domestic and external factors, the underlying performance of the equity market was supported by investors’ confidence in the positive economic outlook for the Malaysian economy.
While the FBM KLCI was affected by external and domestic developments, investors’ confidence remained anchored on the positive outlook for the economy
The domestic equity market entered the year amid cautious sentiments following the uncertainty on the timing of Malaysia’s 13th General Election, which led to domestic investors reducing their holdings of equities. As the General Election concluded on 5 May, the FBM KLCI rose 3.4%, reaching a new high of 1,752.0 points on the first trading day post-election. The strong performance of the equity market was primarily driven by the construction and property sectors amid expectations of the continuation of projects under the Economic Transformation Programme (ETP). Subsequently, investor sentiments were affected by developments surrounding the possible scale-back of the
Chart 2.10
Equity Market Indices
80
85
90
95
100
105
110
115
120
125
J F M A M J J A S O N D
2013
Index (Dec 2012 = 100)
FBM KLCI MSCI World MSCI Emerging Asia
Source: Bloomberg
Chart 2.11
Performance of Sectoral Indices
Annual change %
-30
-20
-10
0
10
20
30
2012 2013
Source: Bloomberg
Tech
nolo
gy
Prop
ertie
s
Con
stru
ctio
n
Serv
ices
Indu
stria
l
Plan
tatio
ns
Fed’s asset purchase programme, prompting non-resident investors to reduce their holdings of equities in emerging markets including Malaysia. The impact was, however, mitigated by positive sentiment with respect to the export sector due to the recovery in demand for electrical and electronics (E&E) exports and expectations of rising crude palm oil prices in the second half of the year. This kept the domestic equity market on an upward trend, which peaked at 1,872.5 points on 30 December 2013.
Liquidity and Monetary AggregatesLiquidity conditions remained supportive of economic activity throughout 2013. Notwithstanding the net withdrawal of liquidity due to net foreign outflows during the year, overall surplus liquidity placed with Bank Negara Malaysia remained high with most banking institutions still operating within surplus liquidity positions.
Amid greater volatility in capital flows, the Bank’s operations were focused on maintaining stable conditions in the interbank money market. During periods of outflows, the contractionary pressure on liquidity was offset by the net release of funds lent to the Bank. In this respect, the large placements by banks with Bank Negara Malaysia acted as a liquidity buffer for the banking system as a whole.
Private sector liquidity, as measured by broad money or M3, grew at a more moderate pace of 8.1% during the year (2012: 9.0%) due to both domestic and external factors. On the domestic front, M3 rose more gradually due to the slower
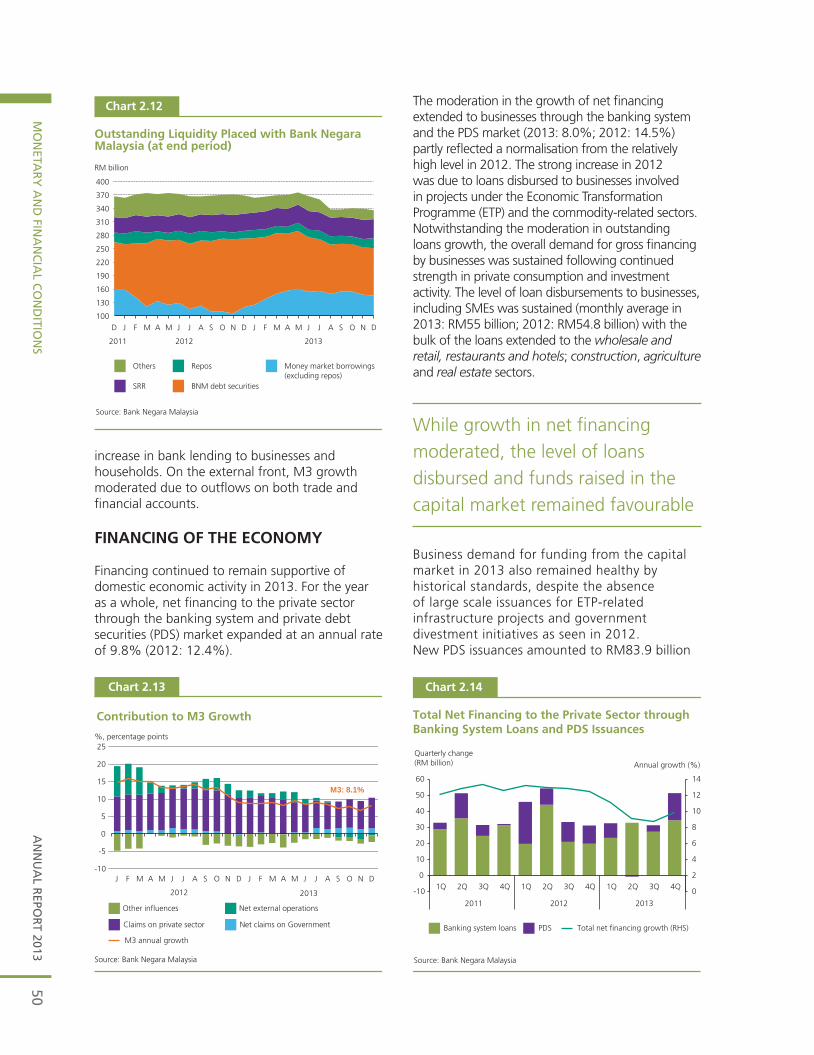
AN
NU
AL R
EPOR
T 2013M
ON
ETAR
Y A
ND
FINA
NC
IAL C
ON
DITIO
NS
50
Chart 2.12
Outstanding Liquidity Placed with Bank NegaraMalaysia (at end period)
BNM debt securities
Money market borrowings (excluding repos)
Repos
SRR
Others
Source: Bank Negara Malaysia
RM billion
201320122011
100
130
160
190
220
250
280
310
340
370
400
D J F M A M J J A S O N D J F M A M J J A S O N D
increase in bank lending to businesses and households. On the external front, M3 growth moderated due to outflows on both trade and financial accounts. FINANCING OF THE ECONOMY
Financing continued to remain supportive of domestic economic activity in 2013. For the year as a whole, net financing to the private sector through the banking system and private debt securities (PDS) market expanded at an annual rate of 9.8% (2012: 12.4%).
Chart 2.13
Contribution to M3 Growth
%, percentage points
Source: Bank Negara Malaysia
Net claims on Government
Other influences
Claims on private sector
Net external operations
-10
-5
0
5
10
15
20
25
J F M A M J J A S O N D J F M A M J J A S O N D
20132012
M3: 8.1%
M3 annual growth
Banking system loans PDS Total net financing growth (RHS)
0
2
4
6
8
10
12
14
-10
0
10
20
30
40
50
60
1Q 2Q 3Q 4Q 1Q 2Q 3Q 4Q 1Q 2Q 3Q 4Q
2011 2012 2013
Chart 2.14
Total Net Financing to the Private Sector throughBanking System Loans and PDS Issuances
Source: Bank Negara Malaysia
Quarterly change(RM billion) Annual growth (%)
The moderation in the growth of net financing extended to businesses through the banking system and the PDS market (2013: 8.0%; 2012: 14.5%) partly reflected a normalisation from the relatively high level in 2012. The strong increase in 2012 was due to loans disbursed to businesses involved in projects under the Economic Transformation Programme (ETP) and the commodity-related sectors. Notwithstanding the moderation in outstanding loans growth, the overall demand for gross financing by businesses was sustained following continued strength in private consumption and investment activity. The level of loan disbursements to businesses, including SMEs was sustained (monthly average in 2013: RM55 billion; 2012: RM54.8 billion) with the bulk of the loans extended to the wholesale and retail, restaurants and hotels; construction, agriculture and real estate sectors.
While growth in net financing moderated, the level of loans disbursed and funds raised in the capital market remained favourable
Business demand for funding from the capital market in 2013 also remained healthy by historical standards, despite the absence of large scale issuances for ETP-related infrastructure projects and government divestment initiatives as seen in 2012. New PDS issuances amounted to RM83.9 billion
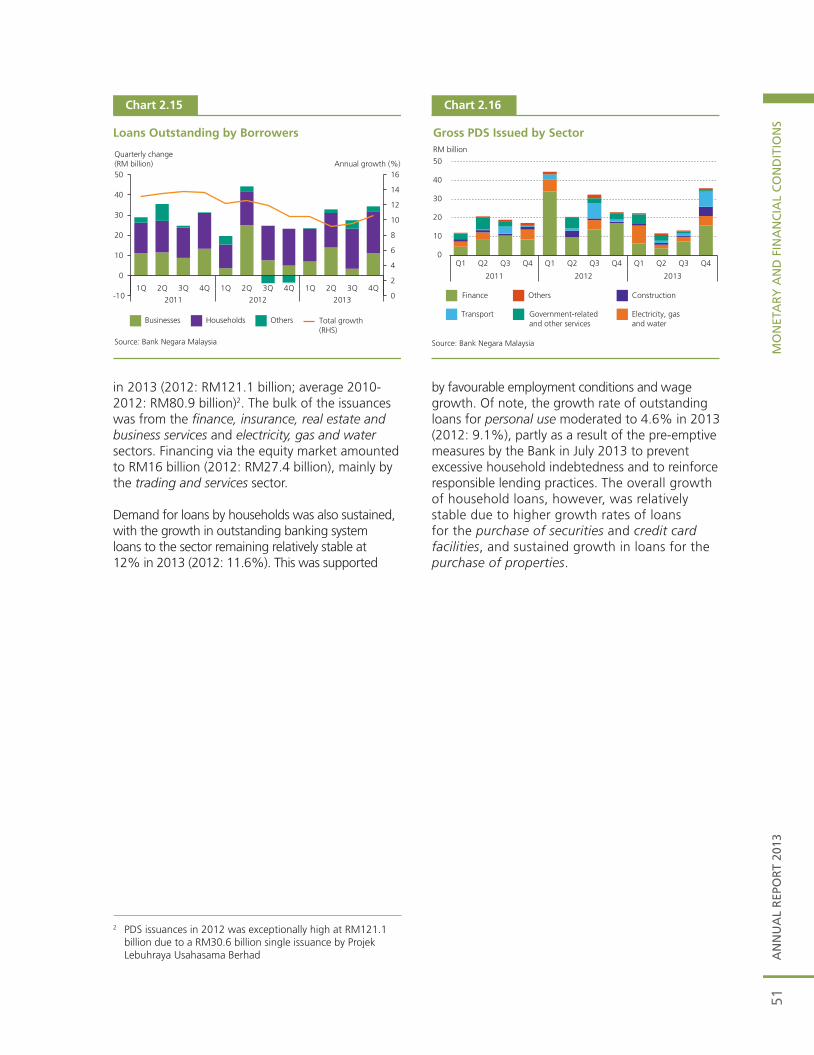
AN
NU
AL
REP
OR
T 20
13M
ON
ETA
RY
AN
D F
INA
NC
IAL
CO
ND
ITIO
NS
51
in 2013 (2012: RM121.1 billion; average 2010-2012: RM80.9 billion)2. The bulk of the issuances was from the finance, insurance, real estate and business services and electricity, gas and water sectors. Financing via the equity market amounted to RM16 billion (2012: RM27.4 billion), mainly by the trading and services sector.
Demand for loans by households was also sustained, with the growth in outstanding banking system loans to the sector remaining relatively stable at 12% in 2013 (2012: 11.6%). This was supported
Chart 2.15
Loans Outstanding by Borrowers
Quarterly change(RM billion) Annual growth (%)
Businesses Households Others Total growth(RHS)
Source: Bank Negara Malaysia
0
2
4
6
8
10
12
14
16
-10
0
10
20
30
40
50
1Q 2Q 3Q 4Q 1Q 2Q 3Q 4Q 1Q 2Q 3Q 4Q
2011 2012 2013
Chart 2.16
Gross PDS Issued by Sector
Finance
Government-relatedand other services
Transport
Others Construction
Electricity, gasand water
RM billion
0
10
20
30
40
50
Source: Bank Negara Malaysia
2011 2012 2013
Q1 Q2 Q3 Q4 Q1 Q2 Q3 Q4 Q1 Q2 Q3 Q4
by favourable employment conditions and wage growth. Of note, the growth rate of outstanding loans for personal use moderated to 4.6% in 2013 (2012: 9.1%), partly as a result of the pre-emptive measures by the Bank in July 2013 to prevent excessive household indebtedness and to reinforce responsible lending practices. The overall growth of household loans, however, was relatively stable due to higher growth rates of loans for the purchase of securities and credit card facilities, and sustained growth in loans for the purchase of properties.
2 PDS issuances in 2012 was exceptionally high at RM121.1 billion due to a RM30.6 billion single issuance by Projek Lebuhraya Usahasama Berhad

AN
NU
AL R
EPOR
T 2013M
ON
ETAR
Y A
ND
FINA
NC
IAL C
ON
DITIO
NS
52

AN
NU
AL
REP
OR
T 20
13M
ON
ETA
RY
PO
LIC
Y IN
201
353
55 Monetary Policy
57 Monetary Operations
MONETARY POLICY IN 2013

AN
NU
AL R
EPOR
T 2013M
ON
ETAR
Y PO
LICY
IN 2013
54

AN
NU
AL
REP
OR
T 20
1355
MONETARY POLICY IN 2013
MONETARY POLICY
In 2013, against a backdrop of increased uncertainties on the balance of risks surrounding the outlook for domestic growth and inflation, the Monetary Policy Committee (MPC) maintained the Overnight Policy Rate (OPR) at 3.00%.
At the beginning of 2013, the Malaysian economy was projected to remain on a steady growth trajectory, with GDP growth expected to be in the range of 5%-6%. Domestic demand was to be the key driver of growth, with expectations for a gradual improvement in global growth. Private consumption was expected to remain supported by income growth and stable employment conditions. Investment activity would be sustained, led by capital spending in the domestic-oriented industries, the oil and gas sector and the ongoing implementation of infrastructure projects. Nevertheless, it was recognised that there were downside risks to the growth outlook, emanating mainly from the external environment. Constrained growth in the advanced economies arising from their fiscal consolidation efforts and weak labour market conditions could adversely affect the external sector of the Malaysian economy.
Inflation, as measured by the Consumer Price Index (CPI), was forecasted to be at 2%-3% in 2013, compared to the 1.6% outturn in 2012. The projected higher inflation was based on the expected higher domestic food prices arising from elevated global prices for key food commodities, higher costs arising from the implementation of the minimum wage policy and the possibility of adjustments to administered prices. However, demand pressures were not expected to be a significant factor behind price increases given the adequate productive capacity within the economy to generate new supply. Inflation risks were nevertheless on the upside as higher global commodity prices, a faster pace of subsidy rationalisation or stronger-than-projected demand pressures could all cause inflation to exceed the forecasted range. The MPC had assessed the risks to domestic growth and inflation as being broadly in balance. Domestic growth was expected to be resilient but faced significant downside risks emanating from the external environment. Inflation risks were tilted to the upside. Given this uncertainty regarding the balance of risks to the growth and inflation outlook, the MPC viewed that a change in the OPR was not warranted. The MPC also considered the merits of using the OPR to manage the formation of financial imbalances. Keeping an interest rate environment that is too low for too long risked financial imbalances forming, which
US Japan Euro area ASEAN 5* NIEs** PR China World
Outlook for Real GDP Growth in 2013
Oct '12 Jan '13 Apr '13 Jul '13 Oct '13
*Indonesia, Malaysia, Philippines, Thailand and Vietnam**Newly Industrialised Asian Economies. July 2013 data for NIEs are not published.
Source: IMF, WEO October 2012, January, April, July and October 2013; Bank Negara Malaysia calculations
Annual growth (%)
Chart 3.1
-1
0
1
2
3
4
5
6
7
8
9
Chart 3.2
GDP and Inflation
Annual growth (%)Annual growth (%)
Source: Department of Statistics, Malaysia and Bank Negara Malaysia
GDP
Inflation (RHS)
0
1
2
3
4
0
2
4
6
8
1Q 2Q 3Q 4Q 1Q 2Q 3Q 4Q2012 2013

AN
NU
AL R
EPOR
T 2013M
ON
ETAR
Y PO
LICY
IN 2013
56
could pose medium-term risks to macroeconomic and financial stability. The MPC decided that the level of the OPR was appropriate, and given that the risks of financial imbalances were confined to certain segments of the economy, other tools would be better suited to address these risks. Consequently, macroprudential measures were introduced in July to manage the risks of financial imbalances in a targeted manner (see Financial Stability and Payment Systems Report 2013).
By the middle of the year, however, the dynamics of both domestic growth and inflation had changed, and these increased the uncertainties surrounding the balance of risks. The release of the first quarter GDP growth data for the advanced economies showed that growth turned out to be below earlier expectations, weighed down by policy uncertainties. As a result, the growth forecasts for 2013 and 2014 for several advanced economies were revised downwards. Similar weaknesses were observed in the first quarter GDP growth data for several Asian economies which were mainly attributable to spillovers from prolonged weaknesses in external demand. In PR China, growth moderated more than initial expectations as the government showed firm commitment towards economic rebalancing. Consequently, the growth forecasts for several Asian economies were also revised downwards, factoring in the slower growth momentum in the advanced economies and PR China.
For the domestic economy, the growth of 4.3% in the first half of the year was lower than earlier
estimated. Net export growth was weak as export growth was affected by the prolonged slow growth in the US and weak economic activity in most of the European economies. Import growth expanded further following sustained growth in domestic investment and consumption. Consequently, the GDP forecast for the year was revised downwards in August to 4.5%-5.0%. While the annual growth was revised downwards given the slower expansion in economic activity in the first half of the year, the growth momentum was expected to improve in the second half of the year and into 2014. This was in line with the expectations for an improvement in global trade amid a recovery in the growth momentum of the advanced economies from the second half of 2013. However, uncertainty with regard to the domestic growth outlook for 2014 remained, especially on the strength of the global recovery. There was also uncertainty over the extent to which domestic factors such as the continued fiscal consolidation, rationalisation of subsidies and targeted measures to reduce the risks from vulnerabilities in the household sector, would affect domestic demand.
Inflation was expected to be within the lower end of the forecast range, as the key drivers of inflation identified at the beginning of the year did not materialise to the extent expected. Changes to administered prices had not occurred, while the projections for global food prices were revised downwards in line with the observed increase in global production. The extended deadline for the implementation of the minimum wage policy further eased pressure on costs. From September onwards, however, the inflation dynamics shifted and inflation was expected to increase for the remainder of the year and into 2014. This change was driven primarily by the upward adjustments in the prices of retail petroleum products and sugar in September and October, respectively; higher excise duties on tobacco products in the later part of the year; and the announced adjustment to electricity tariffs effective January 2014. A key risk the MPC had to consider was whether these price adjustments had the potential to set off a more sustained increase in prices across the economy. The subdued external price pressures and moderate domestic demand conditions were key mitigating factors to the prospect of broad-based price increases. The risks of second-round effects to inflation were also assessed to be limited, as the increase in inflation expectations remained confined to the prices of food and transportation.
Outlook for Real GDP Growth in 2014
Oct '12 Jan '13 Apr '13 Jul '13 Oct '13
*Indonesia, Malaysia, Philippines, Thailand and Vietnam**Newly Industrialised Asian Economies. July 2013 data for NIEs are not published.
Source: IMF, WEO October 2012, January, April, July and October 2013; Bank Negara Malaysia calculations
Annual growth (%)
Chart 3.3
US Japan Euro area ASEAN 5* NIEs** PR China World
0123456789
10
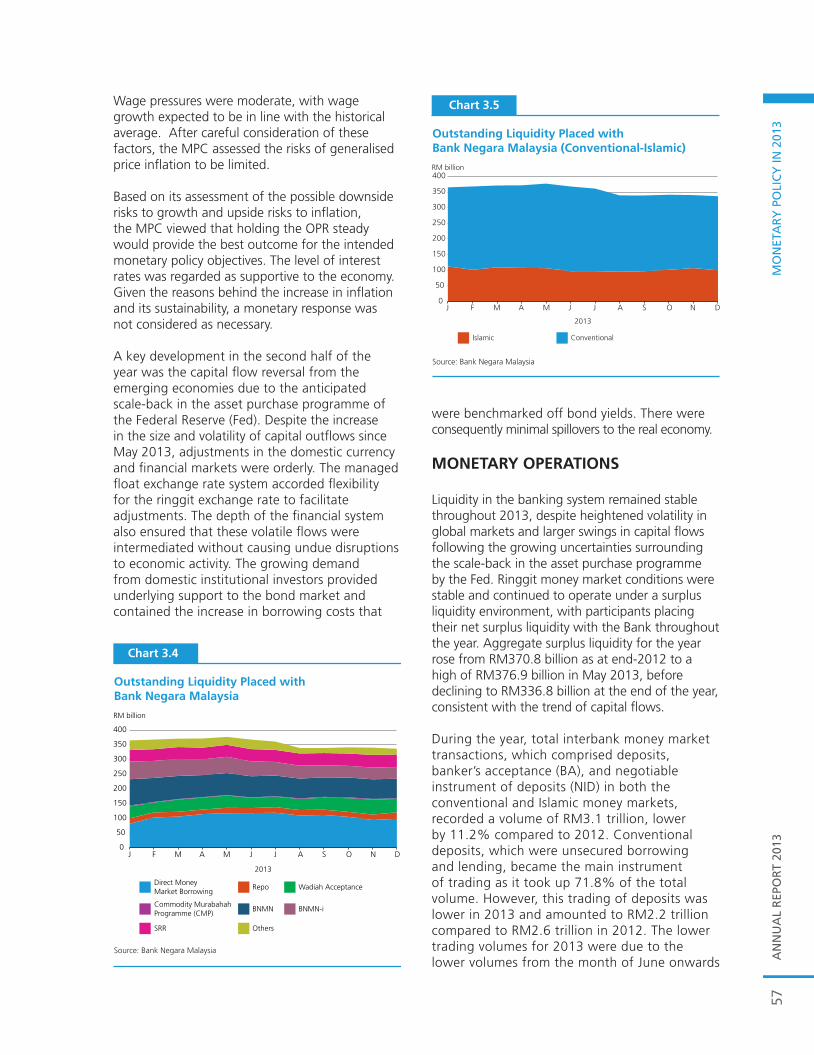
AN
NU
AL
REP
OR
T 20
13M
ON
ETA
RY
PO
LIC
Y IN
201
357
Wage pressures were moderate, with wage growth expected to be in line with the historical average. After careful consideration of these factors, the MPC assessed the risks of generalised price inflation to be limited.
Based on its assessment of the possible downside risks to growth and upside risks to inflation, the MPC viewed that holding the OPR steady would provide the best outcome for the intended monetary policy objectives. The level of interest rates was regarded as supportive to the economy. Given the reasons behind the increase in inflation and its sustainability, a monetary response was not considered as necessary.
A key development in the second half of the year was the capital flow reversal from the emerging economies due to the anticipated scale-back in the asset purchase programme of the Federal Reserve (Fed). Despite the increase in the size and volatility of capital outflows since May 2013, adjustments in the domestic currency and financial markets were orderly. The managed float exchange rate system accorded flexibility for the ringgit exchange rate to facilitate adjustments. The depth of the financial system also ensured that these volatile flows were intermediated without causing undue disruptions to economic activity. The growing demand from domestic institutional investors provided underlying support to the bond market and contained the increase in borrowing costs that
were benchmarked off bond yields. There were consequently minimal spillovers to the real economy.
MONETARY OPERATIONS
Liquidity in the banking system remained stable throughout 2013, despite heightened volatility in global markets and larger swings in capital flows following the growing uncertainties surrounding the scale-back in the asset purchase programme by the Fed. Ringgit money market conditions were stable and continued to operate under a surplus liquidity environment, with participants placing their net surplus liquidity with the Bank throughout the year. Aggregate surplus liquidity for the year rose from RM370.8 billion as at end-2012 to a high of RM376.9 billion in May 2013, before declining to RM336.8 billion at the end of the year, consistent with the trend of capital flows.
During the year, total interbank money market transactions, which comprised deposits, banker’s acceptance (BA), and negotiable instrument of deposits (NID) in both the conventional and Islamic money markets, recorded a volume of RM3.1 trillion, lower by 11.2% compared to 2012. Conventional deposits, which were unsecured borrowing and lending, became the main instrument of trading as it took up 71.8% of the total volume. However, this trading of deposits was lower in 2013 and amounted to RM2.2 trillion compared to RM2.6 trillion in 2012. The lower trading volumes for 2013 were due to the lower volumes from the month of June onwards
Chart 3.4
Outstanding Liquidity Placed with Bank Negara Malaysia
Source: Bank Negara Malaysia
Direct MoneyMarket Borrowing
Repo Wadiah Acceptance
Commodity MurabahahProgramme (CMP)
BNMN BNMN-i
SRR Others
2013
RM billion
0
50
100
150
200
250
300
350
400
J F M A M J J A S O N D
Chart 3.5
Outstanding Liquidity Placed with Bank Negara Malaysia (Conventional-Islamic)
Source: Bank Negara Malaysia
Islamic Conventional
2013
RM billion
0
50
100
150
200
250
300
350
400
J F M A M J J A S O N D
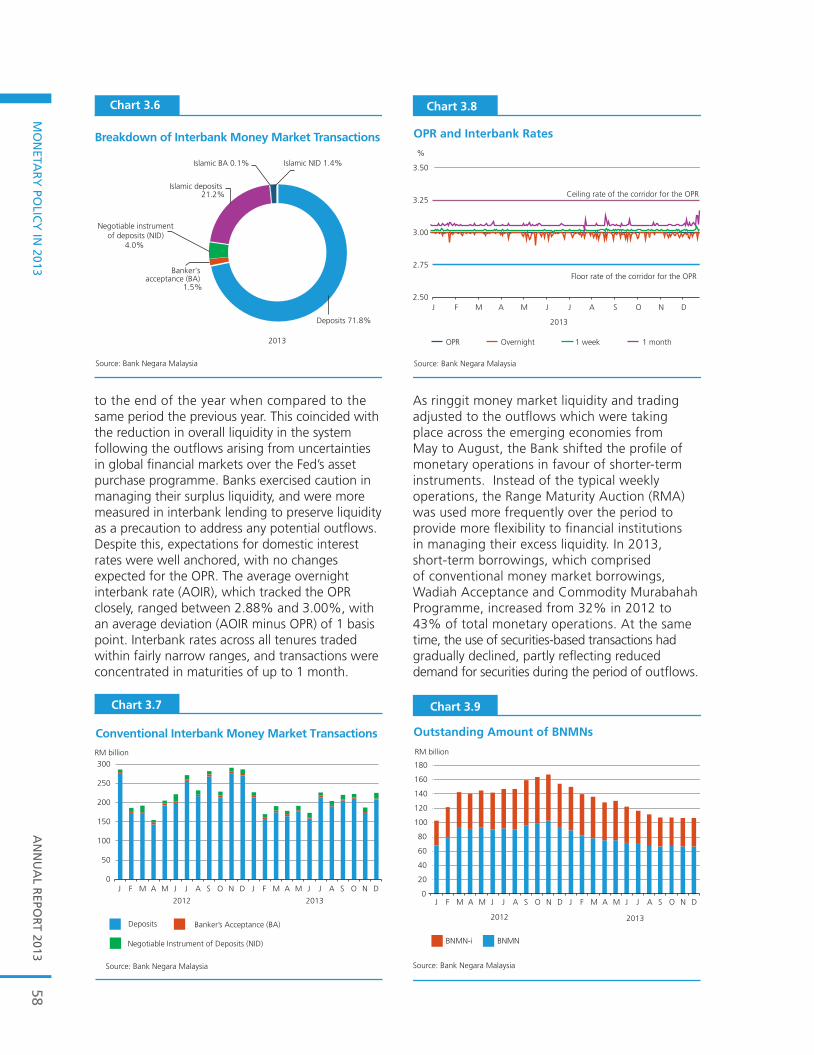
AN
NU
AL R
EPOR
T 2013M
ON
ETAR
Y PO
LICY
IN 2013
58
to the end of the year when compared to the same period the previous year. This coincided with the reduction in overall liquidity in the system following the outflows arising from uncertainties in global financial markets over the Fed’s asset purchase programme. Banks exercised caution in managing their surplus liquidity, and were more measured in interbank lending to preserve liquidity as a precaution to address any potential outflows. Despite this, expectations for domestic interest rates were well anchored, with no changes expected for the OPR. The average overnight interbank rate (AOIR), which tracked the OPR closely, ranged between 2.88% and 3.00%, with an average deviation (AOIR minus OPR) of 1 basis point. Interbank rates across all tenures traded within fairly narrow ranges, and transactions were concentrated in maturities of up to 1 month.
As ringgit money market liquidity and trading adjusted to the outflows which were taking place across the emerging economies from May to August, the Bank shifted the profile of monetary operations in favour of shorter-term instruments. Instead of the typical weekly operations, the Range Maturity Auction (RMA) was used more frequently over the period to provide more flexibility to financial institutions in managing their excess liquidity. In 2013, short-term borrowings, which comprised of conventional money market borrowings, Wadiah Acceptance and Commodity Murabahah Programme, increased from 32% in 2012 to 43% of total monetary operations. At the same time, the use of securities-based transactions had gradually declined, partly reflecting reduced demand for securities during the period of outflows.
Breakdown of Interbank Money Market Transactions
Chart 3.6
Deposits 71.8%
Banker's acceptance (BA)
1.5%
Negotiable instrumentof deposits (NID)
4.0%
Islamic deposits 21.2%
Islamic BA 0.1% Islamic NID 1.4%
2013
Source: Bank Negara Malaysia
Conventional Interbank Money Market Transactions
Chart 3.7
0
50
100
150
200
250
300
J F M A M J J A S O N D J F M A M J J A S O N D
RM billion
Deposits Banker’s Acceptance (BA)
Negotiable Instrument of Deposits (NID)
Source: Bank Negara Malaysia
20132012
Chart 3.8
OPR and Interbank Rates
2.50
2.75
3.00
3.25
3.50
J F M A M J J A S O N D
%
OPR Overnight 1 week
2013
Ceiling rate of the corridor for the OPR
Floor rate of the corridor for the OPR
Source: Bank Negara Malaysia
1 month
Chart 3.9
Outstanding Amount of BNMNs
BNMN-i BNMN
Source: Bank Negara Malaysia
RM billion
0
20
40
60
80
100
120
140
160
180
J F M A M J J A S O N D J F M A M J J A S O N D
2012 2013
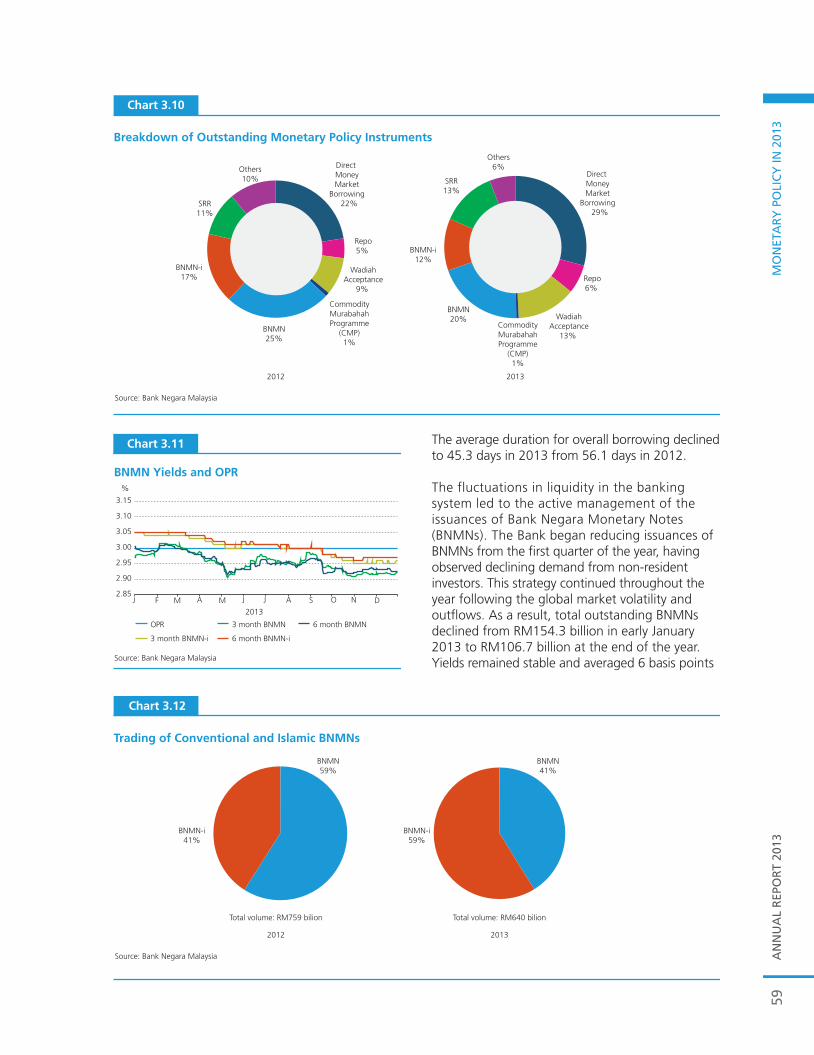
AN
NU
AL
REP
OR
T 20
13M
ON
ETA
RY
PO
LIC
Y IN
201
359
Breakdown of Outstanding Monetary Policy Instruments
Chart 3.10
Source: Bank Negara Malaysia
2012
Direct MoneyMarket
Borrowing 29%
Repo6%
WadiahAcceptance
13% CommodityMurabahahProgramme
(CMP)1%
BNMN20%
BNMN-i12%
SRR13%
Others6%Direct
MoneyMarket
Borrowing 22%
Others10%
SRR11%
BNMN-i17%
BNMN25%
CommodityMurabahahProgramme
(CMP)1%
WadiahAcceptance
9%
Repo5%
2013
The average duration for overall borrowing declined to 45.3 days in 2013 from 56.1 days in 2012. The fluctuations in liquidity in the banking system led to the active management of the issuances of Bank Negara Monetary Notes (BNMNs). The Bank began reducing issuances of BNMNs from the first quarter of the year, having observed declining demand from non-resident investors. This strategy continued throughout the year following the global market volatility and outflows. As a result, total outstanding BNMNs declined from RM154.3 billion in early January 2013 to RM106.7 billion at the end of the year. Yields remained stable and averaged 6 basis points
Trading of Conventional and Islamic BNMNs
Chart 3.12
Source: Bank Negara Malaysia
BNMN59%
BNMN-i41%
Total volume: RM759 bilion Total volume: RM640 bilion
2012 2013
BNMN-i59%
BNMN41%
Chart 3.11
BNMN Yields and OPR
2.85
2.90
2.95
3.00
3.05
3.10
3.15
%
FJ JMAM DNOSAJ
2013
OPR 3 month BNMN
6 month BNMN-i
6 month BNMN
3 month BNMN-i
Source: Bank Negara Malaysia
AN
NU
AL R
EPOR
T 2013M
ON
ETAR
Y PO
LICY
IN 2013
60
below the OPR in 2013. This was despite higher yields observed from early February to March during a transition period after the Bank prescribed the use of onshore USD/MYR fixing for all domestic foreign exchange orders executed at the 11.00 am fixing. As for the trading of BNMNs, comprising conventional and Islamic BNMNs, the total volume amounted to RM640.0 billion in 2013, a decline of 15.7% compared to 2012. However, the share of Islamic BNMNs traded increased from 41% to 59%. The total trading of Islamic BNMNs increased by 21.0% to RM377.6 billion, catering to the demands of both conventional and Islamic investors for these securities and reflecting the growing acceptance of Islamic instruments by global investors.
The Bank continued with a number of initiatives to strengthen regional cooperation and facilitate
more effective liquidity management by financial institutions in the domestic and regional markets. In 2013, the Bank established a cross-border collateral arrangement (CBCA) with the People’s Bank of China, the third CBCA established after arrangements with the Monetary Authority of Singapore and Bank of Thailand in previous years. With this latest arrangement, financial institutions in Malaysia can now pledge Chinese government and central bank securities with the Bank to obtain ringgit liquidity. For the Islamic money market, the Bank introduced Islamic Range Maturity Auction (iRMA), an auction similar to the conventional RMA launched in 2011, to increase the operational efficiency of Islamic monetary operations. The iRMA provides flexibility for Islamic banks to choose the maturity tenure of placements with the Bank in the form of Wadiah Acceptance or Commodity Murabahah Programme.
AN
NU
AL
REP
OR
T 20
13O
UTL
OO
K A
ND
PO
LIC
Y IN
201
461
63 The International Economic Outlook
66 The Malaysian Economy
70 Box Article: Evolving Household Balance Sheets and Implications
for Private Consumption
77 Box Article: Estimating Malaysia’s Potential Output
80 Monetary Policy Outlook
81 Fiscal Policy Outlook
OUTLOOK AND POLICY IN 2014

AN
NU
AL R
EPOR
T 2013O
UTLO
OK
AN
D PO
LICY
IN 2014
62
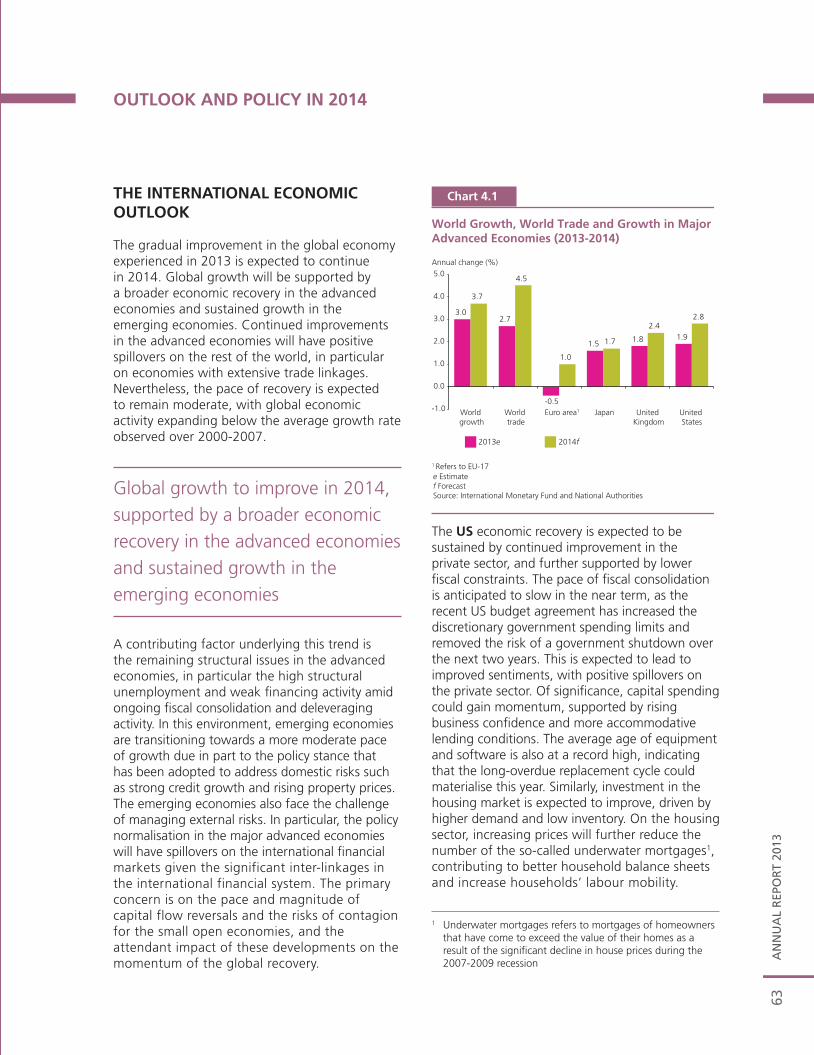
AN
NU
AL
REP
OR
T 20
1363
OUTLOOK AND POLICY IN 2014
THE INTERNATIONAL ECONOMIC OUTLOOK
The gradual improvement in the global economy experienced in 2013 is expected to continue in 2014. Global growth will be supported by a broader economic recovery in the advanced economies and sustained growth in the emerging economies. Continued improvements in the advanced economies will have positive spillovers on the rest of the world, in particular on economies with extensive trade linkages. Nevertheless, the pace of recovery is expected to remain moderate, with global economic activity expanding below the average growth rate observed over 2000-2007.
Global growth to improve in 2014, supported by a broader economic recovery in the advanced economies and sustained growth in the emerging economies
A contributing factor underlying this trend is the remaining structural issues in the advanced economies, in particular the high structural unemployment and weak financing activity amid ongoing fiscal consolidation and deleveraging activity. In this environment, emerging economies are transitioning towards a more moderate pace of growth due in part to the policy stance that has been adopted to address domestic risks such as strong credit growth and rising property prices. The emerging economies also face the challenge of managing external risks. In particular, the policy normalisation in the major advanced economies will have spillovers on the international financial markets given the significant inter-linkages in the international financial system. The primary concern is on the pace and magnitude of capital flow reversals and the risks of contagion for the small open economies, and the attendant impact of these developments on the momentum of the global recovery.
The US economic recovery is expected to be sustained by continued improvement in the private sector, and further supported by lower fiscal constraints. The pace of fiscal consolidation is anticipated to slow in the near term, as the recent US budget agreement has increased the discretionary government spending limits and removed the risk of a government shutdown over the next two years. This is expected to lead to improved sentiments, with positive spillovers on the private sector. Of significance, capital spending could gain momentum, supported by rising business confidence and more accommodative lending conditions. The average age of equipment and software is also at a record high, indicating that the long-overdue replacement cycle could materialise this year. Similarly, investment in the housing market is expected to improve, driven by higher demand and low inventory. On the housing sector, increasing prices will further reduce the number of the so-called underwater mortgages1, contributing to better household balance sheets and increase households’ labour mobility.
1 Underwater mortgages refers to mortgages of homeowners that have come to exceed the value of their homes as a result of the significant decline in house prices during the 2007-2009 recession
Chart 4.1
World Growth, World Trade and Growth in Major Advanced Economies (2013-2014)
Annual change (%)
2013e 2014f
e Estimatef ForecastSource: International Monetary Fund and National Authorities
World growth
World trade
Euro area1 Japan United Kingdom
United States
3.02.7
1.5 1.8 1.9
3.7
4.5
1.0
1.7
2.42.8
-1.0
0.0
1.0
2.0
3.0
4.0
5.0
-0.5
1 Refers to EU-17
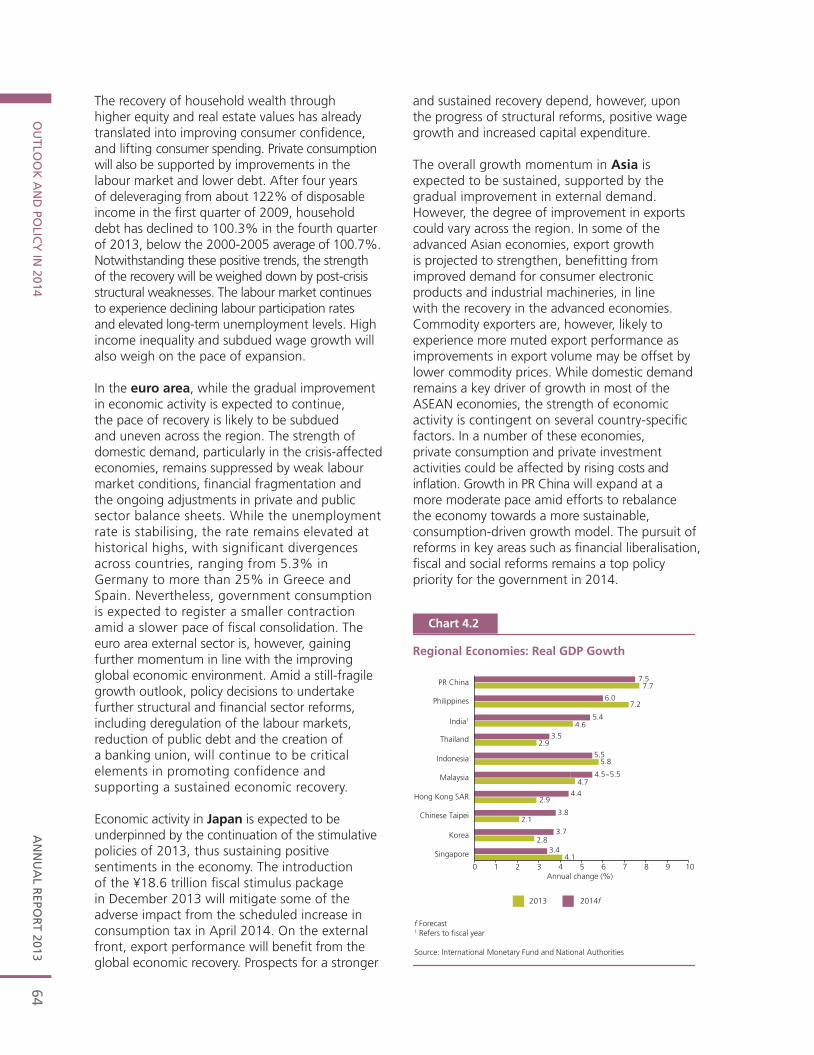
AN
NU
AL R
EPOR
T 2013O
UTLO
OK
AN
D PO
LICY
IN 2014
64
The recovery of household wealth through higher equity and real estate values has already translated into improving consumer confidence, and lifting consumer spending. Private consumption will also be supported by improvements in the labour market and lower debt. After four years of deleveraging from about 122% of disposable income in the first quarter of 2009, household debt has declined to 100.3% in the fourth quarter of 2013, below the 2000-2005 average of 100.7%. Notwithstanding these positive trends, the strength of the recovery will be weighed down by post-crisis structural weaknesses. The labour market continues to experience declining labour participation rates and elevated long-term unemployment levels. High income inequality and subdued wage growth will also weigh on the pace of expansion.
In the euro area, while the gradual improvement in economic activity is expected to continue, the pace of recovery is likely to be subdued and uneven across the region. The strength of domestic demand, particularly in the crisis-affected economies, remains suppressed by weak labour market conditions, financial fragmentation and the ongoing adjustments in private and public sector balance sheets. While the unemployment rate is stabilising, the rate remains elevated at historical highs, with significant divergences across countries, ranging from 5.3% in Germany to more than 25% in Greece and Spain. Nevertheless, government consumption is expected to register a smaller contraction amid a slower pace of fiscal consolidation. The euro area external sector is, however, gaining further momentum in line with the improving global economic environment. Amid a still-fragile growth outlook, policy decisions to undertake further structural and financial sector reforms, including deregulation of the labour markets, reduction of public debt and the creation of a banking union, will continue to be critical elements in promoting confidence and supporting a sustained economic recovery.
Economic activity in Japan is expected to be underpinned by the continuation of the stimulative policies of 2013, thus sustaining positive sentiments in the economy. The introduction of the ¥18.6 trillion fiscal stimulus package in December 2013 will mitigate some of the adverse impact from the scheduled increase in consumption tax in April 2014. On the external front, export performance will benefit from the global economic recovery. Prospects for a stronger
and sustained recovery depend, however, upon the progress of structural reforms, positive wage growth and increased capital expenditure.
The overall growth momentum in Asia is expected to be sustained, supported by the gradual improvement in external demand. However, the degree of improvement in exports could vary across the region. In some of the advanced Asian economies, export growth is projected to strengthen, benefitting from improved demand for consumer electronic products and industrial machineries, in line with the recovery in the advanced economies. Commodity exporters are, however, likely to experience more muted export performance as improvements in export volume may be offset by lower commodity prices. While domestic demand remains a key driver of growth in most of the ASEAN economies, the strength of economic activity is contingent on several country-specific factors. In a number of these economies, private consumption and private investment activities could be affected by rising costs and inflation. Growth in PR China will expand at a more moderate pace amid efforts to rebalance the economy towards a more sustainable, consumption-driven growth model. The pursuit of reforms in key areas such as financial liberalisation, fiscal and social reforms remains a top policy priority for the government in 2014.
Chart 4.2
Regional Economies: Real GDP Gowth
f Forecast1 Refers to fiscal year
Source: International Monetary Fund and National Authorities
4.1
2.8
2.1
2.9
4.7
5.8
2.9
4.6
7.2
7.7
3.4
3.7
3.8
4.4
4.5~5.5
3.5
5.5
5.4
6.0
7.5
0 1 2 3 4 5 6 7 8 9 10
Singapore
Korea
Chinese Taipei
Hong Kong SAR
Malaysia
Indonesia
Thailand
India1
Philippines
PR China
Annual change (%)
2013 2014f
AN
NU
AL
REP
OR
T 20
13O
UTL
OO
K A
ND
PO
LIC
Y IN
201
465
Global inflation is expected to be moderate, in line with lower price pressures in the commodity markets following improved supply conditions. The increase of energy production in the US and the expected easing of geopolitical risks in the Middle East would reduce supply constraints of crude oil, thus exerting downward pressure on prices. Similarly, food prices are expected to fall on account of increased crop production. The inflation outlook is, however, expected to vary between the advanced and emerging economies. In most of the advanced economies, persistent negative output gaps and slow wage growth will limit price increases. In contrast, some Asian economies are projected to experience higher cost-push inflation in an environment of tightening labour market conditions.
Notwithstanding the improved outlook, the global economy continues to face downside risks. A key concern is the continued economic slack in the advanced economies despite the recent improvement in growth. Unemployment rates remain elevated relative to pre-crisis levels in many advanced economies while spare capacity continues to be sizeable in several economies, reducing the prospect of higher investment growth. Amid low inflation, prolonged weak growth may expose some economies to the risk of deflation. Fiscal uncertainties also continued to linger, particularly in the advanced economies. In the US, there still remain fiscal challenges, such as a more permanent solution to the debt-ceiling limit and structural deficits arising from higher mandatory expenditures. In the euro area, while fiscal austerity has resulted in a narrowing of budget deficits, these measures have adversely affected private sector activity and hence, overall growth. Furthermore, public debt remains high, limiting the room for policy support to the economy.
Amid these global developments, the emerging economies face a relatively different set of domestic risks. Financial imbalances have been a key concern following the strong increase in credit and asset prices. This has led to high household debt levels in many emerging economies, including those in Asia. In PR China, financial risks arise from the rapid growth in shadow banking activity, a growing source of financing for property and infrastructure investments. A few emerging economies are
also experiencing twin deficits. In particular, current account positions turned into deficits in some countries as a weak recovery in external demand was accompanied by strong domestic growth that boosted imports. A rising trend in public debt levels, coupled with fiscal deficits, was observed in several of these economies in large part due to the result of fiscal stimulus implemented during the global recession in 2008-2009. Furthermore, some emerging economies also face structural challenges such as supply bottlenecks, rising income inequality and over-reliance on the traditional sources of growth.
Given the improving growth outlook in the advanced economies, the gradual normalisation of monetary policy will be inevitable, as evidenced by the recent scale-back of quantitative easing (QE) in the US. The unprecedented scale of QE undertaken since 2009 suggests that the reversal is likely to reverberate across the global financial markets and pose a significant challenge to policymakers. Against the backdrop of heightened volatility in global portfolio flows, concerns over domestic factors in the emerging economies could exacerbate negative investor sentiments and lead to a disorderly reversal of capital flows. This, in turn, raises the risk of disruptions to credit intermediation and disproportionate corrections in asset prices. While there appears to be increasing country differentiation based on the assessment of strengths and weaknesses of each economy, contagion risks have risen. The increasing inter-linkages in the global financial system have led to a swift transmission of financial shocks across markets, regions and asset classes, in particular during the period of a simultaneous rise in risk aversion which could trigger herd behaviour. However, it is noteworthy that while global policy spillovers will pose significant challenges to the region, many Asian economies continue to exhibit resilience, underpinned by strong fundamentals following the decade of reforms after the Asian Financial Crisis. The more flexible exchange rates, higher foreign exchange reserves and more developed financial systems have significantly improved Asia’s resilience to withstand external shocks and preserve macroeconomic and financial stability (More discussion on this can be found in the box article `Spillovers of Quantitative Easing on Asia´ in Chapter 2).
AN
NU
AL R
EPOR
T 2013O
UTLO
OK
AN
D PO
LICY
IN 2014
66
THE MALAYSIAN ECONOMY
OverviewThe Malaysian economy is expected to remain on a steady growth path in 2014, expanding by 4.5%-5.5% (2013: 4.7%). The growth momentum will be supported by better performance in the external sector amid some moderation in domestic demand.
The Malaysian economy is expected to remain on a steady growth trajectory of 4.5%-5.5% in 2014
Domestic demand will remain the key driver of growth, albeit at a more moderate pace, reflecting the continued public sector consolidation. Private investment is forecast to register robust growth for the fifth consecutive year, driven by the ongoing implementation of multi-year projects and the improvement in external demand. Private consumption will be underpinned by healthy labour market conditions and sustained income growth. Nonetheless, household spending is expected to moderate towards its long-term trend growth, reflecting in part the impact of the higher inflation. Public consumption is anticipated to record lower growth, following the ongoing consolidation of the Government’s fiscal position, while public investment is projected to register a higher growth, supported by both Government and public enterprise capital spending.
In line with the improvement in external demand, Malaysia’s export performance across most product categories is expected to pick up in 2014. Electronics and electrical (E&E) exports will benefit from higher demand from the advanced economies while exports of non-E&E will be sustained by regional demand for resource-based products. Gross export performance is expected to be further supported by a small positive growth in commodity exports following two consecutive years of contraction. Services exports is expected to be higher due to the stronger travel account, which will be supported by Visit Malaysia Year 2014. At the same time, gross imports is projected to increase at a faster pace, driven mainly by higher intermediate imports. With import growth remaining robust, the current account surplus of
the balance of payments is projected to narrow in 2014. Nevertheless, as exports improve, net exports of goods and services is expected to exert a lower negative contribution to real growth in 2014.
Headline inflation is expected to average 3%-4% in 2014 (2013: 2.1%) due mainly to domestic cost factors. These include the recent price adjustments arising from subsidy rationalisation and the spillover effects of these adjustments on the prices of other goods and services. The higher cost pressures, however, will be partly contained by subdued external price pressures, given the expectations of lower global food and energy prices. Continued expansion in domestic capacity and a moderation in domestic demand would also contribute towards attenuating the cost pressures.
Notwithstanding the moderation in domestic demand, the underlying fundamentals of the Malaysian economy remain strong. Growth will be driven by the private sector across a diversified range of economic activities. Of importance, employment remains strong and incomes are rising. The financial system is resilient, with financial intermediation expected to provide continued support to investment and consumption activity. In addition, the strength of Malaysia’s external position remains intact, with international reserves at healthy levels and external debt within prudent limits.
While the central outlook for the Malaysian economy assumes a gradual improvement in external demand, downside risks to global growth remain. These downside risks could affect the performance of the Malaysian economy in 2014. In the advanced economies, excess capacity in the labour and product markets remains, while fiscal uncertainties may affect the pace of recovery. Emerging economies may also experience slower-than-expected domestic demand amid policy measures to address domestic risks arising from high growth in credit and asset prices. As in 2013, volatility in global financial markets could contribute to the potential re-emergence of large and volatile capital flows. It should be noted that past experience has demonstrated Malaysia’s ability to withstand volatile capital flows. For example, following intense deleveraging at the height of the crisis in the advanced economies, Malaysia experienced capital reversals by non-residents amounting to RM113.4 billion between second quarter 2008 and second quarter 2009, without disruptions
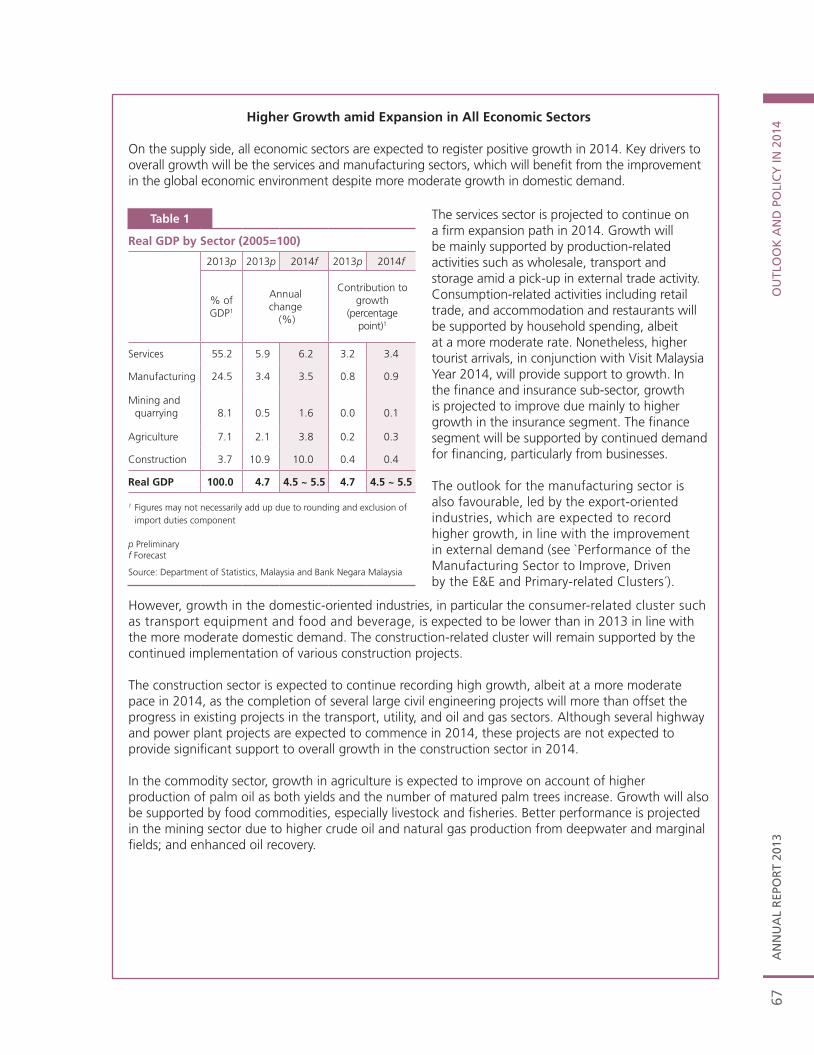
AN
NU
AL
REP
OR
T 20
13O
UTL
OO
K A
ND
PO
LIC
Y IN
201
467
1
Table 1
Real GDP by Sector (2005=100)
2013p 2013p 2014f 2013p 2014f
% ofGDP1
Annualchange
(%)
Contribution to growth
(percentagepoint)1
Services 55.2 5.9 6.2 3.2 3.4
Manufacturing 24.5 3.4 3.5 0.8 0.9
Mining and quarrying 8.1 0.5 1.6 0.0 0.1
Agriculture 7.1 2.1 3.8 0.2 0.3
Construction 3.7 10.9 10.0 0.4 0.4
Real GDP 100.0 4.7 4.5 ~ 5.5 4.7 4.5 ~ 5.5
1 Figures may not necessarily add up due to rounding and exclusion of import duties component
p Preliminary f Forecast
Source: Department of Statistics, Malaysia and Bank Negara Malaysia
Higher Growth amid Expansion in All Economic Sectors
On the supply side, all economic sectors are expected to register positive growth in 2014. Key drivers to overall growth will be the services and manufacturing sectors, which will benefit from the improvement in the global economic environment despite more moderate growth in domestic demand.
The services sector is projected to continue on a firm expansion path in 2014. Growth will be mainly supported by production-related activities such as wholesale, transport and storage amid a pick-up in external trade activity. Consumption-related activities including retail trade, and accommodation and restaurants will be supported by household spending, albeit at a more moderate rate. Nonetheless, higher tourist arrivals, in conjunction with Visit Malaysia Year 2014, will provide support to growth. In the finance and insurance sub-sector, growth is projected to improve due mainly to higher growth in the insurance segment. The finance segment will be supported by continued demand for financing, particularly from businesses.
The outlook for the manufacturing sector is also favourable, led by the export-oriented industries, which are expected to record higher growth, in line with the improvement in external demand (see `Performance of the Manufacturing Sector to Improve, Driven by the E&E and Primary-related Clusters´).
However, growth in the domestic-oriented industries, in particular the consumer-related cluster such as transport equipment and food and beverage, is expected to be lower than in 2013 in line with the more moderate domestic demand. The construction-related cluster will remain supported by the continued implementation of various construction projects.
The construction sector is expected to continue recording high growth, albeit at a more moderate pace in 2014, as the completion of several large civil engineering projects will more than offset the progress in existing projects in the transport, utility, and oil and gas sectors. Although several highway and power plant projects are expected to commence in 2014, these projects are not expected to provide significant support to overall growth in the construction sector in 2014.
In the commodity sector, growth in agriculture is expected to improve on account of higher production of palm oil as both yields and the number of matured palm trees increase. Growth will also be supported by food commodities, especially livestock and fisheries. Better performance is projected in the mining sector due to higher crude oil and natural gas production from deepwater and marginal fields; and enhanced oil recovery.
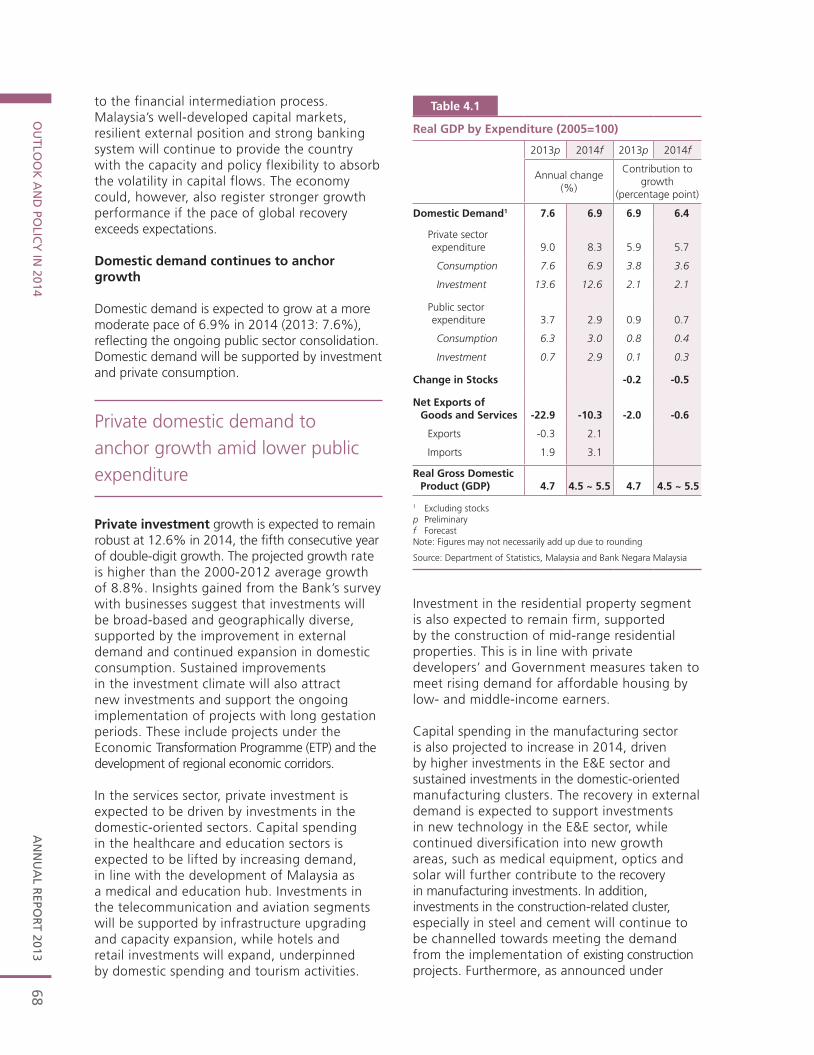
AN
NU
AL R
EPOR
T 2013O
UTLO
OK
AN
D PO
LICY
IN 2014
68
to the financial intermediation process. Malaysia’s well-developed capital markets, resilient external position and strong banking system will continue to provide the country with the capacity and policy flexibility to absorb the volatility in capital flows. The economy could, however, also register stronger growth performance if the pace of global recovery exceeds expectations.
Domestic demand continues to anchor growth
Domestic demand is expected to grow at a more moderate pace of 6.9% in 2014 (2013: 7.6%), reflecting the ongoing public sector consolidation. Domestic demand will be supported by investment and private consumption.
Private domestic demand to anchor growth amid lower public expenditure
Private investment growth is expected to remain robust at 12.6% in 2014, the fifth consecutive year of double-digit growth. The projected growth rate is higher than the 2000-2012 average growth of 8.8%. Insights gained from the Bank’s survey with businesses suggest that investments will be broad-based and geographically diverse, supported by the improvement in external demand and continued expansion in domestic consumption. Sustained improvements in the investment climate will also attract new investments and support the ongoing implementation of projects with long gestation periods. These include projects under the Economic Transformation Programme (ETP) and the development of regional economic corridors.
In the services sector, private investment is expected to be driven by investments in the domestic-oriented sectors. Capital spending in the healthcare and education sectors is expected to be lifted by increasing demand, in line with the development of Malaysia as a medical and education hub. Investments in the telecommunication and aviation segments will be supported by infrastructure upgrading and capacity expansion, while hotels and retail investments will expand, underpinned by domestic spending and tourism activities.
Investment in the residential property segment is also expected to remain firm, supported by the construction of mid-range residential properties. This is in line with private developers’ and Government measures taken to meet rising demand for affordable housing by low- and middle-income earners.
Capital spending in the manufacturing sector is also projected to increase in 2014, driven by higher investments in the E&E sector and sustained investments in the domestic-oriented manufacturing clusters. The recovery in external demand is expected to support investments in new technology in the E&E sector, while continued diversification into new growth areas, such as medical equipment, optics and solar will further contribute to the recovery in manufacturing investments. In addition, investments in the construction-related cluster, especially in steel and cement will continue to be channelled towards meeting the demand from the implementation of existing construction projects. Furthermore, as announced under
1
Real GDP by Expenditure (2005=100)
2013p 2014f 2013p 2014f
Annual change (%)
Contribution to growth
(percentage point)
Domestic Demand1 7.6 6.9 6.9 6.4
Private sector expenditure 9.0 8.3 5.9 5.7
Consumption 7.6 6.9 3.8 3.6
Investment 13.6 12.6 2.1 2.1
Public sector expenditure 3.7 2.9 0.9 0.7
Consumption 6.3 3.0 0.8 0.4
Investment 0.7 2.9 0.1 0.3
Change in Stocks -0.2 -0.5
Net Exports of Goods and Services -22.9 -10.3 -2.0 -0.6
Exports -0.3 2.1
Imports 1.9 3.1
Real Gross DomesticProduct (GDP) 4.7 4.5 ~ 5.5 4.7 4.5 ~ 5.5
1 Excluding stocksp Preliminaryf ForecastNote: Figures may not necessarily add up due to rounding
Source: Department of Statistics, Malaysia and Bank Negara Malaysia
Table 4.1
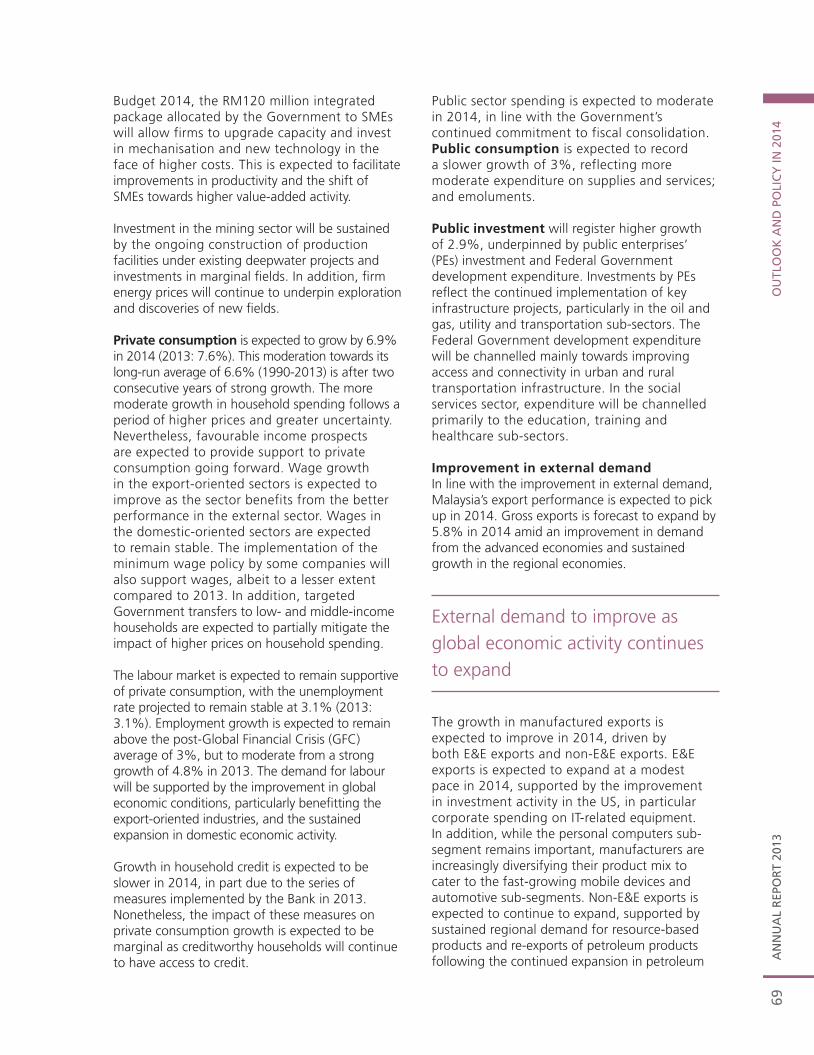
AN
NU
AL
REP
OR
T 20
13O
UTL
OO
K A
ND
PO
LIC
Y IN
201
469
Budget 2014, the RM120 million integrated package allocated by the Government to SMEs will allow firms to upgrade capacity and invest in mechanisation and new technology in the face of higher costs. This is expected to facilitate improvements in productivity and the shift of SMEs towards higher value-added activity.
Investment in the mining sector will be sustained by the ongoing construction of production facilities under existing deepwater projects and investments in marginal fields. In addition, firm energy prices will continue to underpin exploration and discoveries of new fields.
Private consumption is expected to grow by 6.9% in 2014 (2013: 7.6%). This moderation towards its long-run average of 6.6% (1990-2013) is after two consecutive years of strong growth. The more moderate growth in household spending follows a period of higher prices and greater uncertainty. Nevertheless, favourable income prospects are expected to provide support to private consumption going forward. Wage growth in the export-oriented sectors is expected to improve as the sector benefits from the better performance in the external sector. Wages in the domestic-oriented sectors are expected to remain stable. The implementation of the minimum wage policy by some companies will also support wages, albeit to a lesser extent compared to 2013. In addition, targeted Government transfers to low- and middle-income households are expected to partially mitigate the impact of higher prices on household spending.
The labour market is expected to remain supportive of private consumption, with the unemployment rate projected to remain stable at 3.1% (2013: 3.1%). Employment growth is expected to remain above the post-Global Financial Crisis (GFC) average of 3%, but to moderate from a strong growth of 4.8% in 2013. The demand for labour will be supported by the improvement in global economic conditions, particularly benefitting the export-oriented industries, and the sustained expansion in domestic economic activity.
Growth in household credit is expected to be slower in 2014, in part due to the series of measures implemented by the Bank in 2013. Nonetheless, the impact of these measures on private consumption growth is expected to be marginal as creditworthy households will continue to have access to credit.
Public sector spending is expected to moderate in 2014, in line with the Government’s continued commitment to fiscal consolidation. Public consumption is expected to record a slower growth of 3%, reflecting more moderate expenditure on supplies and services; and emoluments.
Public investment will register higher growth of 2.9%, underpinned by public enterprises’ (PEs) investment and Federal Government development expenditure. Investments by PEs reflect the continued implementation of key infrastructure projects, particularly in the oil and gas, utility and transportation sub-sectors. The Federal Government development expenditure will be channelled mainly towards improving access and connectivity in urban and rural transportation infrastructure. In the social services sector, expenditure will be channelled primarily to the education, training and healthcare sub-sectors.
Improvement in external demandIn line with the improvement in external demand, Malaysia’s export performance is expected to pick up in 2014. Gross exports is forecast to expand by 5.8% in 2014 amid an improvement in demand from the advanced economies and sustained growth in the regional economies.
External demand to improve as global economic activity continues to expand
The growth in manufactured exports is expected to improve in 2014, driven by both E&E exports and non-E&E exports. E&E exports is expected to expand at a modest pace in 2014, supported by the improvement in investment activity in the US, in particular corporate spending on IT-related equipment. In addition, while the personal computers sub-segment remains important, manufacturers are increasingly diversifying their product mix to cater to the fast-growing mobile devices and automotive sub-segments. Non-E&E exports is expected to continue to expand, supported by sustained regional demand for resource-based products and re-exports of petroleum products following the continued expansion in petroleum
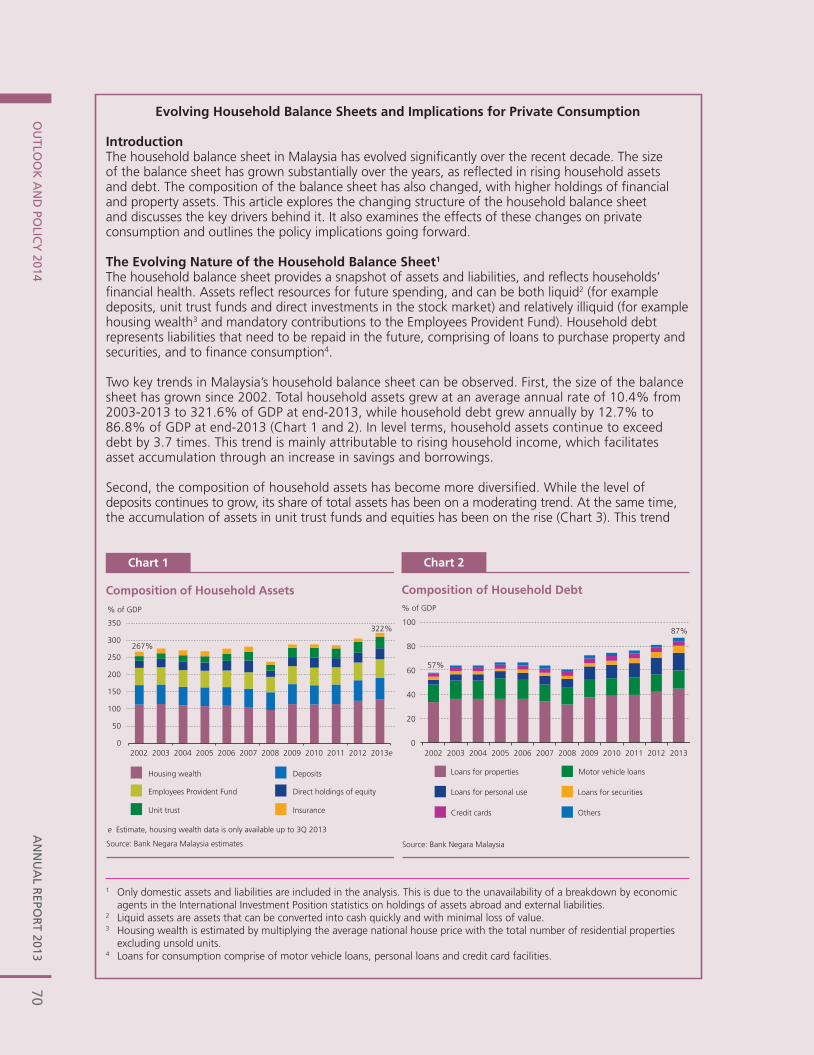
70A
NN
UA
L REPO
RT 2013
OU
TLOO
K A
ND
POLIC
Y 2014
2A
NN
UA
L REPO
RT 2013
OU
TLOO
K A
ND
POLIC
Y IN
2014
Evolving Household Balance Sheets and Implications for Private Consumption
Introduction The household balance sheet in Malaysia has evolved signifi cantly over the recent decade. The size of the balance sheet has grown substantially over the years, as refl ected in rising household assets and debt. The composition of the balance sheet has also changed, with higher holdings of fi nancial and property assets. This article explores the changing structure of the household balance sheet and discusses the key drivers behind it. It also examines the effects of these changes on private consumption and outlines the policy implications going forward.
The Evolving Nature of the Household Balance Sheet1
The household balance sheet provides a snapshot of assets and liabilities, and refl ects households’ fi nancial health. Assets refl ect resources for future spending, and can be both liquid2 (for example deposits, unit trust funds and direct investments in the stock market) and relatively illiquid (for example housing wealth3 and mandatory contributions to the Employees Provident Fund). Household debt represents liabilities that need to be repaid in the future, comprising of loans to purchase property and securities, and to fi nance consumption4. Two key trends in Malaysia’s household balance sheet can be observed. First, the size of the balance sheet has grown since 2002. Total household assets grew at an average annual rate of 10.4% from 2003-2013 to 321.6% of GDP at end-2013, while household debt grew annually by 12.7% to 86.8% of GDP at end-2013 (Chart 1 and 2). In level terms, household assets continue to exceed debt by 3.7 times. This trend is mainly attributable to rising household income, which facilitates asset accumulation through an increase in savings and borrowings.
Second, the composition of household assets has become more diversifi ed. While the level of deposits continues to grow, its share of total assets has been on a moderating trend. At the same time, the accumulation of assets in unit trust funds and equities has been on the rise (Chart 3). This trend
1 Only domestic assets and liabilities are included in the analysis. This is due to the unavailability of a breakdown by economic agents in the International Investment Position statistics on holdings of assets abroad and external liabilities.
2 Liquid assets are assets that can be converted into cash quickly and with minimal loss of value.3 Housing wealth is estimated by multiplying the average national house price with the total number of residential properties
excluding unsold units.4 Loans for consumption comprise of motor vehicle loans, personal loans and credit card facilities.
Source: Bank Negara Malaysia estimates
e Estimate, housing wealth data is only available up to 3Q 2013
Chart 1
Composition of Household Assets
Housing wealth Deposits
Employees Provident Fund Direct holdings of equity
Unit trust Insurance
% of GDP
322%
0
50
100
150
200
250
300
350
2002 2003 2004 2005 2006 2007 2008 2009 2010 2011 2012 2013e
267%
Composition of Household Debt
Chart 2
Loans for properties Motor vehicle loans
Loans for personal use Loans for securities
Credit cards Others
% of GDP
0
20
40
60
80
100
2002 2003 2004 2005 2006 2007 2008 2009 2010 2011 2012 2013
57%
87%
Source: Bank Negara Malaysia
3A
NN
UA
L R
EPO
RT
2013
OU
TLO
OK
AN
D P
OLI
CY
IN 2
014
not only refl ects more developed domestic fi nancial markets offering a wider range of products and services, but is also attributable to households’ growing fi nancial sophistication and improving awareness of alternative savings instruments. Housing wealth, meanwhile, continues to be the largest component of household assets5. From a distributional perspective, much of this wealth accumulation can be accounted for by higher-income households who are able to save a larger proportion of their income. Chart 4 illustrates the distribution of households by income groups and proxies of asset ownership based on fl ow data across income brackets6. Relative to lower-income households, those with monthly income above RM5,000 (accounts for a share of 33.7% of total households) assume a larger share of spending that is channelled to the accumulation of fi nancial assets (65.8%) and earnings from rental income7 (60.1%).
The Implications for Private ConsumptionThe changing size and structure of the household balance sheet has important implications for private consumption. On the assets side, the accumulation of property and fi nancial assets has enabled Malaysian households to benefi t from the recent asset price increases, supporting private consumption. Conceptually, asset prices affect spending by asset-owning households through three main channels (Skudelny, 2009). First, households are able to sell their assets to fi nance spending. This channel is stronger for more liquid fi nancial assets, in which capital gains can be realised more quickly. Second, when assets serve as retirement savings, an appreciation in the value of these assets reduces the perceived need to save at present to fi nance future spending. Finally, assets can serve as collateral, enabling households to borrow against the value of the asset. While the three channels benefi t asset owners, higher asset prices, particularly for property, increases the need for debt accumulation among house buyers. This reduces the disposable income of these households going forward, which may partially offset the positive wealth effect on private consumption.
On the liabilities side, borrowings to fi nance consumption have allowed households to adjust their spending patterns. Households with access to credit can borrow to facilitate purchases of durable goods as well as
5 For household liabilities, loans for the purchase of properties remain the largest component. Personal loans accounted for an increasing share since 2002, although its growth moderated in 2013. Refer to the Financial Stability and Payment Systems Report 2013 for a detailed analysis of household liabilities.
6 Statistics on stocks of household assets by income groups are not available.7 Rental income, however, constitutes only a small fraction of total income for all income brackets.
Chart 3
Total Household Assets by Components
Unit trust and equityHousing wealth
Employees Provident FundDeposits Insurance
1320
21 19
0
10
20
30
40
50
60
70
80
90
100
2002 2003 2004 2005 2006 2007 2008 2009 2010 2011 2012 2013e
% of total assets
Source: Bank Negara Malaysia estimates
e Estimate, housing wealth data is only available up to 3Q 2013
Income from Rent and Expenditure on the Accumulation of Financial Assets Across Income Brackets
Chart 4
0
20
40
60
80
100
Households by income groups
Income from rent
Expenditure on financial assets
Share, %
< RM 3K RM 3-5K RM 5-10K > RM 10K
Source: Household Expenditure Survey 2009/10 and Household Income Survey 2012, Department of Statistics, Malaysia
Income brackets

71A
NN
UA
L R
EPO
RT
2013
OU
TLO
OK
AN
D P
OLI
CY
201
4
2A
NN
UA
L REPO
RT 2013
OU
TLOO
K A
ND
POLIC
Y IN
2014
Evolving Household Balance Sheets and Implications for Private Consumption
Introduction The household balance sheet in Malaysia has evolved signifi cantly over the recent decade. The size of the balance sheet has grown substantially over the years, as refl ected in rising household assets and debt. The composition of the balance sheet has also changed, with higher holdings of fi nancial and property assets. This article explores the changing structure of the household balance sheet and discusses the key drivers behind it. It also examines the effects of these changes on private consumption and outlines the policy implications going forward.
The Evolving Nature of the Household Balance Sheet1
The household balance sheet provides a snapshot of assets and liabilities, and refl ects households’ fi nancial health. Assets refl ect resources for future spending, and can be both liquid2 (for example deposits, unit trust funds and direct investments in the stock market) and relatively illiquid (for example housing wealth3 and mandatory contributions to the Employees Provident Fund). Household debt represents liabilities that need to be repaid in the future, comprising of loans to purchase property and securities, and to fi nance consumption4. Two key trends in Malaysia’s household balance sheet can be observed. First, the size of the balance sheet has grown since 2002. Total household assets grew at an average annual rate of 10.4% from 2003-2013 to 321.6% of GDP at end-2013, while household debt grew annually by 12.7% to 86.8% of GDP at end-2013 (Chart 1 and 2). In level terms, household assets continue to exceed debt by 3.7 times. This trend is mainly attributable to rising household income, which facilitates asset accumulation through an increase in savings and borrowings.
Second, the composition of household assets has become more diversifi ed. While the level of deposits continues to grow, its share of total assets has been on a moderating trend. At the same time, the accumulation of assets in unit trust funds and equities has been on the rise (Chart 3). This trend
1 Only domestic assets and liabilities are included in the analysis. This is due to the unavailability of a breakdown by economic agents in the International Investment Position statistics on holdings of assets abroad and external liabilities.
2 Liquid assets are assets that can be converted into cash quickly and with minimal loss of value.3 Housing wealth is estimated by multiplying the average national house price with the total number of residential properties
excluding unsold units.4 Loans for consumption comprise of motor vehicle loans, personal loans and credit card facilities.
Source: Bank Negara Malaysia estimates
e Estimate, housing wealth data is only available up to 3Q 2013
Chart 1
Composition of Household Assets
Housing wealth Deposits
Employees Provident Fund Direct holdings of equity
Unit trust Insurance
% of GDP
322%
0
50
100
150
200
250
300
350
2002 2003 2004 2005 2006 2007 2008 2009 2010 2011 2012 2013e
267%
Composition of Household Debt
Chart 2
Loans for properties Motor vehicle loans
Loans for personal use Loans for securities
Credit cards Others
% of GDP
0
20
40
60
80
100
2002 2003 2004 2005 2006 2007 2008 2009 2010 2011 2012 2013
57%
87%
Source: Bank Negara Malaysia
3A
NN
UA
L R
EPO
RT
2013
OU
TLO
OK
AN
D P
OLI
CY
IN 2
014
not only refl ects more developed domestic fi nancial markets offering a wider range of products and services, but is also attributable to households’ growing fi nancial sophistication and improving awareness of alternative savings instruments. Housing wealth, meanwhile, continues to be the largest component of household assets5. From a distributional perspective, much of this wealth accumulation can be accounted for by higher-income households who are able to save a larger proportion of their income. Chart 4 illustrates the distribution of households by income groups and proxies of asset ownership based on fl ow data across income brackets6. Relative to lower-income households, those with monthly income above RM5,000 (accounts for a share of 33.7% of total households) assume a larger share of spending that is channelled to the accumulation of fi nancial assets (65.8%) and earnings from rental income7 (60.1%).
The Implications for Private ConsumptionThe changing size and structure of the household balance sheet has important implications for private consumption. On the assets side, the accumulation of property and fi nancial assets has enabled Malaysian households to benefi t from the recent asset price increases, supporting private consumption. Conceptually, asset prices affect spending by asset-owning households through three main channels (Skudelny, 2009). First, households are able to sell their assets to fi nance spending. This channel is stronger for more liquid fi nancial assets, in which capital gains can be realised more quickly. Second, when assets serve as retirement savings, an appreciation in the value of these assets reduces the perceived need to save at present to fi nance future spending. Finally, assets can serve as collateral, enabling households to borrow against the value of the asset. While the three channels benefi t asset owners, higher asset prices, particularly for property, increases the need for debt accumulation among house buyers. This reduces the disposable income of these households going forward, which may partially offset the positive wealth effect on private consumption.
On the liabilities side, borrowings to fi nance consumption have allowed households to adjust their spending patterns. Households with access to credit can borrow to facilitate purchases of durable goods as well as
5 For household liabilities, loans for the purchase of properties remain the largest component. Personal loans accounted for an increasing share since 2002, although its growth moderated in 2013. Refer to the Financial Stability and Payment Systems Report 2013 for a detailed analysis of household liabilities.
6 Statistics on stocks of household assets by income groups are not available.7 Rental income, however, constitutes only a small fraction of total income for all income brackets.
Chart 3
Total Household Assets by Components
Unit trust and equityHousing wealth
Employees Provident FundDeposits Insurance
1320
21 19
0
10
20
30
40
50
60
70
80
90
100
2002 2003 2004 2005 2006 2007 2008 2009 2010 2011 2012 2013e
% of total assets
Source: Bank Negara Malaysia estimates
e Estimate, housing wealth data is only available up to 3Q 2013
Income from Rent and Expenditure on the Accumulation of Financial Assets Across Income Brackets
Chart 4
0
20
40
60
80
100
Households by income groups
Income from rent
Expenditure on financial assets
Share, %
< RM 3K RM 3-5K RM 5-10K > RM 10K
Source: Household Expenditure Survey 2009/10 and Household Income Survey 2012, Department of Statistics, Malaysia
Income brackets

72A
NN
UA
L REPO
RT 2013
OU
TLOO
K A
ND
POLIC
Y 2014
4A
NN
UA
L REPO
RT 2013
OU
TLOO
K A
ND
POLIC
Y IN
2014
to support consumption during times of lower income. Nonetheless, a portion of income must be devoted to the repayment of debt going forward. Consumption is not increased permanently but rather brought forward, hence limiting future increases in consumption. The sustainability of private consumption thus requires that households’ future repayment capacities are in line with their debt obligations.
To understand the role of these channels for private consumption, an aggregate consumption function for the Malaysian economy was estimated8. The determinants considered are income, housing wealth, fi nancial wealth9, consumption credit disbursements and repayments. The contribution of each determinant to private consumption is quantifi ed and illustrated in Chart 5.
The fi ndings show that income is the most important driver of private consumption, accounting for an average of 67.4% of private consumption growth during the period. This result refl ects the fact that private consumption has been consistently supported by stable labour market conditions and sustained income growth. Since 2005, housing and fi nancial wealth have been supportive of private consumption, accounting for 14.5% and 13.7% of private consumption growth, respectively. The contributions have increased in the post-global fi nancial crisis period. Consumption credit disbursements, while on average playing a small role, contributed signifi cantly to private consumption during certain periods10. This refl ects the fact that consumption credit cannot permanently increase spending, but rather helps households redistribute consumption over time or purchase durable goods11.
The econometric fi ndings relate to aggregate private consumption. Across income groups, the determinants of private consumption are likely to differ. Income likely contributes a larger share to private consumption growth for lower-income households, given that they have higher marginal propensities to consume
8 An error correction model (ECM) was used. Housing and fi nancial wealth are estimated as the value of wealth net of the outstanding value of loans used to purchase them (e.g. fi nancial wealth minus loans outstanding for the purchase of securities).
9 Financial wealth refers to household holdings of unit trust funds. Direct holdings of equities are excluded due to the unavailability of reliable quarterly data.
10 For example, between 2Q and 4Q 2009, consumption credit disbursements contributed an average of 0.6ppt. to overall private consumption growth of 1.0%. This coincided with the reductions in the Overnight Policy Rate by the Bank to support the economic recovery during this period.
11 Loan repayments do not have a signifi cant impact on private consumption in this model. This likely refl ects the fact that there have been no episodes of widespread deleveraging on household balance sheets in the sample period. Repayments are expected to adversely affect consumption during such a deleveraging episode. For example, Dynan (2012) found that highly-leveraged homeowners in the United States experienced larger falls in consumption between 2007 and 2009, after accounting for the wealth effects of lower house prices.
1
Table 1
Average Contribution of the Determinants of Private Consumption Growth (2005-2Q 2013)
Determinant Contribution (%)
Disposable income 67.4
Housing wealth 14.5
Financial wealth 13.7
Consumption credit disbursements 0.3
Consumption credit repayments -0.2
Others 4.3
Source: Bank Negara Malaysia estimates
Drivers of Private Consumption Growth
Chart 5
-5
0
5
10
15
1Q'05
3Q 1Q'06
3Q 1Q'07
3Q 1Q'08
3Q 1Q'09
3Q 1Q'10
3Q 1Q'11
3Q 1Q'12
3Q 1Q'13
Disposable Income Housing Wealth Financial Wealth
Consumption Credit Disbursements
Consumption Credit Repayments
Others
Private Consumption
Contribution, ppt
Source: Bank Negara Malaysia estimates
73A
NN
UA
L R
EPO
RT
2013
OU
TLO
OK
AN
D P
OLI
CY
201
45
AN
NU
AL
REP
OR
T 20
13O
UTL
OO
K A
ND
PO
LIC
Y IN
201
4
(Murugasu, Ang and Tng, 2013). Improving the distribution of household income is thus likely to support overall private consumption. Meanwhile, wealth effects are probably larger for high-income households as they tend to hold more housing and fi nancial assets.
Policy ImplicationsThe fi ndings suggest that balance sheet developments have become an increasingly important consideration for policy analysis for two key reasons. First, asset price movements have an important effect on household spending. For example, a reversal of the asset price gains in recent years is likely to reduce wealth, which may cause households to scale back on their spending. Thus, policy would need to focus on the sustainability of asset prices and the spillovers to the economy. This effect is, however, partially mitigated by the fact that a larger proportion of housing and fi nancial wealth is held by higher-income households with larger savings buffers. Households with monthly income above RM5,000 save approximately a fi fth of their income and are better able to support their consumption amid adverse asset price movements. Nonetheless, ensuring that asset prices are refl ective of economic fundamentals remains a policy priority, given the potentially signifi cant adverse implications of sharp corrections in asset prices for macroeconomic and fi nancial stability.
Second, changes in household income may now pose signifi cant implications for the real economy and fi nancial stability. It not only affects households’ ability to consume in a given period, but also to service their debt obligations. For example, if an income earner of an indebted household becomes unemployed, the household may be forced to further cut back on spending to manage debt repayments or face default. These concerns are, however, partially alleviated by holdings of assets. Liquid fi nancial assets of households are 1.6 times outstanding debt, suffi cient to cover their liabilities in the event of income shocks. In addition, 52% of the household debt is utilised for property purchases, and hence, is backed by physical assets. From a distributional perspective, however, the Bank continues to closely monitor lending to lower-income households. Households earning below RM3,000 a month have higher leverage positions than those in other income groups and hence are more susceptible to income shocks. The policy imperative, therefore, is to continue to ensure that households only borrow within their means.
Taking all these into consideration, the Government and the Bank have undertaken pre-emptive policies to prevent household balance sheets from becoming a source of systemic risk. In the 2014 Budget, the Government raised the real property gains tax (RPGT) and the minimum price of properties that can be purchased by foreigners. These measures are aimed at curbing speculation and ensuring that property prices grow in line with fundamentals. The Bank has also introduced macroprudential measures in stages since 2010, to prevent excessive household indebtedness and to ensure responsible lending practices. These measures are part of a broader trend of more active use of macroprudential policies to manage risks related to fi nancial imbalances and excessive leverage. PR China, Chinese Taipei, Hong Kong SAR, Singapore and Indonesia have introduced macroprudential measures to manage either property prices or mitigate unsustainable increases in household indebtedness.
ConclusionThe household balance sheet has evolved over the recent decade. It has grown in size, both in terms of assets and debt, and has become more diversifi ed. These developments have helped to support private consumption in recent years. Going forward, the household balance sheet will continue to evolve and have implications on household welfare, private consumption and economic growth. Nonetheless, it is recognised that over-leveraging which is not commensurate with income will make households more vulnerable to adverse shocks, and subsequently, pose a risk to household spending and sustainable growth. Therefore, there is a need to continuously evaluate fi nancial developments and undertake pre-emptive action to mitigate the build-up of imbalances when appropriate.
References
Dynan, K. (2012), `Is a Household Debt Overhang Holding Back Consumption?´ Brookings Papers on Economic Activity, (Spring 2012), pp. 299-362.
Murugasu, D., Ang, J.W. & Tng, B.H. (2013), `The Marginal Propensity to Consume Across Household Income Groups´, Bank Negara Malaysia Working Paper Series, WP2/2013.

AN
NU
AL R
EPOR
T 2013O
UTLO
OK
AN
D PO
LICY
IN 2014
74
storage capacity (see `Re-export Activity Providing Growing Support to Malaysia’s Trade´).
Export performance will also be supported by a small positive growth in commodity exports following two consecutive years of contraction. The better performance of commodity exports will be underpinned by the improvement in global demand for commodities and a smaller decline in commodity prices. The smaller decline in prices is attributed to higher crude palm oil (CPO) price that will partially offset the lower prices of liquefied natural gas (LNG), crude oil and rubber.
Gross imports is projected to increase at a stronger pace of 8.9% in 2014. Intermediate imports, which form the bulk of Malaysia’s imports, is expected to rise in 2014 as manufacturers increase production to meet higher export orders. In addition, the continued expansion of domestic investment and consumption activity will continue to support the imports of capital and consumption goods, respectively.
In the services account, the projected smaller deficit will be supported by the increase in tourist arrivals and higher tourist spending in conjunction with Visit Malaysia Year 2014. Growth in imports, nonetheless, will be driven by continued payments for transportation and other services, in line with the expansion in trade and investment activity during the year.
In the income account, income from Malaysian companies abroad is expected to increase given the improving global economic outlook. Nevertheless, it is likely to be surpassed by
profits and dividends accrued to multinational corporations operating in Malaysia following the recovery in manufactured exports. Net outflows in the income account, therefore, is likely to be sustained in 2014.
Overall, with the gradual recovery in exports, net exports of goods and services will exert a lower negative contribution to real growth in 2014. Nevertheless, with import growth remaining robust, and exports registering a modest recovery, the current account surplus of the balance of payments in 2014 is projected to narrow to RM30.8 billion or 3% of GNI.
Performance of the Manufacturing Sector to Improve, Driven by the E&E and Primary-related Clusters
The improvement in external demand amid the recovery in global growth is expected to benefit the manufacturing sector. This is particularly relevant to the export-oriented industries, consisting of the E&E and primary-related clusters, which together account for 80% of the manufacturing output in Malaysia. In the E&E cluster, growth will be driven mainly by higher demand for semiconductors, especially for final use in mobile devices, tablets and automobiles. Amid the positive growth performance of semiconductors in recent years and underperformance of the personal computers and parts segment following the GFC, semiconductors have now become the largest contributor to Malaysia’s E&E exports, accounting for a 39.7% share of total E&E exports (2006: 31.1% share). Growth is further supported by the primary-related cluster, underpinned by sustained regional demand for chemicals, refined petroleum and rubber products.
1
External Trade
2013p 2014f
Annual change (%)
Gross exportsof which: 2.4 5.8
Manufactures 5.7 7.2
Agriculture -17.0 8.5
Minerals 3.8 -4.1
Gross importsof which: 7.0 8.9
Capital goods 2.8 7.2
Intermediate goods 4.3 6.0
Consumption goods 8.7 8.5
Trade balance -26.4 -22.7
p Preliminaryf Forecast
Source: Department of Statistics, Malaysia and Bank Negara Malaysia
Table 4.2

AN
NU
AL
REP
OR
T 20
13O
UTL
OO
K A
ND
PO
LIC
Y IN
201
475
Re-export Activity Providing Growing Support to Malaysia’s Trade
A notable development in Malaysia’s trade structure in recent years is the increase in re-export activity. In essence, goods are considered as re-exports if the goods are exported out of the country in the same form as when they were originally imported, without undergoing any major transformation. Goods for re-export are recorded in the Customs merchandise trade figures for both exports and imports. However, some of these items are excluded from the goods account compilation in the Balance of Payments (BoP) statistics. These include goods that are imported and then exported without involving a change in ownership.
Re-export activity has been a feature of Malaysia’s trade for several decades, but it used to account for only a small share of total exports. The strong growth of Malaysia’s re-export activity in the more recent period has been largely attributable to the rapid increase in re-export of petroleum products. This reflects the ongoing expansion of petroleum storage capacity, as Malaysia positions itself as a regional oil storage and trading hub, as planned under the Economic Transformation Programme (ETP). Subsequently, the share of re-exports to total gross exports has more than doubled, increasing to 12.8% in 2013 from 5.6% in 2010.
By composition, the share of re-exports of petroleum products has grown significantly in recent years given the expansion in storage capacity. Currently, it constitutes the largest share of Malaysia’s total re-exports, surpassing E&E re-exports. In addition, increasing warehousing activity for metal in Johor has also resulted in the rising share of re-exports of manufactures of metal.
Chart 1
Share of Malaysia's Total Re-export
0
10
20
30
40
50
60
70
80
90
100
Share (%)
2000 2005 2010 2013p
31
41
11
424953
10
53
3
2
49
20
16
3838
24
Source: Department of Statistics, Malaysia
Manufactures of metal
Others
Petroleum products
Transport equipment
E&E1
1.7 4.0 5.6 12.8% share of gross exports
1Includes machinery and equipment
Note: Figures may not necessarily add up due to roundingp Preliminary
Re-export activity has positive spillover effects on the economy. First, it increases the value-add of other related industries, including the transportation and storage services sub-sectors, manufacturing and construction sectors. Second, it contributes to the creation of mid- to high-skilled jobs, such as engineers and operators in the respective fields, resulting in higher employment and hence consumption activity. Third, the growth of re-export activity has a direct positive impact on net exports of services and investment in storage terminals and port infrastructure. For Malaysia, the positive spillovers of re-export activity to the economy is still small but is expected to increase rapidly going forward. At this point, most of the activity remains centred around warehousing services and other supporting or add-on services based on customers’ requirements, such as heating and blending.
The strong growth of re-export of petroleum products is expected to continue, supported by further capacity expansion in petroleum storage terminals. This will further increase the contribution of re-exports to Malaysia’s growth in the years ahead.

AN
NU
AL R
EPOR
T 2013O
UTLO
OK
AN
D PO
LICY
IN 2014
76
Inflation OutlookHeadline inflation is projected to average 3%-4% in 2014 (2013: 2.1%) due mainly to domestic cost factors. These include the recent price adjustments arising from subsidy rationalisation and the spillover effects of these adjustments on the prices of other goods and services. The higher cost pressures, however, will be partly contained by subdued external price pressures, given the expectations of lower global food and energy prices. Continued expansion in domestic capacity and a moderation in domestic demand would also help to attenuate the cost pressures. Upside risks to inflation include stronger domestic demand arising from better-than-expected external demand, a significant rise in global commodity prices and excessive wage increases leading to second-round effects. These risks, however, are assessed to be relatively low.
Externally, global inflation will remain subdued due to the prevalence of excess productive capacity and adequate supply of commodities to meet the expected increase in global demand. The Food and Agriculture Organisation of the
United Nations (FAO)2 projected lower global food prices in 2014, as the production of major food items, such as corn and wheat, is expected to increase significantly. Global crude oil prices are expected to remain stable, to average at USD103.70 per barrel in 20143 (2013: USD104 per barrel). The unprecedented supply of shale oil and the increase in its production in the US, as well as stable production of crude oil by other major oil producers will be sufficient to accommodate the expansion in demand for oil. In addition, the easing of geopolitical risks in the Middle East will also reduce the risk of crude oil supply disruptions. In line with the subdued global commodity prices, inflationary pressures originating from Malaysia’s key import partners are also expected to be modest. The more moderate external price pressures would help to alleviate the pressure on domestic production costs.
Headline inflation to be driven by domestic cost factors
Domestically, the upward adjustments to the prices of petroleum products and sugar, as well as higher excise duties on tobacco products, in the later part of 2013, together with the recent increase in electricity tariffs in January, will contribute to higher inflation in 2014. While these adjustments may also have some spillover effects on the prices of other goods and services, the magnitude of the spillovers is expected to be contained given that these adjustments were implemented during a period of low inflation and moderate demand conditions. The pressure on prices from domestic demand factors is also expected to be modest due to a slower increase in household spending and the slower real wage growth. Thus, while the economy is expected to grow at close to its potential (see box article on `Estimating Malaysia’s Potential Output´), it is not expected to result in significant domestic price pressures.
However, the upside risks to inflation remain. A better-than-expected recovery in the external demand would lead to stronger domestic demand. This could lead to higher demand-driven
1
Table 4.3
Balance of Payments
2013p 2014f
RM billion
Goods 102.7 93.7
Services -15.0 -11.9
Balance on goods and services 87.6 81.8
Primary income -35.2 -34.9
Secondary income -15.2 -16.0
Balance on current account 37.3 30.8
% of GNI 3.9 3.0
Capital account -0.0
Financial account -15.0
Balance on capital and fi nancial accounts -15.1
Errors and omissions -7.5
of which:
Foreign exchange revaluation gains 18.6
Overall balance 14.6
Note: Figures may not necessarily add up due to roundingp Preliminaryf Forecast
Source: Department of Statistics, Malaysia and Bank Negara Malaysia
2 November 2013 Food Outlook3 Average price of Brent, Dubai and West Texas Intermediate
(WTI) crude oil, equally weighted, as projected by the International Monetary Fund (IMF) in the January 2014 World Economic Outlook.
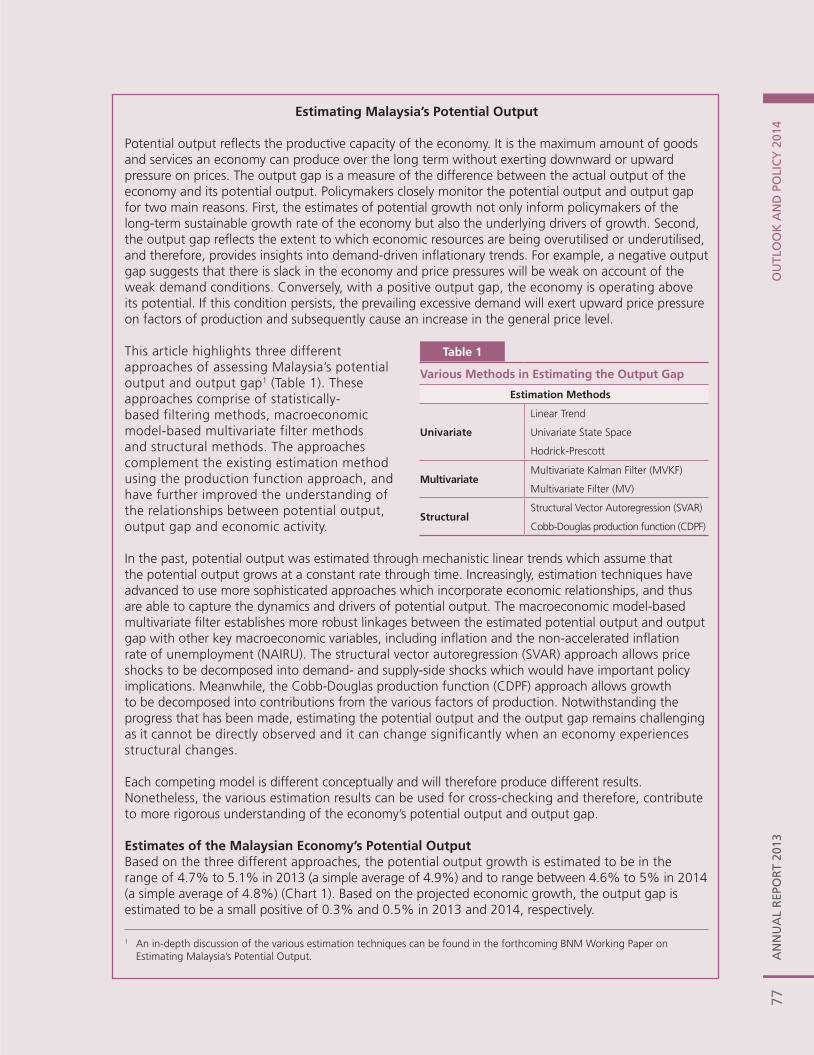
77A
NN
UA
L R
EPO
RT
2013
OU
TLO
OK
AN
D P
OLI
CY
201
41
AN
NU
AL
REP
OR
T 20
13O
UTL
OO
K A
ND
PO
LIC
Y IN
201
4
Estimating Malaysia’s Potential Output
Potential output refl ects the productive capacity of the economy. It is the maximum amount of goods and services an economy can produce over the long term without exerting downward or upward pressure on prices. The output gap is a measure of the difference between the actual output of the economy and its potential output. Policymakers closely monitor the potential output and output gap for two main reasons. First, the estimates of potential growth not only inform policymakers of the long-term sustainable growth rate of the economy but also the underlying drivers of growth. Second, the output gap refl ects the extent to which economic resources are being overutilised or underutilised, and therefore, provides insights into demand-driven infl ationary trends. For example, a negative output gap suggests that there is slack in the economy and price pressures will be weak on account of the weak demand conditions. Conversely, with a positive output gap, the economy is operating above its potential. If this condition persists, the prevailing excessive demand will exert upward price pressure on factors of production and subsequently cause an increase in the general price level.
This article highlights three different approaches of assessing Malaysia’s potential output and output gap1 (Table 1). These approaches comprise of statistically-based filtering methods, macroeconomic model-based multivariate filter methods and structural methods. The approaches complement the existing estimation method using the production function approach, and have further improved the understanding of the relationships between potential output, output gap and economic activity.
In the past, potential output was estimated through mechanistic linear trends which assume that the potential output grows at a constant rate through time. Increasingly, estimation techniques have advanced to use more sophisticated approaches which incorporate economic relationships, and thus are able to capture the dynamics and drivers of potential output. The macroeconomic model-based multivariate fi lter establishes more robust linkages between the estimated potential output and output gap with other key macroeconomic variables, including infl ation and the non-accelerated infl ation rate of unemployment (NAIRU). The structural vector autoregression (SVAR) approach allows price shocks to be decomposed into demand- and supply-side shocks which would have important policy implications. Meanwhile, the Cobb-Douglas production function (CDPF) approach allows growth to be decomposed into contributions from the various factors of production. Notwithstanding the progress that has been made, estimating the potential output and the output gap remains challenging as it cannot be directly observed and it can change significantly when an economy experiences structural changes.
Each competing model is different conceptually and will therefore produce different results. Nonetheless, the various estimation results can be used for cross-checking and therefore, contribute to more rigorous understanding of the economy’s potential output and output gap.
Estimates of the Malaysian Economy’s Potential Output Based on the three different approaches, the potential output growth is estimated to be in the range of 4.7% to 5.1% in 2013 (a simple average of 4.9%) and to range between 4.6% to 5% in 2014 (a simple average of 4.8%) (Chart 1). Based on the projected economic growth, the output gap is estimated to be a small positive of 0.3% and 0.5% in 2013 and 2014, respectively. 1 An in-depth discussion of the various estimation techniques can be found in the forthcoming BNM Working Paper on
Estimating Malaysia’s Potential Output.
1
Table 1
Various Methods in Estimating the Output Gap
Estimation Methods
Univariate
Linear Trend
Univariate State Space
Hodrick-Prescott
MultivariateMultivariate Kalman Filter (MVKF)
Multivariate Filter (MV)
StructuralStructural Vector Autoregression (SVAR)
Cobb-Douglas production function (CDPF)
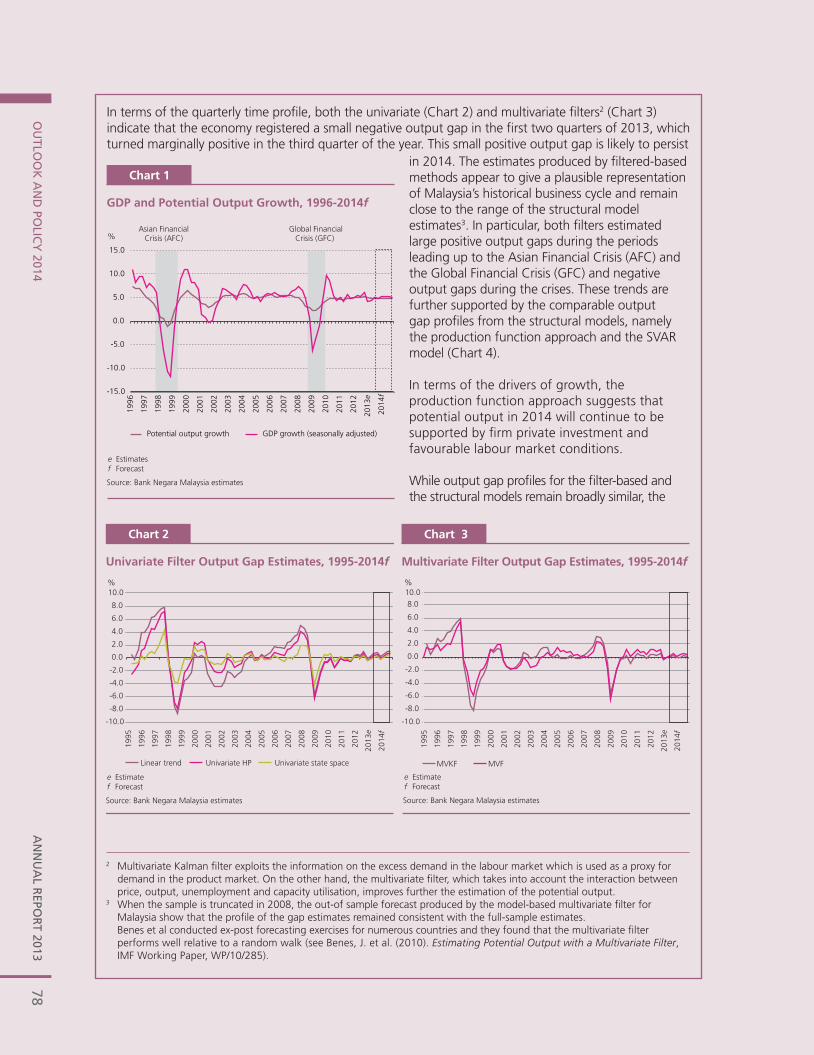
78A
NN
UA
L REPO
RT 2013
OU
TLOO
K A
ND
POLIC
Y 2014
2A
NN
UA
L REPO
RT 2013
OU
TLOO
K A
ND
POLIC
Y IN
2014
In terms of the quarterly time profi le, both the univariate (Chart 2) and multivariate fi lters2 (Chart 3) indicate that the economy registered a small negative output gap in the fi rst two quarters of 2013, which turned marginally positive in the third quarter of the year. This small positive output gap is likely to persist
2 Multivariate Kalman fi lter exploits the information on the excess demand in the labour market which is used as a proxy for demand in the product market. On the other hand, the multivariate fi lter, which takes into account the interaction between price, output, unemployment and capacity utilisation, improves further the estimation of the potential output.
3 When the sample is truncated in 2008, the out-of sample forecast produced by the model-based multivariate fi lter for Malaysia show that the profi le of the gap estimates remained consistent with the full-sample estimates.
Benes et al conducted ex-post forecasting exercises for numerous countries and they found that the multivariate fi lter performs well relative to a random walk (see Benes, J. et al. (2010). Estimating Potential Output with a Multivariate Filter, IMF Working Paper, WP/10/285).
GDP and Potential Output Growth, 1996-2014f
Chart 1
Source: Bank Negara Malaysia estimates
%Asian Financial
Crisis (AFC) Global Financial
Crisis (GFC)
e Estimatesf Forecast
Potential output growth GDP growth (seasonally adjusted)
-15.0
-10.0
-5.0
0.0
5.0
10.0
15.0
1996
1997
1998
1999
2000
2001
2002
2003
2004
2005
2006
2007
2008
2009
2010
2011
2012
2013
e
2014
f
Univariate Filter Output Gap Estimates, 1995-2014f
Chart 2
%
-10.0
-8.0
-6.0
-4.0
-2.0
0.0
2.0
4.0
6.0
8.0
10.0
Linear trend Univariate HP Univariate state space
Source: Bank Negara Malaysia estimates
e Estimatef Forecast
2000
1998
1997
1996
1995
1999
2001
2002
2003
2004
2005
2006
2007
2008
2009
2010
2011
2012
2013
e
2014
f
Multivariate Filter Output Gap Estimates, 1995-2014f
Chart 3
-10.0
-8.0
-6.0
-4.0
-2.0
0.0
2.0
4.0
6.0
8.0
MVKF MVF
2000
1998
1997
1996
1995
1999
2001
2002
2003
2004
2005
2006
2007
2008
2009
2010
2011
2012
2013
e
2014
f
%10.0
Source: Bank Negara Malaysia estimates
e Estimatef Forecast
in 2014. The estimates produced by fi ltered-based methods appear to give a plausible representation of Malaysia’s historical business cycle and remain close to the range of the structural model estimates3. In particular, both fi lters estimated large positive output gaps during the periods leading up to the Asian Financial Crisis (AFC) and the Global Financial Crisis (GFC) and negative output gaps during the crises. These trends are further supported by the comparable output gap profi les from the structural models, namely the production function approach and the SVAR model (Chart 4).
In terms of the drivers of growth, the production function approach suggests that potential output in 2014 will continue to be supported by fi rm private investment and favourable labour market conditions.
While output gap profi les for the fi lter-based and the structural models remain broadly similar, the
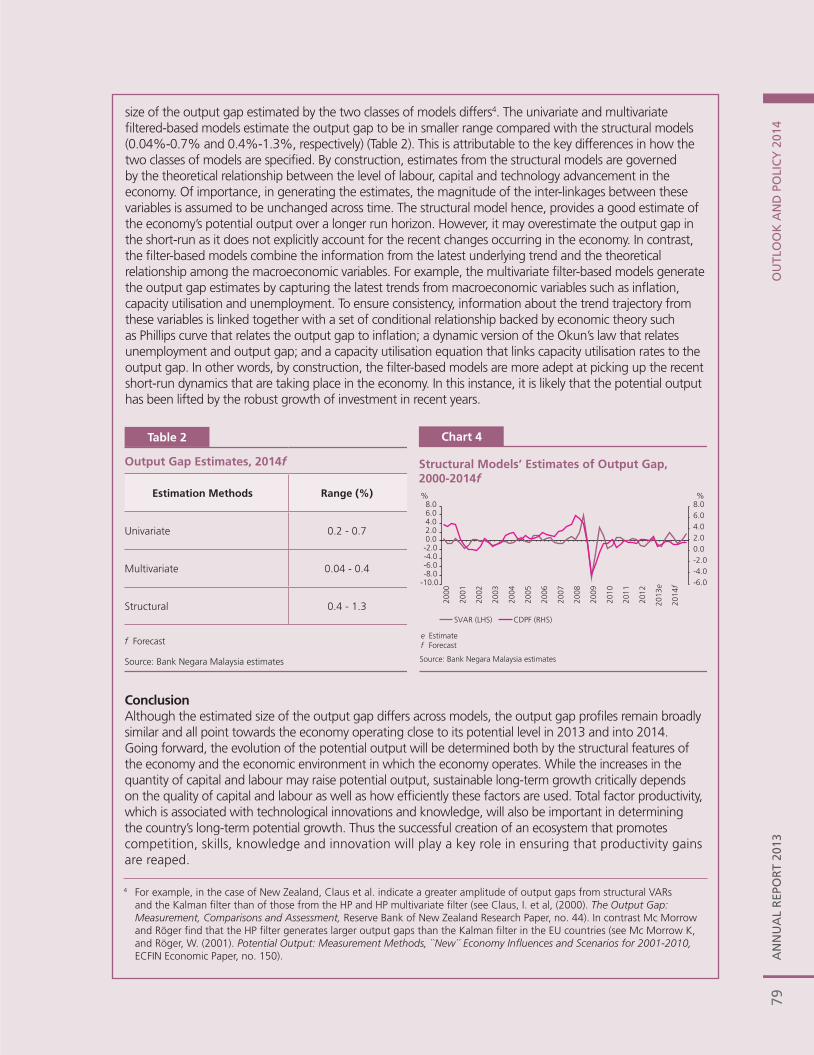
79A
NN
UA
L R
EPO
RT
2013
OU
TLO
OK
AN
D P
OLI
CY
201
43
AN
NU
AL
REP
OR
T 20
13O
UTL
OO
K A
ND
PO
LIC
Y IN
201
4
4 For example, in the case of New Zealand, Claus et al. indicate a greater amplitude of output gaps from structural VARs and the Kalman fi lter than of those from the HP and HP multivariate fi lter (see Claus, I. et al, (2000). The Output Gap: Measurement, Comparisons and Assessment, Reserve Bank of New Zealand Research Paper, no. 44). In contrast Mc Morrow and Röger fi nd that the HP fi lter generates larger output gaps than the Kalman fi lter in the EU countries (see Mc Morrow K, and Röger, W. (2001). Potential Output: Measurement Methods, ``New´´ Economy Infl uences and Scenarios for 2001-2010, ECFIN Economic Paper, no. 150).
size of the output gap estimated by the two classes of models differs4. The univariate and multivariate fi ltered-based models estimate the output gap to be in smaller range compared with the structural models (0.04%-0.7% and 0.4%-1.3%, respectively) (Table 2). This is attributable to the key differences in how the two classes of models are specifi ed. By construction, estimates from the structural models are governed by the theoretical relationship between the level of labour, capital and technology advancement in the economy. Of importance, in generating the estimates, the magnitude of the inter-linkages between these variables is assumed to be unchanged across time. The structural model hence, provides a good estimate of the economy’s potential output over a longer run horizon. However, it may overestimate the output gap in the short-run as it does not explicitly account for the recent changes occurring in the economy. In contrast, the fi lter-based models combine the information from the latest underlying trend and the theoretical relationship among the macroeconomic variables. For example, the multivariate fi lter-based models generate the output gap estimates by capturing the latest trends from macroeconomic variables such as infl ation, capacity utilisation and unemployment. To ensure consistency, information about the trend trajectory from these variables is linked together with a set of conditional relationship backed by economic theory such as Phillips curve that relates the output gap to infl ation; a dynamic version of the Okun’s law that relates unemployment and output gap; and a capacity utilisation equation that links capacity utilisation rates to the output gap. In other words, by construction, the fi lter-based models are more adept at picking up the recent short-run dynamics that are taking place in the economy. In this instance, it is likely that the potential output has been lifted by the robust growth of investment in recent years.
Structural Models’ Estimates of Output Gap, 2000-2014f% %
Chart 4
-6.0-4.0-2.00.02.04.06.08.0
-10.0-8.0-6.0-4.0-2.00.02.04.06.08.0
SVAR (LHS) CDPF (RHS)
2000
2001
2002
2003
2004
2005
2006
2007
2008
2009
2010
2011
2012
2013
e
2014
f
Source: Bank Negara Malaysia estimates
e Estimatef Forecast
ConclusionAlthough the estimated size of the output gap differs across models, the output gap profi les remain broadly similar and all point towards the economy operating close to its potential level in 2013 and into 2014. Going forward, the evolution of the potential output will be determined both by the structural features of the economy and the economic environment in which the economy operates. While the increases in the quantity of capital and labour may raise potential output, sustainable long-term growth critically depends on the quality of capital and labour as well as how effi ciently these factors are used. Total factor productivity, which is associated with technological innovations and knowledge, will also be important in determining the country’s long-term potential growth. Thus the successful creation of an ecosystem that promotes competition, skills, knowledge and innovation will play a key role in ensuring that productivity gains are reaped.
1
Table 2
Output Gap Estimates, 2014f
Estimation Methods Range (%)
Univariate 0.2 - 0.7
Multivariate 0.04 - 0.4
Structural 0.4 - 1.3
f Forecast
Source: Bank Negara Malaysia estimates
AN
NU
AL R
EPOR
T 2013O
UTLO
OK
AN
D PO
LICY
IN 2014
80
inflationary pressures that in turn could translate into higher spillovers across the economy. Global food and energy prices could also rise significantly should there be disruptions to the global supply of commodities, contributing to higher input costs and imported inflationary pressures. There is also the risk of second-round effects on inflation should inflation expectations increase disproportionately, accompanied by excessive wage increases that are not reflective of the improvements in productivity. However, based on available information, the current assessment is that the probability of these risks manifesting themselves is relatively low. MONETARY POLICY OUTLOOK
Monetary policy in 2014 will aim to support the sustainable growth of the Malaysian economy while mitigating any potential vulnerabilities arising from inflation and financial imbalances. The Malaysian economy is expected to continue on a steady growth path, supported by better performance in the external sector amid some moderation in domestic demand. Compared to 2013, inflation is projected to be higher. Nevertheless, the higher inflation will largely be due to cost factors, with the underlying inflation expected to remain contained. The continued low global and domestic interest rate environment would also make it important to be vigilant to the build-up of financial imbalances.
The global economy is expected to continue to improve in 2014, underpinned by a broader recovery in the advanced economies amid sustained growth in the emerging economies. The improvements in the advanced economies will have positive spillover effects on the rest of the world and provide support to the emerging economies as they transition towards a more moderate pace of growth in domestic demand. Nevertheless, there remains uncertainty surrounding the global macroeconomic and financial environment. In the advanced economies, key concerns are the significant economic slack and the impact of fiscal consolidation on the pace of recovery. Emerging economies face the challenge of managing external risks. The monetary policy transition in the advanced economies could heighten volatility in exchange rates, financial markets and capital flows, that may in turn, become destabilising to the growth prospects in these economies. Emerging economies may also experience a moderation in
domestic demand as policy measures are taken to address domestic risks.
The Malaysian economy is projected to grow between 4.5%-5.5% in 2014. Domestic demand will continue to be the anchor for growth, but it will grow at a more moderate pace. Private investment is projected to continue to register robust growth, while private consumption is expected to moderate to its long-term trend growth. Public sector spending is also projected to expand at a slower pace. Nevertheless, the economy is expected to benefit from the gradual recovery in the advanced economies. Employment prospects are expected to remain favourable. Key risks to the growth outlook over the near- to medium-term emanate mainly from the external sector, arising from the downside risks to global growth. The economy could also experience stronger growth should the pace of global recovery exceed expectations.
Price pressures are expected to be stronger in 2014, following the relatively benign inflation environment throughout most of 2013. Headline inflation is expected to average between 3%-4% in 2014, due mainly to domestic cost factors. The higher cost pressures will be partly contained by the subdued external price pressures, continued expansion in domestic capacity and the more moderate rate of expansion in domestic demand. There is, however, a risk that higher global commodity prices and stronger-than-expected demand conditions could put an upward pressure on inflation. Rising inflationary expectations and excessive wage increases, if they occur, would also pose upside risks to inflation. However, these risks are assessed to be contained at this juncture.
Given the nature of the factors behind the increase in inflation, monetary policy is not the best policy tool to manage the situation. Being a demand management tool, there is less reliance on monetary policy to deal with cost-push inflationary pressures. There is greater reliance on other policies, such as measures to expand domestic capacity, improve the distribution channels and promote market efficiency and competitiveness. Nevertheless, higher cost-push inflation could lead to inflation expectations becoming unanchored and could, in turn, lead to wage growth that is not consistent with productivity growth. This could create conditions for a more significant increase in inflation. Recognising these risks, monetary surveillance will remain focused on identifying
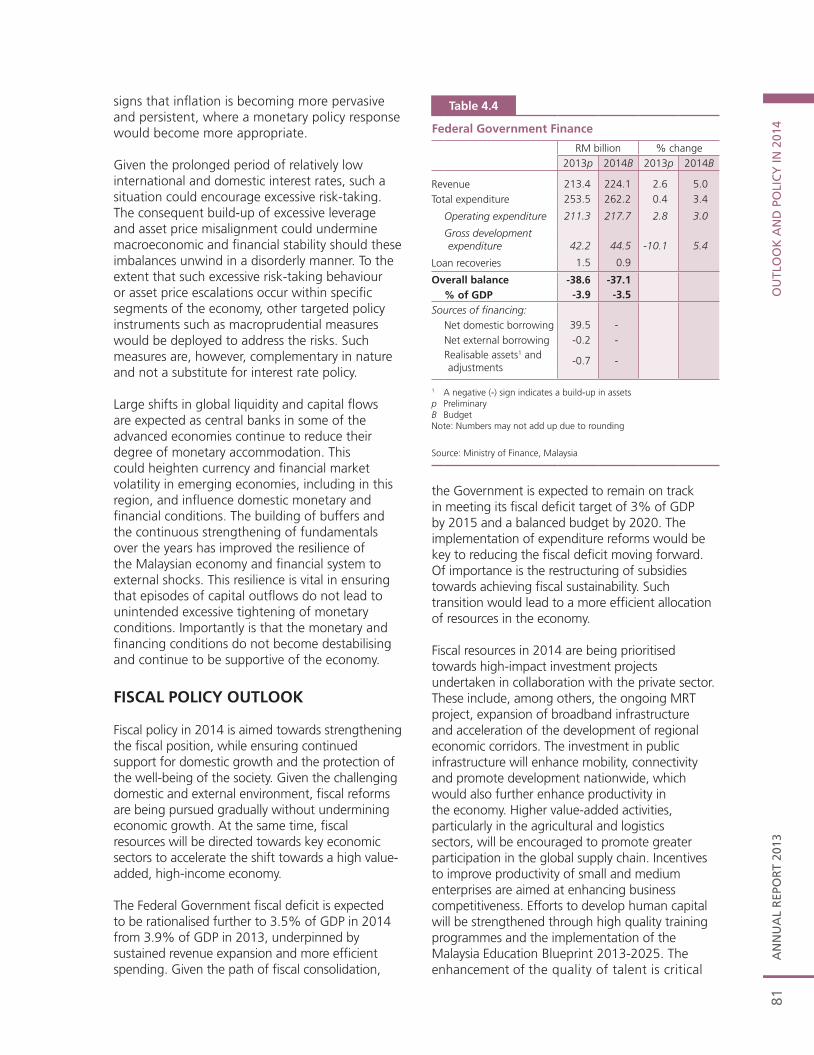
AN
NU
AL
REP
OR
T 20
13O
UTL
OO
K A
ND
PO
LIC
Y IN
201
481
signs that inflation is becoming more pervasive and persistent, where a monetary policy response would become more appropriate.
Given the prolonged period of relatively low international and domestic interest rates, such a situation could encourage excessive risk-taking. The consequent build-up of excessive leverage and asset price misalignment could undermine macroeconomic and financial stability should these imbalances unwind in a disorderly manner. To the extent that such excessive risk-taking behaviour or asset price escalations occur within specific segments of the economy, other targeted policy instruments such as macroprudential measures would be deployed to address the risks. Such measures are, however, complementary in nature and not a substitute for interest rate policy.
Large shifts in global liquidity and capital flows are expected as central banks in some of the advanced economies continue to reduce their degree of monetary accommodation. This could heighten currency and financial market volatility in emerging economies, including in this region, and influence domestic monetary and financial conditions. The building of buffers and the continuous strengthening of fundamentals over the years has improved the resilience of the Malaysian economy and financial system to external shocks. This resilience is vital in ensuring that episodes of capital outflows do not lead to unintended excessive tightening of monetary conditions. Importantly is that the monetary and financing conditions do not become destabilising and continue to be supportive of the economy.
FISCAL POLICY OUTLOOK
Fiscal policy in 2014 is aimed towards strengthening the fiscal position, while ensuring continued support for domestic growth and the protection of the well-being of the society. Given the challenging domestic and external environment, fiscal reforms are being pursued gradually without undermining economic growth. At the same time, fiscal resources will be directed towards key economic sectors to accelerate the shift towards a high value-added, high-income economy.
The Federal Government fiscal deficit is expected to be rationalised further to 3.5% of GDP in 2014 from 3.9% of GDP in 2013, underpinned by sustained revenue expansion and more efficient spending. Given the path of fiscal consolidation,
the Government is expected to remain on track in meeting its fiscal deficit target of 3% of GDP by 2015 and a balanced budget by 2020. The implementation of expenditure reforms would be key to reducing the fiscal deficit moving forward. Of importance is the restructuring of subsidies towards achieving fiscal sustainability. Such transition would lead to a more efficient allocation of resources in the economy.
Fiscal resources in 2014 are being prioritised towards high-impact investment projects undertaken in collaboration with the private sector. These include, among others, the ongoing MRT project, expansion of broadband infrastructure and acceleration of the development of regional economic corridors. The investment in public infrastructure will enhance mobility, connectivity and promote development nationwide, which would also further enhance productivity in the economy. Higher value-added activities, particularly in the agricultural and logistics sectors, will be encouraged to promote greater participation in the global supply chain. Incentives to improve productivity of small and medium enterprises are aimed at enhancing business competitiveness. Efforts to develop human capital will be strengthened through high quality training programmes and the implementation of the Malaysia Education Blueprint 2013-2025. The enhancement of the quality of talent is critical
1
Federal Government Finance
RM billion % change2013p 2014B 2013p 2014B
Revenue 213.4 224.1 2.6 5.0Total expenditure 253.5 262.2 0.4 3.4
Operating expenditure 211.3 217.7 2.8 3.0
Gross developmentexpenditure 42.2 44.5 -10.1 5.4
Loan recoveries 1.5 0.9
Overall balance -38.6 -37.1% of GDP -3.9 -3.5
Sources of fi nancing:Net domestic borrowing 39.5 -Net external borrowing -0.2 -Realisable assets1 and adjustments
-0.7 -
1 A negative (-) sign indicates a build-up in assetsp PreliminaryB BudgetNote: Numbers may not add up due to rounding
Source: Ministry of Finance, Malaysia
Table 4.4
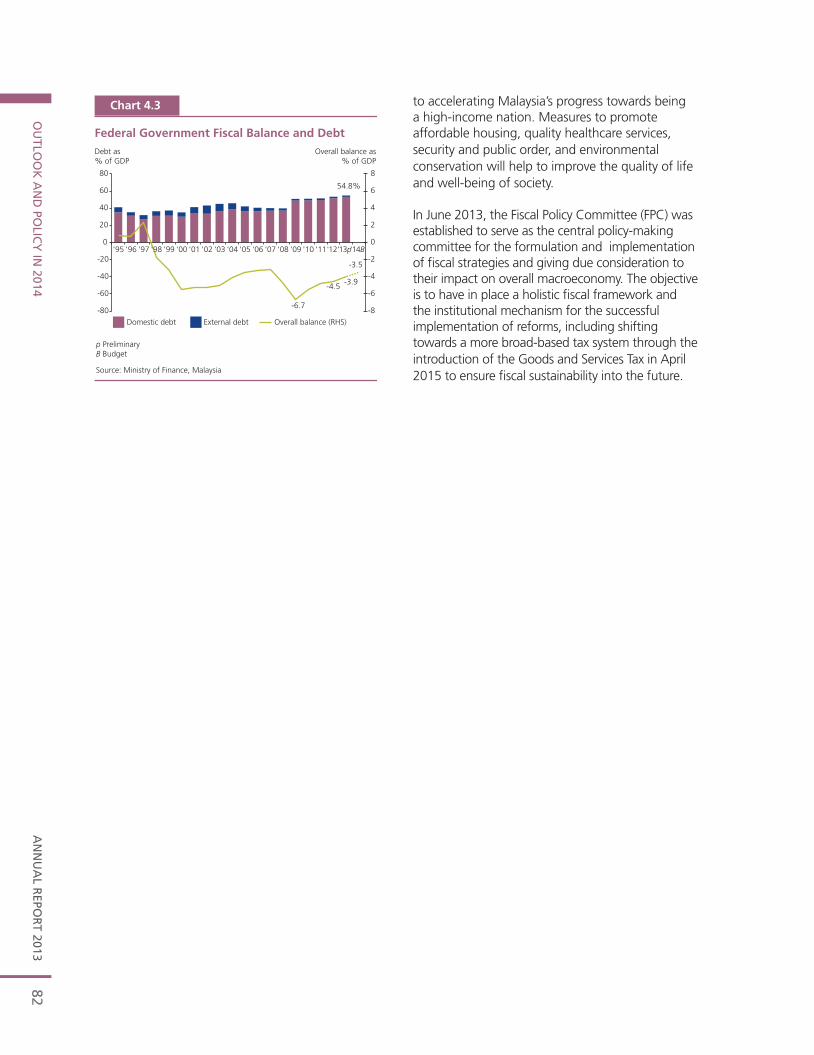
AN
NU
AL R
EPOR
T 2013O
UTLO
OK
AN
D PO
LICY
IN 2014
82
Chart 4.3
Federal Government Fiscal Balance and Debt Overall balance as
% of GDPDebt as% of GDP
External debtDomestic debt Overall balance (RHS)
p PreliminaryB Budget
Source: Ministry of Finance, Malaysia
54.8%
-6.7
-4.5-3.9
-3.5
-8
-6
-4
-2
0
2
4
6
8
-80
-60
-40
-20
0
20
40
60
80
'95 '96 '97 '98 '99 '00 '01 '02 '03 '04 '05 '06 '07 '08 '09 '10 '11'12'13p'14B
to accelerating Malaysia’s progress towards being a high-income nation. Measures to promote affordable housing, quality healthcare services, security and public order, and environmental conservation will help to improve the quality of life and well-being of society.
In June 2013, the Fiscal Policy Committee (FPC) was established to serve as the central policy-making committee for the formulation and implementation of fiscal strategies and giving due consideration to their impact on overall macroeconomy. The objective is to have in place a holistic fiscal framework and the institutional mechanism for the successful implementation of reforms, including shifting towards a more broad-based tax system through the introduction of the Goods and Services Tax in April 2015 to ensure fiscal sustainability into the future.

AN
NU
AL
REP
OR
T 20
13G
OV
ERN
AN
CE,
OR
GA
NIS
ATI
ON
AL
DEV
ELO
PMEN
T A
ND
CO
MM
UN
ICA
TIO
NS
83
85 Governance
89 Organisational Development
93 Communications
97 Organisation Structure
GOVERNANCE, ORGANISATIONAL DEVELOPMENT AND COMMUNICATIONS

AN
NU
AL R
EPOR
T 2013G
OV
ERN
AN
CE, O
RG
AN
ISATIO
NA
L DEV
ELOPM
ENT A
ND
CO
MM
UN
ICA
TION
S84
AN
NU
AL
REP
OR
T 20
1385
GOVERNANCE, ORGANISATIONAL DEVELOPMENT AND COMMUNICATIONS
In 2013, the Bank completed most of the targeted initiatives for the year and sustained the progress of its three year Business Plan amid increased challenges posed by the global economic and financial environment. The Bank’s research, surveillance, policy and advisory functions were focused on managing the risks emanating from the external environment, volatile capital flows, rising asset prices, and high level of household debt. Several pre-emptive policy actions were undertaken to preserve macroeconomic and financial stability. The Bank continued to engage and advise the Government on relevant macroeconomic issues towards sustaining a conducive environment for the country’s economic growth and development. In addition, the Bank made further progress in expanding opportunities for higher value activities within the Malaysian financial ecosystem, notably further solidifying Malaysia’s position as the World’s Islamic Finance Marketplace, the adoption of the Sasana Accord for financial inclusion and promoting green financing. In the area of insurance, initiatives included promoting efficiency of the motor insurance business and a more comprehensive life insurance and takaful framework to support a higher level of insurance and takaful penetration. Other areas included the liberalisation of the foreign exchange administration rules to further enhance the business environment, enhancing the platform to cater for multi-currency funds and securities settlement including issuance and raising Malaysia’s profile as an international education hub in financial services. These achievements were facilitated by the Bank’s continued emphasis on governance, organisational development and communications as strategic imperatives in delivering the Bank’s mandates.
GOVERNANCE
The Board of Directors (Board) has responsibility for the general policy, administration and business of the Bank. The Board comprises the Governor, three Deputy Governors and the Secretary-General of the Treasury as ex-officio members of the Board and five independent directors who are non-executive members. The third Deputy Governor was appointed in April 2013. The Board exercises oversight of
the management and operations of the Bank and reviews the performance of the Bank in delivering its mandates of promoting monetary and financial stability in an environment that is conducive to the sustainable growth of the Malaysian economy. The Board reviews the Bank’s strategic planning and risk management practices, human capital management, the Bank’s financial position and also oversees other administrative matters that impact the efficiency and effectiveness of the Bank’s operations.
In 2013, the Board met monthly during the year to deliberate on the Bank’s operations and discussed new developments in the regional and global environment. The official opening of the Bank’s Beijing Representative Office witnessed the first occasion where a Board meeting was conducted abroad, in Beijing, in conjunction with other activities to further strengthen bilateral ties with PR China.
At its meetings, the Board deliberated on key economic and financial conditions, and how domestic and external developments may impact the economy, the consequences for financial stability and the Bank’s operations, along with the Bank’s policy responses to these developments. The meetings also discussed the Bank’s financial condition, reserves and currency management, and talent management issues.
During the year, the Board continued to focus its oversight role on governance and internal controls, particularly in relation to project management, information technology architecture and the enhancement of statistical systems, all of which aim to develop the Bank’s capabilities to undertake its operations in a more complex and challenging environment. The Board was briefed monthly on the Bank’s treasury operations and investment strategies given the uncertainties in the global financial markets. The Board also oversaw the Bank’s adoption of accounting practices and reporting in compliance with generally accepted principles and practices of accounting standards, taking into consideration the Bank’s unique position as a Central Bank. The Board approved a new framework to ensure the availability of
AN
NU
AL R
EPOR
T 2013G
OV
ERN
AN
CE, O
RG
AN
ISATIO
NA
L DEV
ELOPM
ENT A
ND
CO
MM
UN
ICA
TION
S86
sufficient financial buffers to strengthen the financial and operational sustainability of the Bank. During 2013, the Board also approved a number of regional and international cooperation agreements with foreign regulators in the area of economic and financial sector development, and financial stability.
In performing its oversight function, the Board is supported by three Board Committees, namely the Board Governance Committee (BGC), the Board Audit Committee (BAC) and the Board Risk Committee (BRC). The members of these committees consist solely of non-executive directors and this is intended to strengthen independent oversight of the Bank’s operations. The BGC is responsible for overseeing the principles and practices of governance for the Bank. The BGC convened four meetings in 2013, and made several recommendations to the Board on issues relating to the budget and operating plan and matters relating to the appointment and reappointment of Deputy Governors, members of the Shariah Advisory Committee and Financial Stability Executive Committee.
The function of the Board Audit Committee is to assist the Board in its oversight of the integrity of the Bank’s accounts and financial statements, the effectiveness of the internal controls, the performance of the internal audit function, and compliance with legal and regulatory requirements. The BAC convened five meetings in 2013 to review and approve the audit plan, review audit activities and the performance of the Internal Audit function, review the accounts and financial statements, review the audit charter and deliberate on audit findings and the rectification actions taken to strengthen internal controls of the Bank.
The Board Risk Committee assists the Board in providing oversight on the management of risks that could lead to the Bank experiencing financial loss, disruption of operations, failure to meet its mandates or damage to the Bank’s reputation. In 2013, the BRC met three times to deliberate on the Bank’s management of enterprise-wide risks. The BRC discussed the Bank’s transversal risks, namely people, physical security, information security and legal risks, and the associated risk mitigation strategies. In the area of Treasury Operations, the BRC deliberated on the Bank’s processes and approaches to investing in new asset classes and markets to ensure that
adequate controls were in place to manage the associated risks.
Risk Management in the BankThe Bank continued to strengthen its risk management framework to increase its agility in addressing new risks posed by the rapidly evolving landscape. The measures were focused on the Bank’s ability to respond effectively in adverse situations, and included recovery facilities, roles and responsibilities, as well as business processes that reduce the time to response, improve the predictability of response and the range of possible response options. Robust risk management is a critical element that supports the sustainability of operations in the event of any adverse development in the environment.
Risk Management governance structureThe Bank’s risk management governance provides clear accountabilities and responsibilities that ensure risk management strategies are effectively implemented and significant risks are adequately managed. The management of risks in the Bank is overseen by several risk committees, with roles that complement each other.
As noted earlier, the Board and the Board Risk Committee have the broad oversight function of the governance structure for the risk management framework. The Board, with the support of the BRC, provides strategic direction on risk management at the Bank to ensure that it has the necessary processes, systems and resources for effective risk management. The Risk Management Committee (RMC), chaired by the Governor, deliberates on organisational risks related to the achievement of the Bank’s mandates and strategic objectives, and decides on appropriate policies to mitigate and manage those risks. Significant risk issues are escalated to the RMC by two sub-committees, namely the Operational Risk Management Committee and the Financial Risk Management Committee, each chaired by a designated Deputy Governor. The Reserves Management Committee (ReMC), chaired by the Governor, with members comprising the Deputy Governors and Assistant Governors, oversees strategies for the investment of the international reserves, the management of the associated risks and the monitoring of their impact on the Bank’s financial position. The ReMC discusses global economic and financial market trends as well as the different types of risks, such as market risks, credit risks, and operational risks, that are likely to
AN
NU
AL
REP
OR
T 20
13G
OV
ERN
AN
CE,
OR
GA
NIS
ATI
ON
AL
DEV
ELO
PMEN
T A
ND
CO
MM
UN
ICA
TIO
NS
87
arise in implementing the investment strategies. Financial returns are reviewed from a risk-adjusted basis and investment decisions seek to achieve a balance between returns and the risks undertaken.
Risk Management frameworkThe Bank has adopted Enterprise Risk Management (ERM) to have a holistic view of risks. The ERM incorporates elements from the Operational Risk Management (ORM) and Financial Risk Management (FRM) frameworks. The ORM framework promotes sound operational risk management processes and practices to manage events that may adversely affect the achievement of the Bank’s mandates and objectives. The FRM framework addresses facets of financial risk management to ensure financial sustainability and places importance on the timely identification and effective management of financial risks.
The Bank adopted a three lines of defence approach that has proven to be an effective risk management tool. The first line of defence involves the line departments that are responsible for identifying, mitigating and managing risks at the operational level. The second line of defence comprises the Risk Policy Owners (RPO) and the Strategic and Risk Management Department. RPO functions were designed to assist line departments in managing transversal risks that cut across the organisation, namely legal, information security, physical security, business continuity, reputation, information technology and people risks. The third line of defence is the internal audit, which provides an independent assessment and verification of the effectiveness of the risk management policies and measures.
Key initiatives in 2013In 2013, the ERM principles and framework were revised to establish greater integration between corporate planning and risk management by firstly, identifying the risk events that may obstruct the achievement of the desired outcomes identified in the Bank’s Business Plan; and secondly, embedding the corresponding risk mitigation strategies within the Bank’s Business and Operating Plan process.
The efforts in strengthening its risk management framework received international recognition when the Bank was selected to spearhead the working group on ERM Reporting at the 2013 International Operational Risk Working Group (IORWG) meeting of central banks in Rabat, Morocco. A new ERM report
was developed which captured the elements of top-down risk assessment, Risk Control Self-Assessment (RCSA) and transversal risks assessments.
Strengthening Risk Management framework, tools and practicesIn terms of operational risk management practices, the three lines of defence and heightened risk awareness were strengthened by implementing an incident reporting mechanism as a tool to capture the occurrence of any risk events that could have led, or did lead, to an undesirable outcome. The policy requires incidences to be reported in order to mitigate losses, enhance monitoring of risk and ensure compliance with legislation and policies. An incident can be reported via the IReport application system and it will be automatically escalated to the responsible party for immediate remedial actions, where appropriate.
In addition, IComply serves as a repository for all internal policies and guidelines to enhance staff awareness and enhance the risk management culture within the Bank.
Heightening Risk Management awarenessVarious socialisation and awareness programmes were conducted to strengthen the effectiveness of risk management practices and thus, improved the Bank’s capacity to respond to business disruptions promptly. In addition to workshops conducted to enhance understanding on transversal risks and business continuity management, a Risk Awareness Day (RAD) was held to share knowledge on the latest policies, guidelines, systems and processes of risk management. The Bank stressed the roles and accountabilities of the RPO through periodic RPO forums and promoted prudent management of transversal risks with an RPO Guide.
Enhancing the Bank’s readiness and resilienceThe Bank revised its organisation level Business Continuity Plan (BCP) through an integrated assessment of the various business impact analysis and recovery strategies. The scope and objectives of Business Continuity Management (BCM) exercises such as Bank-wide combined live runs, call tree exercises and systems connectivity tests were further improved to test operational agility and stretch recovery capabilities. Business continuity awareness was instilled among line departments through mini desktop simulation exercises to rectify gaps in the department level BCP.

AN
NU
AL R
EPOR
T 2013G
OV
ERN
AN
CE, O
RG
AN
ISATIO
NA
L DEV
ELOPM
ENT A
ND
CO
MM
UN
ICA
TION
S88
In 2013, the Bank enhanced its role as the lead for the financial industry with respect to business continuity management and participated in the annual national level cyber drill exercise. Majlis Keselamatan Negara (National Security Council) was engaged to ensure greater integration of the Bank’s crisis management with the national level BCM infrastructure. Improvements to the BCM infrastructure included the development of a BCM Portal to facilitate internal and external communication and collaboration.
Internal Controls and AssuranceThe Internal Audit Department (IAD) supports the BAC by providing an independent and objective assessment of the adequacy and effectiveness of the governance processes, risk management measures and internal controls of the Bank’s key functions and significant activities. In addition, IAD also provides an assessment on the adequacy and effectiveness of internal controls in the identified significant activities of related entities that may affect the achievement of the Bank’s mandates and objectives.
The year 2013 marked the completion of IAD’s three-year audit plan which saw the department successfully complete its assessment on all core processes and major risks in the significant activities of line departments, branches and regional offices and the Bank’s related entities. Annual audits were conducted on key risk areas such as reserves management, currency management (including branch operations), finance operations and procurement management to assess the adequacy of internal controls, risk management, policies and procedures, reliability and accuracy of data, and the integrity of the IT systems. IAD also evaluated the human resource function in terms of human capital planning and management and in the adherence to the Bank’s code of ethics. Quality assurance was performed on the controls and governance processes of regulatory, supervisory and surveillance functions for the financial industry, including market conduct and payment system operations, to ensure the effectiveness of these roles and functions. During the three year audit cycle, an independent assessment was conducted to gauge the effectiveness of the overall policies, processes and risk methodologies adopted by the risk management function in the identification, control and monitoring of the credit, market, operational and reputational risks that may impact the Bank.
IAD had also engaged the senior management and the Boards of the related entities in assessing the adequacy of the risk control environments. Through the audit activities, IAD had increased the management’s focus in strengthening the internal controls, enhancing policies and procedures and improving risk management at the Bank and its related entities. To ensure that the recommendations are implemented effectively by the departments and related entities, IAD closely monitored the remedial actions taken to resolve the audit issues raised by the auditors. This was reported quarterly to the BAC and monthly to the senior management.
IAD also continued to provide input to the various management committees and project committees as part of its advisory role to ensure the effectiveness of controls, governance processes and risk management measures within the Bank. IAD serves as an independent member in two of the Bank’s large projects, at the working committee and the Project Steering Committee level, within clearly defined accountability structures to ensure the function remains independent from management, and any major concerns are to be reported to the BAC.
During the year, IAD had undertaken initiatives to further improve the effectiveness of the audit function. IAD intensified its engagements with other regulators to promote opportunities for peer learning on the latest developments in audit practices including the 2013 revised Committee of Sponsoring Organizations of the Treadway Commission (COSO) principles framework. Technical practice groups were established within the department to further deepen the collective knowledge base of the Bank’s auditors in order to reflect the growing complexity and scope of the Bank’s operations. IAD also continued its collaboration with the Strategic and Risk Management Department to effectively identify changes in the risk profiling of the significant activities to facilitate audit scoping and assess the adequacy and effectiveness of the controls highlighted in the respective department’s Risk Control Self-Assessment.
A new three-year audit plan for 2014-2016 has been developed and approved by the BAC on 18 December 2013. The plan will be reviewed annually to reflect changes in the Bank’s activities, risk profiles and operating environment. The plan continues to ensure that all departments and
AN
NU
AL
REP
OR
T 20
13G
OV
ERN
AN
CE,
OR
GA
NIS
ATI
ON
AL
DEV
ELO
PMEN
T A
ND
CO
MM
UN
ICA
TIO
NS
89
related entities are audited within the three-year period. Greater focus and scope will be given to risk management and governance for the purpose of identifying and assessing the risk profile of activities undertaken by the departments and related entities, and integrating the 2013 COSO principles within the audit framework. Departments and related entities with higher risk profiles will be prioritised and audited more frequently to ensure adequate internal controls and strong risk management practices were established to mitigate the risks associated with their respective operations. The rapid changes in information technology risks will also necessitate periodic reviews of the Bank’s IT systems’ security controls and IT project management.
ORGANISATIONAL DEVELOPMENT
Organisational Sustainability and PreparednessThe Bank emphasised organisational development strategies aimed at sustainability and preparedness as it continues to deliver its core mandates amid the challenging global financial and economic environment. This was achieved through organisation-wide clarity and focus on key outcomes and deliverables anchored to a robust three-year Business Plan, which sets the medium term strategic direction and aligns the required resources towards achieving the Bank’s objectives. Strategies and action plans are aligned to seven focus areas, namely ensuring monetary stability, preserving financial system stability, developing a more inclusive financial system, ensuring effective financial intermediation, ensuring smooth migration to e-payments, promoting greater integration of Malaysia into the regional and global economic and financial systems, as well as sustaining the high performance of the Bank.
The Business Plan 2012-14 helps different functions within the Bank to build a common understanding of outcomes and to plan on how to effectively collaborate on cross-functional initiatives or activities. The business planning process also identifies the resources required in the medium term to implement new policies. The different perspectives from various functions contribute towards more effective resource planning, clarity of inter-dependent roles and better risk management.
During the year, steps were taken to further integrate elements of business strategy, risk, human capital and financial resources for a more holistic view of organisation performance
management and more informed decision-making. Firstly, organisational and individual performance data was streamlined to ensure that performance is more rigorously measured against targets aligned with the Bank’s outcomes and mandates. Secondly, new risk indicators were developed to assess risks to the achievement of desired outcomes, and highlight business strategies that require review. Thirdly, the Bank’s financial discipline was strengthened with controls that require the alignment of new project budgets against the Bank’s business priorities, resulting in better cost management and prioritisation of Bank-wide projects. This was augmented with revisions to internal policies to facilitate pooling of financial resources that enable more cost effective and flexible allocation and utilisation of financial resources to achieve the Bank’s mandates. In addition, a project management guide is being developed to address project management risk, and ensure timely delivery and completion of projects.
In terms of continuous enhancements to the organisation’s roles and functions, the Consumer and Market Conduct (CMC) Department and the Strategic Communications Department were among the functions that underwent a restructuring exercise in 2013. In the case of CMC, the exercise strengthens the surveillance and supervisory functions to more effectively address issues relating to financial scams, inappropriate selling of financial products and services and inculcate greater financial awareness amongst the public through financial education. The changes at the communications function anticipate the increased complexity of communications in terms of specialised knowledge and the importance of managing public expectations and enabling key stakeholders, including the public, to better understand the Bank’s policies and actions.
Human Capital Management and DevelopmentDuring the year, the Bank continued to build on the Job Family framework introduced in 2012, with emphasis on the longer term assessment, development, progression and retention of staff. Greater focus was given towards strengthening initiatives to build a healthy talent pipeline, especially for the mission critical positions that have a greater impact on the performance of the Bank. Interventions towards talent development and organisational effectiveness were also intensified through implementation of various aspects of human capital management while
AN
NU
AL R
EPOR
T 2013G
OV
ERN
AN
CE, O
RG
AN
ISATIO
NA
L DEV
ELOPM
ENT A
ND
CO
MM
UN
ICA
TION
S90
addressing time to competence for staff in important functions.
The integrated profiling framework continued to be strengthened to ensure the efficiency and robustness of the assessment process for all levels of staff from the point of recruitment to mission critical talent within the Bank. The work included the up-skilling of internal assessors to enable the profiling and feedback processes to be conducted internally. The succession planning framework was implemented to support a healthy talent pipeline in the mid to long term, where talent for all mission critical positions were methodically assessed, monitored and developed for more challenging roles. The roll out of this strategic initiative will chart future plans for more rigorous leadership development interventions tailored to individual successors. Accordingly, the new career progression framework for the respective job families and refinements of the Bank’s Leadership Competencies were introduced to better determine the role expectations and facilitate individual career growth and development. This approach will allow staff adequate time and resources to acquire and equip themselves with the required technical and leadership competencies to progressively grow into more demanding roles.
Developing the Bank’s Workforce: Learning and Knowledge ManagementIn line with the Bank’s strategic objectives, human capital development efforts continued to focus on the learning priorities for staff to improve competency, productivity and performance by working closely with subject matter experts to co-create a variety of structured and unstructured learning interventions.
Growing the required leadership capabilities for mission critical functions was done through structured leadership development programmes and more intensive engagements between staff selected for leadership roles and the line departments. These efforts included personalised coaching and feedback sessions to address specific leadership development gaps. The approach also enabled line departments to progressively take greater ownership for talent development, thus creating a more conducive environment for staff to demonstrate leadership potential.
Technical competency development was also intensified in 2013 through the implementation
of structured curriculum oriented around the core competencies of the different job families. Through the co-creation model, the learning interventions were not only more relevant to business needs; they were also timelier in terms of developing competencies to address emerging issues and challenges. In 2013, the Bank inaugurated a series of structured curriculum, namely the Supervision Leadership Essential Series and Advanced Supervision Series for the Supervision job family. Both programmes were aimed at providing Bank supervisors with the knowledge and skills required to perform their role effectively.
The Bank also focused on improving staff productivity through personal development and effectiveness programmes in the areas of integrated and creative thinking, problem solving, communication, coaching, time management, office management, speech and report writing and impactful presentation. These programmes were targeted to the middle management level as well as non-executives across all job families.
In addition to structured programmes, staff undertook learning through multiple informal channels in the form of leadership series, e-learning, case studies, toastmasters club and the annual book sale event. Sharing of knowledge in the form of multimedia content was also made pervasive through an intranet platform. The Bank’s Knowledge Management Centre continued to expand the collection of physical and online resources for the staff in the areas of central banking, Islamic finance and financial services.
Managing the talent poolThe Bank has for many years invested in building its talent pool and in contributing to nation building. In 2013, the inaugural Kijang Academy was launched which featured an enhanced profiling methodology and feedback sessions for scholars’ personal development. A total of 54 scholarships were awarded to exceptional students to pursue pre-university, first degree and post-graduate programmes in selected universities. The Bank also invested in staff to pursue relevant fields of study as part of the overall talent management strategy. A structured engagement and intervention programme was introduced for scholars aimed at enhancing English language proficiency and building self-confidence. As a result, in 2013, 39% (2012: 9%) of the Bank scholars were accepted into top universities,

AN
NU
AL
REP
OR
T 20
13G
OV
ERN
AN
CE,
OR
GA
NIS
ATI
ON
AL
DEV
ELO
PMEN
T A
ND
CO
MM
UN
ICA
TIO
NS
91
while continuous engagements heightened their level of readiness for future entry into the Bank. In 2013, 76 returning scholars were successfully placed in various departments based on their specialisation, interest and best fit.
The prestigious Kijang Emas Scholarship, established in 2005 to support nation building, was awarded to three top students in the Sijil Pelajaran Malaysia examinations in 2012 to pursue their preferred fields of study supported by full scholarships at selected top universities in the world. As this scholarship is for nation building, recipients are required to return and serve the country upon graduation. To-date, a total of 43 Kijang Emas scholarships have been awarded.
The Bank also put in place measures to address the occasional instances of staff misconduct to ensure overall integrity and discipline as well as to maintain public confidence and reputation. Towards this end, the Bank Negara Malaysia Code of Ethics (CoE) is continuously reviewed to enable staff to fully comprehend and adhere to the expected behaviours required. The CoE was expanded and tightened to ensure that appropriate disciplinary action would be taken where necessary.
Staff strengthIn 2013, the staff strength increased by 0.5% to 2,834 from 2,820 in 2012. This includes staff who are seconded or attached to extend technical assistance to or acquire knowledge from other organisations. Attrition declined marginally to 4.6% (2012: 4.8%). The ratio of executive to non-executive staff remained constant at 3.5:2. This manpower continues to be at the relevant level in order for the Bank to deliver its current mandates.
International Technical Cooperation ProgrammesThe Bank continues to play a role in capacity building for the global central banking community. Through its international technical cooperation programmes, the Bank also strengthened its regional and international linkages. In 2013, the programmes covered areas such as Islamic finance, financial inclusion, financial stability and organisational development, benefiting 841 officials of central banking institutions from 78 countries representing Asia, Africa, Middle East and Latin-America.
Focus was also directed towards strengthening alliances with both international and domestic
partners to improve the delivery and effectiveness of the technical cooperation programmes and to facilitate the sharing of experiences and pooling of technical expertise. International partners during the year included the Alliance for Financial Inclusion (AFI), the World Bank and the Consultative Group to Assist the Poor, SEACEN Centre, Asian Development Bank (ADB), Islamic Development Bank (IDB) and Islamic Research and Training Institute (IRTI).
To enhance the knowledge and skills of policymakers and regulators globally in their pursuit of greater financial inclusion, the Bank and AFI signed a Letter of Cooperation for capacity building in August 2013. This collaborative framework with AFI is an important milestone towards establishing the Bank as a capacity building centre for the AFI network. In 2013, the Bank jointly organised with AFI three capacity building programmes which benefited 124 officials from 40 countries, and will be organising six capacity building programmes on relevant financial inclusion policy areas with AFI over the next two years.
The Bank also intensified its capacity building efforts to support the Association of South-East Asian Nations (ASEAN) financial integration agenda through the conduct of technical cooperation programmes, participated by 319 officials from ASEAN member countries. Of the total, 93 officials were from four of the newer ASEAN countries, namely Cambodia, Laos, Myanmar and Vietnam, participating in programmes that were supported by ADB. On a bilateral level, a Memorandum of Understanding (MoU) was signed with the Central Bank of Myanmar to establish a framework of cooperation for capacity building and human capital development with the support of the Malaysian Technical Cooperation Programme of the Malaysian Government.
Capacity building programmes in the development of an effective and well-regulated Islamic financial system continued to be a major focus area in 2013, as evidenced by the 179 participants from 28 countries in the various Islamic finance programmes organised during the year, including an Islamic Finance Workshop held in Muscat, Oman, co-organised by the Bank and IDB; and the inaugural Islamic Liquidity Management Workshop in collaboration with IRTI.
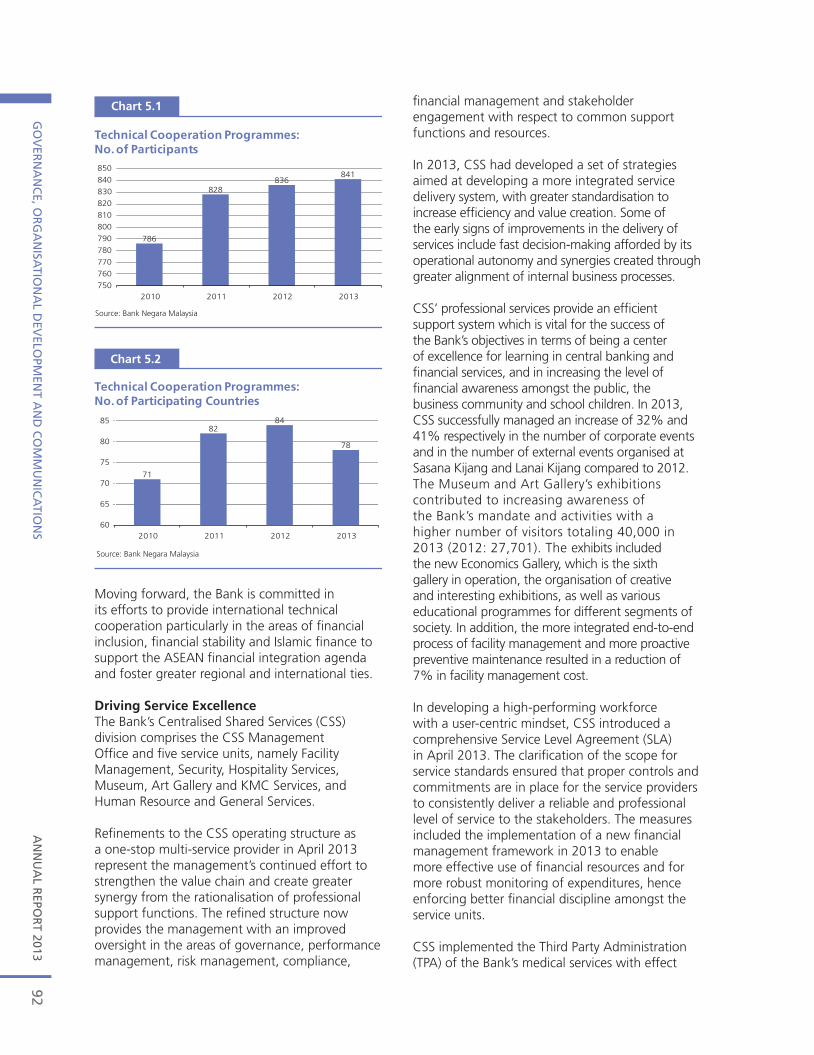
AN
NU
AL R
EPOR
T 2013G
OV
ERN
AN
CE, O
RG
AN
ISATIO
NA
L DEV
ELOPM
ENT A
ND
CO
MM
UN
ICA
TION
S92
financial management and stakeholder engagement with respect to common support functions and resources.
In 2013, CSS had developed a set of strategies aimed at developing a more integrated service delivery system, with greater standardisation to increase efficiency and value creation. Some of the early signs of improvements in the delivery of services include fast decision-making afforded by its operational autonomy and synergies created through greater alignment of internal business processes.
CSS’ professional services provide an efficient support system which is vital for the success of the Bank’s objectives in terms of being a center of excellence for learning in central banking and financial services, and in increasing the level of financial awareness amongst the public, the business community and school children. In 2013, CSS successfully managed an increase of 32% and 41% respectively in the number of corporate events and in the number of external events organised at Sasana Kijang and Lanai Kijang compared to 2012. The Museum and Art Gallery’s exhibitions contributed to increasing awareness of the Bank’s mandate and activities with a higher number of visitors totaling 40,000 in 2013 (2012: 27,701). The exhibits included the new Economics Gallery, which is the sixth gallery in operation, the organisation of creative and interesting exhibitions, as well as various educational programmes for different segments of society. In addition, the more integrated end-to-end process of facility management and more proactive preventive maintenance resulted in a reduction of 7% in facility management cost.
In developing a high-performing workforce with a user-centric mindset, CSS introduced a comprehensive Service Level Agreement (SLA) in April 2013. The clarification of the scope for service standards ensured that proper controls and commitments are in place for the service providers to consistently deliver a reliable and professional level of service to the stakeholders. The measures included the implementation of a new financial management framework in 2013 to enable more effective use of financial resources and for more robust monitoring of expenditures, hence enforcing better financial discipline amongst the service units.
CSS implemented the Third Party Administration (TPA) of the Bank’s medical services with effect
Chart 5.1
760
770
780
790
800
810
820
830
840
850
2010 2011 2012 2013
Source: Bank Negara Malaysia
750
786
828
841836
Technical Cooperation Programmes: No. of Participants
65
70
75
80
85
602010 2011 2012 2013
71
8284
78
Technical Cooperation Programmes: No. of Participating Countries
Source: Bank Negara Malaysia
Chart 5.2
Moving forward, the Bank is committed in its efforts to provide international technical cooperation particularly in the areas of financial inclusion, financial stability and Islamic finance to support the ASEAN financial integration agenda and foster greater regional and international ties.
Driving Service ExcellenceThe Bank’s Centralised Shared Services (CSS) division comprises the CSS Management Office and five service units, namely Facility Management, Security, Hospitality Services, Museum, Art Gallery and KMC Services, and Human Resource and General Services.
Refinements to the CSS operating structure as a one-stop multi-service provider in April 2013 represent the management’s continued effort to strengthen the value chain and create greater synergy from the rationalisation of professional support functions. The refined structure now provides the management with an improved oversight in the areas of governance, performance management, risk management, compliance,
AN
NU
AL
REP
OR
T 20
13G
OV
ERN
AN
CE,
OR
GA
NIS
ATI
ON
AL
DEV
ELO
PMEN
T A
ND
CO
MM
UN
ICA
TIO
NS
93
1 January 2013, which resulted in substantial cost savings and improved the Bank’s capability to more rigorously monitor its medical spending and the health profile of its employees. Another value-added service introduced in 2013 was the launch of the CSS Service Portal. The Portal will be developed in phases, and will serve as the single point of reference for stakeholders, and eventually serve as a common work-bench and business analytics platform to enable more informed decisions pertaining to the Bank’s operations.
Sustaining Information and Communications Technology (ICT) Operations Effectiveness and ResilienceThe focal point for the delivery of technology services in 2013 was operations effectiveness and efficiency through business process automation and process enhancements. These facilitated the achievement of the Bank’s strategic outcomes.
Financial market infrastructure improvement and innovationImprovements were made to the ICT infrastructure to cater for increased foreign participation in the financial system and to encourage investments by foreign players. This included system enhancements for the Fully Automated System for Tendering (FAST) to facilitate the inaugural issuance of the International Islamic Liquidity Management Corporation (IILM) USD Sukuk. In addition, a secured RENTAS Information Link (iLINK) infrastructure was made available over the Internet, thus providing local participants with an additional secured channel for access and also cater to the increased participation of foreign investors in the near future. Internally, end-to-end process flow and automation for the Bank’s Financial Management System and Special Funds Integrated System via RENTAS Straight-Through Processing had ensured greater certainty of transaction integrity and better information management.
ICT facilities for a high performance workplaceThe coverage of Wi-Fi Internet was further expanded, aimed towards providing `on-premise´ work mobility. An on-demand-bandwidth Wi-Fi Internet infrastructure was made available to guests attending key events hosted in the Bank, enabling the efficient provision of higher bandwidth, when required, in a cost-effective manner.
A private-cloud web conferencing service for regional communications and collaboration
between staff based at the Bank’s Headquarters and at the Branches and Regional Offices was also piloted in 2013. These services-enabled capabilities such as virtual meeting and real-time online discussions empowered greater collaboration and quicker decision-making, while reducing traveling time and cost.
Continuing the thrust towards the mobile space, an iPad application leveraging on private-cloud was introduced for an international meeting participated by delegates from 11 central banks from the East-Asia Pacific region. The application was made accessible to delegates prior to the event thus allowing real-time online access to information and presentation materials.
Infrastructure with enhanced resiliency, scalability and securityThe continued expansion and vibrancy of the Malaysian financial system requires a periodic technology refresh in order to ensure the performance, resiliency and robustness of the critical ICT infrastructure supporting the financial market and payment operations. Notable initiatives included the replacement of the server platform for FAST with a higher capacity and scalable infrastructure to cater for expanded business requirements. In line with such infrastructure improvements, the Bank’s Enterprise Backup, Recovery and Archival platform was also revamped with more efficient, scalable and expandable infrastructure to support enhanced business continuity objectives and response time requirements.
The increased cyber security threat has led to a global trend towards the adoption of stronger encryption methodology. Given the more pervasive use of e-payments in Malaysia, the Bank has acted to improve its Enterprise Public Key Infrastructure to support the use of longer cryptographic keys in line with international standards for financial market systems such as RENTAS and Sistem Penjelasan Informasi Cek Kebangsaan secara Elektronik (eSPICK). The full deployment for adoption in the financial market systems is scheduled in first quarter 2014.
COMMUNICATIONS
The Bank’s communications role was intensified in 2013 in view of heightened challenges and uncertainties, especially in the global environment. More intensive engagements were carried
AN
NU
AL R
EPOR
T 2013G
OV
ERN
AN
CE, O
RG
AN
ISATIO
NA
L DEV
ELOPM
ENT A
ND
CO
MM
UN
ICA
TION
S94
out with various stakeholders, explaining the soundness of the Malaysian economy and the financial sector’s resilience amidst the global and domestic headwinds which included market concerns over quantitative easing (QE) tapering and rising household indebtedness. Communication efforts were also focused in driving the Bank’s strategic initiatives, including financial inclusion, expanding regional ties and extending the public outreach.
Enhancing confidence in the Malaysian economy and financial systemThroughout 2013, the Bank communicated on the resiliency of the domestic economy and financial sector using various platforms, such as the Bank’s annual report and financial stability report briefings, quarterly GDP press conferences, roundtable discussions with analysts and economists, meetings with large fund managers, and senior management interviews with local and international media. The key messages conveyed were sustainable economic growth driven by domestic demand amidst a low and stable inflation environment, supported by a strong financial sector. The Bank also highlighted the increasing role of Islamic finance as an alternative to conventional financial services.
In fostering financial stability, the Bank communicated the rationale for the series of pre-emptive macro-prudential policies to address elevated household indebtedness and rising property prices. The exercise included engagements with different stakeholders, including non-banking financial intermediaries, to ensure clarity around the Bank’s objectives and to facilitate more effective implementation of the measures.
During the year, various meetings and workshops were held to explain the new Financial Services Act 2013 and the Islamic Financial Services Act 2013 and its significance in placing the financial industry in a state of readiness to respond to future challenges. Similarly, to further develop the life insurance and family takaful industry in Malaysia, there were extensive engagements with industry and consumer associations on the concept paper of the revised Life Insurance and Family Takaful Framework.
In its continued efforts to enhance data resources for economic analysis, the Bank collaborated with the Department of Statistics Malaysia (DOSM)
in introducing the seasonally adjusted data for the Malaysian economy to the economics community. This was supplemented by other statistics workshops and conferences highlighting the importance of good statistics for proper analysis, better surveillance and making informed policy decisions.
Monetary policy communicationsMonetary policy communications are undertaken through the Monetary Policy Statements (MPS) issued by the Monetary Policy Committee (MPC) of the Bank after each MPC meeting. These are supplemented by commentary on the monetary policy stance by senior officials at media interviews, conferences and workshops. Each MPS includes the rationale for decisions on the Overnight Policy Rate, taking into account the global and regional economic and financial developments and their impact on the domestic economy and inflation. The advance release of the scheduled dates of MPC meetings for the subsequent year provides certainty on policy making and promotes orderly market conditions.
Regional and International communication initiatives Communications on regional and international matters covered a broader spectrum of issues, ranging from the strengthening of Malaysia’s economic ties with regional economies, the launch of the new iconic brand identity `Malaysia: World’s Islamic Finance Marketplace´ and the hosting of the Alliance for Financial Inclusion Global Policy Forum by the Bank. The Global Policy Forum was graced by Her Majesty Queen Maxima of the Netherlands, and culminated with the announcement of the Sasana Accord which aims to drive financial inclusion policies across the world.
As Malaysia’s trade and investment with PR China continues to grow rapidly, there were increased efforts to enhance public awareness on the usage of Renminbi (RMB) for trade settlement. This resulted in greater RMB trade transactions for 2013 and increased interest amongst companies on using RMB. In anticipation of much greater financial linkages between the two countries, the Bank officially opened its Representative Office in Beijing, the third such office after London and New York.
Expediting migration to e-payments In expediting the e-payments agenda, a nationwide campaign, `Experience IBG´, or
AN
NU
AL
REP
OR
T 20
13G
OV
ERN
AN
CE,
OR
GA
NIS
ATI
ON
AL
DEV
ELO
PMEN
T A
ND
CO
MM
UN
ICA
TIO
NS
95
Interbank GIRO, was launched in collaboration with the industry to encourage businesses and the general public to switch from cheques to IBG services. The campaign covered roadshows, TV interviews, media editorials and advertisements and collaborating with participating financial institutions to engage with the public in promoting IBG services across the country. The promotions extended to the Northern and Southern regions, targeting heavy cheque users to use e-payments such as through mobile Point-of-Sale and online transactions via the Financial Processing Exchange (FPX).
Financial inclusion and empowermentThe Bank continued its outreach activities to the public to facilitate greater financial inclusion and awareness and management of financial matters. The Bank leveraged on its MobileLINK coach, counter services and strategic collaboration with various consumer associations to educate and enable rural communities to understand and use financial services, especially on the availability of agent banking services. During the year, a total of 91 sub-districts were covered with more than 15,000 people from rural communities benefiting from the engagements.
Taking cognizance of the increasing role of small and medium enterprises (SMEs) in the economy, the Bank worked together with other bodies, including the SME Bank, in engaging with the SMEs nation-wide on the availability of various financing schemes. More than 95% of the participating bankers and SMEs were satisfied with the communication programmes and more than 85% were of the view that the programmes should be continued.
A more inclusive and empowered financial system will result in a more discerning consumer with higher expectations. An important mechanism in managing these expectations is the Bank’s BNMLINK services that assist the public on financial matters by providing information and resolving issues with financial institutions. The cumulative number of financial consumer enquiries from individuals and businesses increased by 7.7% to 441,712 (2012: 410,163), with 88% of the cases being resolved.
While BNMLINK addresses concerns raised by consumers at the individual level, another more structured programme launched by the Bank is the Financial Management Awareness and
Education Campaign. This programme is being implemented in collaboration with the Bank’s subsidiary, the Credit Counselling and Debt Management Agency (AKPK), via prime-time radio segments, media articles and social media competitions. The areas of focus included living within means and seeking help early when experiencing signs of financial distress.
As a means to assist young and new borrowers to better manage their financial affairs, AKPK’s POWER! Programme had attracted 171,485 participants since the launch of the Programme in 2011. In addition, AKPK had handled a total of 248,491 counselling cases as at end-2013 with 41% of the participants requesting further assistance under its Debt Management Programme. It had also promoted public financial literacy through participation in PEMANDU’s 1 AZAM (Akhiri Zaman Miskin) programme. Through these initiatives, AKPK succeeded in reaching out to a total of 1.4 million consumers in 2013.
In terms of dispute resolution services, the Financial Mediation Bureau (FMB) continued to highlight its services through various events, exhibitions and briefings jointly with other agencies, including PIDM and AKPK. The total number of complaints received by FMB in 2013 declined to 1,881 (2012: 1,919). FMB’s intervention to resolve disputes were more effective, with 2,592 complaints closed in 2013, reducing the number of outstanding cases to 1,030 (2012: 1,741). The improved performance was due to better collaboration between FMB and the Financial Service Providers and more streamlined processes in complaint management.
Enhancing public awareness onfinancial scamsDuring the year, the Bank stepped up its public awareness initiatives on financial scams. These included media advertisements and updating the Financial Consumer Alerts by an additional 52 entities to a total of 143 entities (2012: total of 91 entities) that were neither authorised nor approved under the Bank’s laws and regulations. These were reinforced by continuous surveillance and intelligence sharing Bank-wide and with other law enforcement agencies. Financial scams cases reported to BNMLINK have declined by 2,511 cases (23%) to 8,402 (2012: 10,913).
AN
NU
AL R
EPOR
T 2013G
OV
ERN
AN
CE, O
RG
AN
ISATIO
NA
L DEV
ELOPM
ENT A
ND
CO
MM
UN
ICA
TION
S96
Supporting national agenda of `Going Green´ In support of the national agenda of `Going Green´, the Bank engaged with the public on the need to use recycled-fit banknotes during festive seasons to help in conserving the environment. This joint initiative with the Ministry of Energy, Green Technology and Water included the active participation of the financial industry associations.
Growing importance of online communications The Bank’s website continued to play a major role as a communication and engagement medium. Apart from explaining the Bank’s mandate and roles, and providing a wide range of economic and financial data and analysis, as well as regulatory developments and policies, the website also informs consumers on financial matters, such as banking and insurance needs, and alerting them on illegal financial schemes. The website received six million visits for 2013 and was awarded the 5-star rating in the Malaysian Government Portals and Websites’ annual rating exercise for the third consecutive year.
In view of the popularity of social media, the Bank has undertaken communication initiatives to engage stakeholders through this medium. These efforts saw an increase in the Bank’s Facebook fans to 28,965 (2012: 18,839) and in its Twitter followers to 34,936 (2012: 14,603). To engage with the younger community, the Bank is now actively using videos in educating them on financial matters. In collaboration with the Royal Malaysian Police, the Bank is leveraging on channels such as YouTube to disseminate information on financial crimes.
Greater knowledge sharing to improvestaff productivity The Bank continues to support knowledge sharing and collaboration amongst staff with a wide range of online content, ranging from highly technical briefs to purely social events. This is complemented by various social and formal face-to-face interactions in the Bank, often with the participation of industry and international members of the financial community. All these efforts have contributed towards creating a more conducive and enriching work environment.
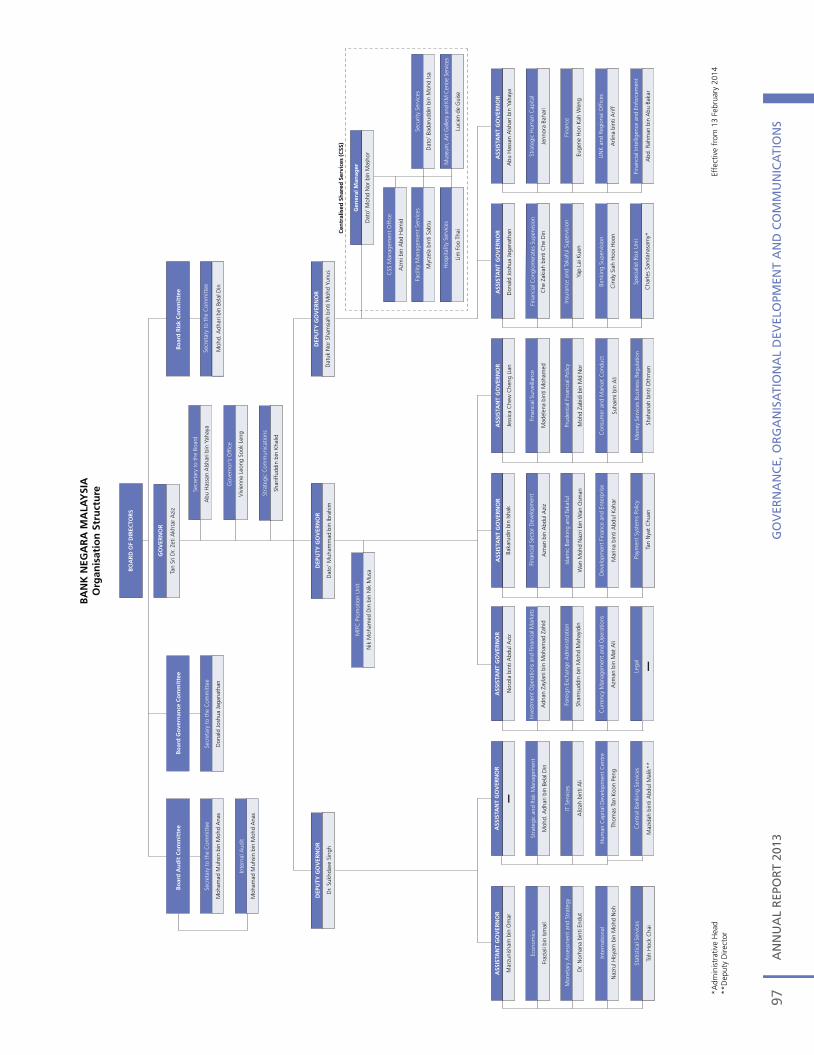
AN
NU
AL
REP
OR
T 20
13G
OV
ERN
AN
CE,
OR
GA
NIS
ATI
ON
AL
DEV
ELO
PMEN
T A
ND
CO
MM
UN
ICA
TIO
NS
97
*Adm
inis
trat
ive
Hea
d**
Dep
uty
Dire
ctor
Effe
ctiv
e fr
om 1
3 Fe
brua
ry 2
014
BA
NK
NEG
AR
A M
ALA
YSI
AO
rgan
isat
ion
Str
uct
ure
GO
VER
NO
R
Abu
Has
san
Als
hari
bin
Yaha
ya
Secr
etar
y to
the
Boa
rd
Viv
ienn
e Le
ong
Sook
Len
g
Gov
erno
r's
Off
ice
Shar
iffud
din
bin
Kha
lid
Stra
tegi
c C
omm
unic
atio
ns
Dat
uk N
or S
ham
siah
bin
ti M
ohd
Yunu
s
Cen
tral
ised
Sh
ared
Ser
vice
s (C
SS)
DEP
UTY
GO
VER
NO
R
Jess
ica
Che
w C
heng
Lia
n
ASS
ISTA
NT
GO
VER
NO
R
Mad
elen
a bi
nti M
oham
ed
Fina
ncia
l Sur
veill
ance
Cin
dy S
iah
Hoo
i Hoo
n
Moh
d Za
bidi
bin
Md
Nor
Prud
entia
l Fin
anci
al P
olic
y
Wan
Moh
d N
azri
bin
Wan
Osm
an
Isla
mic
Ban
king
and
Tak
aful
ASS
ISTA
NT
GO
VER
NO
R
Suha
imi b
in A
li
Con
sum
er a
nd M
arke
t C
ondu
ct
Shah
aria
h bi
nti O
thm
an
Mon
ey S
ervi
ces
Busi
ness
Reg
ulat
ion
Don
ald
Josh
ua J
agan
atha
n
ASS
ISTA
NT
GO
VER
NO
R
Che
Zak
iah
bint
i Che
Din
Fina
ncia
l Con
glom
erat
es S
uper
visi
on
Yap
Lai K
uen
Insu
ranc
e an
d Ta
kafu
l Sup
ervi
sion
Bank
ing
Supe
rvis
ion
Cha
rles
Sand
anas
amy*
Spec
ialis
t Ri
sk U
nit
Abu
Has
san
Als
hari
bin
Yaha
ya
ASS
ISTA
NT
GO
VER
NO
R
Euge
ne H
on K
ah W
eng
Fina
nce
LIN
K a
nd R
egio
nal O
ffic
es
Stra
tegi
c H
uman
Cap
ital
Jenn
ora
Baha
ri
Arli
na b
inti
Arif
f
Fina
ncia
l Int
ellig
ence
and
Enf
orce
men
t
Abd
. Rah
man
bin
Abu
Bak
ar
Mar
zuni
sham
bin
Om
ar
ASS
ISTA
NT
GO
VER
NO
R
Dat
o’ M
ohd
Nor
bin
Mas
hor
Gen
eral
Man
ager
Dr.
Sukh
dave
Sin
gh
DEP
UTY
GO
VER
NO
R
Dat
o’ M
uham
mad
bin
Ibra
him
DEP
UTY
GO
VER
NO
R
Nik
Moh
amed
Din
bin
Nik
Mus
a
MIF
C P
rom
otio
n U
nit
Dr.
Nor
hana
bin
ti En
dut
Mon
etar
y A
sses
smen
t an
d St
rate
gy
Aliz
ah b
inti
Ali
IT S
ervi
ces
Fraz
iali
bin
Ism
ail
Econ
omic
s
Moh
d. A
dhar
i bin
Bel
al D
in
Stra
tegi
c an
d Ri
sk M
anag
emen
t
Naz
rul H
isya
m b
in M
ohd
Noh
Inte
rnat
iona
l
Thom
as T
an K
oon
Peng
Hum
an C
apita
l Dev
elop
men
t C
entr
e
BO
AR
D O
F D
IREC
TOR
S
Moh
d. A
dhar
i bin
Bel
al D
in
Secr
etar
y to
the
Com
mitt
ee
Bo
ard
Ris
k C
om
mit
tee
Don
ald
Josh
ua J
agan
atha
n
Secr
etar
y to
the
Com
mitt
ee
Moh
amad
Muh
sin
bin
Moh
d A
nas
Secr
etar
y to
the
Com
mitt
ee
Moh
amad
Muh
sin
bin
Moh
d A
nas
Inte
rnal
Aud
it
Bo
ard
Go
vern
ance
Co
mm
itte
eB
oar
d A
ud
it C
om
mit
tee
Tan
Sri D
r. Ze
ti A
khta
r A
ziz
Sham
sudd
in b
in M
ohd
Mah
ayid
in
Fore
ign
Exch
ange
Adm
inis
trat
ion
Azm
an b
in M
at A
li
Cur
renc
y M
anag
emen
t an
d O
pera
tions
Lega
l
Baka
rudi
n bi
n Is
hak
Fina
ncia
l Sec
tor
Dev
elop
men
t
Azn
an b
in A
bdul
Azi
z
ASS
ISTA
NT
GO
VER
NO
R
Azm
i bin
Abd
Ham
id
CSS
Man
agem
ent
Off
ice
Lim
Foo
Tha
i
Hos
pita
lity
Serv
ices
Faci
lity
Man
agem
ent
Serv
ices
Myr
zela
bin
ti Sa
btu
Luci
en d
e G
uise
Mus
eum
, Art
Gal
lery
and
KM
Cen
tre
Serv
ices
Secu
rity
Serv
ices
Dat
o’ B
adar
uddi
n bi
n M
ohd
Isa
Dev
elop
men
t Fi
nanc
e an
d En
terp
rise
Mar
ina
bint
i Abd
ul K
ahar
Tan
Nya
t C
huan
Paym
ent
Syst
ems
Polic
y
Adn
an Z
ayla
ni b
in M
oham
ad Z
ahid
Inve
stm
ent
Ope
ratio
ns a
nd F
inan
cial
Mar
kets
Nor
zila
bin
ti A
bdul
Azi
z
ASS
ISTA
NT
GO
VER
NO
R
Stat
istic
al S
ervi
ces
Toh
Hoc
k C
hai
Cen
tral
Ban
king
Ser
vice
s
Maz
idah
bin
ti A
bdul
Mal
ik**

AN
NU
AL R
EPOR
T 2013G
OV
ERN
AN
CE, O
RG
AN
ISATIO
NA
L DEV
ELOPM
ENT A
ND
CO
MM
UN
ICA
TION
S98
AN
NU
AL
REP
OR
T 20
13A
NN
UA
L FI
NA
NC
IAL
STA
TEM
ENTS
99
ANNUAL FINANCIAL STATEMENTS
105 Statement of Financial Position as at 31 December 2013
106 Income Statement for the Year Ended 31 December 2013
107 Notes to the Financial Statements

AN
NU
AL R
EPOR
T 2013A
NN
UA
L FINA
NC
IAL STA
TEMEN
TS100
101
AN
NU
AL
REP
OR
T 20
10A
NN
UA
L FI
NA
NC
IAL
STA
TEM
ENTS
REPORT OF THE AUDITOR GENERAL ON THE FINANCIAL STATEMENTS OF
BANK NEGARA MALAYSIAFOR THE YEAR ENDED 31 DECEMBER 2013
Report on the Financial Statements
I have audited the financial statements of Bank Negara Malaysia which comprise the Statement of Financial Position as at 31 December 2013 and Income Statement for the year then ended, a summary of significant accounting policies and other explanatory information.
Directors’ Responsibility for the Financial Statements
The directors are responsible for the preparation and fair presentation of the financial statements in accordance with the Central Bank of Malaysia Act 2009 and applicable financial reporting standards approved in Malaysia to the extent that it is, in the opinion of the directors, appropriate to do so, having regard to the objects and functions of the Bank. The directors are also responsible for such internal control as the management determines is necessary to enable the preparation of financial statements that are free from material misstatement or omission, whether due to fraud or error.
Auditor’s Responsibility
My responsibility is to express an opinion on the financial statements based on the audit. The audit has been carried out in accordance with the Audit Act 1957 and in conformity with the auditing standards approved in Malaysia. Those standards require that I comply with ethical requirements as well as to plan and perform the audit in order to obtain reasonable assurance that the financial statements are free from material misstatement or omission.
The audit involves performing procedures to obtain audit evidence on the amounts and disclosures in the financial statements. The procedures selected depend on the auditor’s judgment including the assessment of the risks of material misstatement or omission of the financial statements, whether due to fraud or error. In making those risk assessments, the auditor considers the internal control relevant to the preparation and presentation of the financial statements of Bank Negara Malaysia in order to design audit procedures that are appropriate in the circumstances, but not for the purpose of expressing an opinion on the effectiveness of the internal control of Bank Negara Malaysia. The audit also includes evaluating the appropriateness of accounting policies used and the reasonableness of accounting estimates made by the management, as well as evaluating the overall presentation of the financial statements.
I believe that the audit evidence I have obtained is sufficient and appropriate to provide a basis for my audit opinion.
ANNUAL FINANCIAL STATEMENTS
AN
NU
AL
REP
OR
T 20
1310
1
AN
NU
AL R
EPOR
T 2013A
NN
UA
L FINA
NC
IAL STA
TEMEN
TS102
(TAN SRI DATO’ SETIA HAJI AMBRIN BIN BUANG)AUDITOR GENERALMALAYSIA
PUTRAJAYA14 MARCH 2014
Opinion
In my opinion, the financial statements give a true and fair view of the financial position of Bank Negara Malaysia as at 31 December 2013 and of the financial performance and the results of its operations for the year ended, in all material respects, in accordance with the Central Bank of Malaysia Act 2009 and the financial reporting standards approved in Malaysia to the extent that it is, in the opinion of the directors, appropriate to do so, having regard to the objects and functions of the Bank. The preparation of the financial statements differ, in some aspects, from the approved accounting standards in Malaysia. In accordance with the requirements of Section 9 of the Act, I also report that in my opinion, the accounting records and other records required by the Act have been properly kept by Bank Negara Malaysia.

AN
NU
AL
REP
OR
T 20
13A
NN
UA
L FI
NA
NC
IAL
STA
TEM
ENTS
103
We, Zeti Akhtar Aziz and Oh Siew Nam, being the Chairman and one of the Directors of Bank Negara Malaysia, do hereby state that in the opinion of the Board, the financial statements are drawn up so as to give a true and fair view of the state of affairs of Bank Negara Malaysia as at 31 December 2013 and of the results of operations for the year ended on that date.
STATEMENT BY CHAIRMANAND ONE OF THE DIRECTORS
On behalf of the Board,
OH SIEW NAMDIRECTOR
12 MARCH 2014KUALA LUMPUR
On behalf of the Board,
ZETI AKHTAR AZIZCHAIRMAN
12 MARCH 2014KUALA LUMPUR
AN
NU
AL R
EPOR
T 2013A
NN
UA
L FINA
NC
IAL STA
TEMEN
TS104
I, Eugene Hon Kah Weng, being the officer primarily responsible for the financial management of Bank Negara Malaysia, do solemnly and sincerely declare that the financial statements, are to the best of my knowledge and belief, correct and I make this solemn declaration conscientiously believing the same to be true and by virtue of the provisions of the Statutory Declarations Act, 1960.
Subscribed and solemnly declared )by the abovenamed at Kuala Lumpur )this 12 March 2014. )
DECLARATION BY THE OFFICER PRIMARILY RESPONSIBLEFOR THE FINANCIAL MANAGEMENT OF BANK NEGARA MALAYSIA
Before me,
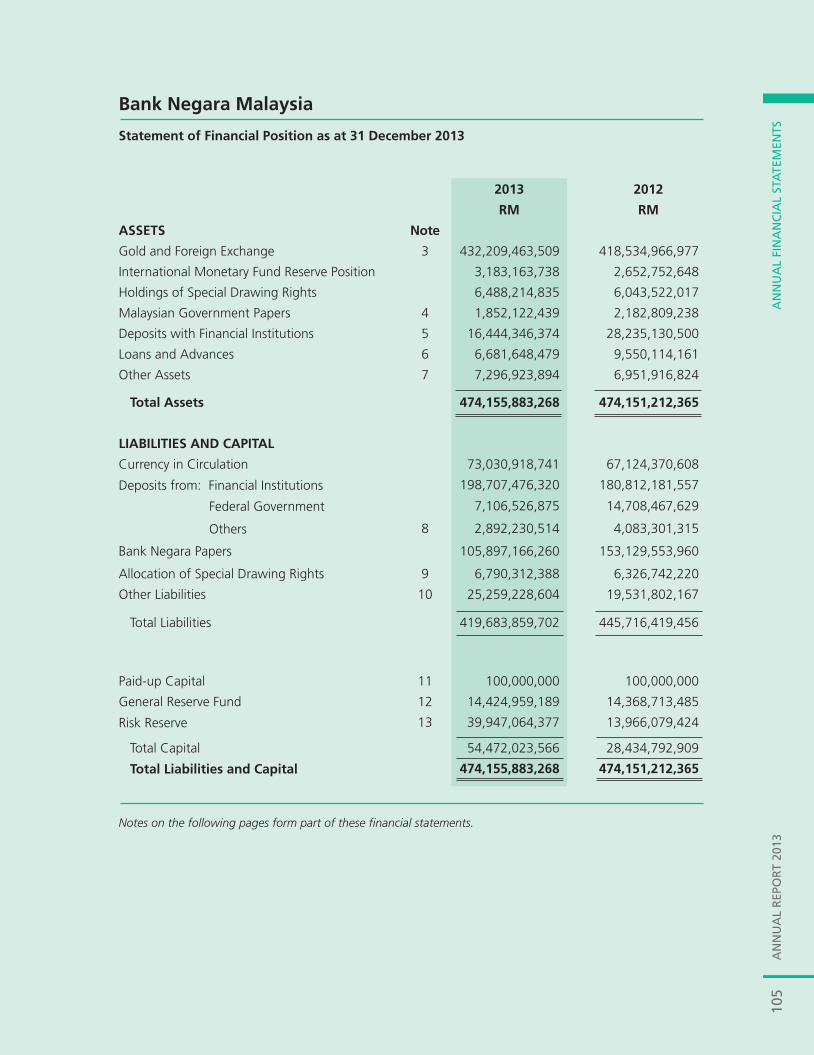
AN
NU
AL
REP
OR
T 20
13A
NN
UA
L FI
NA
NC
IAL
STA
TEM
ENTS
105
Bank Negara Malaysia
Statement of Financial Position as at 31 December 2013
2013 2012
RM RM
ASSETS Note
Gold and Foreign Exchange 3 432,209,463,509 418,534,966,977
International Monetary Fund Reserve Position 3,183,163,738 2,652,752,648
Holdings of Special Drawing Rights 6,488,214,835 6,043,522,017
Malaysian Government Papers 4 1,852,122,439 2,182,809,238
Deposits with Financial Institutions 5 16,444,346,374 28,235,130,500
Loans and Advances 6 6,681,648,479 9,550,114,161
Other Assets 7 7,296,923,894 6,951,916,824
Total Assets 474,155,883,268 474,151,212,365
LIABILITIES AND CAPITAL
Currency in Circulation 73,030,918,741 67,124,370,608
Deposits from: Financial Institutions 198,707,476,320 180,812,181,557
Federal Government 7,106,526,875 14,708,467,629
Others 8 2,892,230,514 4,083,301,315
Bank Negara Papers 105,897,166,260 153,129,553,960
Allocation of Special Drawing Rights 9 6,790,312,388 6,326,742,220
Other Liabilities 10 25,259,228,604 19,531,802,167
Total Liabilities 419,683,859,702 445,716,419,456
Paid-up Capital 11 100,000,000 100,000,000
General Reserve Fund 12 14,424,959,189 14,368,713,485
Risk Reserve 13 39,947,064,377 13,966,079,424
Total Capital 54,472,023,566 28,434,792,909
Total Liabilities and Capital 474,155,883,268 474,151,212,365
Notes on the following pages form part of these financial statements.
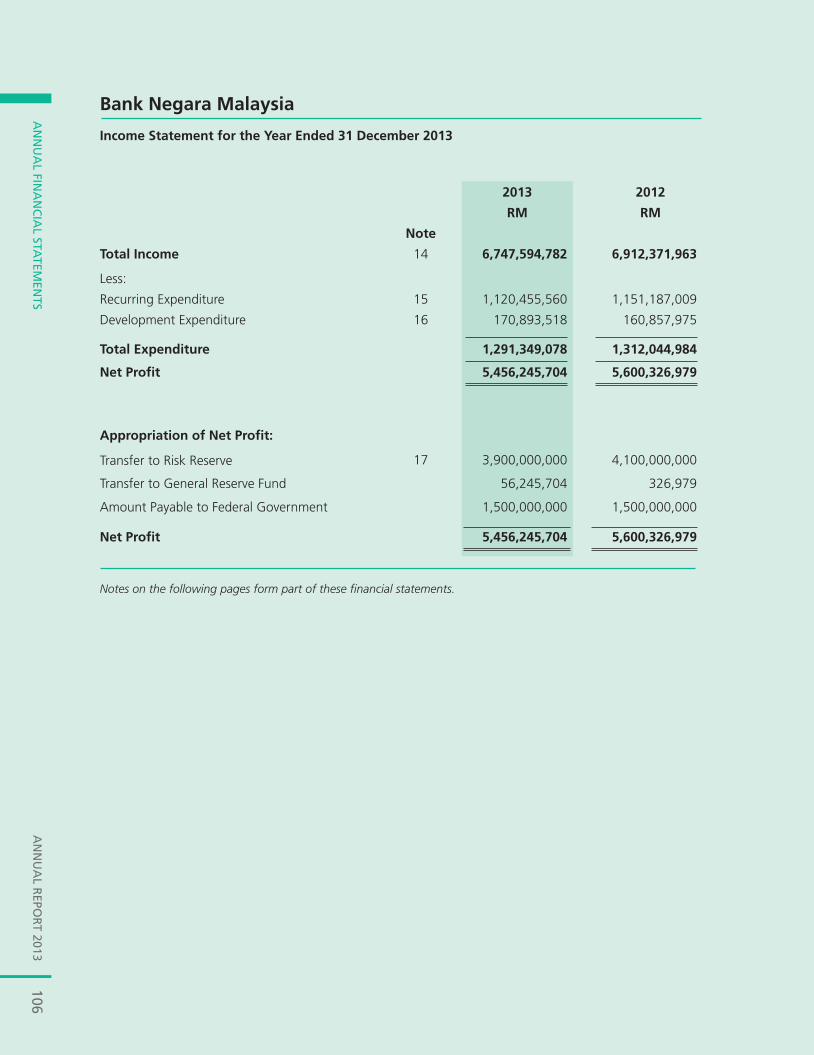
AN
NU
AL R
EPOR
T 2013A
NN
UA
L FINA
NC
IAL STA
TEMEN
TS106
Bank Negara Malaysia
Income Statement for the Year Ended 31 December 2013
2013 2012
RM RM
Note
Total Income 14 6,747,594,782 6,912,371,963
Less:
Recurring Expenditure 15 1,120,455,560 1,151,187,009
Development Expenditure 16 170,893,518 160,857,975
Total Expenditure 1,291,349,078 1,312,044,984
Net Profit 5,456,245,704 5,600,326,979
Appropriation of Net Profit:
Transfer to Risk Reserve 17 3,900,000,000 4,100,000,000
Transfer to General Reserve Fund 56,245,704 326,979
Amount Payable to Federal Government 1,500,000,000 1,500,000,000
Net Profit 5,456,245,704 5,600,326,979
Notes on the following pages form part of these financial statements.
AN
NU
AL
REP
OR
T 20
13A
NN
UA
L FI
NA
NC
IAL
STA
TEM
ENTS
107
Notes to the Financial Statements for the Year Ended 31 December 2013
1. General Information Bank Negara Malaysia (the Bank) is a statutory body established under the Central Bank of Malaysia
Act 1958 which has been repealed by the Central Bank of Malaysia Act 2009. The principal place of business is located at Bank Negara Malaysia, Jalan Dato’ Onn, 50480 Kuala Lumpur.
The principal objects of the Bank are to promote monetary stability and financial stability conducive to the sustainable growth of the Malaysian economy. In this regard, the Bank’s primary functions are as follows:
(a) to formulate and conduct monetary policy in Malaysia; (b) to issue currency in Malaysia; (c) to regulate and supervise financial institutions which are subject to the laws enforced by the Bank; (d) to provide oversight over money and foreign exchange markets; (e) to exercise oversight over payment systems; (f) to promote a sound, progressive and inclusive financial system; (g) to hold and manage the foreign reserves of Malaysia; (h) to promote an exchange rate regime consistent with the fundamentals of the economy; and (i) to act as financial adviser, banker and financial agent of the Government.
The Board of Directors approved the annual financial statements on 11 March 2014.
2. Accounting Policies The principal accounting policies applied in the preparation of these financial statements are set out
below. These accounting policies are consistently applied to both of the financial years presented, unless otherwise stated.
2.1 Basis of Preparation of Financial Statements
(a) These financial statements have been prepared in accordance with the Central Bank of Malaysia Act 2009 and applicable Malaysian Financial Reporting Standards (MFRS). Section 10 of the Central Bank of Malaysia Act 2009 provides that the Bank, in preparing its financial statements, shall comply with accounting standards to the extent that it is, in the opinion of the Bank, appropriate to do so, having regard to the objects and functions of the Bank. The Bank, having considered its responsibilities for the formulation and conduct of effective monetary policy, is of the opinion that, it is appropriate to differ, in some aspects, from the MFRS.
(b) The preparation of the financial statements in conformity with the requirements of the MFRS requires the management to make judgements, estimates and assumptions based on available information that may affect the application of accounting policies and the reported amounts of assets and liabilities as well as disclosure of contingent assets and liabilities at the date of the financial statements, and the reported amounts of income and expenses during the financial year. Although these estimates are based on the management’s best knowledge of current events and actions, the actual results could differ from those estimates.
2.2 Measurement Base and Basis of Accounting The financial statements have been prepared on an accrual basis, using the historical cost
convention, except as otherwise disclosed.

AN
NU
AL R
EPOR
T 2013A
NN
UA
L FINA
NC
IAL STA
TEMEN
TS108
2.3 Foreign Currency Translation(a) The financial statements have been prepared using ringgit Malaysia, the currency of the
primary economic environment in which the Bank operates.(b) Assets and liabilities in foreign currencies are translated into ringgit Malaysia at the rates of
exchange prevailing on the balance sheet date. Transactions in foreign currencies during the year are measured in ringgit Malaysia at the rates of exchange prevailing on the value dates.
(c) The unrealised revaluation gains or losses arising from changes in the exchange rates are recognised in Risk Reserve.
2.4 Securities and Investments Securities and investments are stated mainly at cost and provisions are made for diminution in
value as at 31 December 2013. Financial instruments classified as Available-For-Sale are stated at fair value and the unrealised revaluation gains or losses arising from changes in market prices are recognised in Risk Reserve.
2.5 Net Profit The net profit of the Bank is appropriated in accordance with section 7 of the Central Bank of
Malaysia Act 2009 and only realised gains are available for distribution.
2.6 Repurchase and Reverse-Repurchase Agreements The amount borrowed under repurchase agreements is reported under `Other Liabilities´ while
the amount lent under reverse-repurchase agreements is reported under `Other Assets´. The difference between the amount received and the amount paid under repurchase and reverse-repurchase agreements is recognised as interest expense and interest income respectively on a straight-line basis.
2.7 Fixed Assets The capital expenditure incurred on fixed assets are written down to nominal value or written off
completely in the year of acquisition.
3. Gold and Foreign Exchange 2013 2012 RM RM Foreign Securities 370,973,012,213 369,087,355,757
Foreign Deposits 13,753,641,155 10,382,364,133 Balances with Other Central Banks, Bank for International Settlements (BIS) and International Monetary Fund (IMF) 14,656,338,583 7,123,144,900 Others 32,826,471,558 31,942,102,187 432,209,463,509 418,534,966,977 4. Malaysian Government Papers Malaysian Government Papers refer to holdings of Government debt instruments that were among the
instruments that can be used in the Bank’s monetary policy operations.
2013 2012 RM RM Malaysian Government Securities 1,852,122,439 2,176,401,438 Sukuk 1Malaysia 2010 – 6,407,800
1,852,122,439 2,182,809,238
AN
NU
AL
REP
OR
T 20
13A
NN
UA
L FI
NA
NC
IAL
STA
TEM
ENTS
109
5. Deposits with Financial Institutions Deposits with financial institutions comprise deposits placed by the Bank with financial institutions
under section 75(i) and section 100 of the Central Bank of Malaysia Act 2009.
6. Loans and Advances Loans and advances comprise mainly advances extended by the Bank to the participating institutions
under various schemes such as Fund for Small and Medium Industries and New Entrepreneur Fund aimed at promoting growth and development of small and medium business establishments. The extensions of these advances are mainly provided under section 48, section 49 and section 100 of the Central Bank of Malaysia Act 2009.
7. Other Assets Other assets include investments in shares and bonds of RM4,662,873,384 acquired under section 48(1)
and section 100 of the Central Bank of Malaysia Act 2009.
8. Deposits from Others A substantial part of these deposits comprises deposits from national institutions, government
agencies and public authorities.
9. Allocation of Special Drawing Rights IMF member countries are allocated Special Drawing Rights (SDR) in proportion to their subscription
to the IMF. The allocation represents a dormant liability of the Bank to the IMF, against which assets are received in SDR from the IMF. The net cumulative allocation of SDR was SDR1,346,143,721 equivalent to RM6,790,312,388.
10. Other Liabilities Other liabilities include mainly placements by financial institutions under the repurchase agreements.
11. Paid-up Capital The paid-up capital of RM100,000,000 is owned by the Government of Malaysia.
12. General Reserve Fund 2013 2012 RM RM As at 1 January 14,368,713,485 14,368,386,506 Transfer from Net Profit 56,245,704 326,979 As at 31 December 14,424,959,189 14,368,713,485 13. Risk Reserve This reserve is to account for unrealised revaluation gains or losses arising from changes in exchange
rates and market prices and to absorb any potential future losses resulting from unfavourable circumstances not within the control of the Bank.
14. Total Income Total income comprises revenue from foreign reserves management which includes interest and
dividends, non-treasury income, realised capital gains or losses, and is stated at net of amortisation/accretion of premiums/discounts and monetary policy cost.
AN
NU
AL R
EPOR
T 2013A
NN
UA
L FINA
NC
IAL STA
TEMEN
TS110
15. Recurring Expenditure Recurring expenditure are expenses incurred in the management and administration of the day-to-day
operations of the Bank.
16. Development Expenditure Development expenditure are expenses incurred mainly to finance developmental and long term
projects undertaken by the Bank that are in line with its principal objects and functions.
17. Transfer to Risk Reserve The transfer to Risk Reserve is made in accordance with section 7 of the Central Bank of Malaysia Act 2009.
18. Contingencies and Commitments 18.1 Contingent Assets Total contingent assets as at 31 December 2013 amounted to RM1,400,000,000. These comprise
the Bank’s total contributions to International Centre for Leadership in Finance (ICLIF) Trust Fund of RM800,000,000 and International Centre for Education in Islamic Finance (INCEIF) Trust Fund of RM600,000,000, to finance activities related to training, research and development of human resource in banking and financial services managed by The ICLIF Leadership and Governance Centre and INCEIF. It is provided in the Trust Deeds that the total contributions will be returned to the Bank when the Centres become self-sufficient in the future.
18.2 Commitments Total commitments as at 31 December 2013 comprise the following: (a) Membership with IMF
(i) The Bank has an obligation to pay to IMF an equivalent amount of RM5,794,633,148 in SDR or other convertible currencies which represents the unpaid portion of Malaysia’s
quota in the IMF under the Articles of Agreement. (ii) On 15 December 2010, in accordance with the Board of Governors Resolution No. 66-2, the IMF adopted the ``Fourteenth General Review of Quotas and Reform of the
Executive Board´´ under which the quotas of members of the Fund shall be increased. As at 31 December 2013, from the current level of quota of SDR1,773,900,000, Malaysia has consented to the increase of its quota to SDR3,633,800,000 (equivalent to RM18,329,868,326).
(iii) The Bank has participated in the New Arrangements to Borrow (NAB), a set of credit arrangements between the IMF and its member countries to provide supplementary source of financing to IMF for the purpose of safeguarding the stability of the international monetary system. As at 31 December 2013, the amount that can be called for under the NAB credit arrangement is SDR295,881,875 (equivalent to RM1,492,508,066).
(iv) On 23 July 2012, the Bank has pledged a USD1,000,000,000 (equivalent to RM3,275,500,000) bilateral contribution to the IMF for precautionary and financial crisis resolution purposes.
(b) Investment with Bank for International SettlementsThere is an uncalled portion of the 3,220 units of shares held by the Bank in the BIS which amounted to RM60,909,560. The amount is based on the nominal value (SDR5,000) of the uncalled portion and SDR rate as at the balance sheet date.
AN
NU
AL
REP
OR
T 20
13A
NN
UA
L FI
NA
NC
IAL
STA
TEM
ENTS
111
(c) Swap Arrangements (i) ASEAN Swap Arrangement The Bank has participated in the multilateral ASEAN Swap Arrangement (ASA) together
with other ASEAN central banks and monetary authorities to provide short-term foreign currency liquidity support to member countries with balance of payments difficulties. As at 31 December 2013, the Bank’s total commitment amounted to USD300 million (equivalent to RM982.7 million) and there was no request for liquidity support under ASA from any member country during the financial year.
(ii) Bilateral Currency Swap Arrangement (a) On 8 February 2012, the Bank renewed the Bilateral Currency Swap Arrangement
(BCSA) agreement with the People’s Bank of China with the objective of promoting and facilitating trade settlement in local currency between the two countries. As at 31 December 2013, the Bank’s total commitment under the BCSA is RM90 billion and there has been no request to activate the BCSA during the financial year.
(b) On 20 October 2013, the Bank signed BCSA agreement with the Bank of Korea
with the objective of promoting bilateral trade and facilitating trade settlement in local currency between the two countries. As at 31 December 2013, the Bank’s total commitment under the BCSA is RM15 billion and there has been no request to activate the BCSA during the financial year.
(iii) Chiang Mai Initiative Multilateralisation Arrangement The Bank has participated in the Chiang Mai Initiative Multilateralisation (CMIM)
arrangement to provide financial support to ASEAN+3 member countries facing balance of payments and short-term liquidity difficulties. The effective date of the CMIM Agreement is 24 March 2010. Under the CMIM arrangement, member countries facing balance of payments and short-term liquidity constraints can obtain financial support in US dollar through swap arrangements against their respective local currencies. As at 31 December 2013, the Bank’s total commitment is USD9.1 billion (equivalent to RM29.8 billion). For the financial year ended 31 December 2013, there was no request for liquidity support from any member country.
19. Financial Risk Management The Reserve Management Committee oversees the assessment, measurement and the control of
the investment risks in the management of reserves to be within acceptable levels to ensure that the objectives of capital preservation, liquidity and return are met. In undertaking this function, the major risks of the investments fall into the following areas:
(a) Market RiskMarket risk is the exposure of the Bank’s investments to adverse movements in market prices such as foreign exchange rates, interest rates and equity prices. Market risk is assessed and monitored on a daily basis and all of the investments and instruments are valued marked-to-market. A benchmark policy approved by the Board of Directors reflects the long-term objectives and acceptable risk-return profile of the investments. Investments may be made in instruments that are different than the benchmark. This deviation in investment is controlled through a set of risk management limits and investment guidelines that is also approved by the Board of Directors. Sensitivity analysis and stress testing are undertaken to assess emerging risk and potential marked-to-market losses from adverse movements and volatility in the market, as well as liquidity conditions.
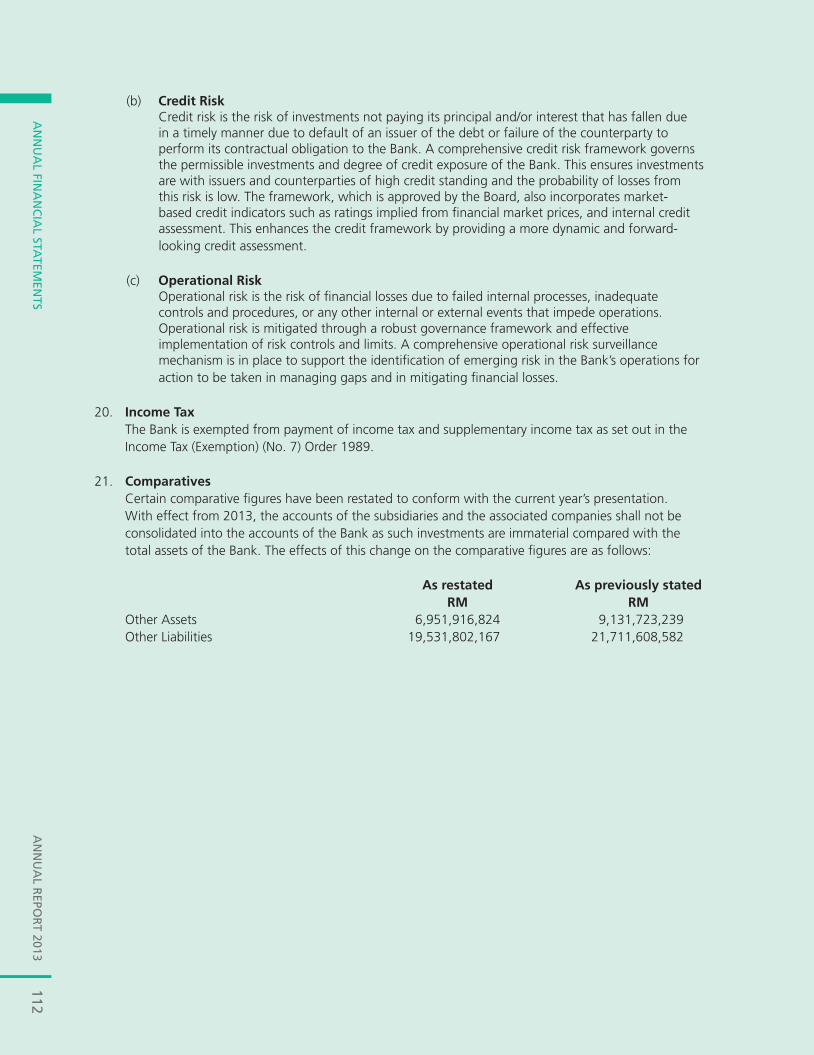
AN
NU
AL R
EPOR
T 2013A
NN
UA
L FINA
NC
IAL STA
TEMEN
TS112
(b) Credit RiskCredit risk is the risk of investments not paying its principal and/or interest that has fallen due in a timely manner due to default of an issuer of the debt or failure of the counterparty to perform its contractual obligation to the Bank. A comprehensive credit risk framework governs the permissible investments and degree of credit exposure of the Bank. This ensures investments are with issuers and counterparties of high credit standing and the probability of losses from this risk is low. The framework, which is approved by the Board, also incorporates market-based credit indicators such as ratings implied from financial market prices, and internal credit assessment. This enhances the credit framework by providing a more dynamic and forward-looking credit assessment.
(c) Operational RiskOperational risk is the risk of financial losses due to failed internal processes, inadequate controls and procedures, or any other internal or external events that impede operations. Operational risk is mitigated through a robust governance framework and effective implementation of risk controls and limits. A comprehensive operational risk surveillance mechanism is in place to support the identification of emerging risk in the Bank’s operations for action to be taken in managing gaps and in mitigating financial losses.
20. Income Tax The Bank is exempted from payment of income tax and supplementary income tax as set out in the
Income Tax (Exemption) (No. 7) Order 1989.
21. Comparatives Certain comparative figures have been restated to conform with the current year’s presentation.
With effect from 2013, the accounts of the subsidiaries and the associated companies shall not be consolidated into the accounts of the Bank as such investments are immaterial compared with the total assets of the Bank. The effects of this change on the comparative figures are as follows:
As restated As previously stated RM RM
Other Assets 6,951,916,824 9,131,723,239 Other Liabilities 19,531,802,167 21,711,608,582

AN
NU
AL
REP
OR
T 20
13A
NN
EXP
i
ANNEX

AN
NU
AL R
EPOR
T 2013A
NN
EXP ii
AN
NU
AL
REP
OR
T 20
13A
NN
EX
cONTENTs
Key Economic and Financial statistics
National AccountsA.1 Gross Domestic Product by Kind of Economic Activity at Constant 2005 Prices P 1A.2 Services Sector Performance at Constant 2005 Prices P 1A.3 Growth in Manufacturing Production (2005=100) P 2A.4 GNI by Demand Aggregates P 3A.5 Savings-Investment Gap P 4A.6 Labour Market: Selected Indicators P 5A.7 Private Consumption Indicators P 6A.8 Private Investment Indicators P 7
External sectorA.9 Balance of Payments P 8A.10 Gross Export P 10A.11 Exports of Primary Commodities P 11A.12 Principal Markets for Manufactured Exports P 12A.13 Principal Export Markets for Electronics P 13A.14 Principal Export Markets for Electrical Products P 13A.15 Principal Export Markets for Chemicals and Chemical Products P 14A.16 Principal Export Markets for Palm Oil P 15A.17 Principal Export Markets for Rubber P 16A.18 Principal Export Markets for Crude Oil P 17A.19 Principal Export Markets for LNG P 17A.20 External Debt and Debt Servicing P 18
Monetary and Financial IndicatorsA.21 Consumer Price Index P 19A.22 Producer Price Index P 19A.23 Broad Money (M3) P 20A.24 Money Supply: Annual Change and Growth Rates P 21A.25 Interest Rates (%) P 22A.26 Movements of the Ringgit P 23A.27 Housing Credit Institutions P 24A.28 Housing Loans Outstanding P 25A.29 Housing Loans Approved P 25A.30 Financing of the Economy P 26
Public FinanceA.31 Consolidated Public Sector Finance P 27
selected International Economic IndicatorsA.32 Major Advanced Economies: Key Economic Indicators P 28A.33 Emerging Asia: Key Economic Indicators P 29

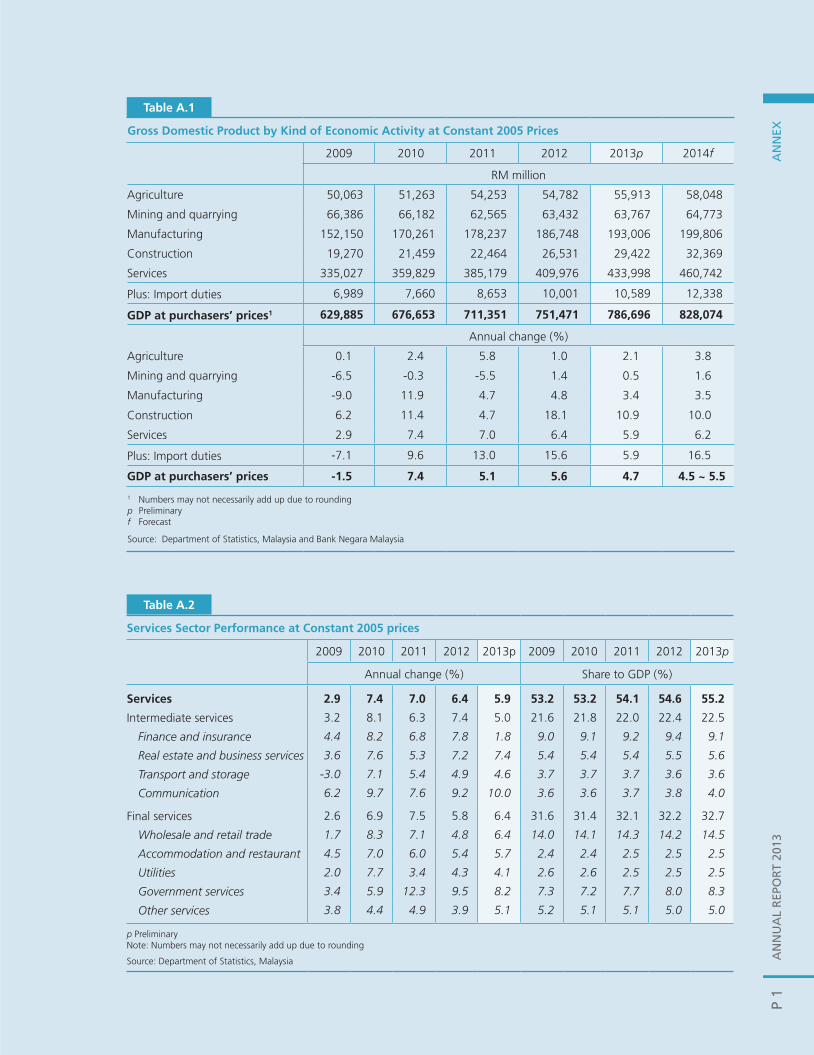
AN
NU
AL
REP
OR
T 20
13A
NN
EXP
11
Annex
Gross Domestic Product by Kind of Economic Activity at constant 2005 Prices
2009 2010 2011 2012 2013p 2014f
RM million
Agriculture 50,063 51,263 54,253 54,782 55,913 58,048
Mining and quarrying 66,386 66,182 62,565 63,432 63,767 64,773
Manufacturing 152,150 170,261 178,237 186,748 193,006 199,806
Construction 19,270 21,459 22,464 26,531 29,422 32,369
Services 335,027 359,829 385,179 409,976 433,998 460,742
Plus: Import duties 6,989 7,660 8,653 10,001 10,589 12,338
GDP at purchasers’ prices1 629,885 676,653 711,351 751,471 786,696 828,074
Annual change (%)
Agriculture 0.1 2.4 5.8 1.0 2.1 3.8
Mining and quarrying -6.5 -0.3 -5.5 1.4 0.5 1.6
Manufacturing -9.0 11.9 4.7 4.8 3.4 3.5
Construction 6.2 11.4 4.7 18.1 10.9 10.0
Services 2.9 7.4 7.0 6.4 5.9 6.2
Plus: Import duties -7.1 9.6 13.0 15.6 5.9 16.5
GDP at purchasers’ prices -1.5 7.4 5.1 5.6 4.7 4.5 ~ 5.5
1 Numbers may not necessarily add up due to roundingp Preliminaryf Forecast
Source: Department of Statistics, Malaysia and Bank Negara Malaysia
Table A.1
Annex
1
services sector Performance at constant 2005 prices
2009 2010 2011 2012 2013p 2009 2010 2011 2012 2013p
Annual change (%) Share to GDP (%)
services 2.9 7.4 7.0 6.4 5.9 53.2 53.2 54.1 54.6 55.2
Intermediate services 3.2 8.1 6.3 7.4 5.0 21.6 21.8 22.0 22.4 22.5
Finance and insurance 4.4 8.2 6.8 7.8 1.8 9.0 9.1 9.2 9.4 9.1
Real estate and business services 3.6 7.6 5.3 7.2 7.4 5.4 5.4 5.4 5.5 5.6
Transport and storage -3.0 7.1 5.4 4.9 4.6 3.7 3.7 3.7 3.6 3.6
Communication 6.2 9.7 7.6 9.2 10.0 3.6 3.6 3.7 3.8 4.0
Final services 2.6 6.9 7.5 5.8 6.4 31.6 31.4 32.1 32.2 32.7
Wholesale and retail trade 1.7 8.3 7.1 4.8 6.4 14.0 14.1 14.3 14.2 14.5
Accommodation and restaurant 4.5 7.0 6.0 5.4 5.7 2.4 2.4 2.5 2.5 2.5
Utilities 2.0 7.7 3.4 4.3 4.1 2.6 2.6 2.5 2.5 2.5
Government services 3.4 5.9 12.3 9.5 8.2 7.3 7.2 7.7 8.0 8.3
Other services 3.8 4.4 4.9 3.9 5.1 5.2 5.1 5.1 5.0 5.0
p PreliminaryNote: Numbers may not necessarily add up due to rounding
Source: Department of Statistics, Malaysia
Table A.2

AN
NU
AL R
EPOR
T 2013A
NN
EXP 2
Annex
1
Growth in Manufacturing Production (2005=100)
2010 2011 2012 2013 2011 2012 2013
Index Annual change (%)
Export-oriented industries 107.1 110.8 115.2 118.1 3.4 3.9 2.5Electronics and electrical products cluster 97.7 94.2 96.3 100.2 -3.6 2.2 4.0
Electronics 88.1 77.8 81.1 89.3 -11.7 4.2 10.2Electrical products 116.5 126.3 126.1 121.4 8.4 -0.2 -3.7
Primary-related cluster 113.5 121.9 127.9 130.1 7.4 4.9 1.8Chemicals and chemical products 117.9 128.3 139.0 146.8 8.8 8.4 5.6Petroleum products 113.7 120.7 125.9 121.3 6.2 4.3 -3.7Textiles, wearing apparel and footwear 83.8 92.5 85.7 88.1 10.4 -7.4 2.8Wood and wood products 84.9 79.9 85.7 84.9 -5.9 7.2 -1.0Rubber products 150.2 171.0 176.2 196.9 13.9 3.0 11.7Off-estate processing 110.0 119.6 119.6 121.6 8.7 0.0 1.7Paper products 125.8 140.4 135.8 130.0 11.6 -3.3 -4.2
Domestic-oriented industries 132.5 143.3 155.2 163.6 8.2 8.3 5.4construction-related cluster 133.7 157.1 170.5 175.7 17.6 8.5 3.0Construction-related products 116.8 132.0 133.1 128.5 13.0 0.9 -3.4
Non-metallic mineral products 121.7 148.0 155.4 142.7 21.6 5.0 -8.2Basic iron & steel and
non-ferrous metals 110.9 112.4 105.9 111.2 1.4 -5.8 5.0Fabricated metal products 166.3 205.9 242.8 266.9 23.8 18.0 9.9consumer-related cluster 131.6 133.4 144.1 154.8 1.3 8.1 7.4Food products 133.8 140.1 152.3 156.7 4.7 8.7 2.9Transport equipment 132.3 126.7 144.3 167.0 -4.3 13.9 15.8Beverages 150.4 163.0 158.0 156.1 8.4 -3.0 -1.3Tobacco products 88.2 98.6 109.0 89.4 11.8 10.6 -18.0Others 115.4 114.0 112.7 124.8 -1.2 -1.1 10.7
Total 112.2 117.2 123.1 127.1 4.5 5.0 3.2
Source: Department of Statistics, Malaysia
Table A.3
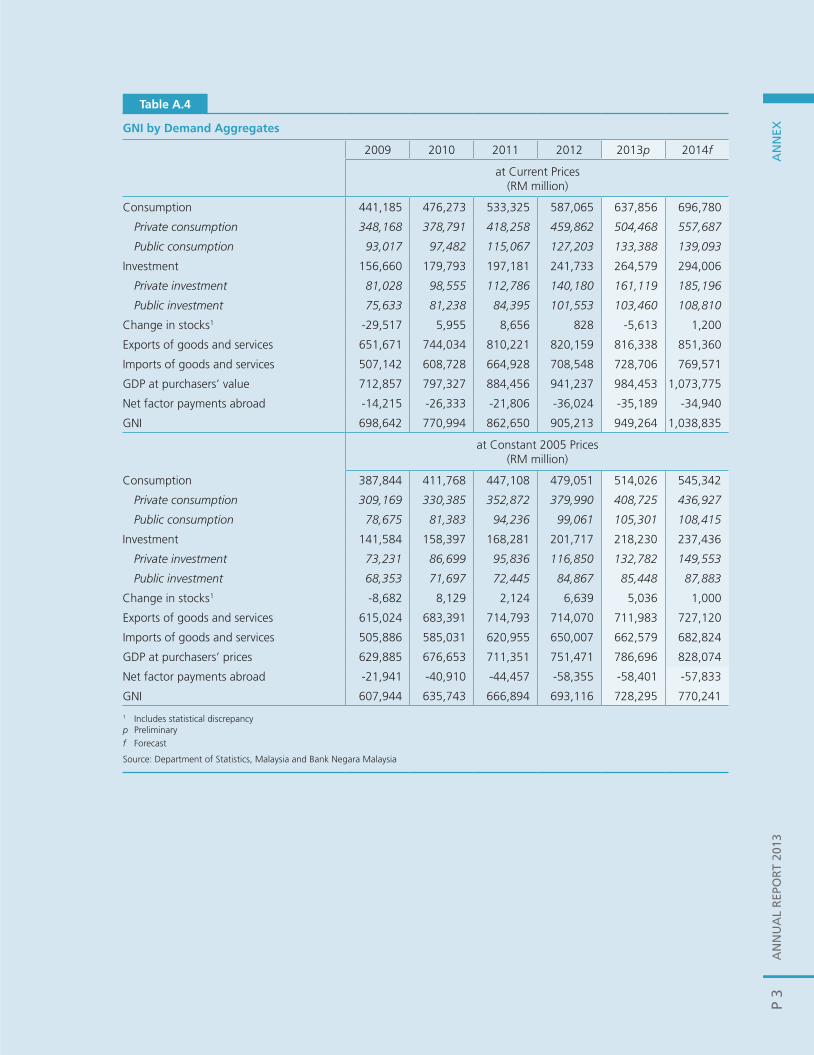
AN
NU
AL
REP
OR
T 20
13A
NN
EXP
3
1
GNI by Demand Aggregates
2009 2010 2011 2012 2013p 2014f
at Current Prices(RM million)
Consumption 441,185 476,273 533,325 587,065 637,856 696,780
Private consumption 348,168 378,791 418,258 459,862 504,468 557,687
Public consumption 93,017 97,482 115,067 127,203 133,388 139,093
Investment 156,660 179,793 197,181 241,733 264,579 294,006
Private investment 81,028 98,555 112,786 140,180 161,119 185,196
Public investment 75,633 81,238 84,395 101,553 103,460 108,810
Change in stocks1 -29,517 5,955 8,656 828 -5,613 1,200
Exports of goods and services 651,671 744,034 810,221 820,159 816,338 851,360
Imports of goods and services 507,142 608,728 664,928 708,548 728,706 769,571
GDP at purchasers’ value 712,857 797,327 884,456 941,237 984,453 1,073,775
Net factor payments abroad -14,215 -26,333 -21,806 -36,024 -35,189 -34,940
GNI 698,642 770,994 862,650 905,213 949,264 1,038,835
at Constant 2005 Prices (RM million)
Consumption 387,844 411,768 447,108 479,051 514,026 545,342
Private consumption 309,169 330,385 352,872 379,990 408,725 436,927
Public consumption 78,675 81,383 94,236 99,061 105,301 108,415
Investment 141,584 158,397 168,281 201,717 218,230 237,436
Private investment 73,231 86,699 95,836 116,850 132,782 149,553
Public investment 68,353 71,697 72,445 84,867 85,448 87,883
Change in stocks1 -8,682 8,129 2,124 6,639 5,036 1,000
Exports of goods and services 615,024 683,391 714,793 714,070 711,983 727,120
Imports of goods and services 505,886 585,031 620,955 650,007 662,579 682,824
GDP at purchasers’ prices 629,885 676,653 711,351 751,471 786,696 828,074
Net factor payments abroad -21,941 -40,910 -44,457 -58,355 -58,401 -57,833
GNI 607,944 635,743 666,894 693,116 728,295 770,241
1 Includes statistical discrepancyp Preliminaryf Forecast
Source: Department of Statistics, Malaysia and Bank Negara Malaysia
Table A.4
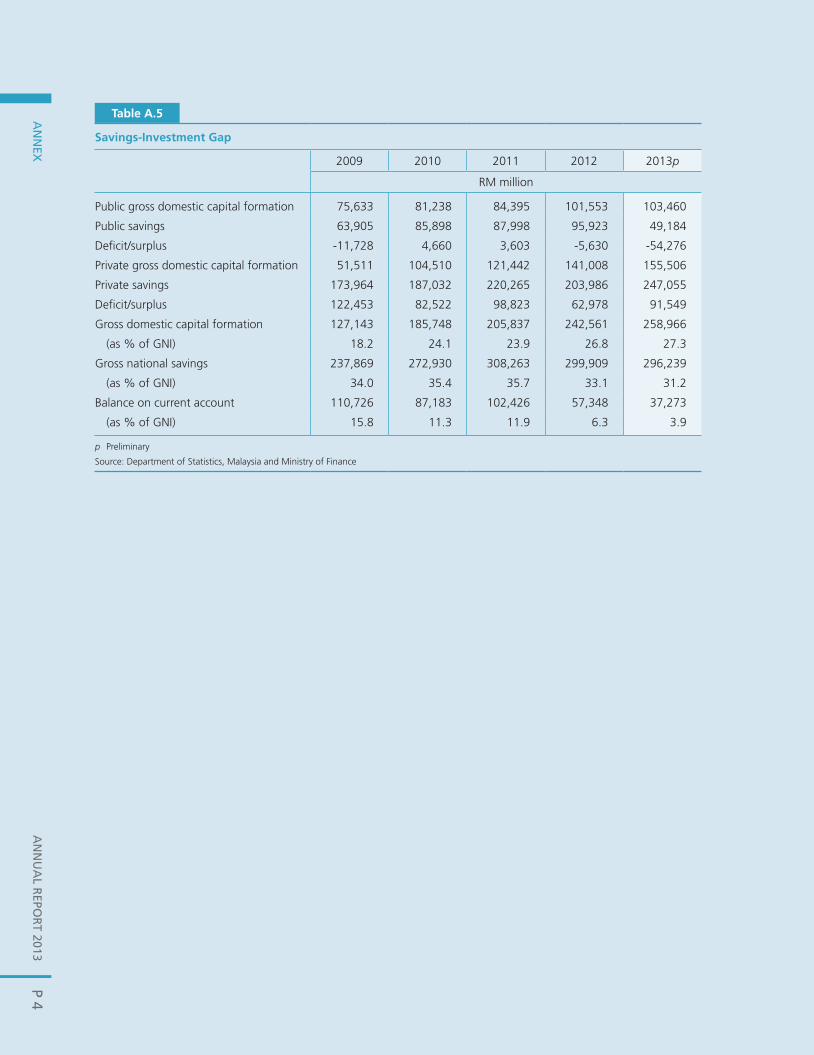
AN
NU
AL R
EPOR
T 2013A
NN
EXP 4
1
savings-Investment Gap
2009 2010 2011 2012 2013p
RM million
Public gross domestic capital formation 75,633 81,238 84,395 101,553 103,460
Public savings 63,905 85,898 87,998 95,923 49,184
Defi cit/surplus -11,728 4,660 3,603 -5,630 -54,276
Private gross domestic capital formation 51,511 104,510 121,442 141,008 155,506
Private savings 173,964 187,032 220,265 203,986 247,055
Defi cit/surplus 122,453 82,522 98,823 62,978 91,549
Gross domestic capital formation 127,143 185,748 205,837 242,561 258,966
(as % of GNI) 18.2 24.1 23.9 26.8 27.3
Gross national savings 237,869 272,930 308,263 299,909 296,239
(as % of GNI) 34.0 35.4 35.7 33.1 31.2
Balance on current account 110,726 87,183 102,426 57,348 37,273
(as % of GNI) 15.8 11.3 11.9 6.3 3.9
p Preliminary
Source: Department of Statistics, Malaysia and Ministry of Finance
Table A.5
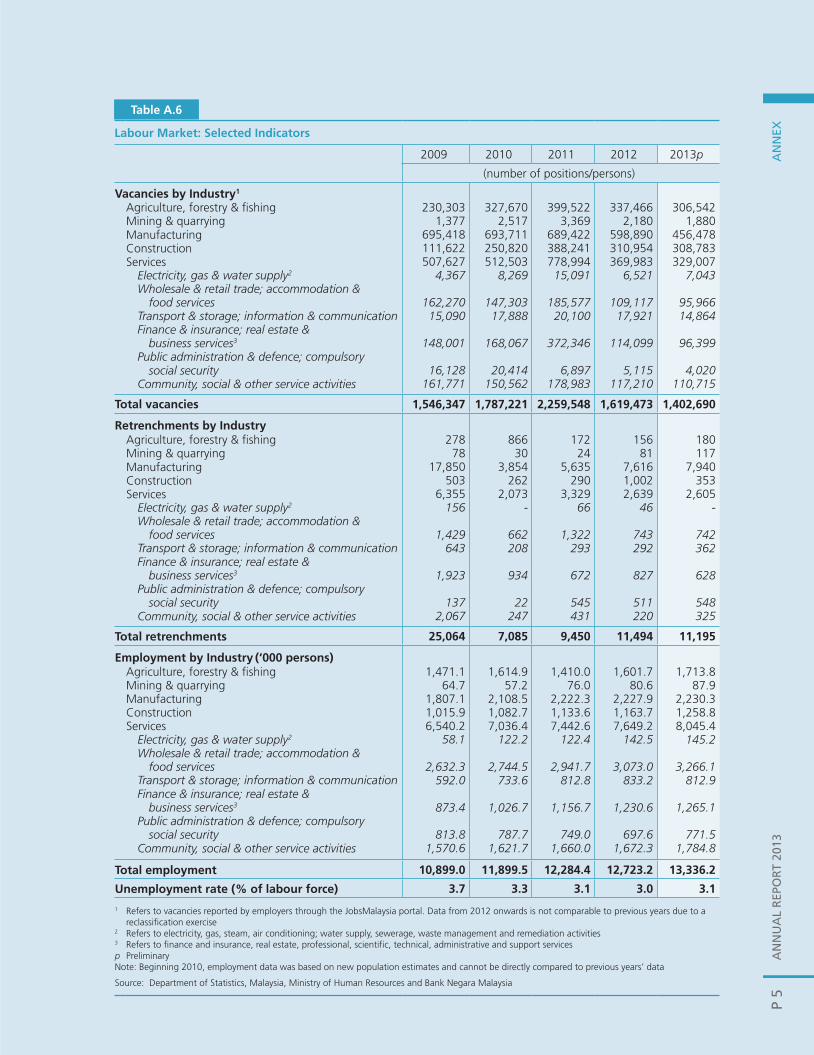
AN
NU
AL
REP
OR
T 20
13A
NN
EXP
5
Annex
Labour Market: selected Indicators
2009 2010 2011 2012 2013p
(number of positions/persons)
Vacancies by Industry1
Agriculture, forestry & fi shing 230,303 327,670 399,522 337,466 306,542 Mining & quarrying 1,377 2,517 3,369 2,180 1,880 Manufacturing 695,418 693,711 689,422 598,890 456,478 Construction 111,622 250,820 388,241 310,954 308,783 Services 507,627 512,503 778,994 369,983 329,007
Electricity, gas & water supply2 4,367 8,269 15,091 6,521 7,043 Wholesale & retail trade; accommodation &
food services 162,270 147,303 185,577 109,117 95,966 Transport & storage; information & communication 15,090 17,888 20,100 17,921 14,864 Finance & insurance; real estate &
business services3 148,001 168,067 372,346 114,099 96,399 Public administration & defence; compulsory
social security 16,128 20,414 6,897 5,115 4,020 Community, social & other service activities 161,771 150,562 178,983 117,210 110,715
Total vacancies 1,546,347 1,787,221 2,259,548 1,619,473 1,402,690
Retrenchments by IndustryAgriculture, forestry & fi shing 278 866 172 156 180 Mining & quarrying 78 30 24 81 117 Manufacturing 17,850 3,854 5,635 7,616 7,940 Construction 503 262 290 1,002 353 Services 6,355 2,073 3,329 2,639 2,605
Electricity, gas & water supply2 156 - 66 46 - Wholesale & retail trade; accommodation &
food services 1,429 662 1,322 743 742 Transport & storage; information & communication 643 208 293 292 362 Finance & insurance; real estate &
business services3 1,923 934 672 827 628 Public administration & defence; compulsory
social security 137 22 545 511 548 Community, social & other service activities 2,067 247 431 220 325
Total retrenchments 25,064 7,085 9,450 11,494 11,195
Employment by Industry (‘000 persons)Agriculture, forestry & fi shing 1,471.1 1,614.9 1,410.0 1,601.7 1,713.8Mining & quarrying 64.7 57.2 76.0 80.6 87.9 Manufacturing 1,807.1 2,108.5 2,222.3 2,227.9 2,230.3 Construction 1,015.9 1,082.7 1,133.6 1,163.7 1,258.8 Services 6,540.2 7,036.4 7,442.6 7,649.2 8,045.4
Electricity, gas & water supply2 58.1 122.2 122.4 142.5 145.2 Wholesale & retail trade; accommodation &
food services 2,632.3 2,744.5 2,941.7 3,073.0 3,266.1 Transport & storage; information & communication 592.0 733.6 812.8 833.2 812.9 Finance & insurance; real estate &
business services3 873.4 1,026.7 1,156.7 1,230.6 1,265.1 Public administration & defence; compulsory
social security 813.8 787.7 749.0 697.6 771.5 Community, social & other service activities 1,570.6 1,621.7 1,660.0 1,672.3 1,784.8
Total employment 10,899.0 11,899.5 12,284.4 12,723.2 13,336.2
Unemployment rate (% of labour force) 3.7 3.3 3.1 3.0 3.1
1 Refers to vacancies reported by employers through the JobsMalaysia portal. Data from 2012 onwards is not comparable to previous years due to a reclassifi cation exercise
2 Refers to electricity, gas, steam, air conditioning; water supply, sewerage, waste management and remediation activities 3 Refers to fi nance and insurance, real estate, professional, scientifi c, technical, administrative and support servicesp PreliminaryNote: Beginning 2010, employment data was based on new population estimates and cannot be directly compared to previous years’ data
Source: Department of Statistics, Malaysia, Ministry of Human Resources and Bank Negara Malaysia
Table A.6
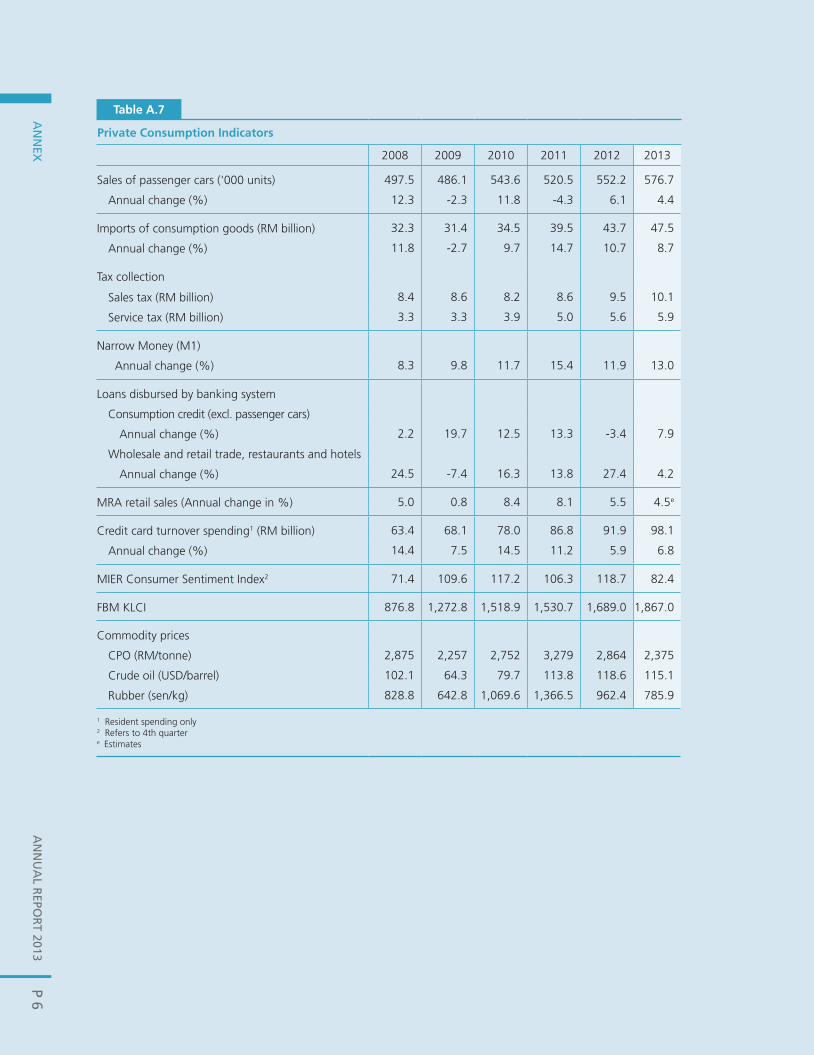
AN
NU
AL R
EPOR
T 2013A
NN
EXP 6
Annex
1
Private consumption Indicators
2008 2009 2010 2011 2012 2013
Sales of passenger cars ('000 units) 497.5 486.1 543.6 520.5 552.2 576.7
Annual change (%) 12.3 -2.3 11.8 -4.3 6.1 4.4
Imports of consumption goods (RM billion) 32.3 31.4 34.5 39.5 43.7 47.5
Annual change (%) 11.8 -2.7 9.7 14.7 10.7 8.7
Tax collection
Sales tax (RM billion) 8.4 8.6 8.2 8.6 9.5 10.1
Service tax (RM billion) 3.3 3.3 3.9 5.0 5.6 5.9
Narrow Money (M1)
Annual change (%) 8.3 9.8 11.7 15.4 11.9 13.0
Loans disbursed by banking system
Consumption credit (excl. passenger cars)
Annual change (%) 2.2 19.7 12.5 13.3 -3.4 7.9
Wholesale and retail trade, restaurants and hotels
Annual change (%) 24.5 -7.4 16.3 13.8 27.4 4.2
MRA retail sales (Annual change in %) 5.0 0.8 8.4 8.1 5.5 4.5e
Credit card turnover spending1 (RM billion) 63.4 68.1 78.0 86.8 91.9 98.1
Annual change (%) 14.4 7.5 14.5 11.2 5.9 6.8
MIER Consumer Sentiment Index2 71.4 109.6 117.2 106.3 118.7 82.4
FBM KLCI 876.8 1,272.8 1,518.9 1,530.7 1,689.0 1,867.0
Commodity prices
CPO (RM/tonne) 2,875 2,257 2,752 3,279 2,864 2,375
Crude oil (USD/barrel) 102.1 64.3 79.7 113.8 118.6 115.1
Rubber (sen/kg) 828.8 642.8 1,069.6 1,366.5 962.4 785.9
1 Resident spending only2 Refers to 4th quartere Estimates
Table A.7

AN
NU
AL
REP
OR
T 20
13A
NN
EXP
7
Annex
1
Table A.8
Private Investment Indicators
2008 2009 2010 2011 2012 2013
Sales of commercial vehicles (‘000 units) 50.7 50.6 61.6 65.0 75.6 79.1
Annual change (%) 14.4 -0.2 21.8 5.6 16.2 4.7
Imports of capital goods (RM billion) 69.9 65.8 73.8 80.3 96.1 98.7
Annual change (%) 0.0 -5.9 12.2 8.9 19.6 2.8
Approvals by MIDA (Manufacturing sector)
No. of projects 919 766 910 846 804 787Capital investment (RM billion) 62.8 32.6 47.2 56.1 41.1 52.1
Local 16.7 10.5 18.1 21.9 20.2 21.6Foreign 46.1 22.1 29.1 34.1 20.9 30.5
New investment (% share) 66.9 67.6 50.6 59.0 65.4 73.1Reinvestments (% share) 33.1 32.4 49.4 41.0 34.6 26.9
Loans disbursed by banking system
Manufacturing sectorAnnual change (%) 12.4 -15.2 12.0 21.9 16.1 -1.6
Construction sectorAnnual change (%) 6.8 16.6 5.5 5.4 20.5 14.4
Private Debt Securities (excluding Cagamas)
Total funds raised (RM billion) 49.7 58.6 52.1 69.6 121.1 83.9New activities 33.3 8.7 13.5 8.4 19.5 7.5
Initial Public Offerings (Bursa Malaysia)
Total funds raised (RM billion) 1.3 12.2 19.8 7.4 22.9 8.2
MIER Business Conditions Survey
Business Conditions Index1 53.8 118.8 99.5 96.6 94.1 92.0Capacity Utilisation Rate1 74.4 81.4 82.9 81.2 80.9 80.0
MSC-Status Companies
No. of companies 242 284 218 215 213 236Approved investment (RM billion) 1.8 2.2 1.5 2.5 2.9 3.0
1 Refers to 4th quarter
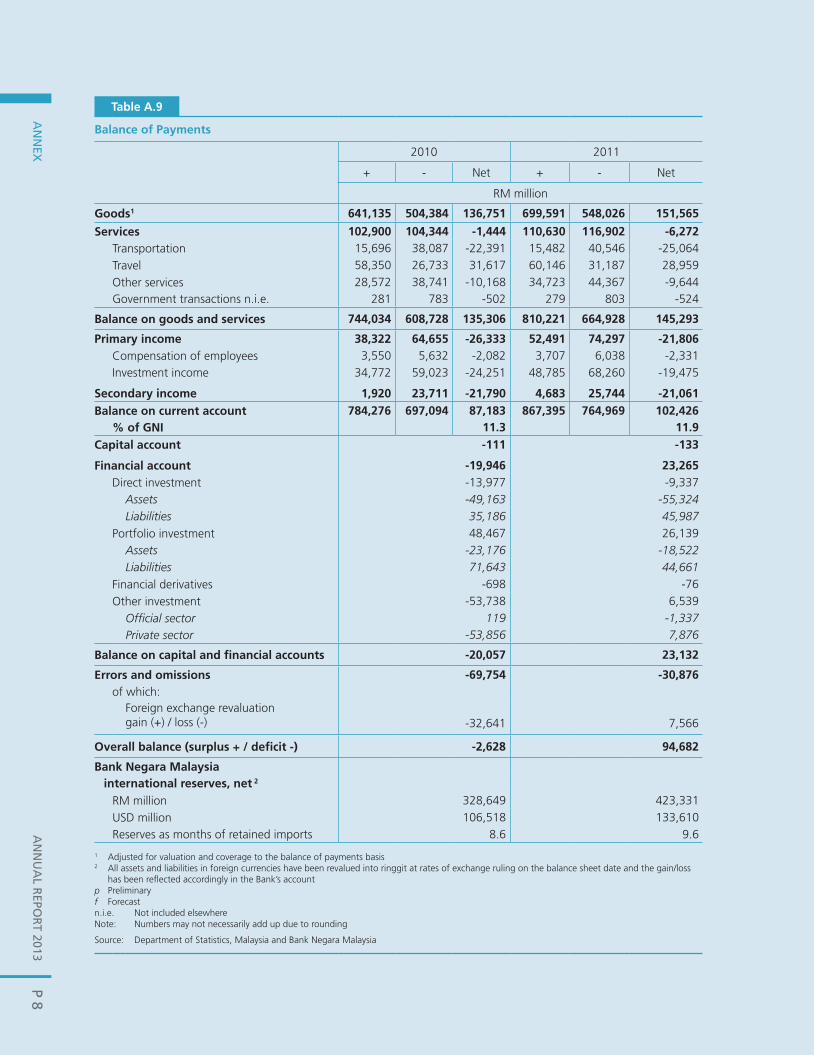
AN
NU
AL R
EPOR
T 2013A
NN
EXP 8
2
Balance of Payments
2010 2011
+ - Net + - Net
RM million
Goods1 641,135 504,384 136,751 699,591 548,026 151,565
services 102,900 104,344 -1,444 110,630 116,902 -6,272Transportation 15,696 38,087 -22,391 15,482 40,546 -25,064Travel 58,350 26,733 31,617 60,146 31,187 28,959Other services 28,572 38,741 -10,168 34,723 44,367 -9,644Government transactions n.i.e. 281 783 -502 279 803 -524
Balance on goods and services 744,034 608,728 135,306 810,221 664,928 145,293
Primary income 38,322 64,655 -26,333 52,491 74,297 -21,806Compensation of employees 3,550 5,632 -2,082 3,707 6,038 -2,331Investment income 34,772 59,023 -24,251 48,785 68,260 -19,475
secondary income 1,920 23,711 -21,790 4,683 25,744 -21,061Balance on current account 784,276 697,094 87,183 867,395 764,969 102,426
% of GNI 11.3 11.9capital account -111 -133
Financial account -19,946 23,265Direct investment -13,977 -9,337
Assets -49,163 -55,324Liabilities 35,186 45,987
Portfolio investment 48,467 26,139 Assets -23,176 -18,522 Liabilities 71,643 44,661Financial derivatives -698 -76Other investment -53,738 6,539
Offi cial sector 119 -1,337Private sector -53,856 7,876
Balance on capital and fi nancial accounts -20,057 23,132
Errors and omissions -69,754 -30,876of which:
Foreign exchange revaluation gain (+) / loss (-) -32,641 7,566
Overall balance (surplus + / defi cit -) -2,628 94,682
Bank Negara Malaysia international reserves, net 2
RM million 328,649 423,331USD million 106,518 133,610Reserves as months of retained imports 8.6 9.6
1 Adjusted for valuation and coverage to the balance of payments basis 2 All assets and liabilities in foreign currencies have been revalued into ringgit at rates of exchange ruling on the balance sheet date and the gain/loss has been refl ected accordingly in the Bank’s accountp Preliminaryf Forecastn.i.e. Not included elsewhereNote: Numbers may not necessarily add up due to rounding
Source: Department of Statistics, Malaysia and Bank Negara Malaysia
Table A.9
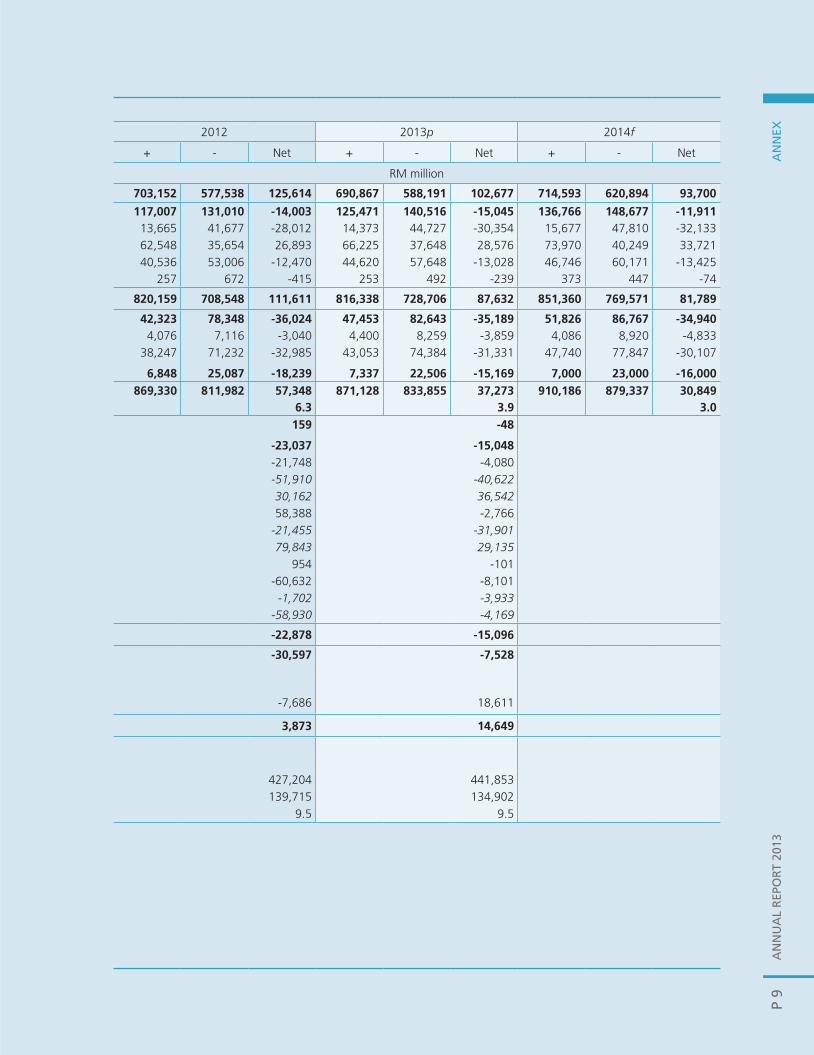
AN
NU
AL
REP
OR
T 20
13A
NN
EXP
9
Annex
2012 2013p 2014f
+ - Net + - Net + - Net
RM million
703,152 577,538 125,614 690,867 588,191 102,677 714,593 620,894 93,700
117,007 131,010 -14,003 125,471 140,516 -15,045 136,766 148,677 -11,91113,665 41,677 -28,012 14,373 44,727 -30,354 15,677 47,810 -32,13362,548 35,654 26,893 66,225 37,648 28,576 73,970 40,249 33,72140,536 53,006 -12,470 44,620 57,648 -13,028 46,746 60,171 -13,425
257 672 -415 253 492 -239 373 447 -74
820,159 708,548 111,611 816,338 728,706 87,632 851,360 769,571 81,789
42,323 78,348 -36,024 47,453 82,643 -35,189 51,826 86,767 -34,9404,076 7,116 -3,040 4,400 8,259 -3,859 4,086 8,920 -4,833
38,247 71,232 -32,985 43,053 74,384 -31,331 47,740 77,847 -30,107
6,848 25,087 -18,239 7,337 22,506 -15,169 7,000 23,000 -16,000869,330 811,982 57,348 871,128 833,855 37,273 910,186 879,337 30,849
6.3 3.9 3.0159 -48
-23,037 -15,048-21,748 -4,080-51,910 -40,62230,162 36,54258,388 -2,766
-21,455 -31,90179,843 29,135
954 -101-60,632 -8,101
-1,702 -3,933-58,930 -4,169
-22,878 -15,096
-30,597 -7,528
-7,686 18,611
3,873 14,649
427,204 441,853139,715 134,902
9.5 9.5
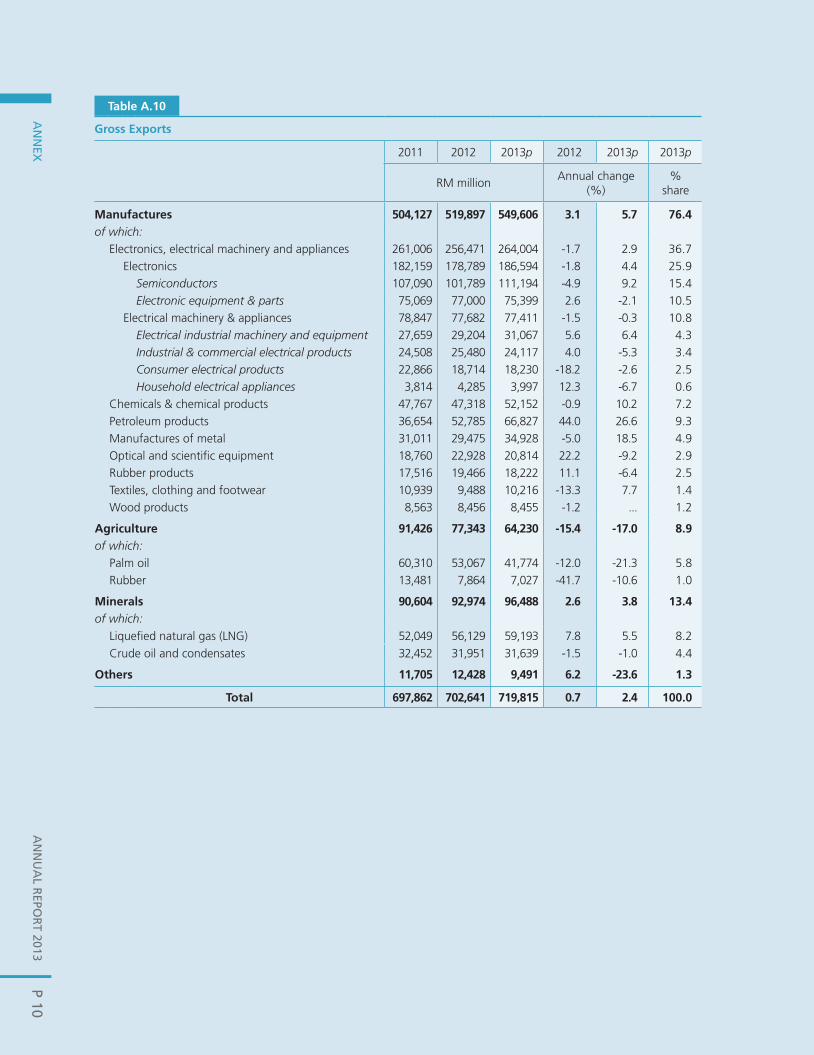
AN
NU
AL R
EPOR
T 2013A
NN
EXP 10
Annex
1
Gross Exports
2011 2012 2013p 2012 2013p 2013p
RM millionAnnual change
(%)%
share
Manufactures 504,127 519,897 549,606 3.1 5.7 76.4 of which:
Electronics, electrical machinery and appliances 261,006 256,471 264,004 -1.7 2.9 36.7Electronics 182,159 178,789 186,594 -1.8 4.4 25.9
Semiconductors 107,090 101,789 111,194 -4.9 9.2 15.4Electronic equipment & parts 75,069 77,000 75,399 2.6 -2.1 10.5
Electrical machinery & appliances 78,847 77,682 77,411 -1.5 -0.3 10.8Electrical industrial machinery and equipment 27,659 29,204 31,067 5.6 6.4 4.3Industrial & commercial electrical products 24,508 25,480 24,117 4.0 -5.3 3.4Consumer electrical products 22,866 18,714 18,230 -18.2 -2.6 2.5Household electrical appliances 3,814 4,285 3,997 12.3 -6.7 0.6
Chemicals & chemical products 47,767 47,318 52,152 -0.9 10.2 7.2Petroleum products 36,654 52,785 66,827 44.0 26.6 9.3Manufactures of metal 31,011 29,475 34,928 -5.0 18.5 4.9Optical and scientifi c equipment 18,760 22,928 20,814 22.2 -9.2 2.9Rubber products 17,516 19,466 18,222 11.1 -6.4 2.5Textiles, clothing and footwear 10,939 9,488 10,216 -13.3 7.7 1.4Wood products 8,563 8,456 8,455 -1.2 ... 1.2
Agriculture 91,426 77,343 64,230 -15.4 -17.0 8.9of which:
Palm oil 60,310 53,067 41,774 -12.0 -21.3 5.8Rubber 13,481 7,864 7,027 -41.7 -10.6 1.0
Minerals 90,604 92,974 96,488 2.6 3.8 13.4of which:
Liquefi ed natural gas (LNG) 52,049 56,129 59,193 7.8 5.5 8.2Crude oil and condensates 32,452 31,951 31,639 -1.5 -1.0 4.4
Others 11,705 12,428 9,491 6.2 -23.6 1.3
Total 697,862 702,641 719,815 0.7 2.4 100.0
Table A.10
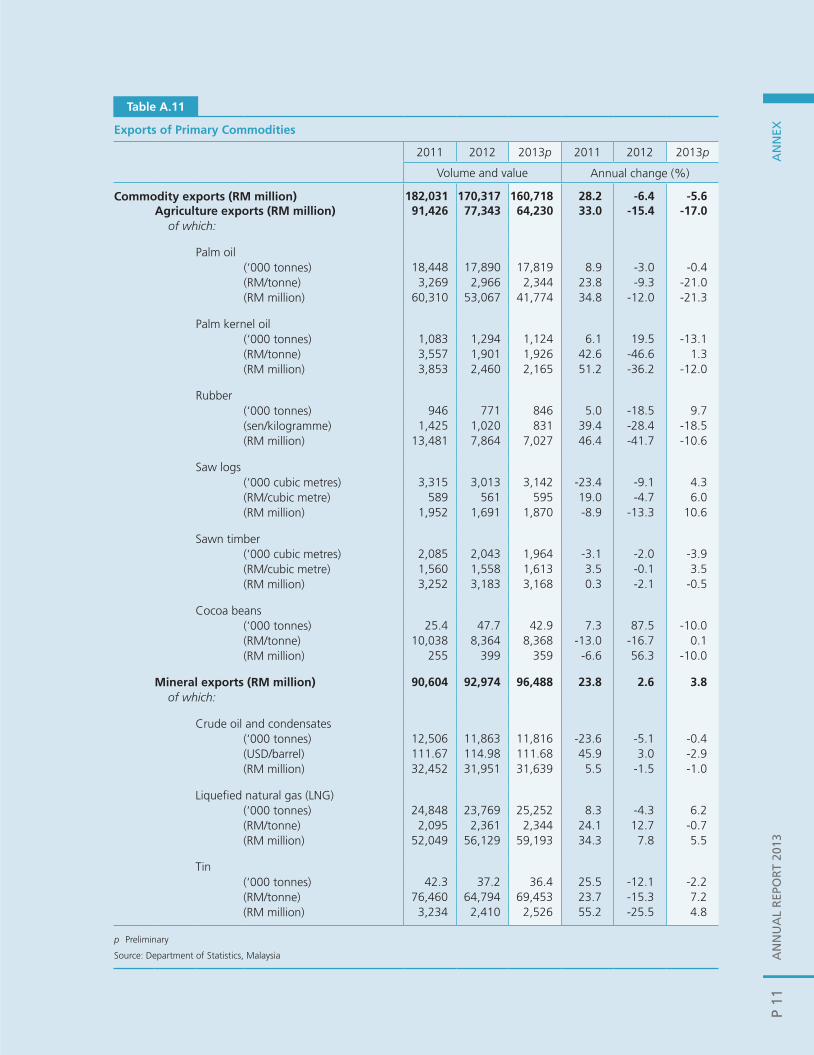
AN
NU
AL
REP
OR
T 20
13A
NN
EXP
11
Annex
1
Exports of Primary commodities
2011 2012 2013p 2011 2012 2013p
Volume and value Annual change (%)
commodity exports (RM million) 182,031 170,317 160,718 28.2 -6.4 -5.6Agriculture exports (RM million) 91,426 77,343 64,230 33.0 -15.4 -17.0 of which:
Palm oil(‘000 tonnes) 18,448 17,890 17,819 8.9 -3.0 -0.4(RM/tonne) 3,269 2,966 2,344 23.8 -9.3 -21.0(RM million) 60,310 53,067 41,774 34.8 -12.0 -21.3
Palm kernel oil(‘000 tonnes) 1,083 1,294 1,124 6.1 19.5 -13.1(RM/tonne) 3,557 1,901 1,926 42.6 -46.6 1.3(RM million) 3,853 2,460 2,165 51.2 -36.2 -12.0
Rubber(‘000 tonnes) 946 771 846 5.0 -18.5 9.7(sen/kilogramme) 1,425 1,020 831 39.4 -28.4 -18.5(RM million) 13,481 7,864 7,027 46.4 -41.7 -10.6
Saw logs(‘000 cubic metres) 3,315 3,013 3,142 -23.4 -9.1 4.3(RM/cubic metre) 589 561 595 19.0 -4.7 6.0(RM million) 1,952 1,691 1,870 -8.9 -13.3 10.6
Sawn timber(‘000 cubic metres) 2,085 2,043 1,964 -3.1 -2.0 -3.9(RM/cubic metre) 1,560 1,558 1,613 3.5 -0.1 3.5(RM million) 3,252 3,183 3,168 0.3 -2.1 -0.5
Cocoa beans(‘000 tonnes) 25.4 47.7 42.9 7.3 87.5 -10.0(RM/tonne) 10,038 8,364 8,368 -13.0 -16.7 0.1(RM million) 255 399 359 -6.6 56.3 -10.0
Mineral exports (RM million) 90,604 92,974 96,488 23.8 2.6 3.8 of which:
Crude oil and condensates(‘000 tonnes) 12,506 11,863 11,816 -23.6 -5.1 -0.4(USD/barrel) 111.67 114.98 111.68 45.9 3.0 -2.9(RM million) 32,452 31,951 31,639 5.5 -1.5 -1.0
Liquefi ed natural gas (LNG)(‘000 tonnes) 24,848 23,769 25,252 8.3 -4.3 6.2(RM/tonne) 2,095 2,361 2,344 24.1 12.7 -0.7(RM million) 52,049 56,129 59,193 34.3 7.8 5.5
Tin(‘000 tonnes) 42.3 37.2 36.4 25.5 -12.1 -2.2(RM/tonne) 76,460 64,794 69,453 23.7 -15.3 7.2(RM million) 3,234 2,410 2,526 55.2 -25.5 4.8
p Preliminary
Source: Department of Statistics, Malaysia
Table A.11
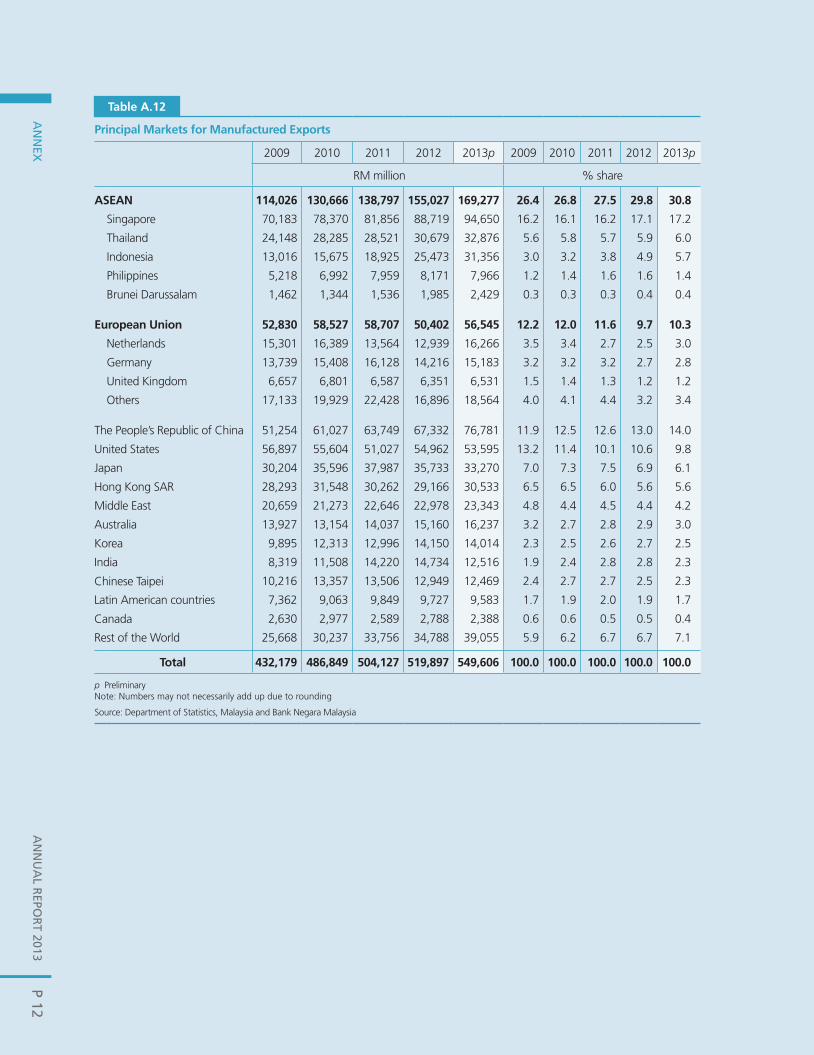
AN
NU
AL R
EPOR
T 2013A
NN
EXP 12
1
Principal Markets for Manufactured Exports
2009 2010 2011 2012 2013p 2009 2010 2011 2012 2013p
RM million % share
AsEAN 114,026 130,666 138,797 155,027 169,277 26.4 26.8 27.5 29.8 30.8
Singapore 70,183 78,370 81,856 88,719 94,650 16.2 16.1 16.2 17.1 17.2
Thailand 24,148 28,285 28,521 30,679 32,876 5.6 5.8 5.7 5.9 6.0
Indonesia 13,016 15,675 18,925 25,473 31,356 3.0 3.2 3.8 4.9 5.7
Philippines 5,218 6,992 7,959 8,171 7,966 1.2 1.4 1.6 1.6 1.4
Brunei Darussalam 1,462 1,344 1,536 1,985 2,429 0.3 0.3 0.3 0.4 0.4
European Union 52,830 58,527 58,707 50,402 56,545 12.2 12.0 11.6 9.7 10.3
Netherlands 15,301 16,389 13,564 12,939 16,266 3.5 3.4 2.7 2.5 3.0
Germany 13,739 15,408 16,128 14,216 15,183 3.2 3.2 3.2 2.7 2.8
United Kingdom 6,657 6,801 6,587 6,351 6,531 1.5 1.4 1.3 1.2 1.2
Others 17,133 19,929 22,428 16,896 18,564 4.0 4.1 4.4 3.2 3.4
The People’s Republic of China 51,254 61,027 63,749 67,332 76,781 11.9 12.5 12.6 13.0 14.0
United States 56,897 55,604 51,027 54,962 53,595 13.2 11.4 10.1 10.6 9.8
Japan 30,204 35,596 37,987 35,733 33,270 7.0 7.3 7.5 6.9 6.1
Hong Kong SAR 28,293 31,548 30,262 29,166 30,533 6.5 6.5 6.0 5.6 5.6
Middle East 20,659 21,273 22,646 22,978 23,343 4.8 4.4 4.5 4.4 4.2
Australia 13,927 13,154 14,037 15,160 16,237 3.2 2.7 2.8 2.9 3.0
Korea 9,895 12,313 12,996 14,150 14,014 2.3 2.5 2.6 2.7 2.5
India 8,319 11,508 14,220 14,734 12,516 1.9 2.4 2.8 2.8 2.3
Chinese Taipei 10,216 13,357 13,506 12,949 12,469 2.4 2.7 2.7 2.5 2.3
Latin American countries 7,362 9,063 9,849 9,727 9,583 1.7 1.9 2.0 1.9 1.7
Canada 2,630 2,977 2,589 2,788 2,388 0.6 0.6 0.5 0.5 0.4
Rest of the World 25,668 30,237 33,756 34,788 39,055 5.9 6.2 6.7 6.7 7.1
Total 432,179 486,849 504,127 519,897 549,606 100.0 100.0 100.0 100.0 100.0
p PreliminaryNote: Numbers may not necessarily add up due to rounding
Source: Department of Statistics, Malaysia and Bank Negara Malaysia
Table A.12
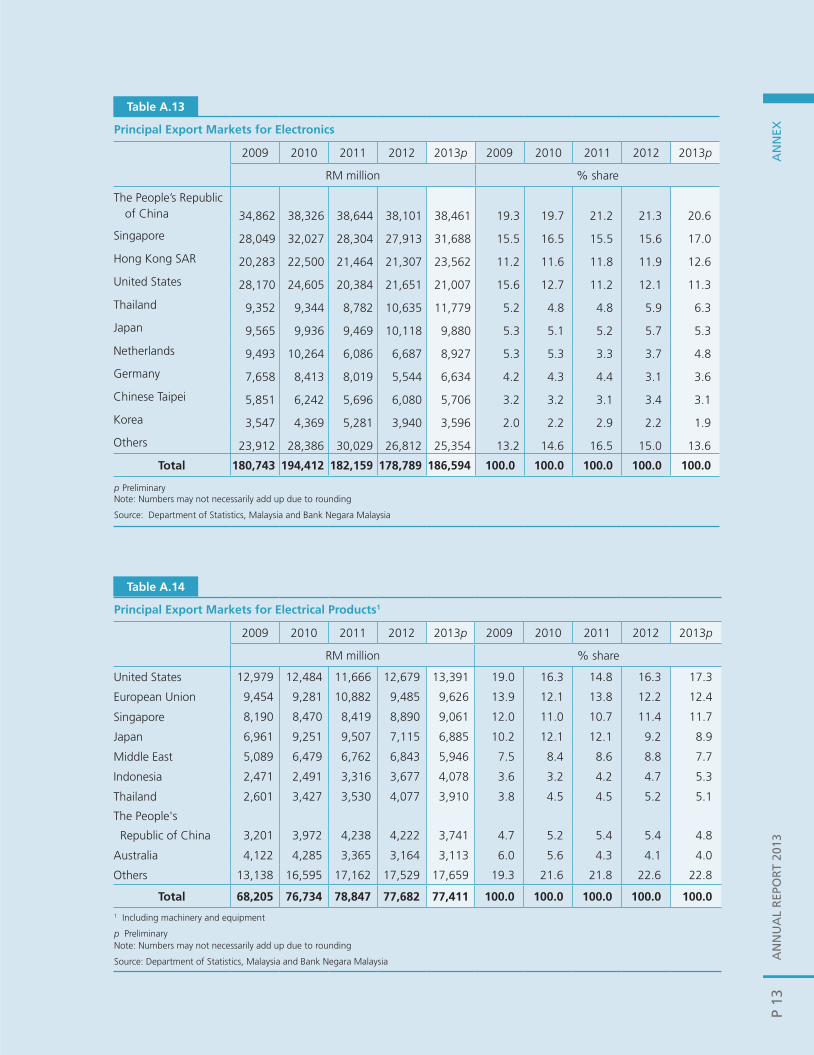
AN
NU
AL
REP
OR
T 20
13A
NN
EXP
13
Annex
1
Principal Export Markets for Electronics
2009 2010 2011 2012 2013p 2009 2010 2011 2012 2013p
RM million % share
The People’s Republicof China 34,862 38,326 38,644 38,101 38,461 19.3 19.7 21.2 21.3 20.6
Singapore 28,049 32,027 28,304 27,913 31,688 15.5 16.5 15.5 15.6 17.0
Hong Kong SAR 20,283 22,500 21,464 21,307 23,562 11.2 11.6 11.8 11.9 12.6
United States 28,170 24,605 20,384 21,651 21,007 15.6 12.7 11.2 12.1 11.3
Thailand 9,352 9,344 8,782 10,635 11,779 5.2 4.8 4.8 5.9 6.3
Japan 9,565 9,936 9,469 10,118 9,880 5.3 5.1 5.2 5.7 5.3
Netherlands 9,493 10,264 6,086 6,687 8,927 5.3 5.3 3.3 3.7 4.8
Germany 7,658 8,413 8,019 5,544 6,634 4.2 4.3 4.4 3.1 3.6
Chinese Taipei 5,851 6,242 5,696 6,080 5,706 3.2 3.2 3.1 3.4 3.1
Korea 3,547 4,369 5,281 3,940 3,596 2.0 2.2 2.9 2.2 1.9
Others 23,912 28,386 30,029 26,812 25,354 13.2 14.6 16.5 15.0 13.6
Total 180,743 194,412 182,159 178,789 186,594 100.0 100.0 100.0 100.0 100.0
p PreliminaryNote: Numbers may not necessarily add up due to rounding
Source: Department of Statistics, Malaysia and Bank Negara Malaysia
Table A.13
1
Principal Export Markets for Electrical Products1
2009 2010 2011 2012 2013p 2009 2010 2011 2012 2013p
RM million % share
United States 12,979 12,484 11,666 12,679 13,391 19.0 16.3 14.8 16.3 17.3
European Union 9,454 9,281 10,882 9,485 9,626 13.9 12.1 13.8 12.2 12.4
Singapore 8,190 8,470 8,419 8,890 9,061 12.0 11.0 10.7 11.4 11.7
Japan 6,961 9,251 9,507 7,115 6,885 10.2 12.1 12.1 9.2 8.9
Middle East 5,089 6,479 6,762 6,843 5,946 7.5 8.4 8.6 8.8 7.7
Indonesia 2,471 2,491 3,316 3,677 4,078 3.6 3.2 4.2 4.7 5.3
Thailand 2,601 3,427 3,530 4,077 3,910 3.8 4.5 4.5 5.2 5.1
The People's
Republic of China 3,201 3,972 4,238 4,222 3,741 4.7 5.2 5.4 5.4 4.8
Australia 4,122 4,285 3,365 3,164 3,113 6.0 5.6 4.3 4.1 4.0
Others 13,138 16,595 17,162 17,529 17,659 19.3 21.6 21.8 22.6 22.8
Total 68,205 76,734 78,847 77,682 77,411 100.0 100.0 100.0 100.0 100.01 Including machinery and equipment
p PreliminaryNote: Numbers may not necessarily add up due to rounding
Source: Department of Statistics, Malaysia and Bank Negara Malaysia
Table A.14
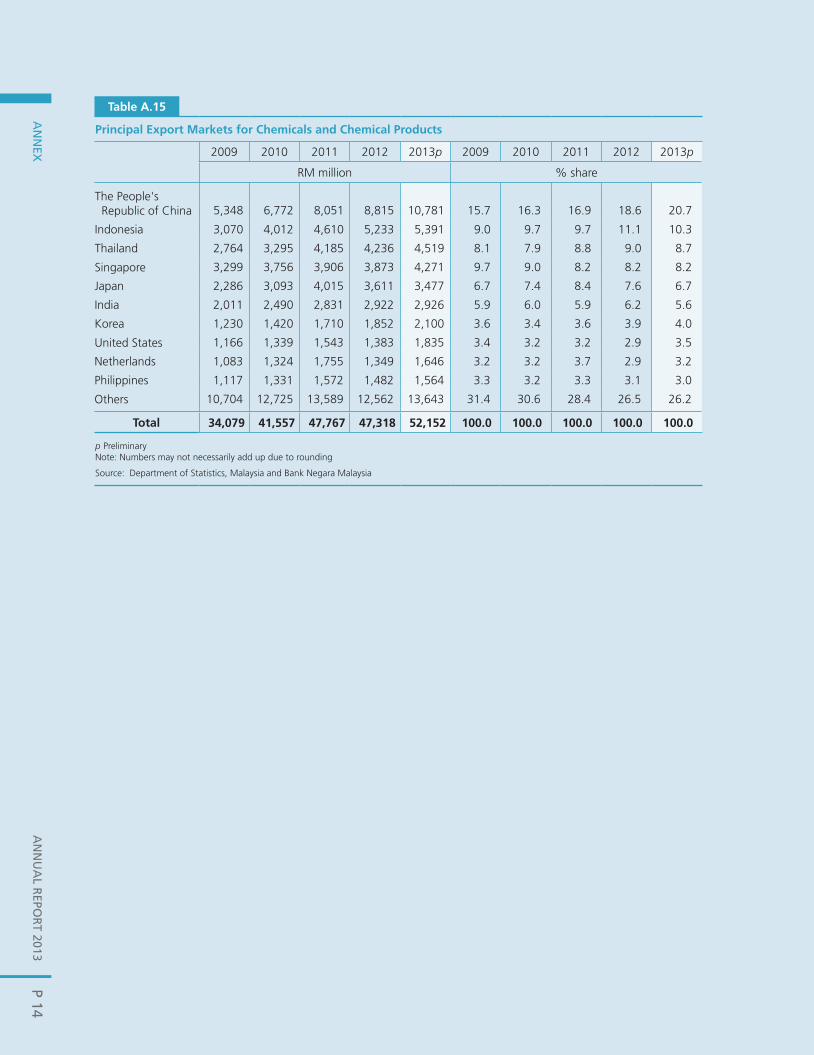
AN
NU
AL R
EPOR
T 2013A
NN
EXP 14
Annex
1
Principal Export Markets for chemicals and chemical Products
2009 2010 2011 2012 2013p 2009 2010 2011 2012 2013p
RM million % share
The People's Republic of China 5,348 6,772 8,051 8,815 10,781 15.7 16.3 16.9 18.6 20.7
Indonesia 3,070 4,012 4,610 5,233 5,391 9.0 9.7 9.7 11.1 10.3
Thailand 2,764 3,295 4,185 4,236 4,519 8.1 7.9 8.8 9.0 8.7
Singapore 3,299 3,756 3,906 3,873 4,271 9.7 9.0 8.2 8.2 8.2
Japan 2,286 3,093 4,015 3,611 3,477 6.7 7.4 8.4 7.6 6.7
India 2,011 2,490 2,831 2,922 2,926 5.9 6.0 5.9 6.2 5.6
Korea 1,230 1,420 1,710 1,852 2,100 3.6 3.4 3.6 3.9 4.0
United States 1,166 1,339 1,543 1,383 1,835 3.4 3.2 3.2 2.9 3.5
Netherlands 1,083 1,324 1,755 1,349 1,646 3.2 3.2 3.7 2.9 3.2
Philippines 1,117 1,331 1,572 1,482 1,564 3.3 3.2 3.3 3.1 3.0
Others 10,704 12,725 13,589 12,562 13,643 31.4 30.6 28.4 26.5 26.2
Total 34,079 41,557 47,767 47,318 52,152 100.0 100.0 100.0 100.0 100.0
p PreliminaryNote: Numbers may not necessarily add up due to rounding
Source: Department of Statistics, Malaysia and Bank Negara Malaysia
Table A.15
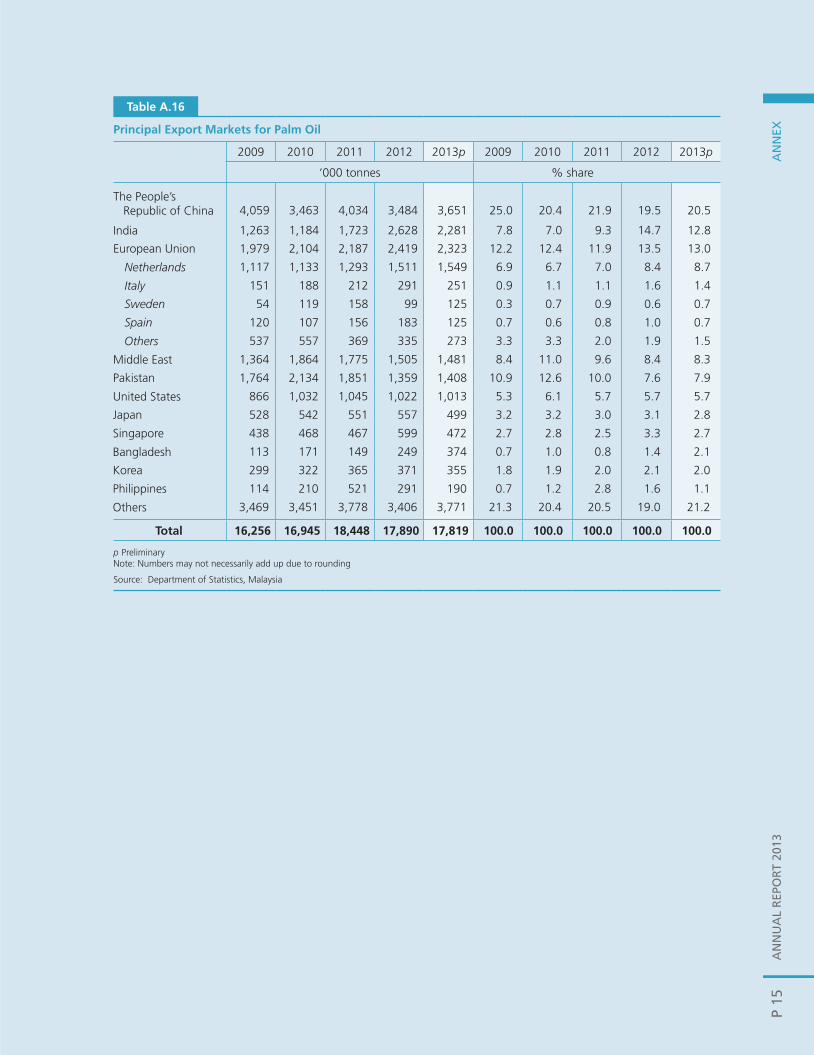
AN
NU
AL
REP
OR
T 20
13A
NN
EXP
15
1
Principal Export Markets for Palm Oil
2009 2010 2011 2012 2013p 2009 2010 2011 2012 2013p
‘000 tonnes % share
The People’s Republic of China 4,059 3,463 4,034 3,484 3,651 25.0 20.4 21.9 19.5 20.5
India 1,263 1,184 1,723 2,628 2,281 7.8 7.0 9.3 14.7 12.8
European Union 1,979 2,104 2,187 2,419 2,323 12.2 12.4 11.9 13.5 13.0
Netherlands 1,117 1,133 1,293 1,511 1,549 6.9 6.7 7.0 8.4 8.7
Italy 151 188 212 291 251 0.9 1.1 1.1 1.6 1.4
Sweden 54 119 158 99 125 0.3 0.7 0.9 0.6 0.7
Spain 120 107 156 183 125 0.7 0.6 0.8 1.0 0.7
Others 537 557 369 335 273 3.3 3.3 2.0 1.9 1.5
Middle East 1,364 1,864 1,775 1,505 1,481 8.4 11.0 9.6 8.4 8.3
Pakistan 1,764 2,134 1,851 1,359 1,408 10.9 12.6 10.0 7.6 7.9
United States 866 1,032 1,045 1,022 1,013 5.3 6.1 5.7 5.7 5.7
Japan 528 542 551 557 499 3.2 3.2 3.0 3.1 2.8
Singapore 438 468 467 599 472 2.7 2.8 2.5 3.3 2.7
Bangladesh 113 171 149 249 374 0.7 1.0 0.8 1.4 2.1
Korea 299 322 365 371 355 1.8 1.9 2.0 2.1 2.0
Philippines 114 210 521 291 190 0.7 1.2 2.8 1.6 1.1
Others 3,469 3,451 3,778 3,406 3,771 21.3 20.4 20.5 19.0 21.2
Total 16,256 16,945 18,448 17,890 17,819 100.0 100.0 100.0 100.0 100.0
p PreliminaryNote: Numbers may not necessarily add up due to rounding
Source: Department of Statistics, Malaysia
Table A.16
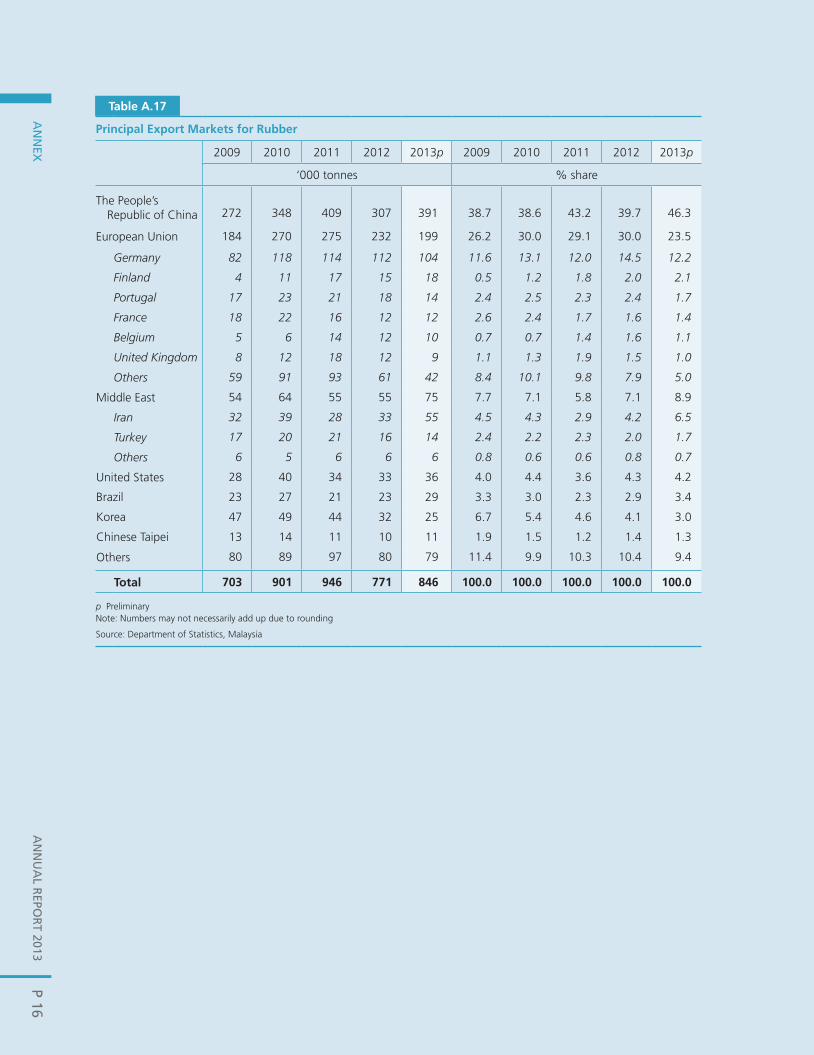
AN
NU
AL R
EPOR
T 2013A
NN
EXP 16
1
Principal Export Markets for Rubber
2009 2010 2011 2012 2013p 2009 2010 2011 2012 2013p
‘000 tonnes % share
The People’s Republic of China 272 348 409 307 391 38.7 38.6 43.2 39.7 46.3
European Union 184 270 275 232 199 26.2 30.0 29.1 30.0 23.5
Germany 82 118 114 112 104 11.6 13.1 12.0 14.5 12.2
Finland 4 11 17 15 18 0.5 1.2 1.8 2.0 2.1
Portugal 17 23 21 18 14 2.4 2.5 2.3 2.4 1.7
France 18 22 16 12 12 2.6 2.4 1.7 1.6 1.4
Belgium 5 6 14 12 10 0.7 0.7 1.4 1.6 1.1
United Kingdom 8 12 18 12 9 1.1 1.3 1.9 1.5 1.0
Others 59 91 93 61 42 8.4 10.1 9.8 7.9 5.0
Middle East 54 64 55 55 75 7.7 7.1 5.8 7.1 8.9
Iran 32 39 28 33 55 4.5 4.3 2.9 4.2 6.5
Turkey 17 20 21 16 14 2.4 2.2 2.3 2.0 1.7
Others 6 5 6 6 6 0.8 0.6 0.6 0.8 0.7
United States 28 40 34 33 36 4.0 4.4 3.6 4.3 4.2
Brazil 23 27 21 23 29 3.3 3.0 2.3 2.9 3.4
Korea 47 49 44 32 25 6.7 5.4 4.6 4.1 3.0
Chinese Taipei 13 14 11 10 11 1.9 1.5 1.2 1.4 1.3
Others 80 89 97 80 79 11.4 9.9 10.3 10.4 9.4
Total 703 901 946 771 846 100.0 100.0 100.0 100.0 100.0
p PreliminaryNote: Numbers may not necessarily add up due to rounding
Source: Department of Statistics, Malaysia
Table A.17
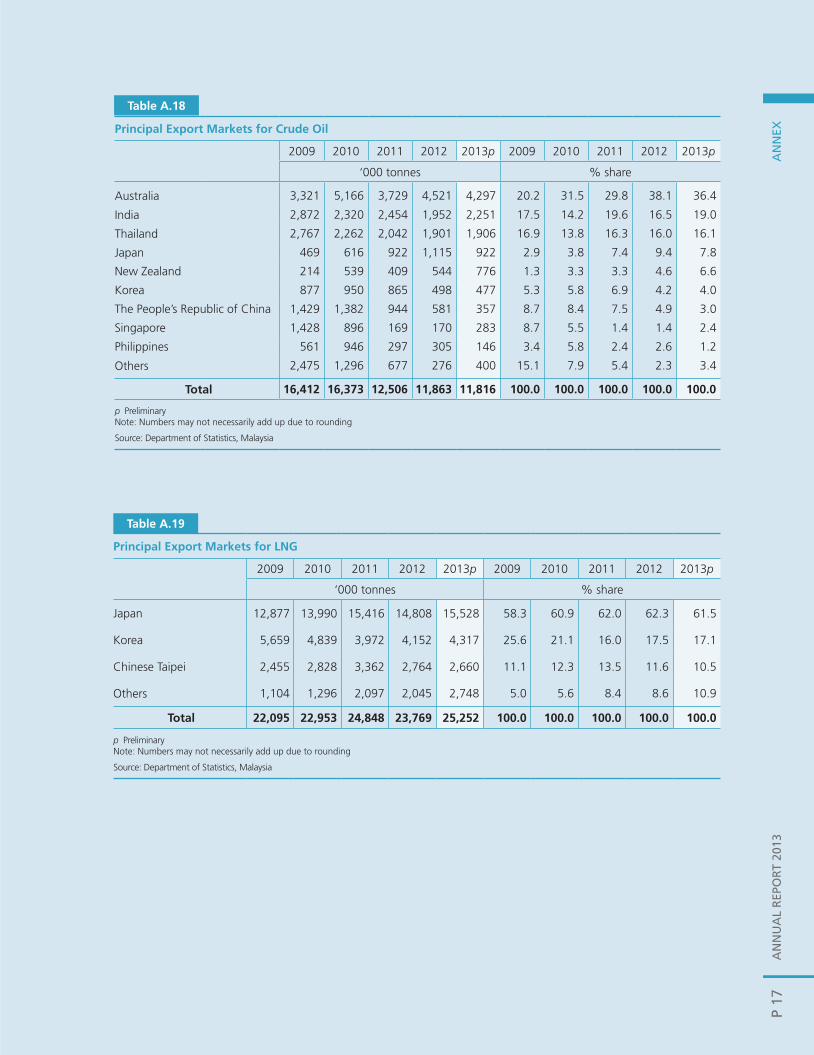
AN
NU
AL
REP
OR
T 20
13A
NN
EXP
17
Annex
1
Principal Export Markets for crude Oil
2009 2010 2011 2012 2013p 2009 2010 2011 2012 2013p
‘000 tonnes % share
Australia 3,321 5,166 3,729 4,521 4,297 20.2 31.5 29.8 38.1 36.4
India 2,872 2,320 2,454 1,952 2,251 17.5 14.2 19.6 16.5 19.0
Thailand 2,767 2,262 2,042 1,901 1,906 16.9 13.8 16.3 16.0 16.1
Japan 469 616 922 1,115 922 2.9 3.8 7.4 9.4 7.8
New Zealand 214 539 409 544 776 1.3 3.3 3.3 4.6 6.6
Korea 877 950 865 498 477 5.3 5.8 6.9 4.2 4.0
The People’s Republic of China 1,429 1,382 944 581 357 8.7 8.4 7.5 4.9 3.0
Singapore 1,428 896 169 170 283 8.7 5.5 1.4 1.4 2.4
Philippines 561 946 297 305 146 3.4 5.8 2.4 2.6 1.2
Others 2,475 1,296 677 276 400 15.1 7.9 5.4 2.3 3.4
Total 16,412 16,373 12,506 11,863 11,816 100.0 100.0 100.0 100.0 100.0
p PreliminaryNote: Numbers may not necessarily add up due to rounding
Source: Department of Statistics, Malaysia
Table A.18
Annex
1
Principal Export Markets for LNG
2009 2010 2011 2012 2013p 2009 2010 2011 2012 2013p
‘000 tonnes % share
Japan 12,877 13,990 15,416 14,808 15,528 58.3 60.9 62.0 62.3 61.5
Korea 5,659 4,839 3,972 4,152 4,317 25.6 21.1 16.0 17.5 17.1
Chinese Taipei 2,455 2,828 3,362 2,764 2,660 11.1 12.3 13.5 11.6 10.5
Others 1,104 1,296 2,097 2,045 2,748 5.0 5.6 8.4 8.6 10.9
Total 22,095 22,953 24,848 23,769 25,252 100.0 100.0 100.0 100.0 100.0
p PreliminaryNote: Numbers may not necessarily add up due to rounding
Source: Department of Statistics, Malaysia
Table A.19

AN
NU
AL R
EPOR
T 2013A
NN
EXP 18
1
External Debt and Debt servicing
2009 2010 2011 2012 2013p
RM million
Medium- and long-term debt:Gross borrowing 35,839 53,373 76,887 86,071 97,989
Federal Government 459 4,493 6,561 678 453Public enterprises 17,900 4,076 3,043 8,612 12,482Private sector 17,480 44,805 67,283 76,781 85,054
Repayment and prepayment 36,095 50,700 78,886 77,694 79,277Federal Government 6,767 823 5,978 694 783Public enterprises 9,478 3,574 7,313 9,665 5,550Private sector 19,850 46,303 65,595 67,335 72,944
Net borrowing -256 1,874 -1,017 7,859 20,246Federal Government -6,308 3,670 583 -16 -330Public enterprises 8,422 502 -4,269 -1,053 6,931Private sector -2,371 -2,297 2,669 8,928 13,645
Outstanding debt 155,312 147,653 153,611 159,788 189,967Federal Government 13,787 16,745 18,105 16,848 16,763Public enterprises 75,933 70,383 69,647 66,034 76,330Private sector 65,591 60,524 65,859 76,906 96,875
short-term debt:Outstanding debt 77,434 79,420 103,753 92,964 128,114
Banking sector1 68,572 67,982 92,302 80,488 113,529Non-bank private sector 8,863 11,438 11,451 12,475 14,584
Total external debt: 232,746 227,072 257,364 252,752 318,081 Total external debt (UsD million) 67,332 72,817 80,404 81,715 95,796
% GNI 33.3 29.5 29.8 27.9 33.5 Annual change (%) -1.5 -2.4 13.3 -1.8 25.8
currency composition (% share) 100.0 100.0 100.0 100.0 100.0US dollar 72.7 65.8 68.4 68.1 71.3Japanese yen 8.4 8.8 8.2 6.7 4.9Others 18.9 25.4 23.4 25.2 23.8
Total servicing (including short-term interest payment) 42,284 56,153 84,123 82,976 84,061 of which:
Medium- and long-term debtRepayment2 36,095 50,700 78,886 77,694 79,277
Federal Government 6,767 823 5,978 694 783Public enterprises 9,478 3,574 7,313 9,665 5,550Private sector 19,850 46,303 65,595 67,335 72,944
Interest payment 5,718 4,974 4,737 4,830 4,419Federal Government 931 558 492 840 673Public enterprises 3,295 3,342 3,326 2,943 2,487Private sector 1,492 1,074 919 1,047 1,259
Debt service ratio (% of exports of goods and services) Total debt 6.5 7.5 10.4 10.1 10.3
Medium- and long-term debt 6.4 7.5 10.3 10.1 10.3Federal Government 1.2 0.2 0.8 0.2 0.2Public enterprises 2.0 0.9 1.3 1.5 1.0Private sector 3.3 6.4 8.2 8.3 9.1
1 Excludes currency and deposits held by non-residents with resident banking institutions2 Includes prepaymentp PreliminaryNote: Numbers may not necessarily add up due to rounding
Source: Ministry of Finance, Malaysia and Bank Negara Malaysia
Table A.20

AN
NU
AL
REP
OR
T 20
13A
NN
EXP
19
Table A.21
consumer Price Index
Weights (%) (2010=100)
2010 2011 2012 2013
Annual change (%)
Total 100.0 1.7 3.2 1.6 2.1
of which:
Food and non-alcoholic beverages 30.3 2.4 4.8 2.7 3.6
Alcoholic beverages and tobacco 2.2 4.0 4.6 0.4 6.0
Clothing and footwear 3.4 -1.4 -0.2 -0.6 -0.6
Housing, water, electricity, gas and other fuels 22.6 1.1 1.8 1.6 1.7
Furnishings, household equipment and routine household maintenance 4.1 0.7 1.8 2.0 1.5
Health 1.3 1.6 2.7 2.0 1.9
Transport 14.9 1.6 4.4 0.7 2.0
Communication 5.7 -0.2 -0.3 -0.6 -0.7
Recreation services and culture 4.6 1.6 2.0 1.2 0.1
Education 1.4 1.7 2.2 2.4 2.4
Restaurants and hotels 3.2 2.0 5.9 2.9 2.5
Miscellaneous goods and services 6.3 2.7 2.4 2.0 0.3
Source: Department of Statistics, MalaysiaAnnex
1
Table A.22
Producer Price Index
Weights (%) (2005=100)
2010 2011 2012 2013
Annual change (%)
Total 100.0 5.6 9.0 0.1 -1.9
of which:
Food 5.4 2.6 8.6 1.0 2.4
Beverages and tobacco 0.9 -0.5 3.7 0.3 2.1
Crude materials, inedible 5.4 22.4 23.2 -10.3 -11.1
Mineral fuels, lubricants, etc. 17.4 12.8 24.2 7.0 -0.6
Animal and vegetable oils and fats 4.2 17.9 24.4 -11.7 -14.1
Chemicals 7.0 3.0 9.4 -0.5 0.4
Manufactured goods 10.9 1.8 3.2 -0.5 -0.3
Machinery and transport equipment 42.9 1.2 -0.6 0.8 -0.5
Miscellaneous manufactured articles 5.4 0.6 2.5 0.6 0.1
Miscellaneous transactions and commodities 0.5 12.2 6.2 1.3 -2.3
Local production 65.6 7.7 12.0 -0.2 -2.3Import 34.4 1.4 2.3 0.7 -0.9
Source: Department of Statistics, Malaysia

AN
NU
AL R
EPOR
T 2013A
NN
EXP 20
Annex
1
Broad Money (M3)
Annual change As at end
2009 2010 2011 2012 2013 2013
RM million
Broad money (M3)1 85,439 68,791 155,581 111,211 109,504 1,462,390
Currency in circulation2 3,015 4,246 5,142 3,971 5,819 62,617
Demand deposits 14,707 18,449 28,854 26,998 32,053 264,537
Broad quasi-money 67,717 46,096 121,585 80,242 71,633 1,135,237
Fixed deposits 23,347 27,038 72,789 60,894 66,957 681,006
Savings deposits 10,050 2,675 10,728 8,070 8,025 131,765
NIDs -8,583 -4,115 -1,239 -1,392 18 15,816
Repos 898 655 -1,701 2,150 100 2,260
Foreign currency deposits 15,283 1,432 13,125 14,090 4,877 88,114
Other deposits 26,721 18,412 27,883 -3,570 -8,345 216,276
Factors Affecting M3
Net claims on Government 25,808 -8,119 2,803 -3,311 21,394 69,984
Claims on Government 35,919 -3,116 4,839 896 16,025 124,629
Less: Government deposits 10,110 5,003 2,035 4,207 -5,370 54,645
Claims on private sector 50,957 84,847 116,431 128,389 119,534 1,323,876
Loans 46,481 91,981 111,787 105,512 109,445 1,189,755
Securities 4,476 -7,134 4,644 22,877 10,089 134,121
Net foreign assets 22,462 31,785 103,372 19,419 14,865 523,704
Bank Negara Malaysia3 7,343 -1,793 94,530 4,095 14,185 435,063
Banking system 15,119 33,578 8,842 15,325 680 88,642
Other infl uences -13,789 -39,722 -67,025 -33,287 -46,289 -455,174
1 Excludes interplacements among banking institutions2 Excludes holdings by banking system3 Includes exchange rate revaluation loss/gainNote: Numbers may not add up due to rounding
Table A.23
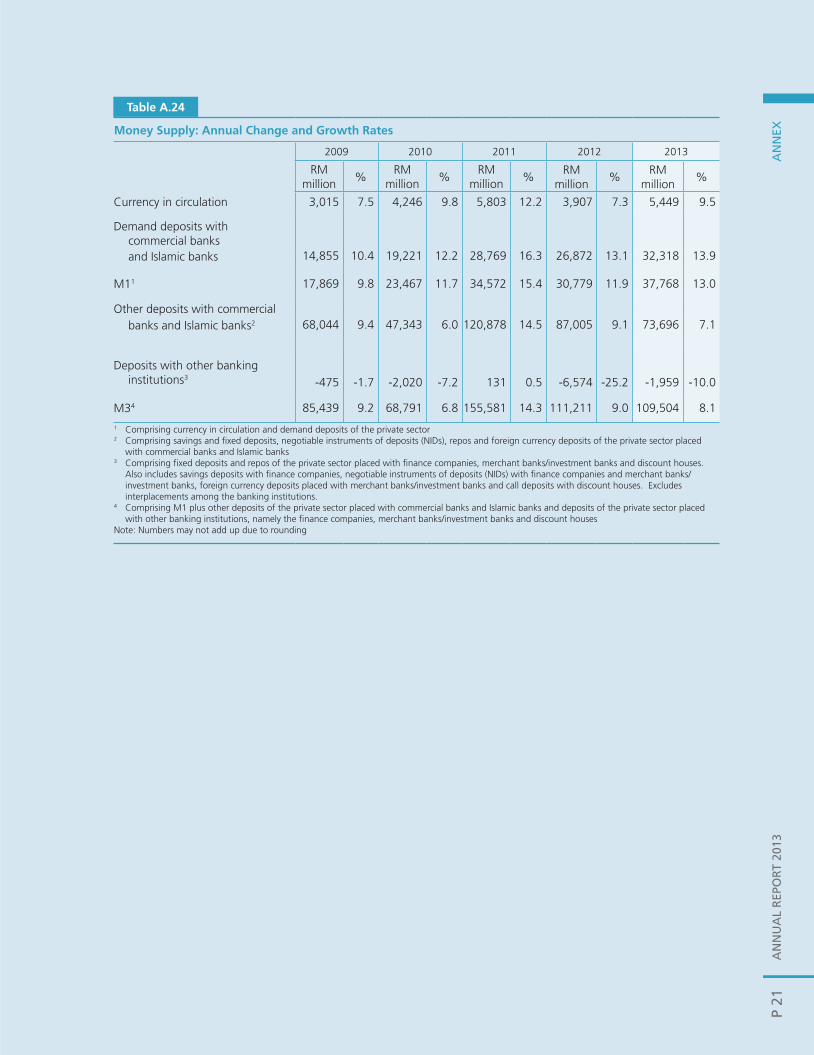
AN
NU
AL
REP
OR
T 20
13A
NN
EXP
21
Annex
1
Money supply: Annual change and Growth Rates
2009 2010 2011 2012 2013
RM million
% RM
million%
RM million
% RM
million%
RM million
%
Currency in circulation 3,015 7.5 4,246 9.8 5,803 12.2 3,907 7.3 5,449 9.5
Demand deposits with commercial banks
and Islamic banks 14,855 10.4 19,221 12.2 28,769 16.3 26,872 13.1 32,318 13.9
M11 17,869 9.8 23,467 11.7 34,572 15.4 30,779 11.9 37,768 13.0
Other deposits with commercial banks and Islamic banks2 68,044 9.4 47,343 6.0 120,878 14.5 87,005 9.1 73,696 7.1
Deposits with other banking institutions3 -475 -1.7 -2,020 -7.2 131 0.5 -6,574 -25.2 -1,959 -10.0
M34 85,439 9.2 68,791 6.8 155,581 14.3 111,211 9.0 109,504 8.1
1 Comprising currency in circulation and demand deposits of the private sector 2 Comprising savings and fi xed deposits, negotiable instruments of deposits (NIDs), repos and foreign currency deposits of the private sector placed
with commercial banks and Islamic banks 3 Comprising fi xed deposits and repos of the private sector placed with fi nance companies, merchant banks/investment banks and discount houses.
Also includes savings deposits with fi nance companies, negotiable instruments of deposits (NIDs) with fi nance companies and merchant banks/investment banks, foreign currency deposits placed with merchant banks/investment banks and call deposits with discount houses. Excludes interplacements among the banking institutions.
4 Comprising M1 plus other deposits of the private sector placed with commercial banks and Islamic banks and deposits of the private sector placed with other banking institutions, namely the fi nance companies, merchant banks/investment banks and discount houses
Note: Numbers may not add up due to rounding
Table A.24

AN
NU
AL R
EPOR
T 2013A
NN
EXP 22
Inte
rest
Rat
es (
%)
As
at e
nd-y
ear
As
at e
nd-m
onth
in 2
013
2007
2008
2009
2010
2011
2012
Jan.
Feb.
Mar
.A
pr.
May
Jun.
Jul.
Aug
.Se
p.O
ct.
Nov
.D
ec.
Ove
rnig
ht in
terb
ank
3.49
3.25
1.99
2.72
2.99
3.00
2.99
2.99
3.00
3.00
3.00
3.00
3.00
3.00
2.93
2.98
3.00
2.99
1-w
eek
inte
rban
k3.
523.
272.
022.
773.
013.
013.
013.
013.
013.
013.
013.
013.
013.
023.
013.
013.
023.
021-
mon
th in
terb
ank
3.56
3.30
2.07
2.83
3.05
3.06
3.07
3.07
3.10
3.06
3.08
3.08
3.06
3.10
3.07
3.06
3.07
3.20
Com
mer
cial
ban
ks
Fix
ed d
epos
it3-
mon
th3.
153.
042.
032.
742.
992.
972.
972.
972.
972.
972.
972.
972.
972.
972.
972.
972.
972.
9712
-mon
th3.
703.
502.
502.
973.
223.
153.
153.
153.
153.
153.
153.
153.
153.
153.
153.
153.
153.
15
Sav
ings
dep
osit
1.44
1.40
0.86
1.00
1.15
1.03
1.00
1.01
1.01
1.01
1.02
1.02
1.01
1.02
1.01
1.01
1.01
0.99
B
ase
lend
ing
rate
(BLR
)6.
726.
485.
516.
276.
536.
536.
536.
536.
536.
536.
536.
536.
536.
536.
536.
536.
536.
53
Trea
sury
bill
s (9
1 da
ys)1
3.39
2.94
1.98
2.82
2.99
3.04
3.04
3.04
3.04
3.02
3.01
3.01
3.00
3.01
3.00
3.00
3.00
3.00
Gov
ernm
ent
Secu
ritie
s
1-y
ear
3.53
2.89
2.12
2.85
2.82
3.01
3.00
3.00
2.97
2.95
2.98
3.10
3.11
3.11
3.06
2.95
2.98
3.03
5
-yea
r3.
783.
003.
793.
393.
233.
243.
233.
253.
223.
153.
283.
413.
683.
683.
563.
373.
603.
66
Priv
ate
debt
sec
uriti
esA
AA 3-y
ear
4.07
4.17
3.72
3.63
3.65
3.53
3.54
3.55
3.56
3.54
3.51
3.57
3.66
3.71
3.67
3.65
3.69
3.71
5-y
ear
4.28
4.48
4.32
4.07
3.99
3.80
3.81
3.81
3.81
3.80
3.75
3.79
3.88
3.94
3.97
3.86
3.91
3.96
AA 3
-yea
r4.
394.
954.
504.
344.
294.
044.
044.
054.
044.
013.
963.
994.
104.
094.
114.
094.
124.
16 5
-yea
r4.
645.
315.
074.
754.
654.
304.
304.
314.
304.
274.
214.
224.
334.
334.
344.
314.
384.
41
A 3
-yea
r6.
066.
906.
806.
906.
576.
346.
326.
336.
326.
346.
346.
376.
396.
346.
336.
346.
346.
32 5
-yea
r6.
517.
437.
577.
537.
116.
986.
976.
966.
936.
987.
027.
047.
037.
037.
007.
027.
017.
02
BBB 3
-yea
r9.
7110
.32
10.1
810
.40
10.2
110
.06
10.0
610
.08
10.0
610
.06
10.0
110
.02
10.0
210
.03
9.94
10.0
210
.01
10.0
2 5
-yea
r10
.72
11.3
611
.32
11.4
311
.24
11.1
411
.15
11.1
611
.15
11.1
711
.14
11.1
411
.14
11.1
811
.05
11.1
311
.12
11.1
7
BB &
bel
ow 3
-yea
r11
.92
12.6
812
.58
12.7
812
.62
12.5
312
.48
12.5
712
.56
12.5
712
.53
12.5
512
.54
12.5
512
.43
12.5
212
.50
12.5
2 5
-yea
r13
.16
13.8
614
.02
14.5
114
.13
13.7
613
.69
13.7
913
.76
13.8
213
.80
13.8
213
.77
13.7
813
.64
13.7
113
.71
13.7
0
1 Re
fers
to
data
fro
m F
AST
, Ban
k N
egar
a M
alay
sia
Tab
le A
.25
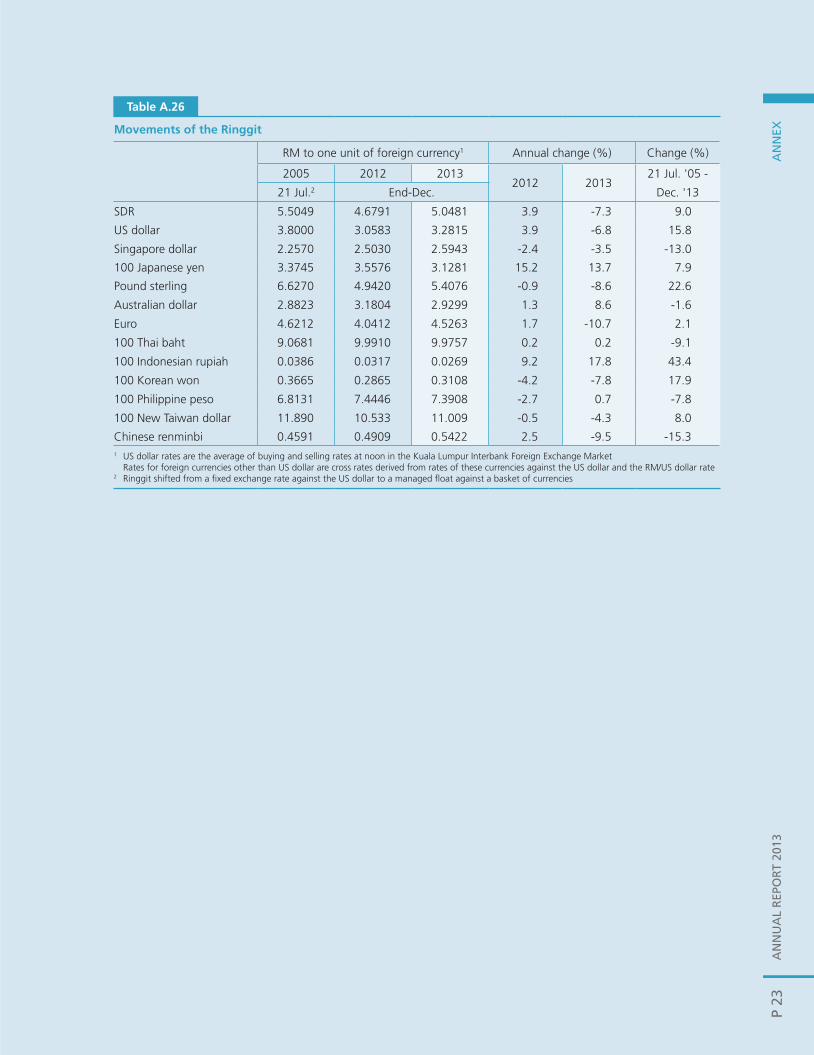
AN
NU
AL
REP
OR
T 20
13A
NN
EXP
23
Movements of the Ringgit
RM to one unit of foreign currency1 Annual change (%) Change (%)
2005 2012 20132012 2013
21 Jul. '05 -
21 Jul.2 End-Dec. Dec. '13
SDR 5.5049 4.6791 5.0481 3.9 -7.3 9.0
US dollar 3.8000 3.0583 3.2815 3.9 -6.8 15.8
Singapore dollar 2.2570 2.5030 2.5943 -2.4 -3.5 -13.0
100 Japanese yen 3.3745 3.5576 3.1281 15.2 13.7 7.9
Pound sterling 6.6270 4.9420 5.4076 -0.9 -8.6 22.6
Australian dollar 2.8823 3.1804 2.9299 1.3 8.6 -1.6
Euro 4.6212 4.0412 4.5263 1.7 -10.7 2.1
100 Thai baht 9.0681 9.9910 9.9757 0.2 0.2 -9.1
100 Indonesian rupiah 0.0386 0.0317 0.0269 9.2 17.8 43.4
100 Korean won 0.3665 0.2865 0.3108 -4.2 -7.8 17.9
100 Philippine peso 6.8131 7.4446 7.3908 -2.7 0.7 -7.8
100 New Taiwan dollar 11.890 10.533 11.009 -0.5 -4.3 8.0
Chinese renminbi 0.4591 0.4909 0.5422 2.5 -9.5 -15.3
Table A.26
1 US dollar rates are the average of buying and selling rates at noon in the Kuala Lumpur Interbank Foreign Exchange Market Rates for foreign currencies other than US dollar are cross rates derived from rates of these currencies against the US dollar and the RM/US dollar rate2 Ringgit shifted from a fi xed exchange rate against the US dollar to a managed fl oat against a basket of currencies

AN
NU
AL R
EPOR
T 2013A
NN
EXP 24
Housing credit Institutions
Year ofestablishment
Objective
Lending rate fornew housing loans (%)
No. of branches
2012 2013 2012 2013
Commercial banks - 4.301,2 4.271,2 42283 43413
Treasury Housing Loans Division
1970 To provide housing loans to Government employees
4.001 4.001 1 1
Bank Kerjasama RakyatMalaysia Berhad
1954 A co-operative society which collects deposits and provides banking facilities according to Syariah principles
6.301 4.501 140 144
Malaysia Building Society Berhad
1950 To be a consumer driven fi nancial institution offering property lending and deposit taking activities leading to wealth creation for its valued customers
7.35 ~ 7.41 7.09 ~ 7.33 38 43
Borneo Housing Mortgage Finance Berhad
1958 To provide housing loans mainly to Sabah and Sarawak State Government employees
6.75 ~ 7.50 6.75 ~ 7.50 2 2
Bank Simpanan Nasional
1974 To promote and mobilise savings particularly from small savers and to inculcate the habit of thrift and savings
4.641 4.811 396 400
Sabah Credit Corporation
1955 To uplift the social economic development of Malaysians in Sabah through the provision of easy access to fi nancial credit
3.00 ~ 7.50 3.00 ~ 7.50 12 12
1 12-month average lending rate2 Excludes Islamic banks3 Includes Islamic banks
Source: Bank Negara Malaysia and various housing credit institutions
Table A.27
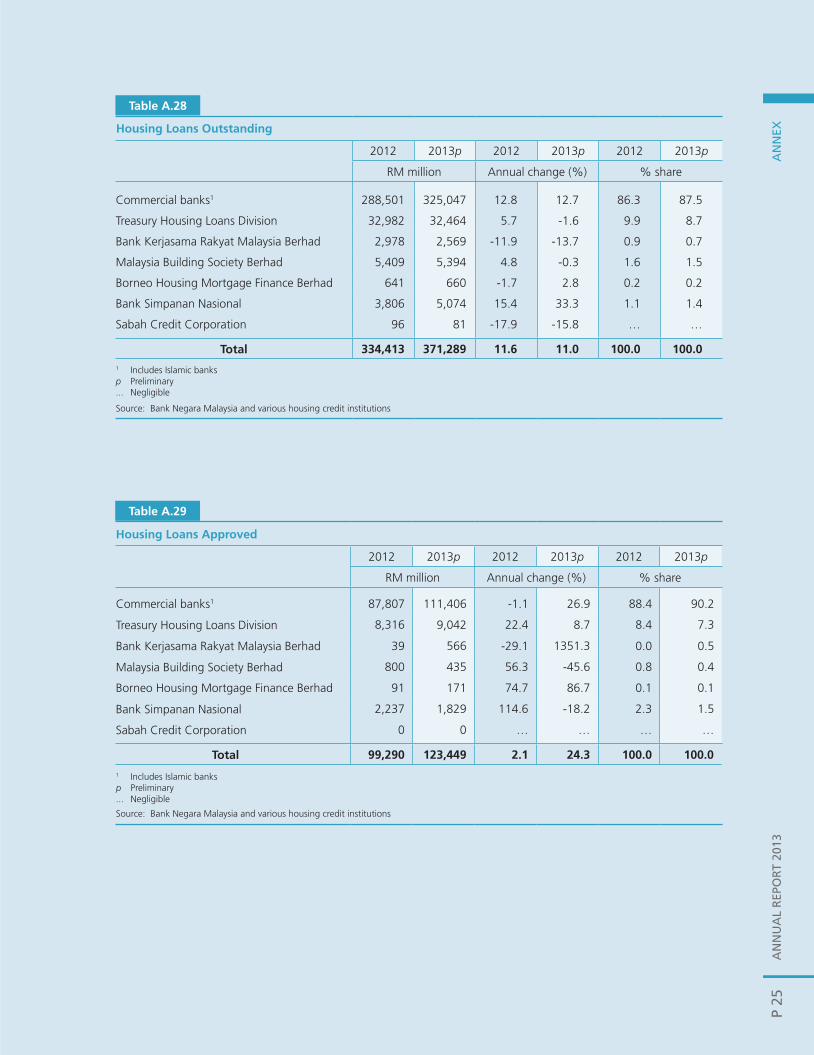
AN
NU
AL
REP
OR
T 20
13A
NN
EXP
25
Housing Loans Outstanding
2012 2013p 2012 2013p 2012 2013p
RM million Annual change (%) % share
Commercial banks1 288,501 325,047 12.8 12.7 86.3 87.5
Treasury Housing Loans Division 32,982 32,464 5.7 -1.6 9.9 8.7
Bank Kerjasama Rakyat Malaysia Berhad 2,978 2,569 -11.9 -13.7 0.9 0.7
Malaysia Building Society Berhad 5,409 5,394 4.8 -0.3 1.6 1.5
Borneo Housing Mortgage Finance Berhad 641 660 -1.7 2.8 0.2 0.2
Bank Simpanan Nasional 3,806 5,074 15.4 33.3 1.1 1.4
Sabah Credit Corporation 96 81 -17.9 -15.8 … …
Total 334,413 371,289 11.6 11.0 100.0 100.01 Includes Islamic banksp Preliminary... Negligible
Source: Bank Negara Malaysia and various housing credit institutions
Annex
Table A.28
1
Housing Loans Approved
2012 2013p 2012 2013p 2012 2013p
RM million Annual change (%) % share
Commercial banks1 87,807 111,406 -1.1 26.9 88.4 90.2
Treasury Housing Loans Division 8,316 9,042 22.4 8.7 8.4 7.3
Bank Kerjasama Rakyat Malaysia Berhad 39 566 -29.1 1351.3 0.0 0.5
Malaysia Building Society Berhad 800 435 56.3 -45.6 0.8 0.4
Borneo Housing Mortgage Finance Berhad 91 171 74.7 86.7 0.1 0.1
Bank Simpanan Nasional 2,237 1,829 114.6 -18.2 2.3 1.5
Sabah Credit Corporation 0 0 … … … …
Total 99,290 123,449 2.1 24.3 100.0 100.0
1 Includes Islamic banksp Preliminary... Negligible
Source: Bank Negara Malaysia and various housing credit institutions
Table A.29
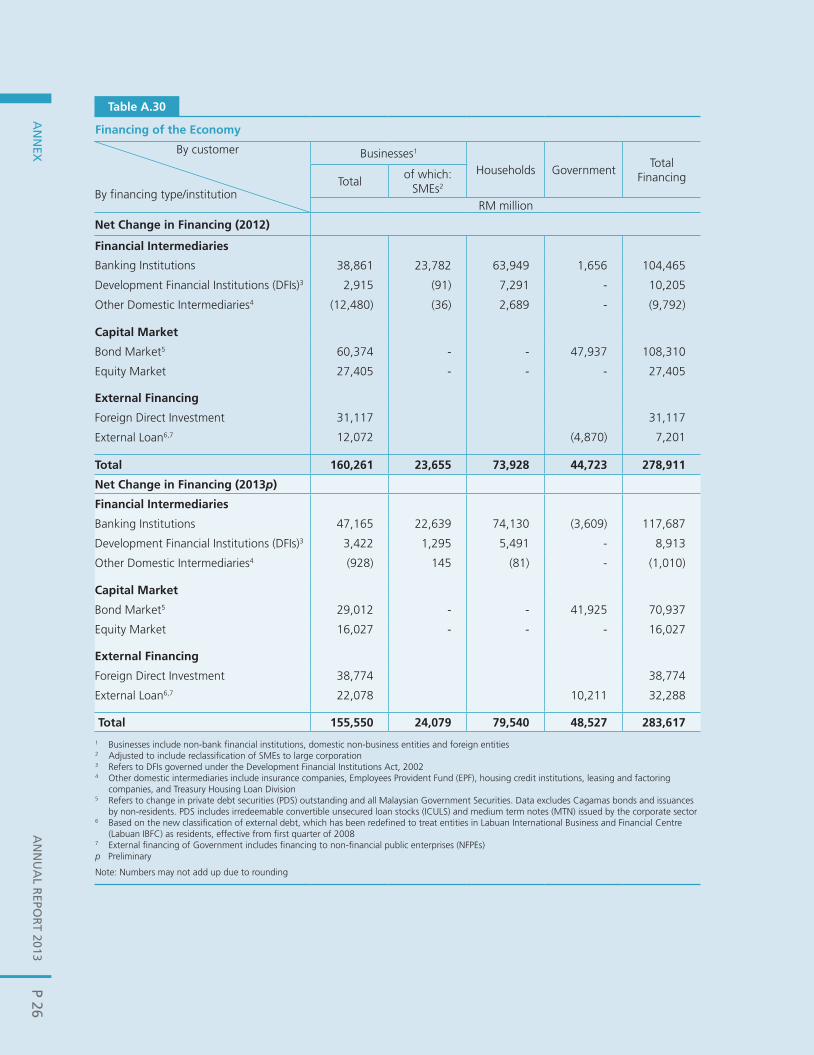
AN
NU
AL R
EPOR
T 2013A
NN
EXP 26
1
Financing of the Economy
By customer Businesses1
Households GovernmentTotal
FinancingBy fi nancing type/institution
Totalof which:
SMEs2
RM million
Net change in Financing (2012)
Financial Intermediaries
Banking Institutions 38,861 23,782 63,949 1,656 104,465
Development Financial Institutions (DFIs)3 2,915 (91) 7,291 - 10,205
Other Domestic Intermediaries4 (12,480) (36) 2,689 - (9,792)
capital Market
Bond Market5 60,374 - - 47,937 108,310
Equity Market 27,405 - - - 27,405
External Financing
Foreign Direct Investment 31,117 31,117
External Loan6,7 12,072 (4,870) 7,201
Total 160,261 23,655 73,928 44,723 278,911
Net change in Financing (2013p)
Financial Intermediaries
Banking Institutions 47,165 22,639 74,130 (3,609) 117,687
Development Financial Institutions (DFIs)3 3,422 1,295 5,491 - 8,913
Other Domestic Intermediaries4 (928) 145 (81) - (1,010)
capital Market
Bond Market5 29,012 - - 41,925 70,937
Equity Market 16,027 - - - 16,027
External Financing
Foreign Direct Investment 38,774 38,774
External Loan6,7 22,078 10,211 32,288
Total 155,550 24,079 79,540 48,527 283,617
1 Businesses include non-bank fi nancial institutions, domestic non-business entities and foreign entities2 Adjusted to include reclassifi cation of SMEs to large corporation3 Refers to DFIs governed under the Development Financial Institutions Act, 20024 Other domestic intermediaries include insurance companies, Employees Provident Fund (EPF), housing credit institutions, leasing and factoring
companies, and Treasury Housing Loan Division5 Refers to change in private debt securities (PDS) outstanding and all Malaysian Government Securities. Data excludes Cagamas bonds and issuances
by non-residents. PDS includes irredeemable convertible unsecured loan stocks (ICULS) and medium term notes (MTN) issued by the corporate sector6 Based on the new classifi cation of external debt, which has been redefi ned to treat entities in Labuan International Business and Financial Centre
(Labuan IBFC) as residents, effective from fi rst quarter of 20087 External fi nancing of Government includes fi nancing to non-fi nancial public enterprises (NFPEs)p Preliminary
Note: Numbers may not add up due to rounding
Table A.30
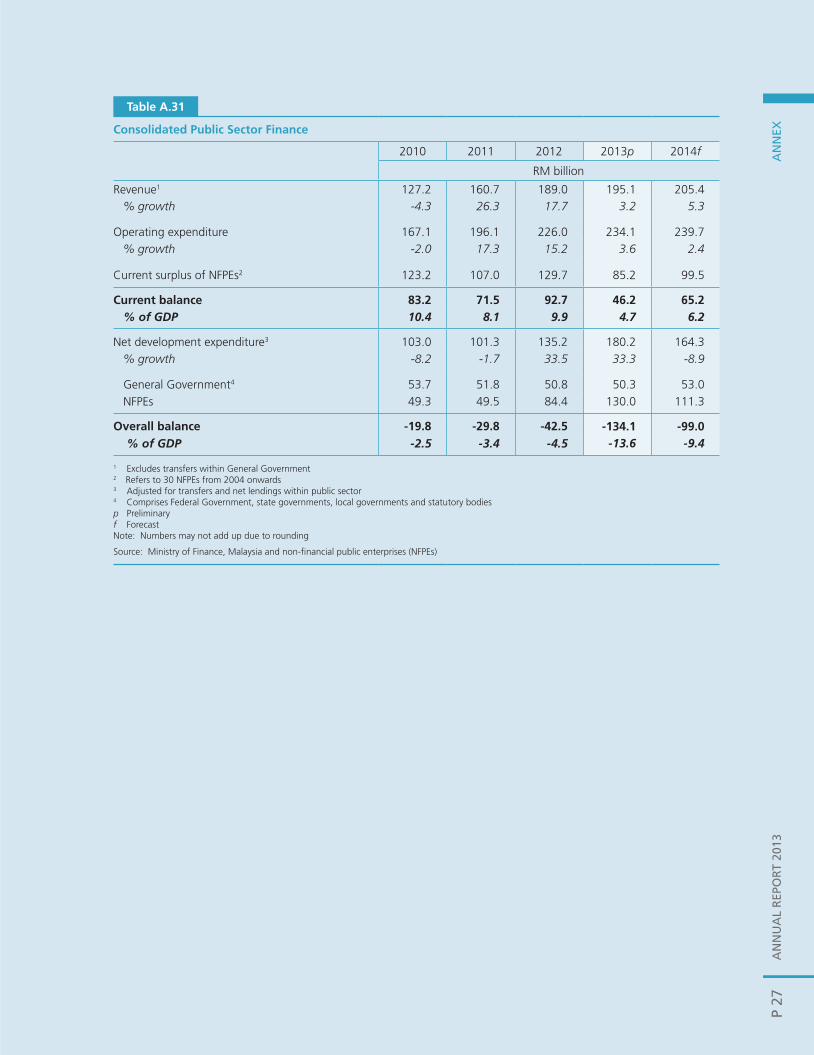
AN
NU
AL
REP
OR
T 20
13A
NN
EXP
27
Annex
consolidated Public sector Finance
2010 2011 2012 2013p 2014f
RM billion
Revenue1 127.2 160.7 189.0 195.1 205.4 % growth -4.3 26.3 17.7 3.2 5.3
Operating expenditure 167.1 196.1 226.0 234.1 239.7 % growth -2.0 17.3 15.2 3.6 2.4
Current surplus of NFPEs2 123.2 107.0 129.7 85.2 99.5
current balance 83.2 71.5 92.7 46.2 65.2 % of GDP 10.4 8.1 9.9 4.7 6.2
Net development expenditure3 103.0 101.3 135.2 180.2 164.3 % growth -8.2 -1.7 33.5 33.3 -8.9
General Government4 53.7 51.8 50.8 50.3 53.0 NFPEs 49.3 49.5 84.4 130.0 111.3
Overall balance -19.8 -29.8 -42.5 -134.1 -99.0 % of GDP -2.5 -3.4 -4.5 -13.6 -9.4
1 Excludes transfers within General Government2 Refers to 30 NFPEs from 2004 onwards3 Adjusted for transfers and net lendings within public sector4 Comprises Federal Government, state governments, local governments and statutory bodiesp Preliminaryf ForecastNote: Numbers may not add up due to rounding
Source: Ministry of Finance, Malaysia and non-fi nancial public enterprises (NFPEs)
Table A.31

AN
NU
AL R
EPOR
T 2013A
NN
EXP 28
Annex
1
Major Advanced Economies: Key Economic Indicators
2009 2010 2011 2012 2013e 2014f
Annual change (%)
REAL GDP
United States -2.8 2.5 1.9 2.8 1.9 2.8
Japan -5.5 4.7 -0.5 1.4 1.5 1.7
Euro area -4.4 2.0 1.6 -0.7 -0.5 1.0
Germany -5.1 4.0 3.3 0.7 0.4 1.6
United Kingdom -5.2 1.7 1.1 0.2 1.8 2.4
INFLATION
United States -0.4 1.6 3.2 2.1 1.5 1.5
Japan -1.4 -0.7 -0.3 0.0 0.4 2.9
Euro area 0.3 1.6 2.7 2.5 1.4 1.5
Germany 0.2 1.2 2.5 2.1 1.6 1.8
United Kingdom 2.2 3.3 4.5 2.8 2.6 2.3
% of labour force
UNEMPLOYMENT
United States 9.3 9.6 8.9 8.1 7.4 6.3 - 6.6
Japan 5.1 5.1 4.6 4.3 4.0 4.3
Euro area 9.6 10.1 10.1 11.4 12.1 12.2
Germany 7.8 7.1 5.9 5.5 5.3 5.5
United Kingdom 7.6 7.8 8.0 7.9 7.6 7.5
% of GDP
CURRENT ACCOUNT BALANCE
United States -2.6 -3.0 -3.0 -2.7 -2.7 -2.8
Japan 2.9 3.7 2.0 1.0 1.2 1.7
Euro area -0.2 0.1 0.1 1.3 2.3 2.5
Germany 6.0 6.3 6.2 7.0 6.0 5.7
United Kingdom -1.4 -2.7 -1.5 -3.7 -2.8 -2.3
FISCAL BALANCE1
United States -12.9 -10.8 -9.7 -8.3 -5.8 -4.7
Japan -10.4 -9.3 -9.9 -10.1 -9.5 -6.8
Euro area -6.4 -6.2 -4.2 -3.7 -3.1 -2.5
Germany -3.1 -4.2 -0.8 0.1 -0.4 -0.1
United Kingdom -11.4 -10.1 -7.7 -6.1 -6.1 -5.81
ef
Refers to general government fi scal balanceEstimateForecast
Source: International Monetary Fund, Federal Reserve (Dec 2013 Projections) and National Authorities
Table A.32
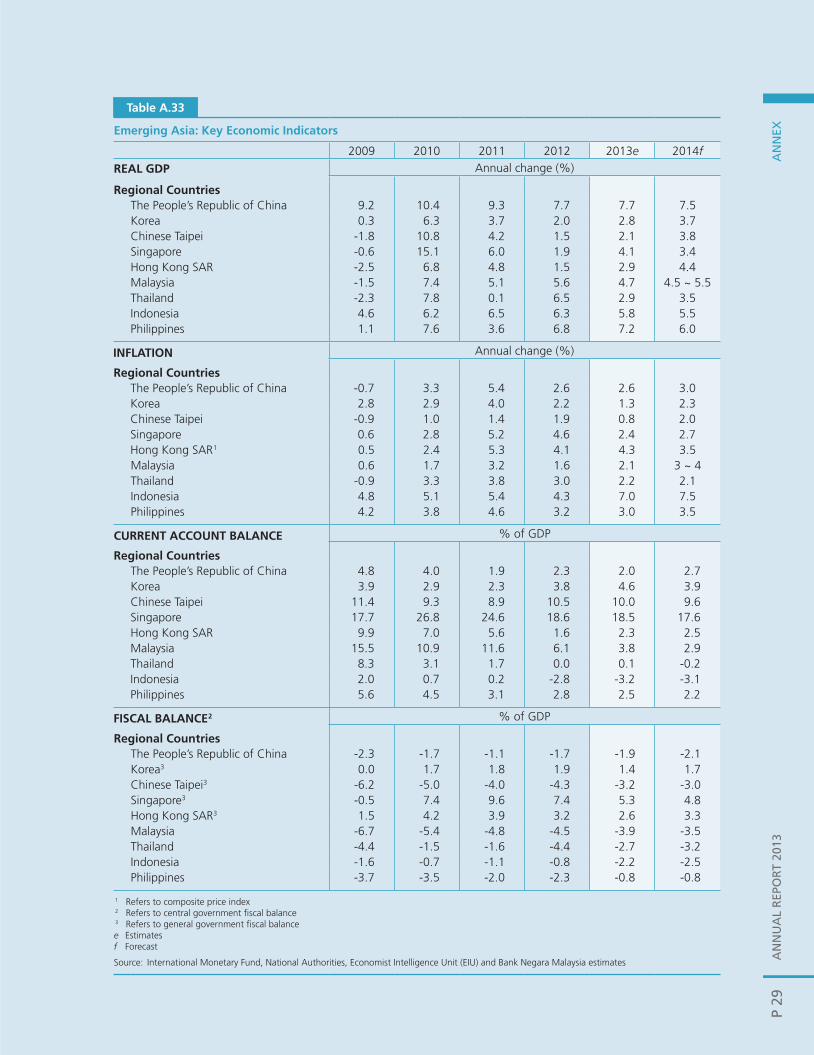
AN
NU
AL
REP
OR
T 20
13A
NN
EXP
29
Annex
Emerging Asia: Key Economic Indicators
2009 2010 2011 2012 2013e 2014f
REAL GDP Annual change (%)
Regional countriesThe People’s Republic of China 9.2 10.4 9.3 7.7 7.7 7.5Korea 0.3 6.3 3.7 2.0 2.8 3.7Chinese Taipei -1.8 10.8 4.2 1.5 2.1 3.8Singapore -0.6 15.1 6.0 1.9 4.1 3.4Hong Kong SAR -2.5 6.8 4.8 1.5 2.9 4.4Malaysia -1.5 7.4 5.1 5.6 4.7 4.5 ~ 5.5Thailand -2.3 7.8 0.1 6.5 2.9 3.5Indonesia 4.6 6.2 6.5 6.3 5.8 5.5Philippines 1.1 7.6 3.6 6.8 7.2 6.0
Annual change (%)INFLATION
Regional countriesThe People’s Republic of China -0.7 3.3 5.4 2.6 2.6 3.0Korea 2.8 2.9 4.0 2.2 1.3 2.3Chinese Taipei -0.9 1.0 1.4 1.9 0.8 2.0Singapore 0.6 2.8 5.2 4.6 2.4 2.7Hong Kong SAR1 0.5 2.4 5.3 4.1 4.3 3.5Malaysia 0.6 1.7 3.2 1.6 2.1 3 ~ 4Thailand -0.9 3.3 3.8 3.0 2.2 2.1Indonesia 4.8 5.1 5.4 4.3 7.0 7.5Philippines 4.2 3.8 4.6 3.2 3.0 3.5
% of GDPcURRENT AccOUNT BALANcE
Regional countriesThe People’s Republic of China 4.8 4.0 1.9 2.3 2.0 2.7Korea 3.9 2.9 2.3 3.8 4.6 3.9Chinese Taipei 11.4 9.3 8.9 10.5 10.0 9.6Singapore 17.7 26.8 24.6 18.6 18.5 17.6Hong Kong SAR 9.9 7.0 5.6 1.6 2.3 2.5Malaysia 15.5 10.9 11.6 6.1 3.8 2.9Thailand 8.3 3.1 1.7 0.0 0.1 -0.2Indonesia 2.0 0.7 0.2 -2.8 -3.2 -3.1Philippines 5.6 4.5 3.1 2.8 2.5 2.2
% of GDPFIscAL BALANcE2
Regional countriesThe People’s Republic of China -2.3 -1.7 -1.1 -1.7 -1.9 -2.1Korea3 0.0 1.7 1.8 1.9 1.4 1.7Chinese Taipei3 -6.2 -5.0 -4.0 -4.3 -3.2 -3.0Singapore3 -0.5 7.4 9.6 7.4 5.3 4.8Hong Kong SAR3 1.5 4.2 3.9 3.2 2.6 3.3Malaysia -6.7 -5.4 -4.8 -4.5 -3.9 -3.5Thailand -4.4 -1.5 -1.6 -4.4 -2.7 -3.2Indonesia -1.6 -0.7 -1.1 -0.8 -2.2 -2.5Philippines -3.7 -3.5 -2.0 -2.3 -0.8 -0.8
1 Refers to composite price index2 Refers to central government fi scal balance3 Refers to general government fi scal balancee Estimatesf Forecast
Source: International Monetary Fund, National Authorities, Economist Intelligence Unit (EIU) and Bank Negara Malaysia estimates
Table A.33