Status report on Sacramento splittail and longfin smelt · Status report on Sacramento splittail...
34
Status report on Sacramento splittail and longfin smelt submitted to Fish and Wildlife Service August 25, 1993 Lesa Meng Wildlife and Fisheries Biology University of California Davis, CA 95616
Transcript of Status report on Sacramento splittail and longfin smelt · Status report on Sacramento splittail...
Status report on Sacramento splittail and longfin smelt
submitted to Fish and Wildlife Service
August 25, 1993
Lesa Meng
Wildlife and Fisheries Biology
University of California
Davis, CA 95616
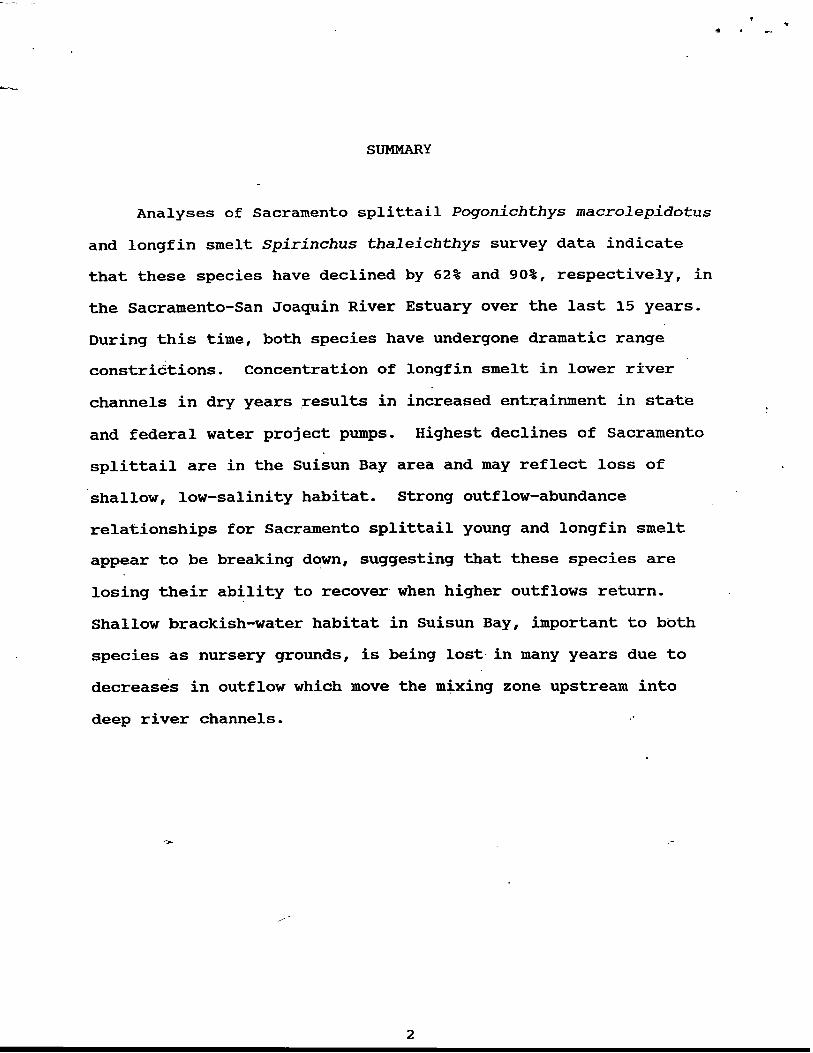
SUMMARY
Analyses of Sacramento splittail Pogonichthys macrolepidotus
and longfin smelt Spirinchus thaleichthys survey data indicate
that these species have declined by 62% and 90%, respectively, in
the Sacramento-San Joaquin River Estuary over the last 15 years.
During this time, both species have undergone dramatic range
constrictions. concentration of longfin smelt in lower river '
channels in dry years ,results in increased entrainment in state
and federal water project pumps. Highest declines of Sacramento
splittail are in the Suisun Bay area and may reflect loss of
shallow, low-salinity habitat. Strong outflow-abundance
relationships for Sacramento splittail young and longfin smelt
appear to be breaking down, suggesting that these species are
losing their ability to recover when higher outflows return.
Shallow brackish-water habitat in Suisun Bay, important to both
species as nursery grounds, is being 1ost.h many years due to
decreases in outflow which move the mixing zone upstream into
deep river channels.
-
List of Figures
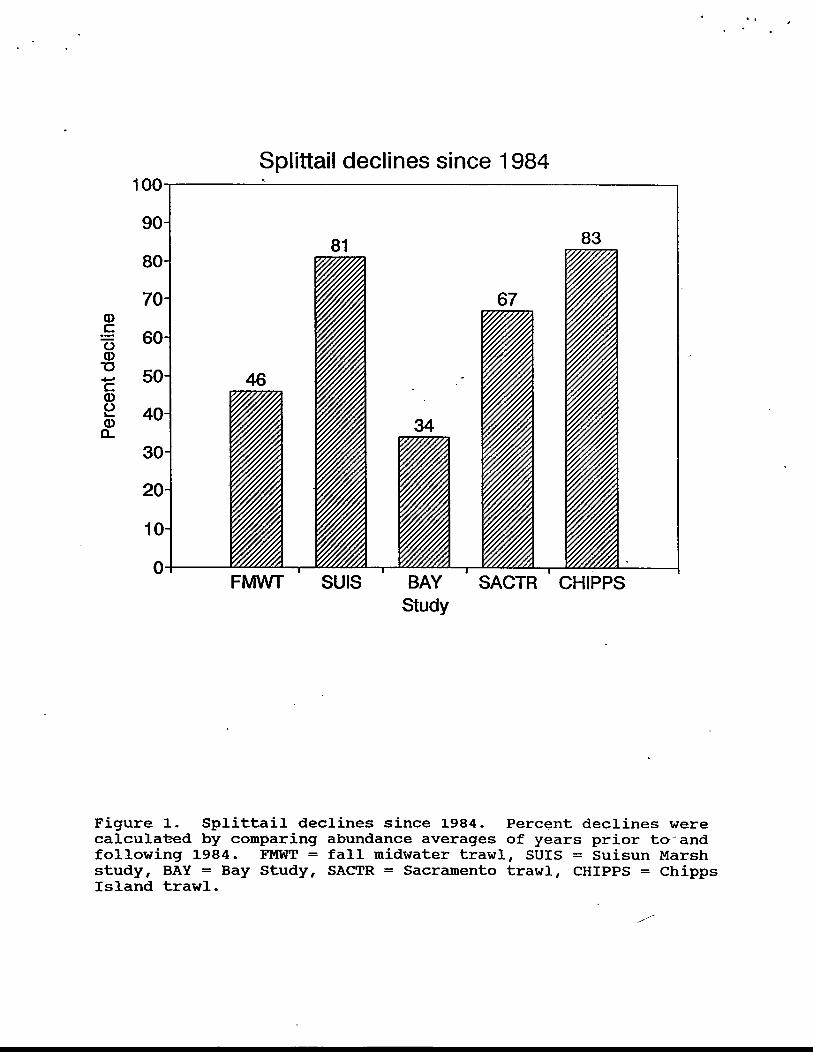
Figure 1. Splittail declines since 1984. Percent declines were calculated by comparing abundance averages of years prior to and following 1984. FKWT = fall midwater trawl, SUIS = Suisun Marsh study, BAY = Bay Study, SACTR = Sacramento trawl, CHIPPS = Chipps Island trawl.
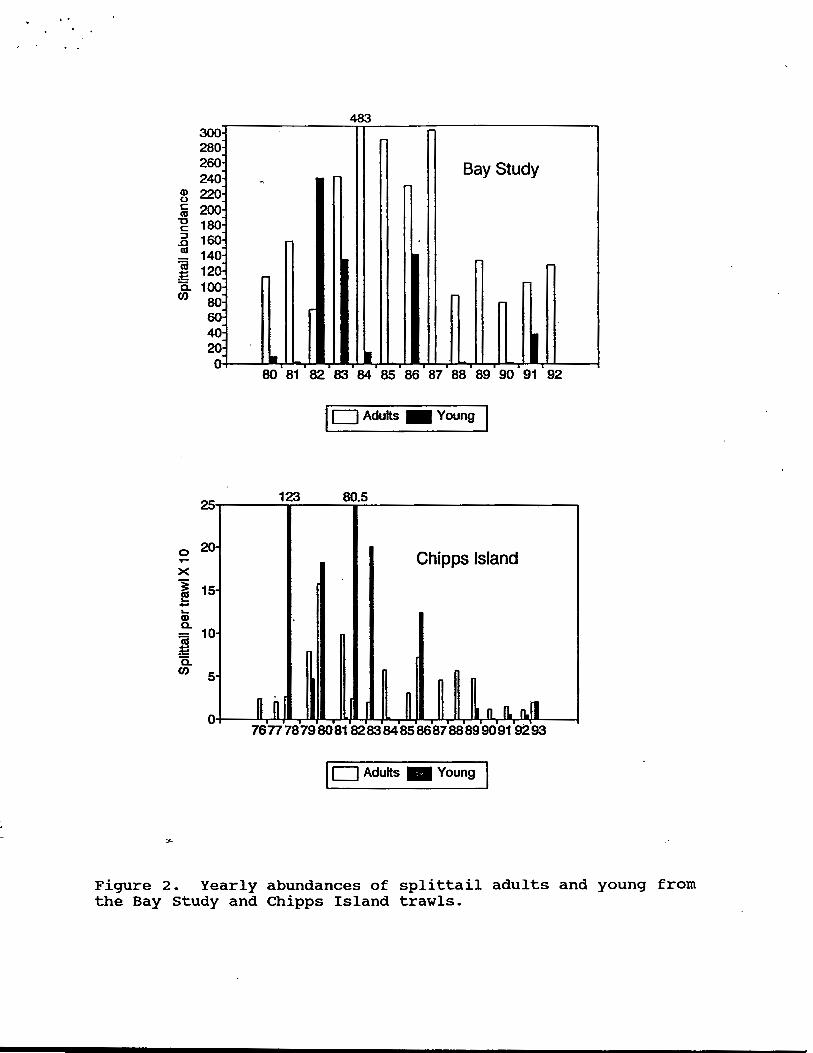
Figure 2. Yearly abundances of splittail adults and young from the Bay Study and Chipps Island trawls.
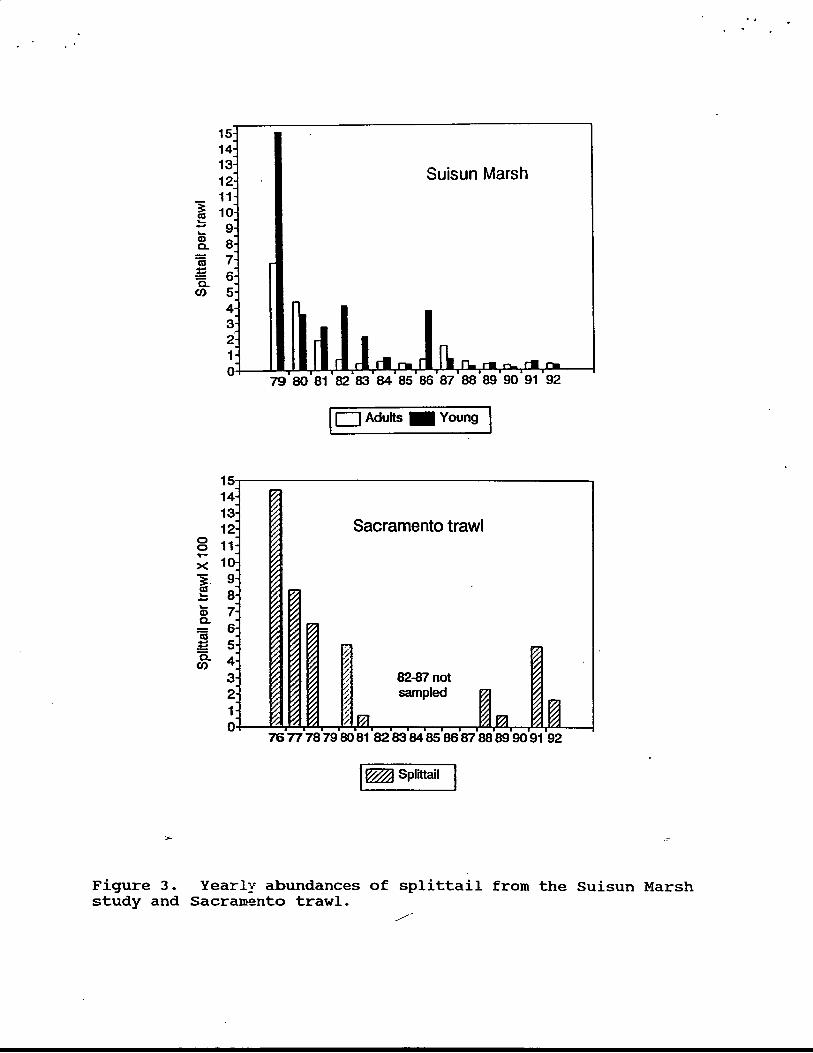
Figure 3. Yearly abundances of splittail from the Suisun Marsh study and sacramento trawl,
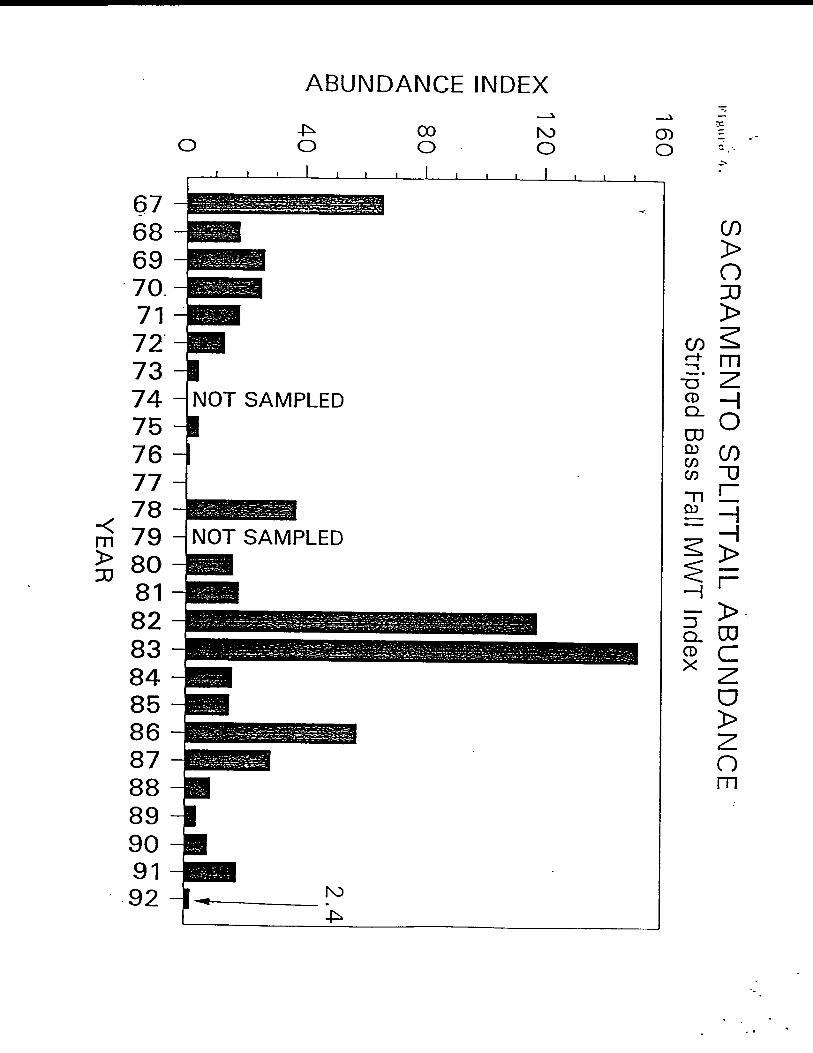
Figure 4. Yearly abundances of splittail from the fall midwater trawl.
Figure 5. Splittail young salvage per acre foot of water pumped during May and June at the state (SWP) and federal (CVP) pumping facilities.
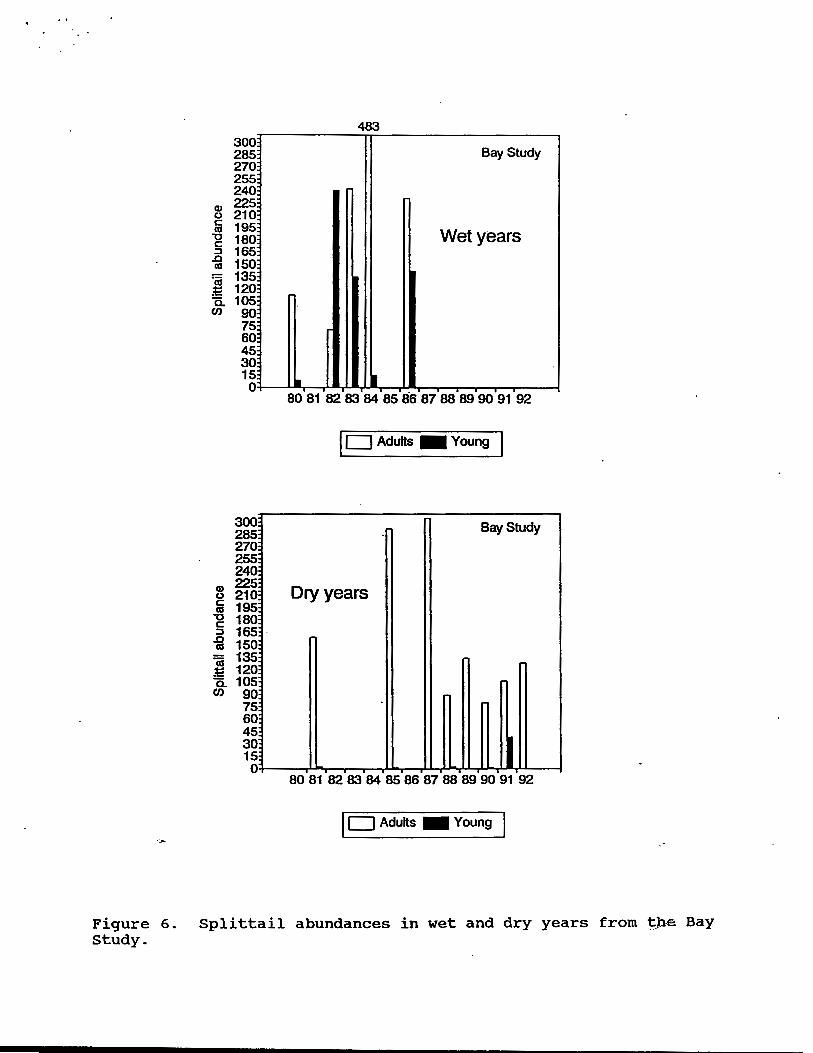
Figure 6. Splittail abundances in wet and dry years from the Bay Study.
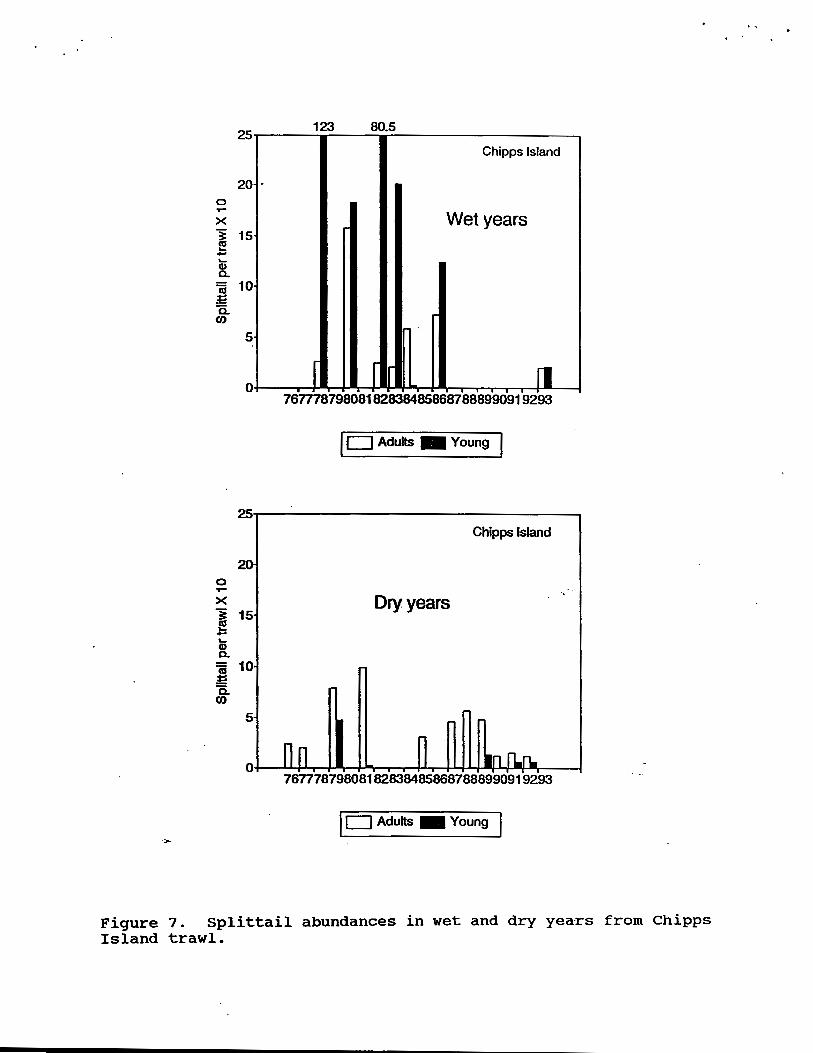
Figure 7. Splittail abundances in wet and dry years from Chipps Island .trawl.
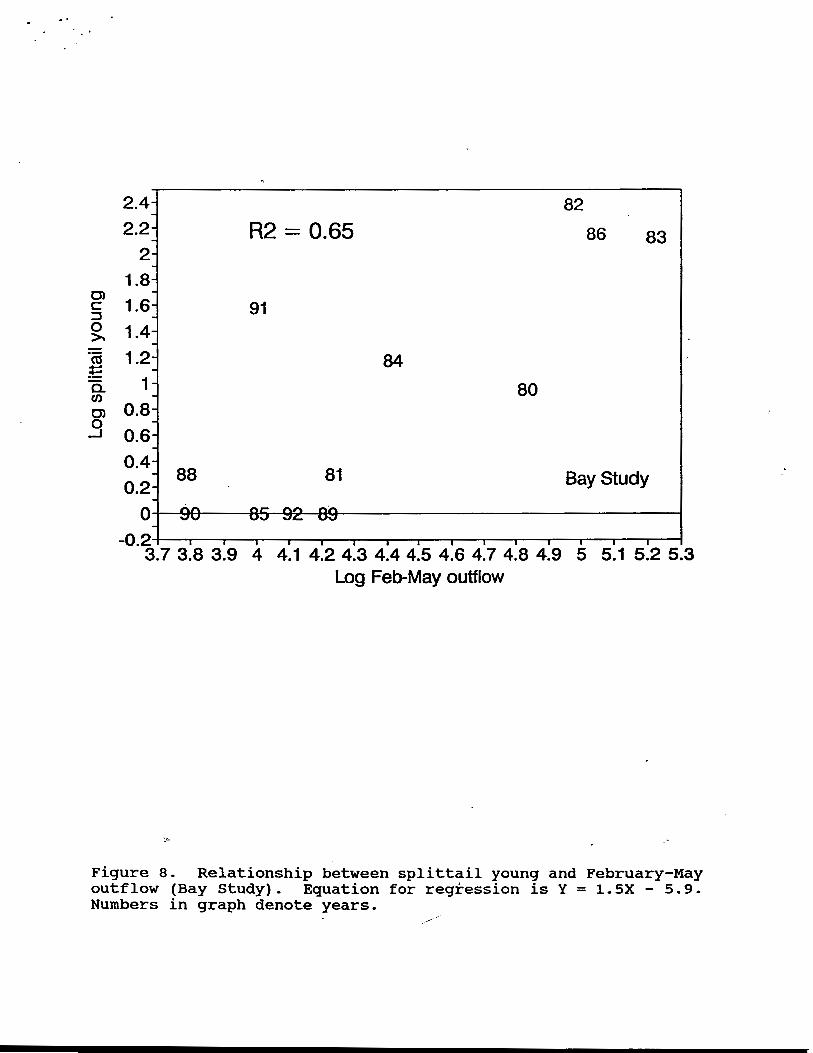
Figure 8. Relationship between splittail young and February-May outflow (Bay Study). Equation for regression is Y = 1.5X - 5.9. Numbers in graph denote years.
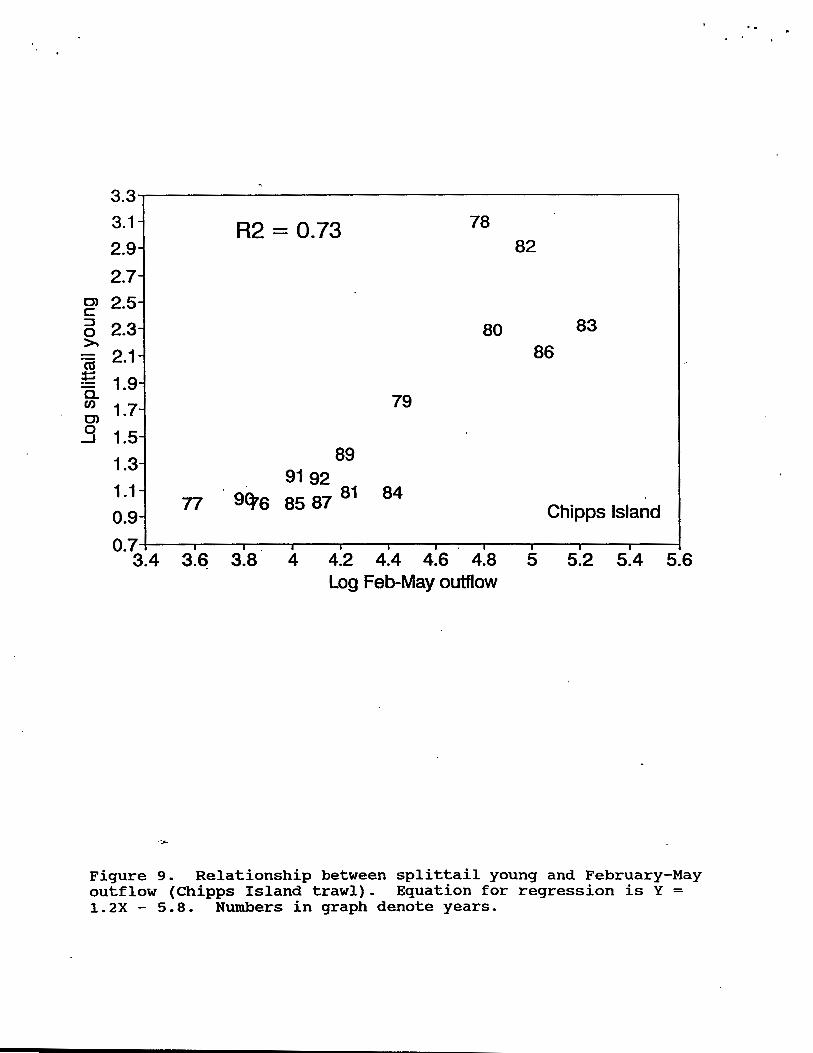
Figure 9.. Relationship between splittail young and February-May outflow (Chipps Island trawl). Equation for regression is Y = 1.2X - 5.8. Numbers in graph denote years.
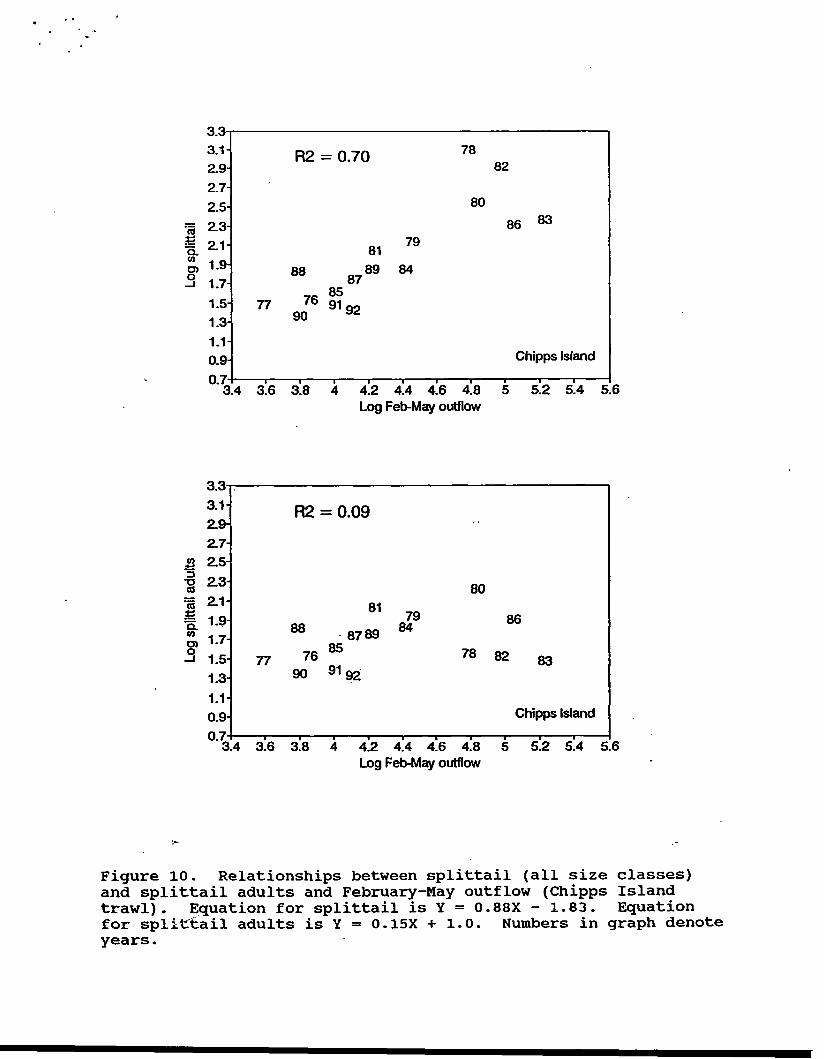
Figure 10, Relationships between splittail (all size classes) and splittail adults and February-May,outflow (Chipps Island trawl). Equation for splittail is Y = 0.88X - 1.83. Equation for splittail adults is Y = 0.15X + 1.0. Numbers in graph denote years.
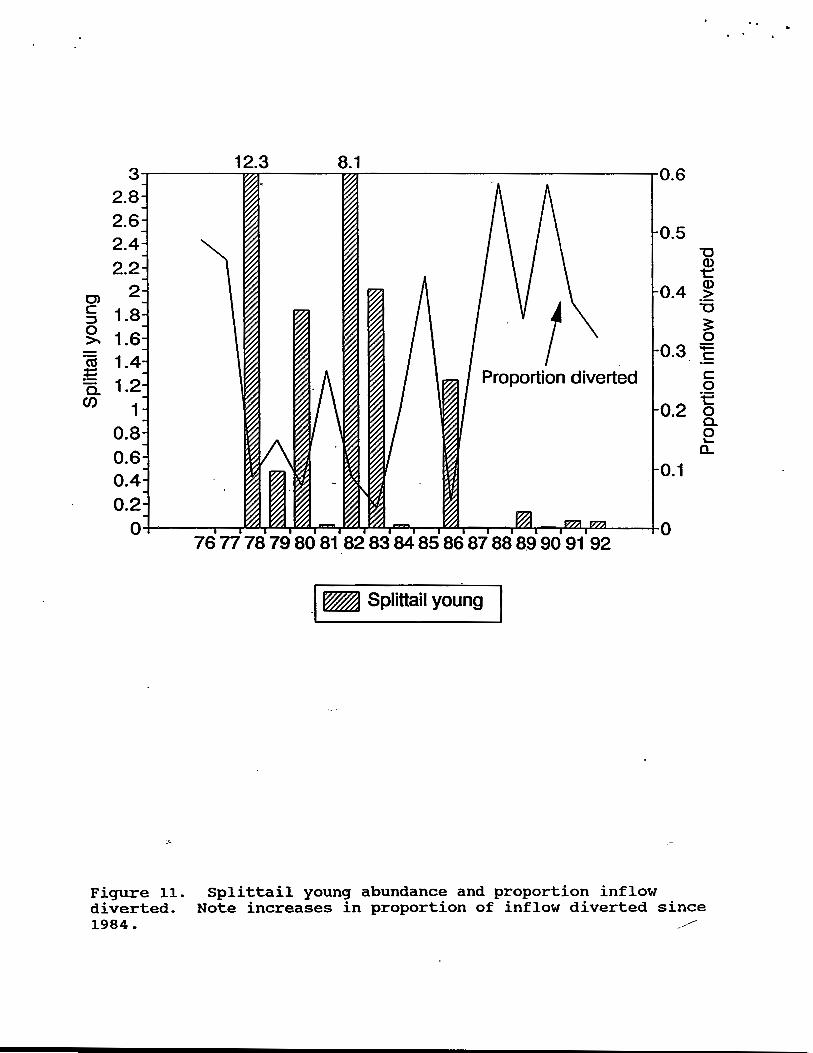
Figure 11. Splittail young abundance and proportion inflow diverted. Note increases in proportion of inflow diverted since 1984,
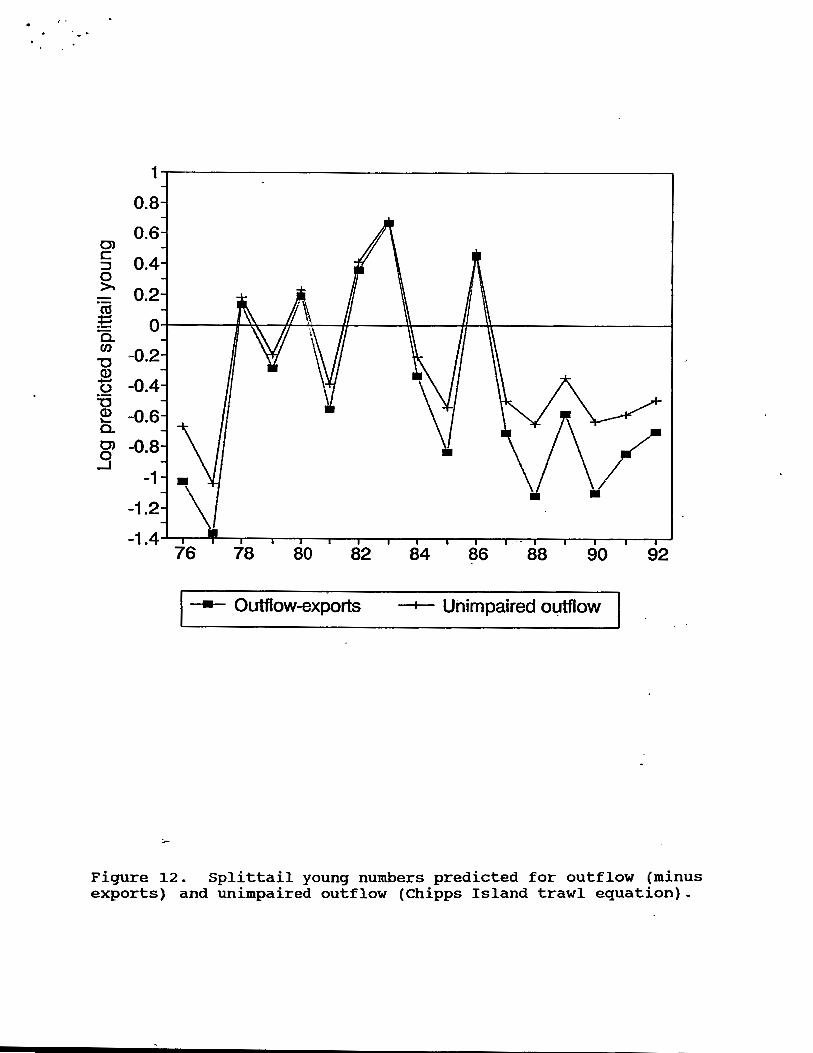
Figure f2. Splittail young numbers predicted for outflow (minus exports) and unimpaired outflow (Chipps Island trawl equation).
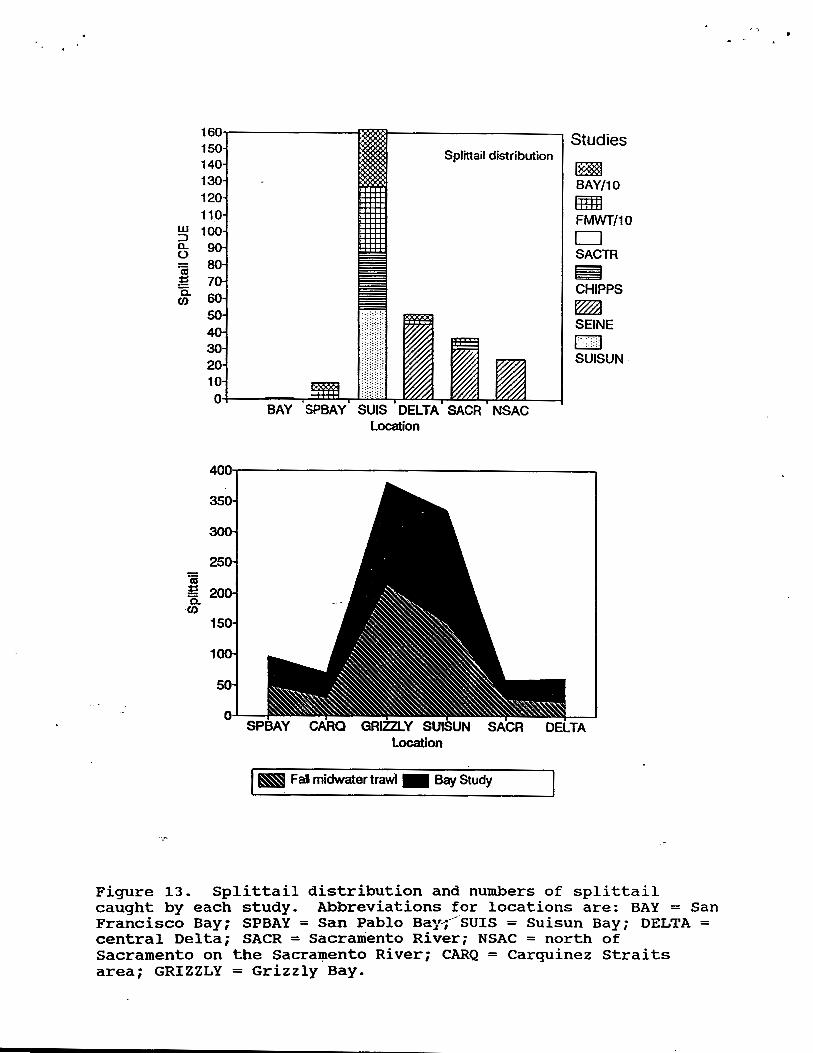
Figure 13. Splittail distribution and numbers of splittail caught by each study. Abbreviations for locations are: BAY = ,Sari Francisco Bay; SPBAY = San Pablo Bay; SUIS = Suisun Bay; DELTA = central Delta; SACR = Sacramento River; NSAC = north of Sacramento on the Sacramento River; CARQ = ~arquinez Straits area; GRIZZLY = Grizzly Bay.

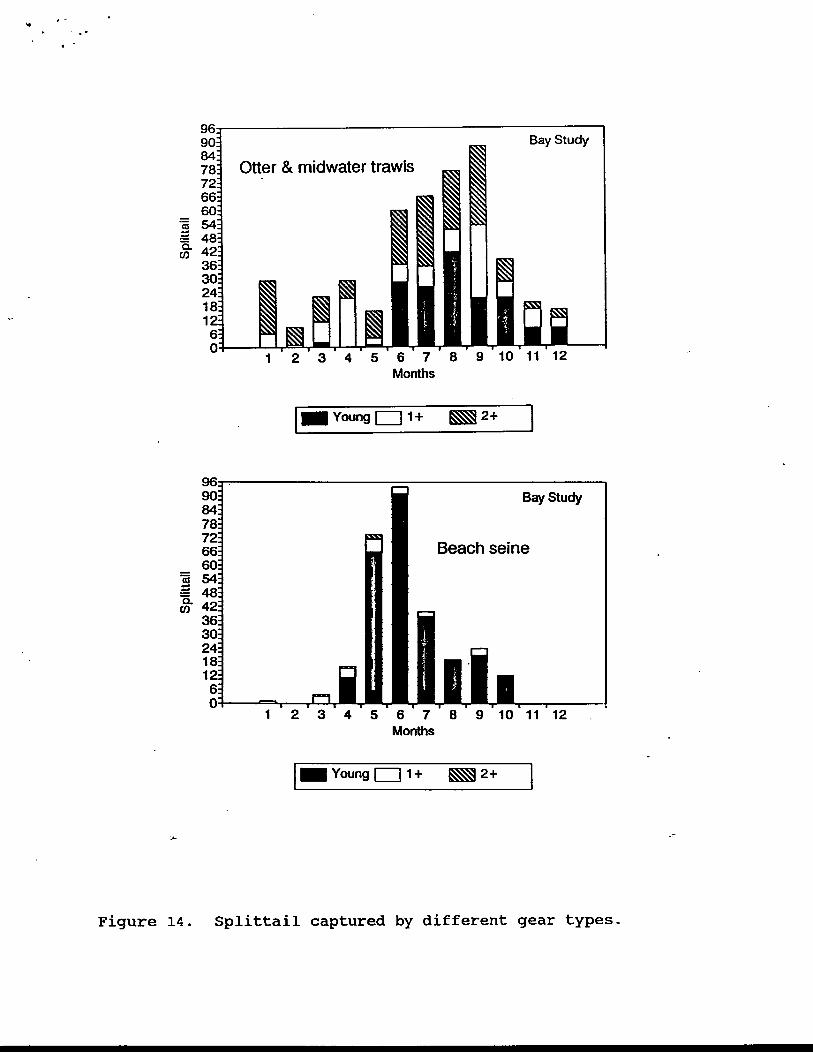
Figure 14. Splittail captured by different gear types.
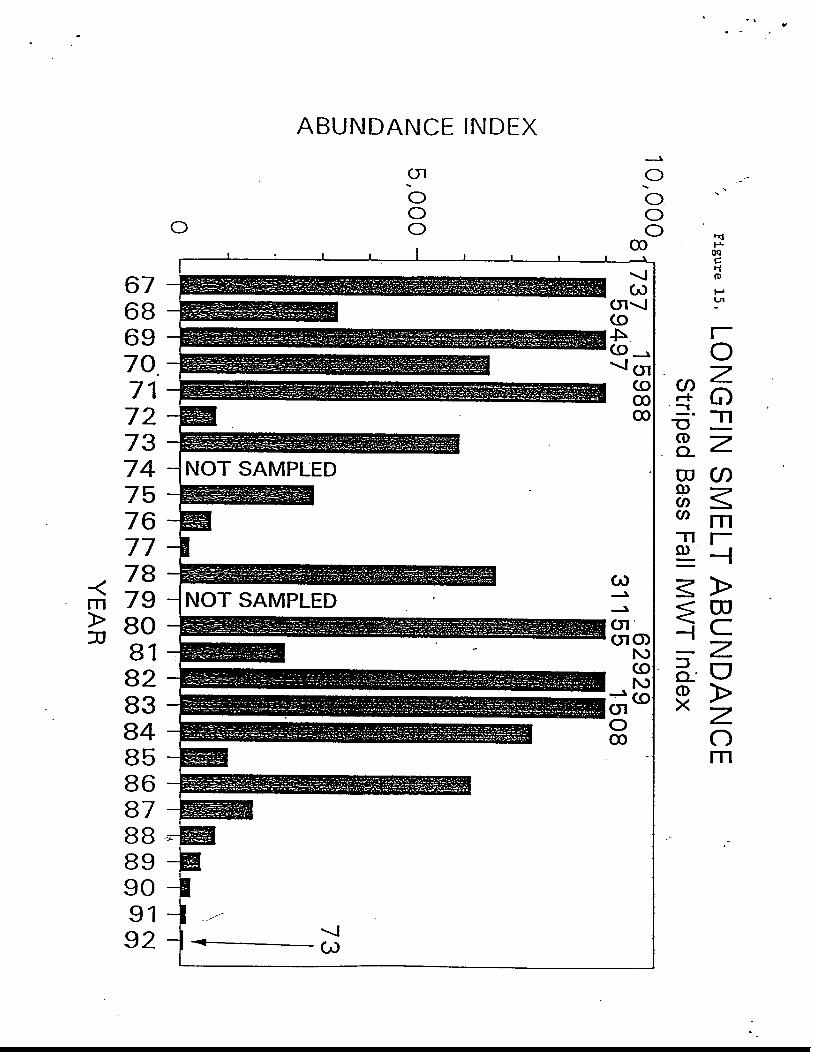
Figure f5. Yearly abundances of longfin smelt from the fall midwater trawl.
Figure 16. Relationship between longfin smelt abundance and outflow. R~ = 0.70.
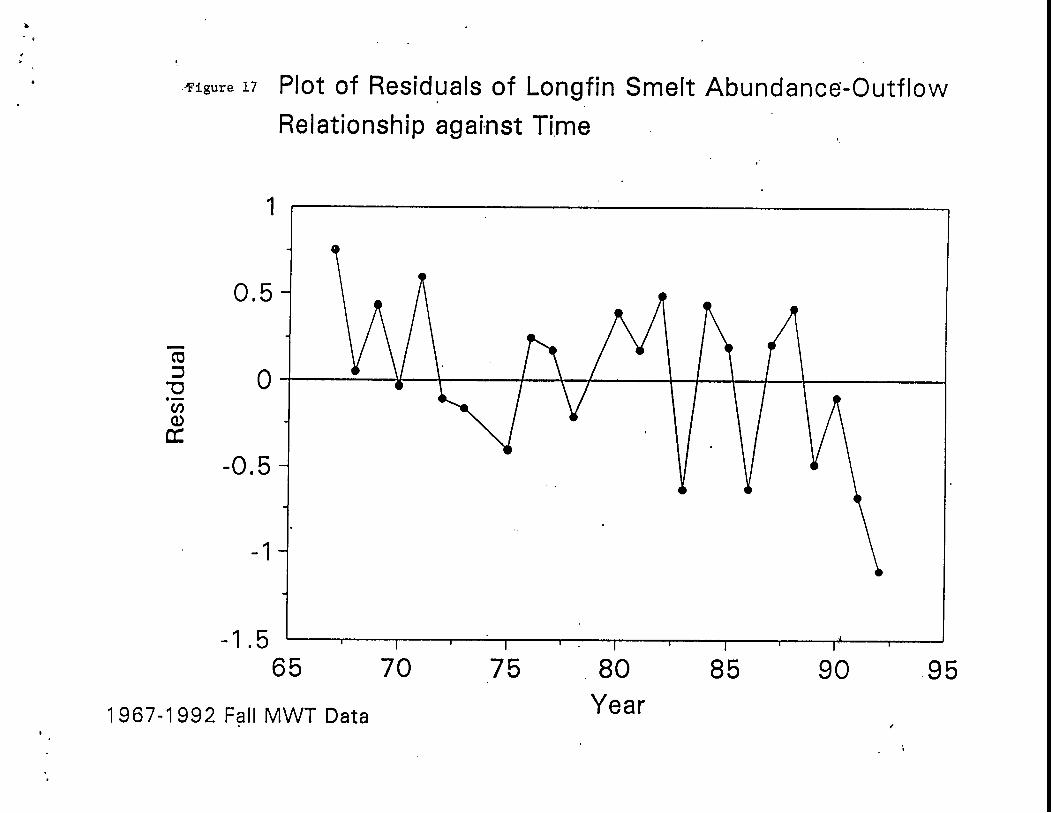
Figure 17. Plot of residuals of longfin smelt abundance-outflow relationship against time.
Figure 18. Longfin smelt abundance-outflow relationship with confidence intervals for the estimate of Y.
Figure 19. Longfin smelt salvaged at state (SWP) and federal (CVP) water pumps.
Status report on Sacramento splittall and longfin smelt
Introduction
On November 5, 1992, the Fish and Wildlife Service (Service)
received a petition from Mr. Gregory A. 7homas of the Natural
Heritage Institute to add Sacramento splittail (Pogonichthys
macrolepidotus) and longfin smelt (Spirkchus thaleichthys) to
the List of Endangered and Threatened Wildlife and to designate
critical habitat for each species in..the Sacramento and San
Joaquin Rivers and the Sacramento-San ~ozquin River Estuary,
California, In his letter, Mr. Thomas ieentified the following
eight'organizations as co-petitioners: 2merican Fisheries
Society, Bay Institute of San Francisco, Natural Heritage
Institute, Planning and Conservation League, Save San Francisco
Bay Association, Friends of the River, Szn Francisco Baykeeper,
and Sierra Club. On June 24, 1993, the Service issued a 90-day
finding that the petition presented subs-antial information
indicating that the requested action may be warranted. This
report summarizes additional infomation on Sacramento splittail
and longfin smelt.
Although primarily a freshwater species, Sacramento
splittail can tolerate salinities as hi@ as 10-18 parts per
thousanct- (ppt). Spawning occurs over flsoded vegetation in tidal
freshwater and euryhaline habitats of esruary marshes and sloughs
from late January to early July. Shallox-water habitat is
important for rearing of young and freshxater outflows may be
important for the dispersion of young to appropriate nursery
areas in Suisun Bay.
Longfin smelt are an anadromous euryhaline species, with a
two-year life cycle, that can tolerate salinities ranging from
freshwater to pure sea water. Spawning occurs in fresh to
brackish water over sandy-gravel substrates, rocks, or aquatic
plants. Spawning may take place as early as November and extend
into June, although the peak spawning period is from February to
April. Principal nursery habitat for larvae are the productive
waters of Suisun and San Pablo bays. Adults are found mainly in
Suisun, San Pablo and San Francisco bays, although their
distribution is shifted upstream in years of low river outflows.
Methods
Data were obtained from the ~alifornia Department of Fish
and Game (CDFG), the University of California, Davis (UCD), the
Service, and state and federal water project facilities. The
data sets analyzed included different seasons, years, locations,
and gear types. Fish were collected by seven independent means:
(1) an autumn midwater trawl survey in the upper estuary by CDFG,
(2) a monthly midwater and otter trawl survey in the lower
estuary by CDFG (San Francisco Bay-Outflow Study, hereafter Bay
Study),.'(3). a monthly otter trawl survey of Suisun Marsh, a tidal
marsh next to Suisun Bay by UCD, (4) a midwater trawl survey at
Chipps Island in Suisun Bay by the Service, (5) a midwater trawl
survey in the Sacramento River by the Service, (6) a beach seine
survey in the Delta and Sacramento River by the Service (Delta
refers to the area upstream of the confluence of the Sacramento-
San Joaquin rivers to Walnut Grove on the Sacramento and Mossdale
on the San Joaquin) and (7) salvage at state and federal pumping
facilities located in the south Delta by the California
Department of Water Resources and U, S. Bureau of Reclamation.
Fish were identified, measured (SL in UCD study, FL in all other
studies) and returned to the water.
Data from two CDFG studies were used. ~utucmn midwater trawl
collecting sites are established at standardized locations
scattered from San Pablo Bay through Suisun Bay and the Delta
upstream to Rio Vista on the Sacramento River and to Stockton on
the San Joaquin River. Surveys have been conducted monthly at 87
sites from September to December in most years from 1967 to
present. The Bay Study is a monthly, year-round, trawling
program that began in 1980. Its 42 sites are distributed
throughout the lower estuary from South San Francisco Bay
upstream to the confluence of the Sacramento and San Joaquin
rivers. The Bay Study uses otter and midwater trawls.
The Suisun Marsh fish survey has been conducted monthly by
UCD since 1979 with an otter trawl. Two 5- or 10-min tows are
made at 10 locations throughout the marsh. Because sloughs of
the marsh are shallow (2-3 m), the otter trawl samples most of
the water column.
Data from three Service studies were used. The Chipps
Island survey is conducted with a midwater trawl deployed mostly I*
at the surface. Each sampling effort consists of ten 20-min
trawls made in Suisun Bay in the channel between Chipps Island
and Pittsburg. Sanpling effort has varied in the Chipps Island
survey, but a core data set for the months of April, May and June
was used in this analysis. Sampling began in 1976 and is
conducted two-three times per week. The Sacramento trawl uses
similar methodology, but is conducted in the Sacramento River
from Walnut Grove to Sacramento (the location has varied over the
years), The Sacramento ira31 began in 1976 and continues to
present; no sampling was done from 1982-1987, A core data set
for May, June and July was used. The beach seine survey samples
about 23 sites in the Delta and on the Sacramento River upstreani
to Colusa.. This survey began in 1976 and data from January to
June were used.
State and federal water project pumps in the south Delta are
fitted with fish protection facilities. The fish facilities are
composed of a series of behavioral louvers which direct fish into
salvage wells. Fish are sampled from salvage wells, then
transported by truck upstream to sites in the Sacramento River
near Rio Vista. Fish are sampled at the fish facilities year-
round; records for splittail and longfin smelt date back to 1980.
The amount effort depends upon the amount of water pumped and
varies seasonally - In summary, the Bay Study, Suisun Marsh fish sampling and
fish salvage facilities provide year-round splittail and longfin
smelt abundance data from 1980 (Suisun Marsh began in 1979) to
present. The autumn midwater trawl, Chipps Island and Sacramento
trawls surveys provide seasonal information, The Suisun Marsh
study, Chipps Island and Sacramento trawls sample a limited
geographical area. The autumn midwater trawl survey covers a
wide area of splittail and longfin smelt range and dates back to
1967 ,
Data were summarized as catch per unit effort by month.
Fall midwater trawl and Bay Study data represent fish densities,
where catch per unit effort is multiplied by volume of water
sampled,
Results
Sacramento s p l i t t a i l
Splittail abundance declined an average of 62% over seven
surveys in the last 15 years (Figure 1). Percent declines were
.calculated by comparing abundance averages of years prior to and
following 1984. Yearly abundances were averaged for the pre-
decline period (start of survey to and including 1984) and for
the post-decline period (1985-1992); these averages were then
compared to calculate percent decline. The decline period was
chosen by examining graphs of yearly abundances (Figures 2, 3,
4). Splittail numbers declined dramatically after 1984. The
last good year of splittail reproduction was 1983 and the
abundance of recruits into 1984 (1-yr olds) partially masks the
beginning of a decline that'coincides with other estuary fishes
in 1984 .:-(e.g., delta smelt and longf in smelt) . Percent decline varied among studies (Figure I), with
greatest declines occurring in studies that center around the ,,--
shallow Suisun Bay area (i.e., Suisun Marsh and Chipps Island,
with declines of 81% and 83%, respectively). The lowest decline
was seen in the Bay Study (34%), vhich may be due to the later
years encompassed,by this study (1980-1992). The fall midwater
trawl sampled about the same geographical area as the Bay Study,
but began in 1976 and showed a greater decline .(46%). The number
of splittail young salvaged (per acre-foot of water pumped) has
declined an average of 64%- A higher decline was calculated for
federal pumps, 87% versus 41%, compared to state pumps (Figure
5). In 1993 splittail salvage was three times higher at the
federal pumps. This,may reflect changes in operation of Clifton
Court forebay that may have led to increased predation, or
spawning near the federal pumps. Before 1986, salvage was
consistently higher at the federal pumps.
Wet years increase splittail reproductive success. Plots of
young-of-year and adults in wet versus dry years (Figures 6, 7)
indicate that large year-classes occur in wet years and that few
young are sampled in dry years. Furthermore, wet-year related
young-of-year spikes have declined. The plot of Chipps Island
trawl (Figure 7) shows young-of-year abundances for 1978, 1982,
1983, 1986 and 1993 of 123, 80.5, 20, 13 'and 3 respectively.
Regressions of splittail young versus outflow show strong
relationships. Coefficients of determination ( R ~ ) range among
studies from 0.65 for the Bay Study (Figure 8) to. 0.73 for Chipps
Island .yFigure 9). The relationship between all year classes and
outflow (Figure 10) is slightly veaker (0.70 for Chipps Island).
The corresponding relationship for adults is very weak (Figure /-
/.
10, 0.09), indicating that the relationship between splittail and
outflow is particularly important for reproduction.
A graph of young-of-year abundances and proportion inflow
diverted shows clase correspondence between high proportions of
inflow diverted and low splittail young numbers (Figure 11).
Splittail young numbers at unimpaired outflows (outflow plus
exports) can be predicted from the equation developed for
splittail young and outflow. Plots of splittail young numbers
predicted from outflow and unimpaired outflow (Figure 12)
indicate that the water projects have significant effects in dry
years. In dry years there is an uncoupling between young
predicted with outflow versus unimpaired outflow. Abundances
predicted when exports are removed are consistently lower in dry
years. Moreover, there has been a consistent decoupling between
the predicted abundances since 1987. A similar trend has been
noted by Randy Baxter of CDFG, Stockton, for longfin smelt (see
next section).
Although splittail are taken as far north as Colusa and as
far downstream as San ~ancisco Bay in very wet years, the center
of distribution is Suisun Bay (Figure 13). Overall, splittail
catches have been the highest in the shallow-water areas of
Grizzly and Suisun bays. Fall midwater trawl and Bay Study data
indicate that 79% and 76% of the splittail catch has been in
Suisun and Grizzly bays (Figure 13).
Suisun Marsh has many areas of shallow-water habitat and is
adjacent to the center of splittail distribution. However,
Suisun Marsh data show the most consistent downward trend in
splittail numbers (Figure 3). Salinities in Suisun Marsh have
increased steadily since 1979, effectively decreasing shallow-
water habitat for splittail (primarily a freshwater fish).
Shallow-water habi,tat is related to freshwater outflow in the
estuary, because outflow pushes the mixing zone downstream and
creates brackish water (around 2 ppt) habitat in the shallows of
Suisun Bay. When the mixing zone moves upstream into Sacramento
River channels, shailow brackish-water habitat is lost. The high
percent declines seen in studies located in the Suisun Bay area
(Suisun Marsh and Chipps Island, see Figure 1) may be related to
the loss of shallow-water habitat in those areas,
The shift in splittail distribution upstream into the lower
Sacramento River and south Delta also reflects loss of shallow-
water habitat in the Suisun Bay area. Fall midwater trawl data
indicate that.91% of the splittail captured in San ~ablo'and . ..
lower Suisun bays were taken before 1983, whereas 77% of the fish
taken in the lower Sacramento River and south Delta were captured
after 1983. Because state and federal pumps are locatedmear the
lower Sacramento River and south Delta, this upstream shift in
distribution may increase splittail mortality at the pumps.
Gear used in the studies analyzed is effective for capturing
splittail of all sizes. Plots of three age classes of splittail
captured by otter and midwater trawls indicate that these methods
capture all size classes effectively (Figure 14). Beach seining,
on the &her hand, captures mostly young-of-year.
Longfin smelt
Fall midwater trawl data on longfin smelt were analyzed by
Randy Baxter of CDFG, Stockton.
Fall midwater trawl data indicate that longfin smelt numbers
have declined by 50% annually since 1987 and that the decline
since 1984 has been 90%. In 1991 and 1992, indices were lower
than any previously calculated index (Figure 15). Although
outflow increased in 1992, the strong outflow-abundance
relationship ( R ~ = 0.70, Figure 16), appears to be breaking down.
Residuals (differences between the estimated index, based on the
regression, and the actual index) have been consistently negat%ve
for the last four years (Figure 17) and abundance for 1992
occurred outside of the 95% confidence interval (Figure 18). A
similar situation was noted for splittail and suggests that other
factors are affecting abundance, such as a shortage of spawners.
In other words, stocks are so depressed that there aren't enough
fish to produce a good year class.
Salvage data indicate that longfin smelt are vulnerable to
pumping. Although fall midwater trawl data show a 90% decline
for longfin smelt since 1984, state pumping data show only a 24%
decline. This discrepancy in decline -rates is due to the
increased entrainment of longfin smelt at the pumps (Figure 19).
The federal facility nsalvagedll four times as many longfin smelt
per acre-foot of water pumped from 1985-91 compared to 1981-84.
Numbers for state pumps are 12 times as many longfin smelt
salvaged after 1984 for the same time periods. It is doubtf-ul
that longfin smelt survive salvage operations. The increase in
salvage rate despit.e a well-documented decline suggests that
longfin smelt have been more vulnerable to pumping operations in
recent years (since 1984). The increase in vulnerability may be
due to the concentration of longfin smelt populations in the
upper estuary close to the pumps due to decreases in outflow.
Moreover, decreases in outflow fail to disperse larvae downstream
to Suisun Bay nursery areas where they removed from pumping
effects.
Conclusions
Analyses of survey data for splittail indicate:
1) Splittail'have declined an average of 62% over seven surveys
since 1984.
2) Successful reproduction is highly correlated with wet years,
but young-of-year abundance has declined steadily in wet years
since 1976.
, 3) There is a strong relationship between young-of-year abundance
and spring outflow (outflow into San Francisco Bay after water
exports are removed).
4) Predicted young-of-year abundance using unimpaired outflow
(outflow without exports removed) is higher than expected in dry
years indicting that water exports affect young-of-year abundance
in dry years.
5) The relationship between predicted abundances for outflow and
unimpaired outflow weakened during the six-year drought and.
suggests stocks may be losing the ability to recover.
6) Splittail are most abundant in shallow areas of Suisun and
Grizzly bays and are vulnerable to increasing salinities in these ./-.
areas caused by upstream migration of the mixing zone due to
water exports and drought. Concentration of splittail in shallow
areas suggests that they are particularly vulnerable to
reclamation activities.
7) Midwater and otter trawls are efficient gear for catching all
size classes of splittail.
Analyses of survey data for longfin smelt indicate:
1) Longfin smelt have declined 90% since 1984 and numbers have
declined by 50% annua.11~ since 1987.
2) In 1991 and 1992, indices were lower than any previously
calculated index.
3) The strong outflow-abundance relationship appears to be
breaking down. Differences between estimated and actual indices
have been consistently negative for the last four years and
abundance for 1992 lies outside of the 95% confidence interval.
4) Although longfin smelt have declined by 90% in the estuary,
numbers salvaged by state and federal pumping facilities have
increased several-fold since 1984. This suggests that longfin
smelt populations (particularly young-of-year) concentrated above
Suisun Bay due to low outflows are increasingly vulnerable to
:entrainment.
Splittail declines since 1984
FMWT SUIS BAY SACTR Study
CHIPPS
Figure 1. Splittail declines since 1984. Percent declines were calcula-d by comparing abundance averages of years prior to-and following 1984. FMWT = fall midwater trawl, SUIS = Suisun Marsh study, BAY = Bay Study, SACTR = Sacramento trawl, CHIPPS = Chipps Island trawl.
0 Adults 0 Young
0 Adults Young
Figure 2. Yearly abundances of s p l i t t a i l adults and young from the Bay Study and Chipps Island trawls.
15- 14- 13-
12: . Suisun Marsh
- 11: 2 10: L -. L 9:
8: - - 6 7: F s - - 6- P cl, 5-
0 Adults Young
Sacramento trawl
76-?7-78'79'80'81 '82'83'84'85'86'87'888889'909091 '92
Figure 3 . Yearly abundances of s p l i t t a i l from the Suisun Marsh study and Sacramento trawl.
1-
ABUNDANCE INDEX
i
OT SAMPLED
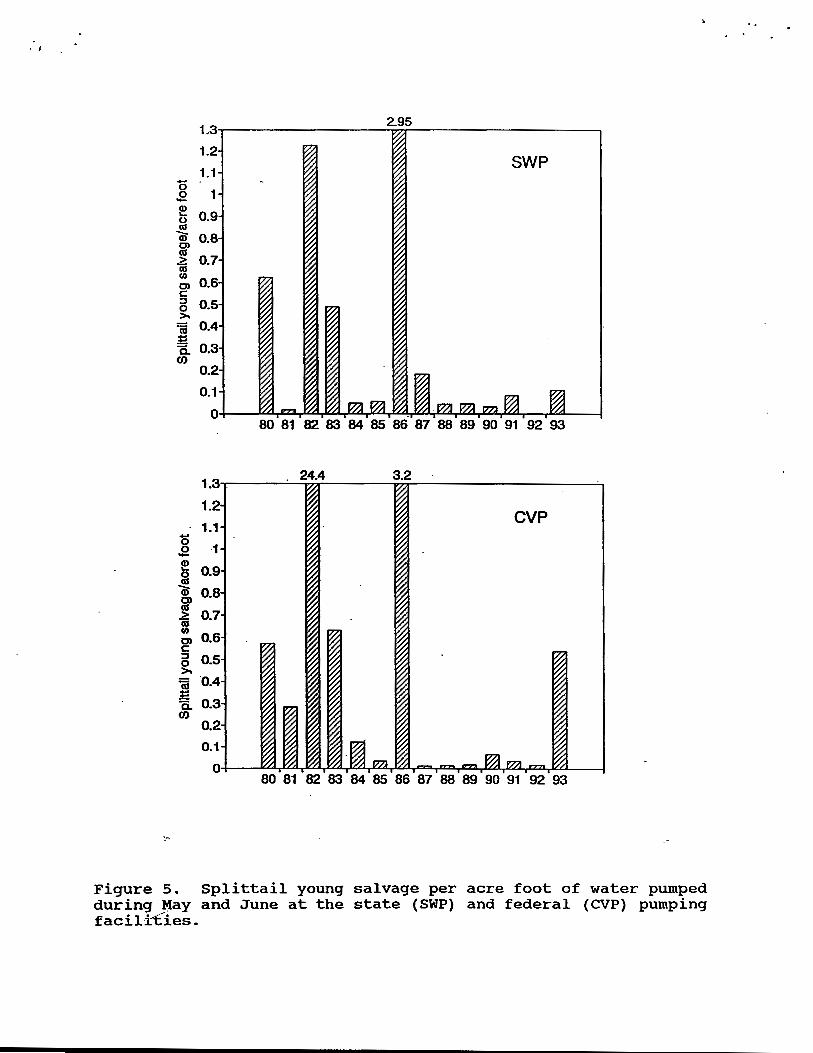
Figure 5 . S p l i t t a i l young salvage per acre f o o t o f water pumped during May and June a t the s t a t e (SWP) and federal (CVP) pumping
i les. f a c i l ' c
I Adults , Young
0 Adults Young
Figure 6. Splittail abundances in wet and dry years from tp Bay Study.
0 Adults 0 Young
Chipps Island
Dry years
0 Adults , Young
Figure 7. Splittail abundances in wet and dry years from Chipps Island trawl.
Bay Study
Log Feb-May outflow
Figure 8. Relationship between splittail young and February-May outflow (Bay Study), Equation for regression is Y = 1 , 5 X - 5.9- Numbers in graph denote years.
,/-.'
Chipps Island
0.7 ! I I I I I 1 . 1 I 1 I
3.4 3.6 3.8 4 4.2 4.4 4.6 4.8 5 5.2 5.4 ! Log Feb-May oufflow
Figure 9. Relationship between splittail young and February-May outflow (Chipps Island trawl). Equation for regression is Y = 1.2X - 5.8. Numbers in graph denote years.
1.1 - 0.9-
Figure 10. Relationships between splittail (all size classes) and splittail adults and February-May outflow (Chipps Island trawl). Equation for splittail is Y = 0.88X - 1.83. Equation for splietail adults is Y = 0.15X + 1.0. Numbers in graph denote years.
Chipps Island
1.1- 0.9-
0.77 I I I . I I a . I I
3.4 3.6 3.8 4 4.2 4.4 4.6 4.8 5 5.2 5.4 ! Log Feb-May outflow
Chipps Island
0.7+ 8 m 8 8 I
3.4 3.6 3.8 4 4.2 4.4 4.6 4.8 5 5.2 5.4 ! Log Feb-May outflow
I Splittail young I
Figure 11. Splittail young abundance and proportion inflow diverted. Note increases in proportion of inflow diverted since 1984. -I
+ Outflow-exports + Unimpaired outflow
Figure 12. Splittail young numbers predicted for outflow (minus exports) and unimpaired outflow (Chipps Island trawl equation).
Studies
m BAY11 0
m FMWTI10
0 SACTR
c-.l CHIPPS
rn SEINE 0 SUISUN
Location
Fbl midwater trawl Bay Study I
Figure 13. Splittail distribution and numbers of splittail caught by each study. Abbreviations for locations are: BAY = San Francisco Bay; SPBAY = San Pablo Bafi'SUIS = Suisun Bay; DELTA = central Delta; SACR = Sacramento River; NSAC = north of Sacramento on the Sacramento River; CARQ = Carquinez straits area; GRIZZLY = Grizzly Bay.
Otter
1
Bay Study Rl
Months
Bay Study
Beach seine
1 2 3 4 5 6 7 8 9 1 0 1 1 1 2 . Months
Y o u n g 0 I+ 2+
Figure 14. Splittail captured by different gear types.
ABUNDANCE INDEX

Longfin Smelt Abundance vs Outflow
- - '6'7-'90 data used for -
- - - - - - - - - - - - - - - - - -
A - - I I I I I I ' I 1 I 1 I I I I I I I I
4 4.4 4.8 Log Feb-May Outflow
17 Plot of Residuals of Longfin Smelt Abundance-Outflow
Relationship against Time
-1.5 I
65 70
1967-1 992 Fall MWT Data Year
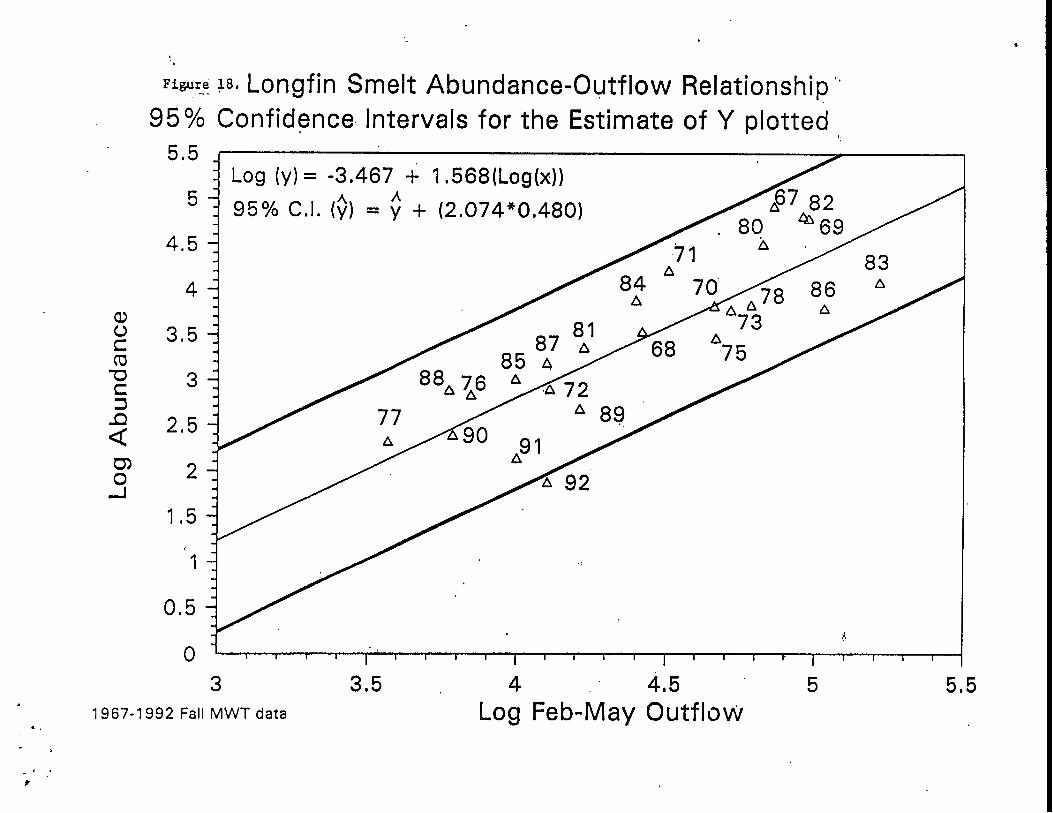
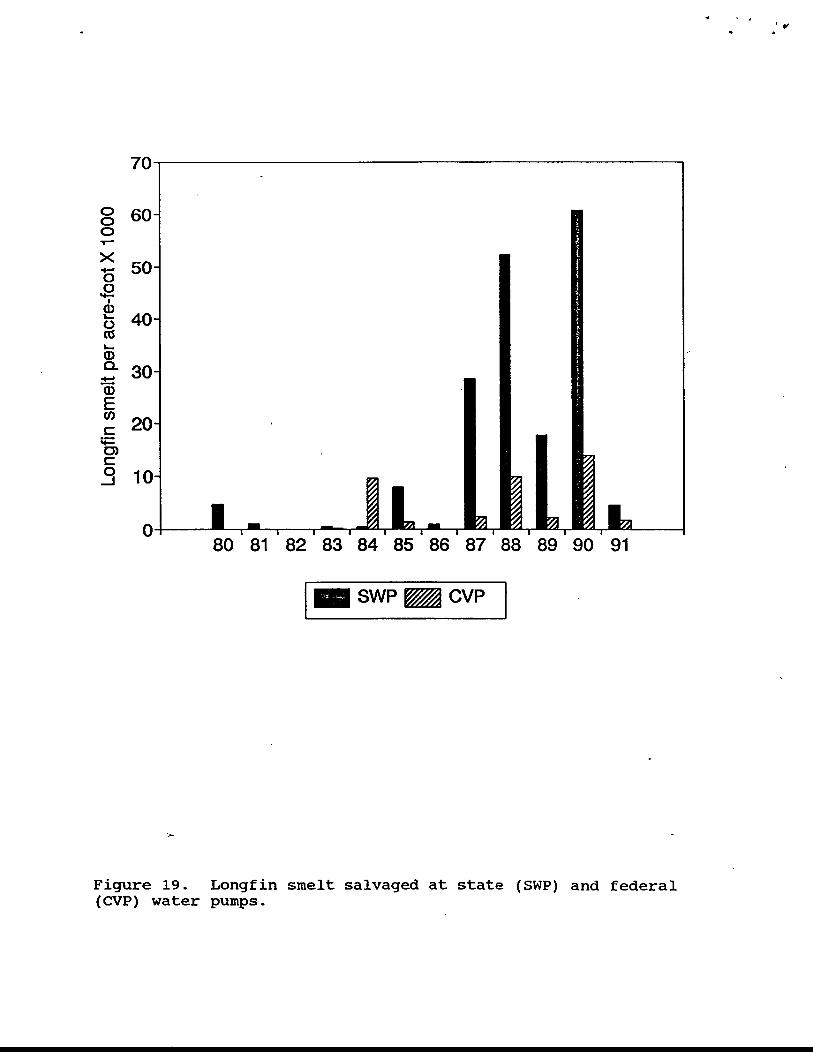
Figure 19. Longfin smelt salvaged at state (SWP) and federal (CVP) water pumps.