Status of Trophy Hunting in Zambia for the Period 2003 ......2Copperbelt University, Kitwe, Zambia....
17
G.J.B.A.H.S.,Vol.4(3):137-153 (July-September, 2015) ISSN: 2319 – 5584 137 Status of Trophy Hunting in Zambia for the Period 2003 – 2012: Is Hunting Justified in Zambia? *1 Chansa Chomba & 2 Vincent Nyirenda 1 School of Agriculture and Natural Resources, Disaster Management Training Centre, Mulungushi University, P. O. Box 80415, Kabwe, Zambia. 2 Copperbelt University, Kitwe, Zambia. *Corresponding Author Abstract A study was carried out to determine the status of trophy hunting in Zambia for the period 2002/3 – 2012 after the Department of National Parks and Wildlife Service was transformed into Zambia Wildlife Authority a semi autonomous institution. The main objectives were to determine: i) size of hunting quotas between residents and non residents, ii) revenue collected from residents and non residents, iii) status of game management areas and income collected, and iv) most popular species in hunting. Data was collected from the field particularly Form ZAWA 14, which captures hunting details. Further data were collected from the licencing office at Zambia Wildlife Authority headquarters in Chilanga. Results obtained showed that mean quota size for safari was 56% and 44% for residents, yet safari hunting contributed 95% of the revenue and only 5% was generated from resident hunting. Prime hunting areas were few 31%, secondary 41 % specialized 8%, under stocked 13% and private 9%. In terms of revenue in USD prime generated the most followed by secondary, specialized which was at the same level with private hunting areas while under stoked generated the least. When compared with other sources of income for ZAWA hunting showed an increase over other sources. The most hunted species under resident were; buffalo, waterbuck, puku, bushbuck, lechwe, wildebeest, oribi, common duiker, reedbuck, and greater kudu. Under nonresident; lechwe, wildebeest, lion, buffalo, leopard and puku. It was observed that the status of habitats and animal numbers in most game management areas had declined, yet hunting continued to be an important source of revenue for Zambia Wildlife Authority. Further research is required on how under stocked and depleted game management areas can be rehabilitated to support the lucrative trophy hunting industry which also benefits local communities’ resident in these areas. Further research is required to develop a model that would help Zambia Wildlife Authority to rehabilitate under stocked and depleted Game Management Areas. Keywords: Nonresident Hunting, Resident Hunting, Quotas, Game Management Areas, Revenue, Species 1. Introduction Nonresident (Safari) hunting in Zambia begun as a government scheme in the Luangwa valley in the 1950s. Over the years, the hunting industry spread to cover the whole country. In the 1950s to early 1970s the safari hunting industry did not attract as much public attention as it does today and the allocation of safari hunting blocks was mainly done administratively. During this time, operations of the safari industry suffered various malpractices, which among others caused government to terminate and compensate 26 safari hunting concessions through a presidential order in 1988. Even though the safari hunting companies were compensated by government for loss of business, its intention at the time was to try to cleanse the industry of the alleged malpractices. At this time, local communities residing in Game Management Areas (GMAs) did not participate in the allocation of hunting blocks neither did they have a share of the revenue accruing from trophy hunting. In the early 1980s a pilot project was initiated in Lupande which later gave birth to the Administrative Management Design (ADMADE) for Zambia’s Game Management Areas which was a community based natural resources management philosophy. It was finally accepted as government policy for managing wildlife resources in GMAs. This programme (ADMADE) introduced a system of sharing revenue generated from hunting in GMAs with local communities resident in those particular areas. Safari hunting from that point became an important source of revenue and employment for local communities. As a result of benefits accruing to local communities arising from hunting, communities living in GMAs got involved in working with the Department of National Parks and Wildlife Service (NPWS) in solving poaching problems originating from within their own frontiers. In the long-term, it was assumed that local communities would deter poaching incursions and regulate human settlements in a manner that would leave enough land for wildlife management, since doing so would enhance their economic benefits from the wildlife resources. In the second republic which begun in 1991, a new democratic political dispensation took root in Zambia. Government shifted its management style of many of its public institutions from being totally government controlled to being semi autonomous based on good governance, transparency and accountability. This policy shift also resulted in the change of allocation of Hunting Concession Areas from administrative to Open Tender System. The initial Safari Hunting Concession Agreements that followed had three year tenure, followed by a five year tenure which expired in 2001 (Anon. 2009). Regarding institutional transformation, the NPWS was transformed from a government department to a semi autonomous institution, Zambia Wildlife Authority (ZAWA) in 1999. Such institutional transformation also affected the ADMADE programme which was reviewed to bear a generic name, Community Based Natural Resources Management (CBNRM) programme and the sharing mechanisms of revenue was also reviewed in favour of local communities. Communities were now entitled to a 50% share of revenues. In 2001/2002 safari hunting was banned by government,
Transcript of Status of Trophy Hunting in Zambia for the Period 2003 ......2Copperbelt University, Kitwe, Zambia....
G.J.B.A.H.S.,Vol.4(3):137-153 (July-September, 2015) ISSN: 2319 – 5584
137
Status of Trophy Hunting in Zambia for the Period 2003 – 2012: Is Hunting Justified in Zambia?
*1Chansa Chomba &
2Vincent Nyirenda
1School of Agriculture and Natural Resources, Disaster Management Training Centre, Mulungushi University,
P. O. Box 80415, Kabwe, Zambia. 2Copperbelt University, Kitwe, Zambia.
*Corresponding Author
Abstract A study was carried out to determine the status of trophy hunting in Zambia for the period 2002/3 – 2012 after the
Department of National Parks and Wildlife Service was transformed into Zambia Wildlife Authority a semi autonomous
institution. The main objectives were to determine: i) size of hunting quotas between residents and non residents, ii)
revenue collected from residents and non residents, iii) status of game management areas and income collected, and iv)
most popular species in hunting. Data was collected from the field particularly Form ZAWA 14, which captures hunting
details. Further data were collected from the licencing office at Zambia Wildlife Authority headquarters in Chilanga.
Results obtained showed that mean quota size for safari was 56% and 44% for residents, yet safari hunting contributed
95% of the revenue and only 5% was generated from resident hunting. Prime hunting areas were few 31%, secondary 41
% specialized 8%, under stocked 13% and private 9%. In terms of revenue in USD prime generated the most followed by secondary, specialized which was at the same level with private hunting areas while under stoked generated the least.
When compared with other sources of income for ZAWA hunting showed an increase over other sources. The most
hunted species under resident were; buffalo, waterbuck, puku, bushbuck, lechwe, wildebeest, oribi, common duiker,
reedbuck, and greater kudu. Under nonresident; lechwe, wildebeest, lion, buffalo, leopard and puku. It was observed that
the status of habitats and animal numbers in most game management areas had declined, yet hunting continued to be an
important source of revenue for Zambia Wildlife Authority. Further research is required on how under stocked and
depleted game management areas can be rehabilitated to support the lucrative trophy hunting industry which also benefits
local communities’ resident in these areas. Further research is required to develop a model that would help Zambia
Wildlife Authority to rehabilitate under stocked and depleted Game Management Areas.
Keywords: Nonresident Hunting, Resident Hunting, Quotas, Game Management Areas, Revenue, Species
1. Introduction Nonresident (Safari) hunting in Zambia begun as a government scheme in the Luangwa valley in the 1950s. Over
the years, the hunting industry spread to cover the whole country. In the 1950s to early 1970s the safari hunting industry
did not attract as much public attention as it does today and the allocation of safari hunting blocks was mainly done
administratively. During this time, operations of the safari industry suffered various malpractices, which among others
caused government to terminate and compensate 26 safari hunting concessions through a presidential order in 1988. Even
though the safari hunting companies were compensated by government for loss of business, its intention at the time was to try to cleanse the industry of the alleged malpractices. At this time, local communities residing in Game Management
Areas (GMAs) did not participate in the allocation of hunting blocks neither did they have a share of the revenue
accruing from trophy hunting.
In the early 1980s a pilot project was initiated in Lupande which later gave birth to the Administrative Management
Design (ADMADE) for Zambia’s Game Management Areas which was a community based natural resources
management philosophy. It was finally accepted as government policy for managing wildlife resources in GMAs. This
programme (ADMADE) introduced a system of sharing revenue generated from hunting in GMAs with local
communities resident in those particular areas. Safari hunting from that point became an important source of revenue and
employment for local communities. As a result of benefits accruing to local communities arising from hunting,
communities living in GMAs got involved in working with the Department of National Parks and Wildlife Service
(NPWS) in solving poaching problems originating from within their own frontiers. In the long-term, it was assumed that
local communities would deter poaching incursions and regulate human settlements in a manner that would leave enough land for wildlife management, since doing so would enhance their economic benefits from the wildlife resources.
In the second republic which begun in 1991, a new democratic political dispensation took root in Zambia.
Government shifted its management style of many of its public institutions from being totally government controlled to
being semi autonomous based on good governance, transparency and accountability. This policy shift also resulted in the
change of allocation of Hunting Concession Areas from administrative to Open Tender System. The initial Safari
Hunting Concession Agreements that followed had three year tenure, followed by a five year tenure which expired in
2001 (Anon. 2009).
Regarding institutional transformation, the NPWS was transformed from a government department to a semi
autonomous institution, Zambia Wildlife Authority (ZAWA) in 1999. Such institutional transformation also affected the
ADMADE programme which was reviewed to bear a generic name, Community Based Natural Resources Management
(CBNRM) programme and the sharing mechanisms of revenue was also reviewed in favour of local communities. Communities were now entitled to a 50% share of revenues. In 2001/2002 safari hunting was banned by government,

G.J.B.A.H.S.,Vol.4(3):137-153 (July-September, 2015) ISSN: 2319 – 5584
138
while resident hunting continued. During the hunting moratorium, many hunting areas experienced high levels of
poaching and human encroachment while ZAWA staff persevered for many months without salaries. Village scouts were
also unable to patrol GMAs as they also did not receive salaries. The ban and consequently the delay in allocating
hunting concession areas by government cost ZAWA and communities a great deal of revenue losses and customer
confidence and the image of the country as a hunting destination was allegedly tarnished. Many hunting blocks that were
previously in the prime category were downgraded to secondary, under stocked and even depleted. The GMAs/hunting
blocks that were most affected were; Sichifulo, Mulobezi, Mumbwa East and Tondwa.
Later in 2002, government realized that the hunting ban had inevitably affected income generation for ZAWA and
local communities. ZAWA staff did not receive salaries for a continuous period of up to five months or more. Local
communities did not receive their shares and village scouts could not patrol GMAs. The non remittance of community shares due to hunting ban compelled members of the local communities to either engage or facilitate poaching to
supplement their income and to derive protein. During this period, human encroachment was exacerbated in many areas
as communities allegedly saw no incentive to protect wildlife. The negative effects of such encroachment are still being
felt to date, particularly in Mumbwa east and Sichifulo GMAs (Anon. 2010).
In 2003 government decided to reallocate hunting concession areas to improve revenue collections for ZAWA and
to restore the active participation of local communities living in GMAs. The hunting ban despite its alleged negative
effects on particularly the status of hunting concession areas provided time for government to assess the suitability of the
open tender system of allocating hunting concession areas. This assessment was based on the understanding that despite
Zambia having one of the largest hunting areas in eastern and southern African sub regions, ZAWA earned less than
USD 5million annually, while the Department of Wildlife in Tanzania (now Tanzania Wildlife Authority) earned about
USD 30 million (2010 figure) (Pers. Comm..) and Zimbabwe with a smaller hunting area only 11% of Zambia’s GMA area earned about USD 20 million (2003 figure) (Pers. Comm.). This disparity in income from hunting compelled
government to launch an investigation into the operations of the safari hunting industry (Anon. 2002). The alleged low
revenue collection from hunting justified government’s concern to investigate the status quo. It was at the time assumed
that ameliorating measures if taken objectively would improve revenue collection and enhance the financial status of
ZAWA and the local communities. A study tour was undertaken to Zimbabwe and yielded a wealth of information
which was presented to government for consideration. Key among these were that; i) Zambia needed to adopt a bag
system which would enable ZAWA to earn more revenue even from less popular species such as baboon (Papio spp) as
the quota would be paid for upfront and in full which eliminates the current practice of negotiating quota utilization
levels with hunting outfitters, ii) eliminate the need for classical, mini/midi safaris which often compels ZAWA to
provide certain species on the quota even if their numbers are low, iii) increase hunting concession fees and subdivide
some hunting blocks which are too big to be effectively administered by one operator, iv)enter into strategic partnerships
with the private sector to ensure that depleted and under stocked areas are restocked and secondary areas upgraded to prime status, v) introduce a new business model which encourages a mixture of approaches in allocating hunting blocks
such that some prime areas can be allocated through auctioning, others by lottery and still others by open tender, vi) to
stagger lease periods so that concession agreements do not expire at the same time which would enable ZAWA to spread
its income flows, viii) to consider citizens’ participation as safari outfitters, ix), and to recapitalize ZAWA so as to
improve operations in National Parks so that a buildup of animal populations would naturally spill into surrounding
GMAs.
Despite the recommendation to explore other ways of allocating hunting concession areas, HCAs were again
allocated by tender ignoring the recommendations made by a team of experts. Hunting Concession Agreements with a
lease period of ten years for prime and secondary hunting areas and 15 for under stocked hunting areas were granted.
Additional HCAs allocated in 2005, had a lease period of five years for prime and secondary areas and ten for under
stocked areas (Table 1). In this open tender system, the selection criteria were not necessarily based on the highest bidder but on other supporting evidence such as, i) evidence of a company’s ability to market a given HCA, ii) pledges to the
local community living near to or within the HCA, iii) company’s financial status, iv) assets available to operate a safari
camp, v) evidence to show that the company has agents to help with overseas bookings, vi) marketing ability, vii)
wildlife management inputs pledged, and viii) proof of qualified professional hunters among others. Consequently the
issue of low revenue collections persisted. In 2012, the allocation of hunting concession areas was again cancelled and
there was no hunting in 2013 and 2014. In 2015, hunting concessions were again reallocated without considering the
earlier recommendations. This study therefore, was aimed at examining quota allocation between resident and non
residents, sources of income for ZAWA and local communities, comparison of income between resident and nonresident
quotas, the most hunted species under resident and nonresident hunting categories, status and classification of
concession areas, and quota setting techniques among others.

G.J.B.A.H.S.,Vol.4(3):137-153 (July-September, 2015) ISSN: 2319 – 5584
139
Table 1 Hunting Concession Areas and length of lease
No. Hunting
Concession Area
Operator Category Length of
lease
Year lease
signed
Year of
expiry of
lease
1 Nkala Nsonga Game
Mgt.
Prime 10 2003 2012
2 Mumbwa West Swanepol
&Scandrol
Prime 10 2003 2012
3 Mulobezi Mulobezi
Outfitters
Prime 10 2003 2012
4 Kasonso
Busanga
Hunters and
Guides
Prime 10 2003 2012
5 Upper
Lupande
Mangomba
Safaris
Prime 10 2003 2012
6 Lower
Lupande
Kwalata Safaris Prime 10 2003 2012
7 Mwanya Sofram Safaris Prime 10 2003 2012
8 Lumimba Chanjuzi
Muchinga Adventures
Prime 10 2003 2012
9 Nyampala Baobab Safaris Prime 10 2003 2012 10 Luawata Luwawata
Conservation
Prime 10 2003 2012
11 Chifunda Luangwa
Crocodiles
Prime 10 2003 2012
12 Luembe Bimm Safaris Prime 10 2003 2012
13 Chikwa Wild Cat Safaris
Secondary 10 2003 2012
14 Lunga Lushwishi Prohunt Safaris Secondary 10 2003 2012 15 Sandwe Sable Safaris Secondary 10 2003 2012
16 Lumimba Nyaminga
Muchinga Adventures
Prime 5 2005 2012
17 Lundu Fulaza Wild Cat Safaris
Secondary 8 2005 2012
18 Nyalugwe Hunting
Horizon
Secondary 8 2005 2012
19 Bilibili Terminated
20 Lower Luano Agrofuel Secondary 10 2003 2012 21 LungaBusanga Royal Zambezi Secondary 10 2003 2012
22 Sichifulo Alfa Recreation Secondary 10 30/12/2003 2013 23 Tondwa Muchinga
Adventures
Secondary 15 2003 2017
24 W/Zambezi
Lower
Terminated
25 Chiawa Royal Zambezi Secondary 15 1999 2014 26 Mukungule Busanga Trails Secondary 5 2005 2014
27 East Musalangu Miyombo Safaris
Secondary 5 2005 (2010) 2015
28 Msoro Lupande Eastern Safaris Secondary 5 2008 2013 29 Rufunsa Nyampala
Safaris
Secondary 10 2005 2014
30 Chisomo Sable Safaris Under stocked 15 2003 2017 31 Chizera Terminated
32 Namwala Nsonga Game Mgt.
Under stocked 15 2003 2017
33 W/Zambezi Lower
Maningi Safaris Under stocked 15 2003 2017
34 Musele Matebo Nyumbu Under stocked 15 2005 2015 35 Musele Matebo Nyumbu Under stocked 15 2005 2015
36 ChibwikaNtambu Terminated 37 Bbilili Terminated
38 Kafinda Busanga Trails Under stocked 10 2005 2015 39 Upper Luano Agro fuel Under stocked 15 2003 2015
40 Upper/Lunga Lushwishi
Not allocated
41 Lower/Lunga Lushwishi
Not allocated
42 Lukwakwa Not allocated

G.J.B.A.H.S.,Vol.4(3):137-153 (July-September, 2015) ISSN: 2319 – 5584
140
2. Materials and Methods 2.1 Location and Description of Study Area
The study covered Game Management Areas which are subdivided into Hunting Concession Areas (HCA) popularly
called Hunting Blocks (HB) (Figure 1).
Figure 1 National Parks and Game Management Areas of Zambia which add up to 31.4 % of the country’s land area of
752 614 km2.
2.2 Field Methods
Data on size of hunting quotas and species hunted were collected from hunting quotas set annually by ZAWA.
When setting quotas, species name, number and sex of animals to be hunted for the year between resident and
nonresident hunting groups are indicated. The number of animals hunted or quota utilization levels by end of year, 31st
December is collected and deposited with the licencing office and department of research in Zambia Wildlife Authority.
This is done every hunting season, and forms a good data base from which this information was extracted.
Information on the species hunted under resident and nonresident hunting were collected from ZAWA’s Form No. 14 which captures details on species name, place (GPS coordinates) and date where it was hunted as well as trophy size.
This form also provides data on quota utilization, which then makes it easy to calculate fees collected for each animal
hunted.
Data on income collected from hunting including concession fees were obtained from the signed Concession
Agreements which provide details on the agreed amount of concession fees to be paid and the number of classical, minis,
midis and other hunting packages.
The classification of hunting blocks has always been included in the hunting quota booklets. It was therefore easy to
identify the status of Hunting Concession Areas based on the classification of the Game Management Area. In instances
where part of the same GMA was richer that other sections, each hunting block was treated based on its individual
classification. A comparison was also made with historical data of the 1980s when the classification of GMAs was
reviewed.
3. Results 3.1Comparison of Size of Hunting Quotas
A comparison of the mean size of hunting quotas for the period 2003 – 2011 showed that 44% of the animal quotas
were allocated to resident hunting and 56 % to nonresident hunting (Figure 2a). Conversely, there were glaring disparities
in terms of revenue collected from resident and nonresident hunting, where Non Resident/Safari hunting which was
allocated 55% animal quota contributed 95% of revenue and resident hunting which had 44% of the animal quota generated only 5% of revenue (Figure 2 a & b).

G.J.B.A.H.S.,Vol.4(3):137-153 (July-September, 2015) ISSN: 2319 – 5584
141
Mean Size of
hunting quota
for Non
Residents/
Safari (4072),
56%
Mean Size of
hunting quota
for
Residents,(3241)
, 44%
(a)
Residents
(Citizens and
Established
Residents)
5%
Non
Resident/Safari
(Foreign
Clients)
95%
(b)
Figure 3 Comparison of, a) mean annual hunting quota size between residents and non residents /safari, and b) glaring
disparity in percentage of revenue collected from Residents and Non Residents/Safari, for the period, 2003 – 2011.
3.2 Comparison of Species Hunted under Resident and Nonresident/Safari During the period 2003 – 2011 a total of 41 species were allocated on hunting quotas; African civet (Civettictis
civetta), baboon (Papio spp), black/Bangweulu lechwe (Kobus leche smithemani), blue duiker (Philantomba monticola),
blue wildebeest (Connochaetes taurinus), buffalo (Syncerus caffer), bush buck (Tragelaphus scriptus), bush pig
(Potamochoerus larvatus) common duiker (Sylvicapra grimmia), common genet (Genetta genetta), common waterbuck
(Kobus ellipsprymnus ellipsprymnus), cookson’s wildebeest (Connochaetes taurinus cooksoni), defassa waterbuck
(Kobus ellipsprymnus defassa), eland (Taurotragus oryx), elephant (Loxodonta africana), greater kudu (Tragelaphus
strepsiceros), hippopotamus (Hippopotamus ampibius), impala (Aepyceros melampus), Kafue/brown lechwe (Kobus
leche kafuensis), klipspringer (Oreotragus oreotragus), leopard (Panthera pardus), lichtensteini hartebeest (Alcelaphus
buselaphus lichtensteini), lion (Panthera leo), Nile crocodile (Crocodylus niloticus), oribi (Ourebia ourebi), puku (Kobus
vardoni), roan antelope (Hippotragus equinus), reedbuck (Redunca arundinum ), red/Zambezi lechwe (Kobus leche
leche), sable antelope (Hippotragus niger), Sharpe’s grysbok (Raphicerus sharpei), side stripped jackal (Canis adustus), steinbok (Raphicerus campestris), sitatunga(Tragelaphus spekei), spotted hyaena (Crocuta crocuta), tsessebe
(Damaliscus lunatus), warthog (Phacochoerus aethiopicus), vervet monkey (Cercopithecus africanus), yellow backed
duiker (Cephalopus silvicultor), and zebra (Equus boehmi ).
A mean number of 7,600 animals were hunted each year (Figure 4).
Problem Animal
Control, 95 (1%)Special Licence,
500 (7%)
Resident, 3,000
(39%)
Safari , 4,000,
53%
Figure 4 Mean number of animals killed each year under safari, resident, special licence and problem animal control for the period 2003 – 2011

G.J.B.A.H.S.,Vol.4(3):137-153 (July-September, 2015) ISSN: 2319 – 5584
142
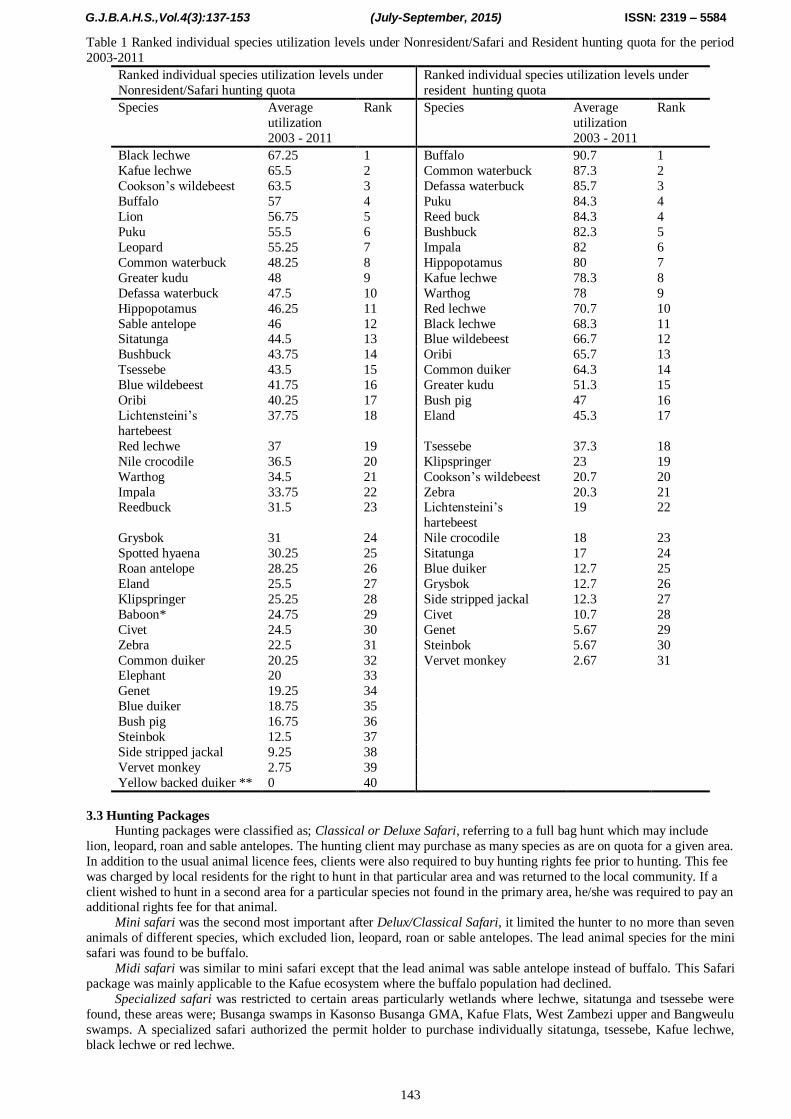
Of the 41 species allocated on quota seven (7) species were the most hunted under Nonresident/Safari with quota
utilization being above 50%. These species were; black lechwe (67%), kafue lechwe (66%), cooksons wildebeest (64%),
lion (57%), buffalo (57%), leopard (55%), and puku (55%). Under resident hunting, despite the low revenue generated
(Figure 3b) more species were utilized with quota utilization exceeding 50%, these were; buffalo (91%), common water
buck (87 %), defassa water buck (86 %), puku (84 %), reedbuck (84 %), and so forth (Table 1; Figure 5).
An analysis of quota utilization of the Kafue lechwe for instance, which is an endemic species that has
experienced a reduction in population size of 89 % since 1931, showed that during the period 2006 - 2012, residents
hunted 3, 409 (93 %) with an annual mean of 487 animals while non residents/Safari only hunted 256 (7 %) and an
annual mean of 36 animals (Figure 6).
67 6664
57 57 56 55
48 48 4846 46 45 44 44
34 3537
4240
20
32
68
78
21
91
8487
51
86
80
17
82
37
82
78
71
67 6664
84
0
10
20
30
40
50
60
70
80
90
100
Bla
ck l
ech
we
Kaf
ue
lech
we
Co
ock
son
s w
ild
ebee
st
Bu
ffal
o
Lio
n *
Pu
ku
Leo
par
d *
Co
mm
on
wat
erb
uck
Gre
ater
ku
du
Def
asa
wat
erb
uck
Hip
po
po
tam
us
Sab
le a
nte
lop
e
Sit
atu
ng
a
Bu
shb
uck
Tse
sseb
e
Imp
ala
War
tho
g
Red
/Zam
bez
i le
chw
e
Blu
e w
ild
ebee
st
Ori
bi
Co
mm
on
du
iker
Ree
db
uck
Species Name
Per
cen
t (%
) u
tili
sed
Percentage ( %) quota utilisation Nonresidents/Safari Percentage (%) quota utilisation - Residents
Figure 5 Comparison of top 20 most utilized species under Resident and Non Resident/Safari Hunting quotas
(Notes * Not available under resident hunting quota)
580
31
484
61
605
52
879
29
217
28
644
490 6
0
100
200
300
400
500
600
700
800
900
Nu
mb
er o
f le
ch
we h
un
ted
2006 2007 2008 2009 2010 2011 2012
Year
Resident Quota Non Resident Quota/Safari
Figure 6 Number of Kafue lechwe hunted under resident and nonresident/Safari Quotas for the period 2006-2012.
G.J.B.A.H.S.,Vol.4(3):137-153 (July-September, 2015) ISSN: 2319 – 5584
143
Table 1 Ranked individual species utilization levels under Nonresident/Safari and Resident hunting quota for the period
2003-2011
Ranked individual species utilization levels under
Nonresident/Safari hunting quota
Ranked individual species utilization levels under
resident hunting quota
Species Average
utilization
2003 - 2011
Rank Species Average
utilization
2003 - 2011
Rank
Black lechwe 67.25 1 Buffalo 90.7 1
Kafue lechwe 65.5 2 Common waterbuck 87.3 2
Cookson’s wildebeest 63.5 3 Defassa waterbuck 85.7 3
Buffalo 57 4 Puku 84.3 4
Lion 56.75 5 Reed buck 84.3 4
Puku 55.5 6 Bushbuck 82.3 5
Leopard 55.25 7 Impala 82 6
Common waterbuck 48.25 8 Hippopotamus 80 7
Greater kudu 48 9 Kafue lechwe 78.3 8
Defassa waterbuck 47.5 10 Warthog 78 9
Hippopotamus 46.25 11 Red lechwe 70.7 10
Sable antelope 46 12 Black lechwe 68.3 11 Sitatunga 44.5 13 Blue wildebeest 66.7 12
Bushbuck 43.75 14 Oribi 65.7 13
Tsessebe 43.5 15 Common duiker 64.3 14
Blue wildebeest 41.75 16 Greater kudu 51.3 15
Oribi 40.25 17 Bush pig 47 16
Lichtensteini’s
hartebeest
37.75 18 Eland 45.3 17
Red lechwe 37 19 Tsessebe 37.3 18
Nile crocodile 36.5 20 Klipspringer 23 19
Warthog 34.5 21 Cookson’s wildebeest 20.7 20
Impala 33.75 22 Zebra 20.3 21 Reedbuck 31.5 23 Lichtensteini’s
hartebeest
19 22
Grysbok 31 24 Nile crocodile 18 23
Spotted hyaena 30.25 25 Sitatunga 17 24
Roan antelope 28.25 26 Blue duiker 12.7 25
Eland 25.5 27 Grysbok 12.7 26
Klipspringer 25.25 28 Side stripped jackal 12.3 27
Baboon* 24.75 29 Civet 10.7 28
Civet 24.5 30 Genet 5.67 29
Zebra 22.5 31 Steinbok 5.67 30
Common duiker 20.25 32 Vervet monkey 2.67 31 Elephant 20 33
Genet 19.25 34
Blue duiker 18.75 35
Bush pig 16.75 36
Steinbok 12.5 37
Side stripped jackal 9.25 38
Vervet monkey 2.75 39
Yellow backed duiker ** 0 40
3.3 Hunting Packages
Hunting packages were classified as; Classical or Deluxe Safari, referring to a full bag hunt which may include
lion, leopard, roan and sable antelopes. The hunting client may purchase as many species as are on quota for a given area.
In addition to the usual animal licence fees, clients were also required to buy hunting rights fee prior to hunting. This fee
was charged by local residents for the right to hunt in that particular area and was returned to the local community. If a
client wished to hunt in a second area for a particular species not found in the primary area, he/she was required to pay an additional rights fee for that animal.
Mini safari was the second most important after Delux/Classical Safari, it limited the hunter to no more than seven
animals of different species, which excluded lion, leopard, roan or sable antelopes. The lead animal species for the mini
safari was found to be buffalo.
Midi safari was similar to mini safari except that the lead animal was sable antelope instead of buffalo. This Safari
package was mainly applicable to the Kafue ecosystem where the buffalo population had declined.
Specialized safari was restricted to certain areas particularly wetlands where lechwe, sitatunga and tsessebe were
found, these areas were; Busanga swamps in Kasonso Busanga GMA, Kafue Flats, West Zambezi upper and Bangweulu
swamps. A specialized safari authorized the permit holder to purchase individually sitatunga, tsessebe, Kafue lechwe,
black lechwe or red lechwe.

G.J.B.A.H.S.,Vol.4(3):137-153 (July-September, 2015) ISSN: 2319 – 5584
144
3.4 Income Collected from Trophy Hunting
Hunting was the Wildlife Management Agency’s main source of income and financial backbone contributing up to
76% of income. An analysis of main income generated during the period 2003 – 2011 showed that nonresident animal
fees and concession fees were the most important sources of revenue for the Management Agency and local
communities. Income from hunting seemed to have registered a significant increase during this period (y = 4E+09x + 1E
+10; R2 = 0.99) while non consumptive tourism and miscellaneous sources registered only marginal gains. The
proportional contributions to total revenue were ranked as; hunting 76%, non consumptive tourism 20% and
miscellaneous 4% (Figure 7).
Non consumptive
ZMK
5,014,941,099
(20%)
Miscellaneous,
ZMK 897,055,648
(4%)
Hunting , ZMK
19,394,019,606
(76%)
Figure 7 Mean income generated from hunting, non consumptive tourism and miscellaneous sources for the period, 2003
– 2011. (Mean exchange rate for the period 1USD to ZMK 4,500 before rebasing)
Revenue from hunting was further partitioned into seven different sources of which animal fees for non residents
contributed 60%, concession fees 23%, animals fees for resident hunters 8%, others including CITES permits 3%,
professional hunters licence fees 2%, elephant licence 2% (Figure 8).
11,379,013,440
4,4
97
,86
5,5
13
46
3,5
58
,50
0
46
0,3
57
,40
0
29
5,9
01
,42
6
1,5
74
,96
2,8
99
84
,58
1,9
19
56
1,3
16
,33
2
0
2,000,000,000
4,000,000,000
6,000,000,000
8,000,000,000
10,000,000,000
12,000,000,000
Am
ou
nt co
llec
ted
in
Kw
ach
a (1
US
D -
ZM
K 4
,50
0)
Source of revenue within the hunting revenue stream
Series1 11,379,013, 4,497,865,5 463,558,500 460,357,400 295,901,426 1,574,962,8 84,581,919 561,316,332
Animal fees
Nonresident
Concession
fees
Outfitters
licence fees
Elepehant
fees
Professional
hunters
licenece
Animal fees
resident
Crocodile
capture and
egg
Others
Figure 8 Mean annual income generated from different sources of hunting revenue stream, 2003-2011. [Elephant
hunting started in 2005]
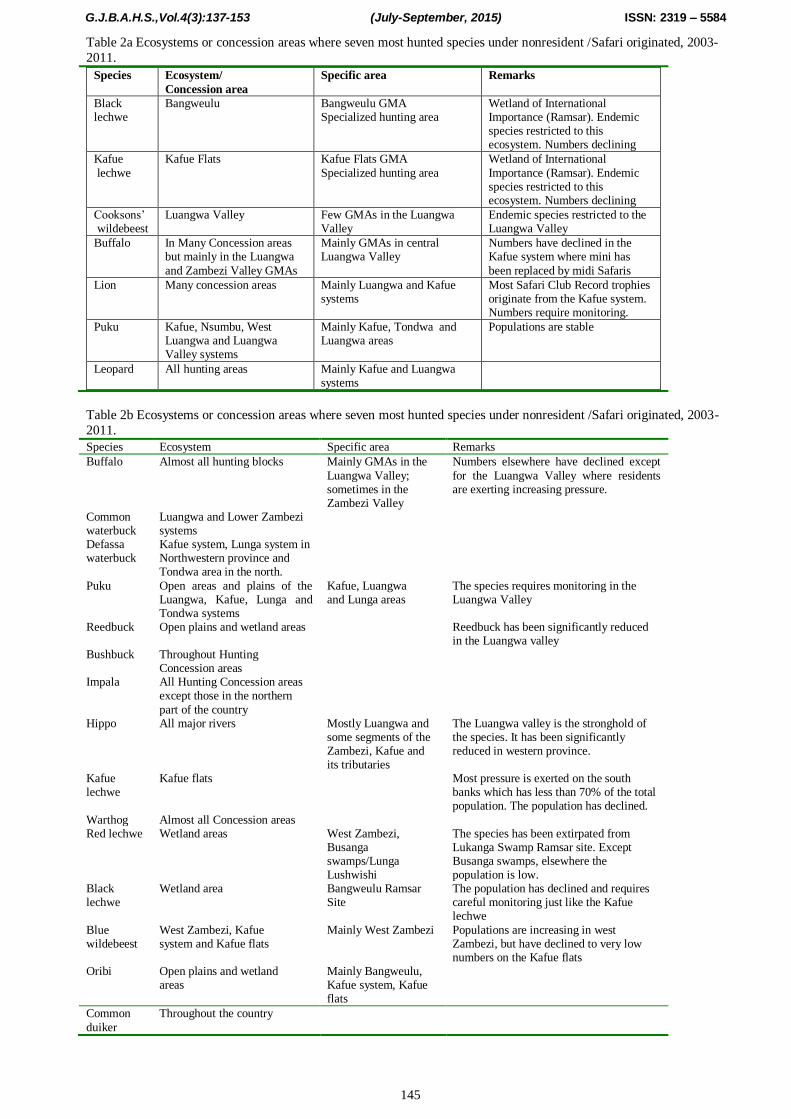
3.5 Ecological Status of Hunting Concession Areas
3.5.1 Concession Areas with the Most Hunted Species under Nonresident/Safari
Ecosystems and specific hunting concession areas where the seven most hunted species under nonresident /Safari
were fewer for nonresident hunters. These were mainly concentrated around the Luangwa and Kafue systems (Table 2a
& b). As for resident hunting, species coverage was almost country-wide (Table 2b).
G.J.B.A.H.S.,Vol.4(3):137-153 (July-September, 2015) ISSN: 2319 – 5584
145
Table 2a Ecosystems or concession areas where seven most hunted species under nonresident /Safari originated, 2003-
2011.
Species Ecosystem/
Concession area
Specific area Remarks
Black lechwe
Bangweulu Bangweulu GMA Specialized hunting area
Wetland of International Importance (Ramsar). Endemic species restricted to this ecosystem. Numbers declining
Kafue
lechwe
Kafue Flats Kafue Flats GMA
Specialized hunting area
Wetland of International
Importance (Ramsar). Endemic species restricted to this ecosystem. Numbers declining
Cooksons’ wildebeest
Luangwa Valley Few GMAs in the Luangwa Valley
Endemic species restricted to the Luangwa Valley
Buffalo In Many Concession areas but mainly in the Luangwa
and Zambezi Valley GMAs
Mainly GMAs in central Luangwa Valley
Numbers have declined in the Kafue system where mini has
been replaced by midi Safaris
Lion Many concession areas Mainly Luangwa and Kafue systems
Most Safari Club Record trophies originate from the Kafue system. Numbers require monitoring.
Puku Kafue, Nsumbu, West Luangwa and Luangwa Valley systems
Mainly Kafue, Tondwa and Luangwa areas
Populations are stable
Leopard All hunting areas Mainly Kafue and Luangwa systems
Table 2b Ecosystems or concession areas where seven most hunted species under nonresident /Safari originated, 2003-
2011.
Species Ecosystem Specific area Remarks
Buffalo Almost all hunting blocks Mainly GMAs in the
Luangwa Valley; sometimes in the Zambezi Valley
Numbers elsewhere have declined except
for the Luangwa Valley where residents are exerting increasing pressure.
Common waterbuck
Luangwa and Lower Zambezi systems
Defassa waterbuck
Kafue system, Lunga system in Northwestern province and Tondwa area in the north.
Puku Open areas and plains of the Luangwa, Kafue, Lunga and Tondwa systems
Kafue, Luangwa and Lunga areas
The species requires monitoring in the Luangwa Valley
Reedbuck Open plains and wetland areas Reedbuck has been significantly reduced in the Luangwa valley
Bushbuck Throughout Hunting Concession areas
Impala All Hunting Concession areas except those in the northern
part of the country
Hippo All major rivers Mostly Luangwa and some segments of the Zambezi, Kafue and its tributaries
The Luangwa valley is the stronghold of the species. It has been significantly reduced in western province.
Kafue lechwe
Kafue flats Most pressure is exerted on the south banks which has less than 70% of the total population. The population has declined.
Warthog Almost all Concession areas Red lechwe Wetland areas West Zambezi,
Busanga swamps/Lunga Lushwishi
The species has been extirpated from Lukanga Swamp Ramsar site. Except Busanga swamps, elsewhere the population is low.
Black lechwe
Wetland area Bangweulu Ramsar Site
The population has declined and requires careful monitoring just like the Kafue lechwe
Blue wildebeest
West Zambezi, Kafue system and Kafue flats
Mainly West Zambezi Populations are increasing in west Zambezi, but have declined to very low numbers on the Kafue flats
Oribi Open plains and wetland areas
Mainly Bangweulu, Kafue system, Kafue flats
Common
duiker
Throughout the country

G.J.B.A.H.S.,Vol.4(3):137-153 (July-September, 2015) ISSN: 2319 – 5584
146
3.5.2 General Ecological Status of Hunting Areas for both Resident and Non residents
Hunting areas were classified under five (5) categories arranged in descending order depending on the species
richness and relative abundance of species which also determined capacity to meet the needs of Safari clients and
residents. Prime was the richest with capacity to provide for a minimum of five (5) deluxe/ classical, secondary three (3)
deluxe/classical. There were 13 prime hunting areas, 16 secondary, four (4) specialized, 26 under stocked and three (3)
depleted the latter of which included open areas where resident hunting also took place (Figure 9a)
In terms, of revenue generated in USD from these categories, results showed that, prime category which had a
small number (13) generated the most, and the under stocked which had the highest number generated the least amount.
The amount generated from hunting declined with decline in status of hunting area (y = -330000x+ 2E +06; R2 = 0.7961)
(Figure 9b).
13
16
4
26
3
0
5
10
15
20
25
30
Num
ber
Prime hunting
area
Secondary
hunting area
Specialised
hunting area
Understocked
hunting area
Depleted
hunting area
Category/Status of hunting area
(a)
1,400,000
1,000,000
200,000
100,000
200,000
y = -330000x + 2E+06
R2 = 0.7961
-200,000
0
200,000
400,000
600,000
800,000
1,000,000
1,200,000
1,400,000
1,600,000
Pri
me
hu
nti
ng
area
s
Sec
on
dar
y
hu
nti
ng
are
as
Sp
ecia
lise
d
hu
nti
ng
are
as
Un
der
sto
cked
hu
nti
ng
are
as
Op
en G
ame
Ran
ches
Category of hunting area
Am
ou
nt
coll
ecte
d U
SD
(b)
Figure 9 a) Status of hunting areas located in Game Management Areas and open areas up to 2011, and b) amount of
revenue in USD generated from each category
Multiple cross tabulation (sensu Aggarwal, 2013) showed that the number of hunting blocks did not matter or
determine the amount generated but the status of the HCA category. The under stocked category which comprised the
majority (26) generated the least and depleted generated no revenue at all (Figure 10).

G.J.B.A.H.S.,Vol.4(3):137-153 (July-September, 2015) ISSN: 2319 – 5584
147
1,400,000
100,000
0
200,000
200,0
00
1,000,000
43
26
4
16
13
0
200,000
400,000
600,000
800,000
1,000,000
1,200,000
1,400,000
1,600,000
Hunting area category
Am
ou
nt
in U
SD
0
5
10
15
20
25
30
Nu
mb
er p
er
cate
go
ry
Series2 1,400,000 1,000,000 200,000 100,000 0 200,000
Series1 13 16 4 26 3 4
Prime categorySecondary
category
Specilized
category
Understocked
category
Depleted
category
Open Game
Ranch category
Figure 10 Mean annual revenue collected in USD for the period 2003 – 2011 from each hunting category
4. Discussion 4.1 Quotas and Harvesting Levels
Results show that close to 8,000 animals are hunted each year. This number could be higher because; i) resident
hunters do not usually endorse their licences after hunting, and there was no mechanism to ensure that each resident
hunter endorsed the licence, ii) resident hunters were not required by law to complete a ZAWA 14 form on which details
of the hunt are entered, neither do they endorse as hunted when an animal is injured and later dies days after the
shooting, iii) nonresident hunters were accompanied by ZAWA staff or village scouts to ensure compliance but resident hunters were in most cases not accompanied, iv)resident hunters were non selective and shot male or female which
explains why their utilization levels of their quotas were higher than safari, v) most resident hunters were eminent figures
in society or had political influence and often overlooked some regulatory frameworks, vi) resident hunters usually shot
above quota since the animals are hunted for meat and not for export of trophies where CITES regulations would be a
constraint (Pers. exp.).
Given these weaknesses, resident hunting harvested higher quotas than safari and could be the major reason why
their utilization levels far exceeded safari (see Figure 5) yet their contribution to ZAWA and local community’s revenue
was paltry. Special licence on the other hand, took a mean number of 500 animals each year. It was also likely that the
number of animals killed on special licence would increase in future as the number of traditional ceremonies and tribal
tensions remain somehow significant. In incidences where there are tribal tensions, special licence may continue to be
used as a tool for pacifying and soldering harmony to suture tribal cleavages especially through support to traditional ceremonies. During the period 2003 – 2011 each registered traditional ceremony including those chiefdoms located in
areas where animals were wiped out more than two decades ago, through poaching got no less than five animals per
ceremony. The role of special licence for scientific research and exchange of zoo specimens as well as facilitating
establishment of game ranches was derided and over shadowed by the growing demand for game meat for traditional
ceremonies. This could be the main reason for the increased number of animals under special licence. The costs of
carrying out this activity of hunting for traditional ceremonies are also often passed on to the managing agency ZAWA,
which adds on its long list of liabilities. The number of animals killed under Problem Animal Control (PAC) was highly
variable. This was because it was determined by the scale of human – wildlife conflicts for which there were many
factors. Subsisting empirical evidence showed that drought years often experienced high levels of conflicts and it was
during such years that communities required meat to mitigate food shortages.
Viewed from this angle, it was assumed that if poaching cases were included as part of animal off take, on an
annual basis, the number of animals killed annually would be between 20,000 and 30,000 individuals. No wonder many species have experienced severe population losses and are on decline. Classic examples are the Kafue and Bangweulu
lechwe (Chansa and Kampamba 2009; Anon. 2013), and the significant reduction of the buffalo population in the Kafue
ecosystem which led to the replacement on Mini safari by Midi safari.
The loss of almost 30,000 animals mainly through poaching is clear testimony of the failure of the Community
Based Natural Resources Management (CBNRM) model. This model has been over publicized, but its impact in Zambia
has over the years proved to be ineffective and may require complete review or perhaps complete turnaround. The topic
of CBNRM is a multimillion dollar industry and many scholars have invested heavily in its publicity, yet even in
countries where it is believed to be very successful, detailed information revealed heavy involvement of donor support
G.J.B.A.H.S.,Vol.4(3):137-153 (July-September, 2015) ISSN: 2319 – 5584
148
and a massive army of sophisticated and powerful sympathizers who are at best the beneficiaries of such donor input and
not the poor community members per se. At community level, it was the traditional leaders, the chiefs that picked the last
fragments of donor money while ordinary community members feasted on promises of better conditions in future. The
years following the introduction of ADMADE for example, government efforts on boots on the ground slackened with
the understanding that communities would fill up the gap. This has dismally failed. Game management areas are now
heavily settled, poaching has increased and animal numbers have gone down, while at the same time communities
continue to pressurize ZAWA to have a larger share and with the support of selected Non Governmental Organizations
(NGOs) some communities have lobbied to have ZAWA’s presence removed from GMAs. This observation is
apparently in tandem with the earlier publication by Spinage (1996). Indeed the abrogation of game laws and dismantling
of wildlife institutions cannot lead to lessening of the increasing destruction of African Wildlife. Although a number of articles particularly from Southern Africa were written to criticize to what is probably an accurate prediction by Spinage
(1996), it is now clear that Spinage (1996) has been vindicated at least going by the current status.
This massive loss of animals through; i) poaching, ii) un controlled resident hunting, and iii) hunting for traditional
ceremonies should not be allowed to continue in their current form and practice as they are unsustainable.
With respect to species specific quota utilization such as elephant, hunting only started in 2005 after the 10th
Conference of the Parties of the Convention on International Trade in Endangered Species of Fauna and Flora (CITES)
held in Bangkok, Thailand in 2004. The COP permitted Zambia to have a fixed quota of 20 elephants in the selected
areas of the Zambezi and Luangwa Valleys. The mean utilization of this quota did not exceed 60% due to the non
availability of the United States market which is the main source of hunting clients to Zambia. At this same conference
Zambia was also permitted to hunt crocodiles from the wild, and it is for that reason that the species was included on the
annual quotas.
4.2 Nonresident/Safari Hunting Off take Levels
Nonresident hunting operates through locally registered Hunting Outfitters also called Safari Companies. They
purchase hunting licences from ZAWA’s licencing office based on quotas provided to each outfitter with a valid Hunting
Concession Agreement. They are ideally expected to harvest 100 % of the allocated quota and give 100% financial
returns to ZAWA on all quotas. However, the 100% quota utilization is not often achieved in light of challenges such as
availability of clients among competing hunting destinations, availability of quality trophy animals and in some cases the
poor rating of hunting blocks particularly as a result of human encroachment and competition with resident hunting and
many others. This accounts for low income earned by ZAWA and Local Communities.
4.3 Hunting Packages
The HCAs have inherent weaknesses of providing a fixed quota. This compels ZAWA to provide the same quota annually for the entire length of the Concession Agreement. In the event that a certain species’ population declines or
when there is international pressure to remove a certain species from commercial exploitation as has been for lion since
2004, ZAWA would and has in selected incidences faced litigation in the courts of law. The packaging of
deluxe/classical, mini, mini and specialized safaris disadvantages ZAWA in that none of the four (4) packages compels
the client to purchase a specified number of species provided by ZAWA. Consequently only the most popular species
such as buffalo and lechwe are bought. Less popular species such as hippo, crocodile, baboon are hardly exhausted and
their utilization levels were below 45%. This exerts hunting pressure on very few species which may in the medium to
long-term negatively affect their population size.
4.4 Quotas and Quota Setting Techniques
Animal off take quotas are supposed to be carefully calculated in order to prevent ecological disasters in animal population dynamics. The main principle applied is Maximum Sustained Yield (MSY) and quality off take of animals.
These two factors are important to avoid dangers of genetic drift.
4.4.1 Sustained Yield Harvesting
In principle, Maximum Sustained Yield (MSY) for populations of wild animals ensures that the maximum number
of animals that may be removed every year from a population when it is at its highest intrinsic rate of increase, at half the
carrying capacity does not cause that population to decline (Figure 10). At this point the population would increase at its
maximum possible rate allowing maximum sustained annual harvest. This is the key and underlying principle under
MSY.
For as long as the growth form of a population is logistic such as the Luangwa hippo, then it is possible to estimate
the Sustained Yield (SY) that a population of a particular size can with stand. The SY is given by the same formula as for
logistic curve (sensu Sincalir and Grimsdell, 1982) as follows: SY = rmax N K - N
K
Where:
rmax = the maximum rate of increase of a population, under stated conditions, at a very low density.
N = population size at which the SY is to be taken
K = the maximum population size that a particular area can hold, thus the population size at the ecological carrying
capacity of the area.
From the above it can be seen that maximum sustained yield (MSY) is ½ r max . ½ K, represents the maximum
trade-off between rate of population increase and population size (Figure 10).
A good estimate of r max and K are needed in order to calculate an SY on MSY. The calculation of K is often
difficult, because it involves various environmental parameters. However for some species such as K for the hippo of the

G.J.B.A.H.S.,Vol.4(3):137-153 (July-September, 2015) ISSN: 2319 – 5584
149
Luangwa valley are already known. But for many other species’ K still remains unknown. An alternate method is to
estimate r max from a hypothetical population with maximum birth reproduction and minimum mortality.
A few estimates of rmax have been calculated for African large mammals based on Sincalir and Grimsdell, (1982)
such as:
African buffalo - rmax = 0.23 Lechwe - rmax = 0.27
Hippo ..- rmax = 0.22 (Chomba 2012)
The r max values are in fact infinitesimal values, when converted to finite values they become somewhat higher.
Thus the lechwe value of rmax = 0.27 equivalent to a finite rate of increase of about 1.3, (or 30%) per year.
Recently it has been shown that rmax is a simple function of body weight and can be calculated approximately as follows:
rmax = 1.5 W-0.36
Where W = weight in kg.; and rmax is calculated on a yearly basis (Chomba et al. 2011; Sinclair and Grimsdell, 1982).
In polygamous species the rate of increase will be higher if the population is biased towards females. Given poor
funding to ZAWA and the irregular surveys, most of the data used in quota setting is based on indices and very often
based on percentage quota utilization by the operator. Under such circumstances, it is difficult to determine with absolute
certainty whether quotas are sustainable or not for some species.
Figure 10: Sustained Yield based on logistic curve. MSY – Maximum Sustained Yield; K- Population size at Carrying
Capacity (sensu Sinclair and Grimsdell, 1982).
4.4.2 Packaging of Quotas
The current system of packaging quotas into; deluxe/classical, mini and midi safari is rigid and compels ZAWA to
provide certain species whether the population is low and declining such as the Kafue lechwe (Chansa and Kampamba
2009). For instance, a prime area is expected to yield a minimum of five (5) classicals implying that there has to be five
lions and only in very special circumstances do operators agree to get leopard in place of lion. It is therefore, based on
this assumption, very likely that the quotas are based on the number of classical, minis and midis expected to be harvested by operators rather than basing it on the biological status of the species being harvested.
Assessing the suitability of a species for harvest requires good baseline population data. Where none previously
existed a practical and sensible way may be to ascertain the biology of the species. For instance, large bodied species or
rare ones or food specialists are more at risk than small bodied generalists. Assessment of the geographic distribution and
range are equally critical as endemic and localized species such as Bangweulu and Kafue lechwe are more at risk than
non endemic and wide spread such as impala and common duiker. Given the increasing level of human encroachment in
most GMAs, a regular review of available habitat would help understand the proportion of the habitat that is effectively
protected. Most important though, is the national population trends of species. Intuitively, species that are generally
abundant occurring at high densities are likely to be less sensitive to harvests than less common occurring at low
G.J.B.A.H.S.,Vol.4(3):137-153 (July-September, 2015) ISSN: 2319 – 5584
150
densities. Having current data on national population status and distribution provides some indication about the species’
likely susceptibility to harvest. Species with an increasing population are likely to be less sensitive to harvest than species
whose population is decreasing such as the Kafue lechwe. Ideally trends in the national animal population status in
Zambia have been measured over long periods of time but usually independent of harvesting regimes. Such
measurements have also covered only selected species and certain areas mainly due to resource constraints. Where data
from actual population surveys are available, results from at least three or five preferably consecutive censuses would be
considered ideal to be used for plotting trends. When monitoring of population status improves, the age and sex structure
of the population should also be assessed. Failing this, trends or indices of relative abundances, hunting effort, hunting
success and trends in trophy size can be used, but with great care.
4.5 Income Collected from Trophy Hunting
Income from hunting has the largest contribution to ZAWA and Local Community’s income. This study has
revealed that nonresident animal fees and concession fees are the most important sources of income from hunting.
Current data showed that income from National Park collections slightly declined during the period 2003-2011and only
income from hunting and miscellaneous sources registered a marginal increase (y = 4E+09x + 1E +10; R 2 = 0.99). This
is symbolic of a poorly developed state of infrastructure in National Parks as income from the latter was expected to rise
and surpass income from hunting. This lag in photographic tourism may also be attributed to the lengthy process it takes
for a lodge to be built, marketed and start attracting visitors, while hunting has no lag phase. The lag phase is further
exacerbated by poor road infrastructure and low animal numbers in most National Parks which is a disincentive to non
consumptive tourism. The inadequate and poor quality of roads in National Parks has also reduced the tourism season to
no more than six months in many areas. This implies that lodges remain closed during the rainy season or operate at very low occupancy rates. This low income from non consumptive tourism is a risk to ZAWA, particularly in the event where
there is a hunting moratorium as was the case in 2012 or when certain key/premium species are removed from the quota
due to CITES constraints or as national decision as was the case in 2012 when cats (lion and leopard) were removed from
the hunting quota.
4.5.1 Increasing Income from Resident Hunting
Resident hunting currently generates only up to 6 % of income compared with safari. The animal fees are very low
as this is considered to be a non commercial operation but a service to the people of Zambia. Attempts to increase animal
fees for residents have often faced fierce resistance from the public and it is often assumed that increasing animal fees for
residents would increase poaching even if the two are not related. This kind of resistance is not seen with other public
institutions such the power utility company the Zambia Electricity Corporation (ZESCO) which increases its electricity
tariffs without public consultation and yet no one insinuates that there would be vandalism of their properties. In 2010 an attempt was made to conduct an auction of resident hunting quotas, and the contribution of resident hunting to hunting
revenue increased from 5% in the previous year to 13 %. This showed that if this model was popularized and conducted
in designated centers around the country such as provincial towns, the proportional contribution of resident hunting to
total hunting revenue would increase. This practice was stopped after interested parties complained that auctioning only
favoured the rich, especially Zambians of European and Indian decent. Other attempts made were to remove certain
premium species from resident hunting quota and restricting them to safari, but this also faced resistance and the animals
were reinstated. Under such circumstances, resident hunting will continue to be a service and not a source of income for
ZAWA and Local Communities.
4.6 Ecological Status of Hunting Concession Areas
The hunting concession areas in GMAs are the animal production units where hunting takes place. Effective ecological management of GMAs is critical to sustaining consumptive tourism. Empirical evidence suggests that before
the CBNRM programme took root in the 1980s, only an average of 7.4% of GMA land area were occupied by human
settlements. Human density was low and averaged 0.3 – 9.3 local residents /km2 (Lewis, 1993; Anon, 1996). This left a
lot of land for wildlife and hunting. At this time hunting flourished because; i) safari hunting areas were sparsely
populated with humans and animal numbers were high, and ii) hunting levels were supposedly far below animal
populations’ growth rates.
Lack of investments in the wildlife sector and the ineffective CBNRM model has reversed the trend. For instance,
Bilili GMA has been completely taken over by human settlements, and the eastern part of Mumbwa GMA is heavily
settled and there are some spill over’s in the Mumbwa west as well. The traditional authorities, contrary to popular view
supported by countless publications by the pro CBNRM cartel have not managed the resources well and have in some
instances even supported human encroachment in some areas of GMAs such as Mumbwa east. This has been accentuated
by politics as the illegal settlers are not seen as a threat to the development of sustainable tourism but as potential voters. The management agency, ZAWA is in many instances left powerless and cannot control increasing levels of
encroachment in GMAs. This multifaceted scenario has led to reduced number of prime hunting areas while the number
of under stocked and depleted GMAs has increased (see Figure 9a & b). The downgrading of hunting concession areas to
lower ecological status has inevitably reduced the potential income to ZAWA and local communities and is a major
financial risk. As human encroachment increased, so did poaching, some of which was and still is done by the GMA
bonafides who are supposed to the custodians of the resource. Here we assume that there may have been a major fault in
the way the CBNRM model was designed. It assumed for instance, that once communities participate and receive a share
of revenue, then poaching would be reduced to low levels much lower than the population’s rate of increase. This is
perhaps was one of the major weaknesses of this model as individuals have particular needs and sharing of hunting
revenue at house hold level which has been tried in some countries is at best a fallacy which cannot work. It is at the
moment difficult to determine at what level individuals would get satisfied with the income received per household level as to give up poaching. One of the potential threats of encouraging sharing of revenue at house hold level is that once

G.J.B.A.H.S.,Vol.4(3):137-153 (July-September, 2015) ISSN: 2319 – 5584
151
such revenues are treated as an entitlement the same way civil servants treat a monthly wage, the next thing is to demand
an annual increase or at least an increase once in a while even if the resource cannot meet such demands. An example of
this is with the traditional authorities who are placed on an honorarium wage in recognition of their role as custodians of
culture and traditions, but still lobby for more incentives and often demand for higher allowances than civil servants.
Recently there have been demands from traditional leaders for government to build modern palaces, provide personal to
holder vehicles and to increase the monthly allowances even when civil servants are not demanding for any increase. In a
few weeks before sending this paper for publication, there was another demand from traditional leaders to form an upper
house of parliament something not provided for under the subsisting constitution.
In our earlier publication of 2011 (Chansa and Mwenya, 2011), we gave a back ground that before the British
Government colonized Zambia, wildlife belonged and was under the control and management of the indigenous people through traditional authorities called Chiefs. Under this traditional way of life, characterized by the leadership of Chiefs,
wildlife was used for the benefit of the community and formed an integral part of their lives. At the turn of the last
century when Zambia fell under British rule, wildlife ceased to be under the custodianship of the indigenous people. It
was placed under centralized state protection and management. For this purpose the Game Ordinance, Chapter 106, was
enacted on 1st January 1943, making wildlife the property of the state and governing its use. The subsequent
amendments, repeals and replacements of the wildlife legislation were made essentially to keep such wildlife legislation
up to date in line with government requirements. The process of updating the wildlife legislation was done to ensure that
it provided for the protection, management and use of National Parks. However, it has now become apparent that pre
colonial era system of managing wildlife through traditional authorities can no longer work. Since Chiefs are non
elective, and therefore, not accountable to any one, it would be very risky to place absolute powers and decision making
on matters dealing with wildlife in institutions that are not accountable to the public. Politicians have consistently failed to recognize this fact and for as long as we maintain a two tiered governance system over the wildlife resources, thus
traditional authorities and government through ZAWA, the CBNRM may have no chance to succeed. Experience has
shown that where there is resource use conflicts between ZAWA and Traditional Leaders (chiefs), politicians usually
play the role of a biased referee favouring traditional leaders to the detriment of ZAWA and wildlife resources. For
example, the level of encroachment in GMAs can in no way be attributed to shortage of land as the most recent human
population estimates (2010), showed that Zambia had 17people/km2. This 17 people per square kilometer is based on a
uniform distribution of people across the country which is not realistic as most people are aggregated around urban areas
and along the old line of rail which leaves most rural areas empty. In most rural areas population density is less than
10/km2, so the justification often advanced by traditional leaders and politicians of shortage of land is not true.
5. Conclusion and Recommendations 5.1 Conclusion
Sport or trophy hunters and others that support consumptive utilization of wildlife resources claim that the idea of
preserving wildlife in a pristine state for all time may no longer be realistic due to increasing human populations,
increased demand for land and reduced expenditure from Central Government to support wildlife conservation. Many
protected areas, National Parks in particular, are becoming ecological islands in a sea of human settlements. The value of
ecological services such as pollination and water catchment for instance, are difficult to translate into dollar value to
convince local communities as well as politicians not to engage in unsustainable use of their natural environments. In
Zambia like many other African countries, the concept of sustainable utilization will remain controversial and emotional and there may be no consensus on the best form of utilization. The conservation community as deciphered from the two
National Workshops held at Sandy’s Creation in 2012 and Mulungushi International Conference Centre, Lusaka in 2013
was split over attempts to define what is in principle, the best method of sustainable use of wildlife in Zambia. It is
therefore, not the intention of this paper to provide an answer to this emotional area of conservation but rather to bring
out key principles on how the two may coexist with minimum conflicts.
Proponents of Consumptive Utilization (Modified After Baker, 1997) argue that trophy hunting is a professionally
controlled form of utilization which is more environmentally friendly and more social culturally acceptable than
photographic tourism due to the following reasons:
1) Hunters are not as ecologically destructive as photographic/non consumptive tourists. They usually come in
fewer numbers than the ordinary tourists and do not demand luxurious amenities such as hotels or Lodges.
2) Hunters require fewer services and accommodation facilities, less infrastructure, thus keeping wildlife habitats more pristine.
3) Hunters usually pay more money per unit time per visit than the ordinary tourist yet they use fewer services.
4) The cost of a hunting safari in Africa is more than triple the cost of an ordinary safari of the same length.
5) For an area to be attractive under photographic tourism it must have abundant populations of animals and/or
have the big five while hunting can be carried out in areas with low animal densities and hunters are often
patient and willing to wait even up to 21 days until they get a desirable trophy. Photographic tourists are often
impatient wanting to see as many animals as possible in the shortest possible time.
6) Some areas hosting the most wildlife in numbers and variety are often inaccessible to regular visitors/tourists or
practically inaccessible because of poor transportation services and infrastructure. Such areas, however, are
likely to attract sport hunters, which increases local benefits.
7) Over population of certain species can damage if not destroy the natural habitat which would threaten their own existence and that of other species. Elephants for instance, can be very destructive leaving thousands of hectares
of land barren of trees there by negatively affecting other species dependent on such trees such as some raptors
(Chomba and M’Simuko 2013). In the Luangwa Valley of Zambia for instance, high hippopotamus numbers
often cause over grazing which negatively affects other grazing species by reducing the amount of food
available to them (Chomba, 2012; Chansa et al. 2011 ).
8) Death is part of the animal kingdom. Animals die whether they are hunted or not.

G.J.B.A.H.S.,Vol.4(3):137-153 (July-September, 2015) ISSN: 2319 – 5584
152
9) Money collected from hunting supports community livelihoods and conservation of wildlife.
10) Hunters take only a very small percentage of the old male segment of the population and by definition the take
is small and select.
11) Non consumptive/photographic tourism can harm wildlife as masses of tourists swarm around fewer and fewer
animals causing stress and sometimes disrupting their mating patterns.
12) In photographic tourism, off road driving, and vehicles congregating on key attractions such as lion prides
causes damage/soil erosion to the range and sometimes changes behavior of the animals being viewed.
13) Excessive graffiti, noise and disposal of litter away from designated places destroys the aesthetic beauty of the
natural environment and negatively affects the very principle of maintaining a pristine environment.
14) Over speeding 4x 4s across the African savannahs in pursuit of lion pride or rhino causes damage to the roads, raises dust and often create a net work of loop roads often appearing like a spider web on the natural landscape.
15) The presence of hunters in many remote parts of Game Management Areas deter poaching incursions. This is
supported by the experience of the 2001 and 2002 when hunting was suspended and most GMAs experienced
high levels of poaching and human encroachment and some of them were later downgraded to secondary or
under stocked/ depleted category in 2003.
Based on the above, supporters of consumptive tourism argue that no matter how desirable from the conservation
stand point, preserving ecosystems in their pristine state to save endangered species would appear from the face value of
it, it is impracticable in view of high levels of poverty as communities will use these resources out of necessity to survive.
The emphasis should be sustainable use.
Trophy hunting in Zambia therefore, can continue but there has to be significant review regarding:
1) Resident hunting: A comprehensive monitoring programme should be put in place, or consider a non time bound moratorium to have the sector totally reorganized.
2) Special Licence: It would be advisable to eliminate the component of traditional ceremonies and restrict this
provision to scientific studies, museum specimens, special state donations and breeding /restocking
programmes;
3) Problem Animal Control: It should be done based on a comprehensive Problem Animal Control Protocol.
The other important matter arising from this study is the status of GMAs. Based on the 2003 HCA classification,
there are a total of 43 HCAs, from which only 13 are prime. It is therefore doubtful that hunting would continue over a
much longer period of time unless practical interventions are undertaken to restore the ecological integrity of GMAs.
5.2 Recommendations
5.2.1 Quota Allocation and Harvesting Levels
Current quota allocation to resident hunting is high 44%, when it only accounts for up to 6% revenue. The rising demand for resident hunters to hunt key trophy animal species is likely to stifle the safari hunting industry which is the
main source of income and may ultimately destroy the principle of quality off take. It is here recommended that ZAWA
should develop a comprehensive monitoring programme for resident hunting. This should include; reducing the size of
the resident quotas, removing key/ premium species or consider a non time bound moratorium for resident hunting.
5.2.2 Hunting Packages Zambia currently operates a Hunting Outfitters’ preferential choice when it comes to selling animals on quota.
Subsequently operators have free will to purchase animal species based on preferences of the market in line with the
economic principle of supply and demand, which only works in favour of the Safari Hunting Outfitters. This approach
though good from a purely economic stand point, creates an ecological imbalance in terms of biodiversity conservation.
Exerting undue pressure on the most sought after and high premium species in large numbers may affect inter and intra species interactions with net consequences on species population viability. It is here recommend that ZAWA should
package its animal quotas in hunting bags. ZAWA would package lowly utilized species such as baboon and others into
bags together with the most sought after and high premium species to improve the quota utilization levels and earn more
income.
5.2.3 Animal Pricing
Pricing of wildlife products in Zambia is fixed and based on a Statutory Instrument (SI) for Licences and Fees.
Inherently, this mechanism is not flexible to market forces. Subsequently ZAWA can only earn income from the most
sought after species by maintaining hunting quotas for such species at a certain minimum threshold especially for
classical and mini/midi safaris. This practice is in most cases tied to the HCA and gives little or no room for ZAWA to
adjust hunting quotas when additional biological information is made available. This inevitably places immense hunting
pressure on selected species and may reduce the population’s viability in the long-term. It is here recommended that the pricing system should also be made flexible to give ZAWA the leverage to earn more income from a limited quota of the
high premium species.
5.2.4 Hunting Concession Areas and Agreements
After animal fees, concession fees are the second most important source of income from hunting. It is therefore
critical to address the HCA and introduce new clauses that would provide additional income to ZAWA without
necessarily creating financial deficits to the Safari Hunting Outfitter, but aim to achieve a win-win situation.
5.2.5 Staggering Hunting Concession Agreements
To stagger the allocation of hunting concession areas would ensure that they do not expire at the same time, thus
allowing an almost constant inflow of income to ZAWA and Local Communities. In instances where Government

G.J.B.A.H.S.,Vol.4(3):137-153 (July-September, 2015) ISSN: 2319 – 5584
153
decides to suspend the allocation of HCA as was the case in 2012, only a small proportion of hunting areas would be
affected, while hunting continues in other areas.
5.2.6 Separating Hunting Areas for Residents and Non Residents
It may be advisable to consider as an option allocating highly prized hunting concession areas as exclusive hunting
blocks for non resident hunting only. The concession fees for such hunting areas would be increased as they would offer
exclusive hunting opportunities to Safari Clients without disturbance by resident hunters. Resident hunter would be
allocated one or two exclusive secondary hunting blocks.
5.2.7 Concession Fees Revise and where possible standardize concession fees and do away with classical, mini and midi which currently
determine how much a Safari Hunting Outfitter will pay as Concession fees. Additionally, introduce bags instead of
selling classical, mini and midi. Conditions for bag system would include; i) trophies legally obtained under citizen
hunting should not be exported, ii) trophies legally obtained under international hunts can be exported, iii) No
resale/transfer of the bag by any individual who had won at the auction should be permitted and many others.
5.2.7 Alternative Methods of Allocating Hunting Concession Areas
Consider offering some hunting concession areas on auction to the highest bidder, rather than through tender.
Alternatively, also consider the allocation of concession through a combination of approaches; by draw system, tender
system, and auctioning. In doing so, ensure that no single Safari Hunting Outfitter holds more than one prime or
secondary hunting area.
5.2.8 Participation of Civil Servants and other Zambians
Encourage civil servants and public service workers and other citizens to participate through a draw system which
works on similar lines as the lottery system. This should be a strictly restricted tender system where only citizens qualify
to participate. This will eliminate the current discriminatory practice which only favours Zambians of Indian or European
origin.
Acknowledgements The hunting issue is a highly controversial and politically sensitive. Few people were willing to provide details on
this topic. I thank staff of the ZAWA licencing office particularly Mrs. Moola and Mr. Mulembi. Mr. Lackson Mwenya
provided details on the Concession Fees. We also thank members of the Department of Research for their contributions.
References Aggarwal, Y.P. (2013). Statistical methods, concepts, application and computation. Sterling Publishers, New Delhi.
Anonymous (2002). Report on the visit to Zimbabwe to study the administration of safari hunting. Ministry of Tourism, Environment and Natural Resources, Kwacha House, Lusaka.
Anonymous (2002). Off take quotas, supplementary information. Zambia Wildlife Authority, Chilanga.
Anonymous (2009). Hunting quotas for the year 2010. Zambia Wildlife Authority, Chilanga.
Anonymous (2010). Information on lion hunting in Zambia. Zambia Wildlife Authority, Chilanga.
Anonymous (2012).Proposed hunting concessions beyond 2012. Zambia Wildlife Authority, Chilanga.
Anonymous (2013). Government’s position regarding the ban on hunting lion and leopard. Zambia Wildlife Authority, Chilanga.
Baker, J .E. (1997). Development of a model system for touristic hunting revenue collection and allocation. Tourism Management, Vol. 18, N. 5, pp 273 – 286.
Chansa, W. and Kampamba, G. (2009). The population status of the Kafue lechwe in the Kafue flats, Zambia. African Journal of Ecology, 48, pp 837 – 840.
Chansa, W. Senzota, R., Chabwela, H., and Nyirenda, V. (2011). The influence of grass biomass production on hippopotamus
population density distribution along the Luangwa River, Zambia. Journal of Ecology and the Natural Environment Vol. (5): pp, 186-194.
Chomba, C., Senzota, R., Chabwela, H., and Nyirenda, V. (2011). The Population status of hippo along the 165km stretch of the Luangwa River, Zambia. Journal of Ecology and the Natural Environment. Vol. 4 (9): pp 247 - 257.
Chomba, C. (2012). Factors regulating the Luangwa (Zambia) hippopotamus population within carrying capacity band. International Journal of Biodiversity and Conservation Vol. 5(3): pp 109-121.
Chomba, C., Mwenya, A. N. and Nyirenda, V. (2012). Wildlife legislative and institutional reforms in Zambia for the period 1912-2011. Journal of Sustainable Development in Africa.Vol. 13, (6).
Chomba, C. and M’Simuko, E. (2013). Distribution pattern of large trees as potential nest placement sites for woodland nesting raptors: A prerequisite to avoid disturbance of raptor breeding sites, Lochinvar National Park, Kafue Flats, Zambia. Oriental Journal of Social Science 2, (1).
Lewis, D.M. (1993) Safari hunting and conservation; A guide to Zambia. National Parks and Wildlife Service, Chilanga.
Anonymous (1996). Safari hunting guide to Zambia for a premier hunting experience in Africa. National Parks and Wildlife Service, Chilanga.
Sinclair, A.R.E. and Grimsdell, J.J.R. (1982). Population dynamics of large mammals. African Wildlife Foundation, Nairobi.
Spinage, C. (1996). The rule of law and African Game- a review of some recent trends and concerns. Oryx, Vol. 30. No. 3.