Status of the South Carolina Fisheries for Cobia of the South Carolina Fisheries for Cobia August...
25
Status of the South Carolina Fisheries for Cobia Technical Report Number 89 prepared by Donald L. Hammond South Carolina Department of Natural Resources Marine Resources Division Office of Fisheries Management P.O. Box 12559, Charleston, South Carolina 29422-2559
Transcript of Status of the South Carolina Fisheries for Cobia of the South Carolina Fisheries for Cobia August...
Status of the South CarolinaFisheries for Cobia
Technical Report Number 89
prepared by
Donald L. Hammond
South Carolina Department of Natural ResourcesMarine Resources DivisionOffice of Fisheries ManagementP.O. Box 12559, Charleston, South Carolina 29422-2559

Table of Content Page
Preface ………………………………………………………………………………………. 1 Introduction ……..………………………………………………………..…………………….. 2 Methods ……………………………………………………………………………………………. 6 Results …………………………………………………….…………………………….……….… 7 State Finfish Survey …………………………………………………………………… 7 Charter Boat Logbook Program ……………………………………………….. 7 Commercial Fishery …………………………………………………………………… 10 Marine Recreational Fisheries Statistics Survey ……………………………. 12 Marine Game Fish Tagging Program ………………………………………. 14 Key West Cobia Tagging Project ………………………………………………… 16 Summary …………………………………………………………………………………..…… 17 South Carolina Fishery …………………………………………………………… 17 Management ……………………………………………………………………………... 18 Stock Status ……………………………………………………………………………… 19 Conclusions ……………………………………………………………………………………..… 19 Recommendations ………………………………………………………………………..……. 20 Acknowledgements ……………………………………………………………………………… 21 Literature Cited ……………………………………………………………………………… 21 Figures and Tables Figure 1. Cobia captured by recreational angler from Surfside Beach fishing pier ………………… 1 Figure 2. South Carolina coastal map indicating counties and three estuaries which experience annual spring runs of cobia ….…………………………………………………………………………………………. 2 Figure 3. A four month old cobia spawned in June, 2001 and raised at the Waddell Mariculture Center in Bluffton, SC ………………………………………………………………………………………………………. 5 Figure A1. Distribution of angler trips made by SC charter boats targeting cobia, 1993 – 2000 … 8 Figure A2. Capture location distribution for cobia landed by SC charter boats, 1993 – 2000 …… 9 Figure A3. Monthly distribution of cobia caught by charter boats in SC, 1993 – 2000 ……………… 9 Figure A4. Annual cobia catch rate observed for charter boats targeting cobia ………………….…… 10 Figure A5. Comparison of commercial cobia landings to the US commercial landings ……………… 11 Figure A6. Distribution of total annual cobia harvest in SC ………………………………………………….. 11 Figure B1. Area Contribution to US total recreational cobia catch, 1989 – 2000 …………………..…. 12 Figure B2. Distribution of Atlantic coast recreational cobia catch, 1989 – 2000 ………………..…….. 13 Figure C1. Number of cobia tagged and recaptured under the MGFTP ………………………………….. 14 Figure C2. Distribution of release sites for cobia tagged in the MGFTP, 1989 – 2001 …………..…. 14 Figure C3. Distribution of SC cobia tagging activity …………………………………………………….……… 15 Figure C4. Monthly distribution of tagging and recapture activities in the MGFTP, 1989 – 2001 .. 15 Figure C5. Distribution of recapture sites for cobia tagged in the Broad river and Port Royal areas 16 Table A1. Observed lengths and weights at age for cobia collected in North Carolina ……………… 6 Table A2. Current State Regulations for recreational harvest of cobia………………………………….….. 18

Status of the South Carolina Fisheries for
Cobia
August 14, 2001 by
Donald L. Hammond Finfish Management Section
Office of Fisheries Management Marine Resources Division
P. O. Box 12559 Charleston, SC 29422
Technical Report Number 89

1
Preface The cobia has been a recognized and desired gamefish among recreational fishermen in South Carolina since the 1960’s (Figure 1). Throughout the majority of the state’s coast very few recreational anglers actually target cobia. However, in the last decade, the recreational fishery for cobia has undergone an exponential growth in Beaufort county (Figure 2). It is usually taken as a fish of opportunity, where one is seen at the surface and then targeted. When targeted, anglers pursue cobia by fishing at buoys located at the mouths of bays, coastal shipwrecks and coastal artificial reefs. Only in Port Royal Sound and to a lesser extent Calibogue and St. Helena Sounds, all in Beaufort county, are adult cobia regularly found in inshore waters. This inshore spring run begins in April and can last into July. This inshore movement of cobia has come to support a major spring recreational fishery in Beaufort county.
Figure 1. Cobias are regularly caught from ocean piers along the SC coast
such as this 34 pound specimen taken from the pier at Surfside Beach, SC in May 1974.

2
Figure 2. South Carolina coastal map indicating counties and the three estuaries which experience spring runs of cobia annually.
3
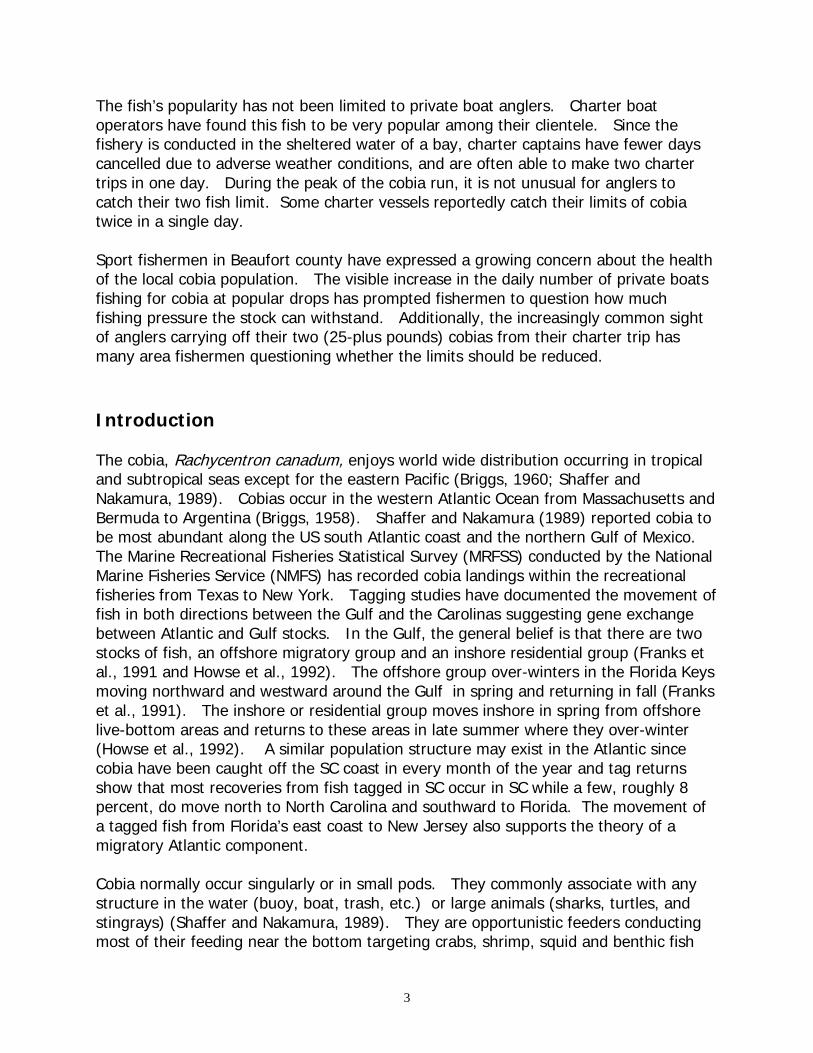
The fish’s popularity has not been limited to private boat anglers. Charter boat operators have found this fish to be very popular among their clientele. Since the fishery is conducted in the sheltered water of a bay, charter captains have fewer days cancelled due to adverse weather conditions, and are often able to make two charter trips in one day. During the peak of the cobia run, it is not unusual for anglers to catch their two fish limit. Some charter vessels reportedly catch their limits of cobia twice in a single day. Sport fishermen in Beaufort county have expressed a growing concern about the health of the local cobia population. The visible increase in the daily number of private boats fishing for cobia at popular drops has prompted fishermen to question how much fishing pressure the stock can withstand. Additionally, the increasingly common sight of anglers carrying off their two (25-plus pounds) cobias from their charter trip has many area fishermen questioning whether the limits should be reduced. Introduction The cobia, Rachycentron canadum, enjoys world wide distribution occurring in tropical and subtropical seas except for the eastern Pacific (Briggs, 1960; Shaffer and Nakamura, 1989). Cobias occur in the western Atlantic Ocean from Massachusetts and Bermuda to Argentina (Briggs, 1958). Shaffer and Nakamura (1989) reported cobia to be most abundant along the US south Atlantic coast and the northern Gulf of Mexico. The Marine Recreational Fisheries Statistical Survey (MRFSS) conducted by the National Marine Fisheries Service (NMFS) has recorded cobia landings within the recreational fisheries from Texas to New York. Tagging studies have documented the movement of fish in both directions between the Gulf and the Carolinas suggesting gene exchange between Atlantic and Gulf stocks. In the Gulf, the general belief is that there are two stocks of fish, an offshore migratory group and an inshore residential group (Franks et al., 1991 and Howse et al., 1992). The offshore group over-winters in the Florida Keys moving northward and westward around the Gulf in spring and returning in fall (Franks et al., 1991). The inshore or residential group moves inshore in spring from offshore live-bottom areas and returns to these areas in late summer where they over-winter (Howse et al., 1992). A similar population structure may exist in the Atlantic since cobia have been caught off the SC coast in every month of the year and tag returns show that most recoveries from fish tagged in SC occur in SC while a few, roughly 8 percent, do move north to North Carolina and southward to Florida. The movement of a tagged fish from Florida’s east coast to New Jersey also supports the theory of a migratory Atlantic component. Cobia normally occur singularly or in small pods. They commonly associate with any structure in the water (buoy, boat, trash, etc.) or large animals (sharks, turtles, and stingrays) (Shaffer and Nakamura, 1989). They are opportunistic feeders conducting most of their feeding near the bottom targeting crabs, shrimp, squid and benthic fish

4
(Smith, 1995). In SC cobias first show up in early April on coastal artificial reefs. They begin to enter shallower nearshore waters (Smith, 1995) such as Port Royal and St. Helena Sound in mid-April and peak in numbers in May and June. The number of fish in the sounds drops sharply by July and most fish have disappeared by September from the inshore waters. Cobias are batch spawners with spawning reported for the Gulf stock from April to September (Burns et al., 1998). Cobias may spawn as frequently as every 4 days during the peak period with mean batch fecundity estimates ranging from 377,000 to 1,980,500 eggs (Burns et al., 1998). Burns et al., (1998) reported Gulf males mature as early as one year of age (25.2 inches) with all mature by age 2, while females begin to mature at roughly age 3 (32.8 inches) with most mature before age 4. Smith (1995) found males collected in North Carolina to mature at age 2 (23.6 to 25.6 inches fork length) as did females which averaged 31.5 inches. Cobias were found to be fully mature by age 4. Spawning has been shown to occur in the mouth of bays and sounds (Joseph et al., 1964, Richards, 1967, Smith, 1995). Additionally, larval cobia 24 to 36 hours old have been collected 52 miles SE of Charleston by a South Carolina Department of Natural Resources (SCDNR) research cruise and in the Gulf Stream off North Carolina (Hassler and Rainville, 1975) indicating that some cobia are open ocean spawners. Burns et al., (1998) reported that gonadal evaluations from cobia collected from Beaufort county, SC (primarily Port Royal Sound) indicated that the fish probably undertook an offshore movement prior to spawning and then returned to inshore waters afterwards. Smith (1995) reported that mature cobia enter the larger high salinity inlets of NC (Beaufort, Ocracoke and Hatteras) each spring starting in May peaking in early June and sharply declining after early July. During this time period plankton samples taken inside of the North Carolina inlets have produced cobia larvae and eggs indicating that spawning probably occurs just outside of the inlets with some possibly occurring in the sounds (Joe Smith, NMFS, personal communication, 2001). This spawning scenario could likely describe what is happening with the fish in Port Royal Sound. This concept is supported by the unaided spawning of a pair of cobias within twelve hours of capture from Port Royal Sound in May, 2001 at the Waddell Mariculture Facility (Dr. Ted Smith, SCDNR, personal communication, 2001). Juvenile cobias are known to utilize estuaries in South Carolina during their early life. In 1973, 77 juvenile cobias were collected by the author between 24 July and 31 August. The collections were made in the boat slip of the Marine Resources Center located on the James Island (southern) shore of Charleston Harbor. The fish ranged in size from 42 mm TL to 129 mm TL and averaged 82 mm TL (27 fish measured at capture). The surface salinity where the juveniles were captured ranged from 12.0 ppt to 19.1 ppt and averaged 15.6 ppt. Surface water temperature averaged 29.4 0C while ranging from 27.5 0C to 32.2 0C. The juvenile cobia appearance in the boat slip was closely linked to the tidal stage with over 83 percent (64 individuals) of the fish collected between the 2/3 ebb stage and the 1/3 flood stage. Juveniles ranging in size

5
from 260 mm TL to over 400 mm TL have been captured in SC estuaries as late as September and October (Figure 3).
Figure 3. A four month old cobia spawned in June, 2001 and raised at the Waddell Mariculture Center in Bluffton, SC.
Differences have been found in the age and growth of cobia occurring in the Gulf of Mexico and those in the Atlantic (Burns et al., 1998, Franks et al., 1999 and Smith, 1995). Smith (1995) reported that 19 percent of the males and 21.6 percent of the females aged from NC were in excess of 6 years old with the oldest male estimated at 14 years and the oldest female estimated at 13 years of age (Table A1). Burns et al., (1998) reported few cobias from the Gulf of Mexico exceeded 6 years of age. However, it appeared that Gulf cobias grow at a faster rate than their Atlantic counterparts. A 57.4 pound (51.6 inches) female cobia taken in the Gulf was estimated at 6+ years as compared to a 60 pound (52 inches) female cobia from the Atlantic that was estimated at 13+ years (Burns et al., 1998). Females were found to grow at a faster rate than males in the Gulf as-well-as the Atlantic (Burns et al., 1998).

6
Table A1. Observed lengths and weights at age for cobia collected in North Carolina (Smith, 1995).
Mean Observed Fork Length cm Mean Observed Weight kg Age Male Female Male Female
1 50 55 1.3 1.0 2 74 81 3.9 6.1 3 82 89 6.7 8.4 4 88 102 8.3 12.5 5 92 106 9.4 14.9 6 95 111 10.6 17.8 7 100 117 11.5 21.0 8 99 123 13.6 23.9 9 107 125 18.3 24.6 10 105 127 12.2 29.7 11 105 121 18.1 12 127 28.6 13 113 138 19.3 32.0 14 106 20.0
Methods Specific data on the SC cobia fisheries are very limited and fishery independent data on cobia in South Carolina are virtually non-existent. The catch and effort databases of five long-term fisheries dependent programs were utilized to quantify the South Carolina fisheries for this report. Two nation-wide fisheries monitoring programs conducted by the National Marine Fisheries Service (NMFS) were utilized. The first, the Commercial Fisheries Statistical Program (CFSP) has monitored domestic commercial fisheries landings since 1950. This program documents total poundage landed in each state by species along with the type of gear used to harvest it. All harvest or landings reported under this program include only those fish brought to a commercial seafood processor for sale. The recreational counterpart to this program is the Marine Recreational Fisheries Statistical Survey (MRFSS). First initiated in 1979, the MRFSS was instituted to obtain standardized and comparable estimates of participation, effort, and catch by recreational anglers in the marine waters of the United States. Participation, fishing effort and catch data are categorized by mode and location. Total catch reported under this program includes fish that were; 1. kept, 2. thrown back dead, and 3. thrown back alive. The South Carolina State Finfish Survey (SFS) was initiated in 1988 by the Marine Resources Division (MRD) through the Fisheries Statistics Section of the Office of Fisheries Management. This survey was established to collect additional annual fishery dependent data on high priority species taken in the state’s marine recreational

7
fisheries. In the first few years of this program, creel clerks attended pre-selected public access points along the coast at a predetermined daily time period to conduct standardized interviews with fishermen that were present. Since 1992 the program has restricted its sampling to public boat ramps. SC state law Section 50-5-1910 created a saltwater recreational fishing license in 1993. Among the provisions of this act was the establishment of a log book program whereby charter boats and headboats would be required to report the results of their daily fishing trips. Each vessel purchasing a charter/headboat license is issued a log book with tear-out trip logs. Captains are required to complete the standardized form for each trip made and submit them monthly to the MRD. These survey instruments record the number of anglers, hours fished, area fished (inland, ocean <3 miles over manmade or natural bottoms, and ocean >3 over manmade or natural bottoms), method employed (trolling or non-trolling) and number per species kept and thrown back for each trip. Since 1974, the SC Marine Game Fish Tagging Program has provided tags to recreational fishermen who are willing to mark their unwanted game fish. Fishermen are provided a kit of five or ten tags along with an applicator and a brochure instructing them on the proper way to apply fish tags. Each tag comes with a data card bearing the tag’s identification number and requesting information on date, location, size of fish, and angler’s name and address. See Davy (1994) for description of the operation and data processing for the program. From 1974 through 1992 over 6,000 anglers had tagged 42,000 fish representing 96 species in the program (Davy, 1994). Results State Finfish Survey Cobia is not a targeted species for the survey and there are virtually no SFS data for it. While cobias are occasionally taken from ocean piers and the Broad River Bridge in Beaufort county, the fishery is virtually wholly carried out from boats. Available data indicate the largest fishery for this species is in Beaufort county. The SFS sampling in this area is very limited. According to Bryan Stone, SFS project coordinator (personal communication, 2001) three additional field personnel would be needed for Beaufort county to obtain desired information. SC Charter Boat Logbook Survey (CBLB) Practically all of the directed fishing effort specifically for cobia by charter vessels occurred in Beaufort county in the Broad River and Port Royal Sound during the months of May and June. Roughly 85 percent of angler-trips targeting cobia were carried out in state waters (Figure A1). This effort was divided almost evenly between inland and

8
coastal (ocean 0 – 3 miles) waters. Using the fishing years of 1996 through 1998 to evaluate the relative importance of cobia fishing (trips that targeted cobia) to the statewide charter boat fishery in state waters, both inland and coastal, the fishery is comprised of an average of only 3.4 percent of the annual trips or 334 out of 9,866 trips for the three years.
Figure A1. Distribution of Angler Trips Made By SC Charter Boats Targeting Cobia, 1993 - 2000. CBLB data.
Shown as percent of total angler trips.
Inland43%
Coastal42%
EEZ15%
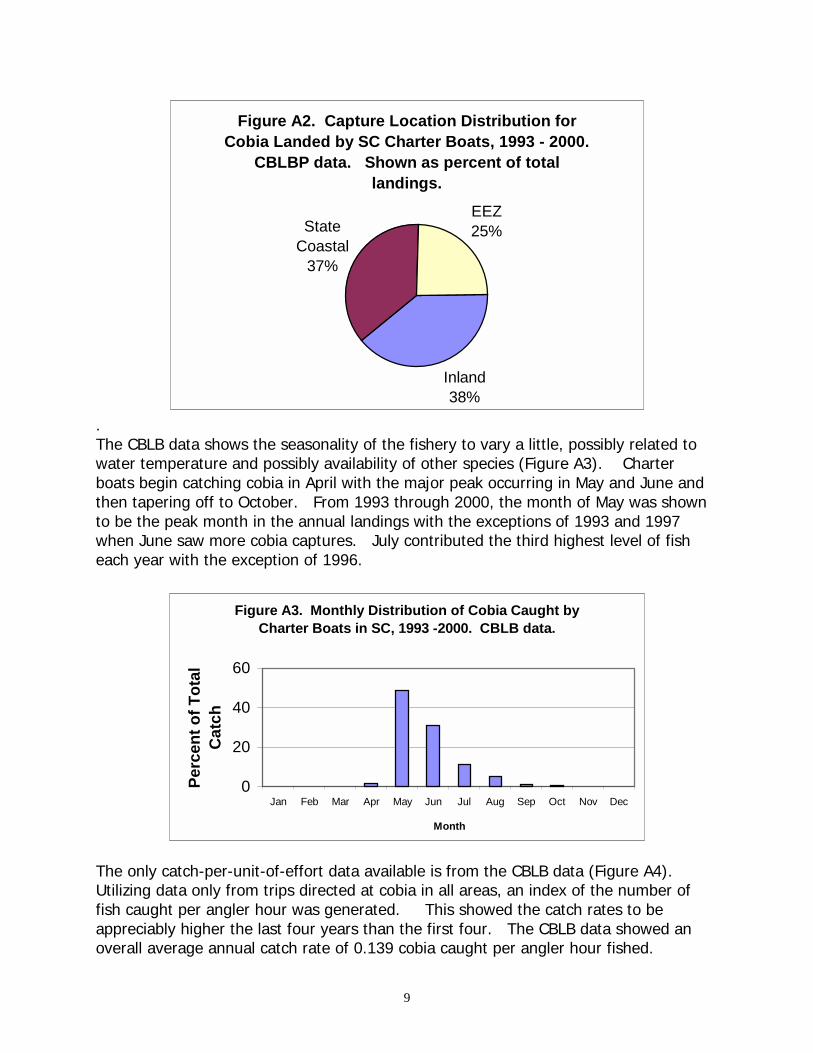
The charter boat catch of cobia, 1993 – 2000, showed a major pattern shift in the fishery between the periods of 93 – 96 and 97 – 00. The first change was a major decline in the retention of captured fish with the retention rate falling from 70 percent in 1993 - 96 to 40 percent in 1997 – 00. Since the minimum size of 33 inches fork length was instituted in 1983 and the two-fish per person per day creel limit in 1991, the increased rate of release was not due to implementation of new restrictions. There was also a major shift in where the fish were being caught. The EEZ’s (3 to 200 miles) contribution to the annual catch dropped from an average of 58 percent in 1993 – 96 to an average of only 16 percent during 1997 – 00. Overall, the EEZ produced only 24.5 percent of the catch during the 8 year period, Figure A2.
9
Figure A2. Capture Location Distribution for Cobia Landed by SC Charter Boats, 1993 - 2000.
CBLBP data. Shown as percent of total landings.
Inland38%
State Coastal
37%
EEZ25%
. The CBLB data shows the seasonality of the fishery to vary a little, possibly related to water temperature and possibly availability of other species (Figure A3). Charter boats begin catching cobia in April with the major peak occurring in May and June and then tapering off to October. From 1993 through 2000, the month of May was shown to be the peak month in the annual landings with the exceptions of 1993 and 1997 when June saw more cobia captures. July contributed the third highest level of fish each year with the exception of 1996.
Figure A3. Monthly Distribution of Cobia Caught by Charter Boats in SC, 1993 -2000. CBLB data.
0
20
40
60
Jan Feb Mar Apr May Jun Jul Aug Sep Oct Nov Dec
Month
Perc
ent o
f Tot
al
Cat
ch
The only catch-per-unit-of-effort data available is from the CBLB data (Figure A4). Utilizing data only from trips directed at cobia in all areas, an index of the number of fish caught per angler hour was generated. This showed the catch rates to be appreciably higher the last four years than the first four. The CBLB data showed an overall average annual catch rate of 0.139 cobia caught per angler hour fished.

10
Figure A4. Annual Cobia Catch Rate Observed for Charter Boats Targeting Cobia. CBLB data.
00.050.1
0.150.2
0.250.3
0.35
1993 1994 1995 1996 1997 1998 1999 2000
Year
Fish
per
Ang
ler-
Hou
r
Commercial Fishery There is no known commercial fishery directed at cobia in SC. Cobias are caught primarily as an incidental catch during other directed commercial fishing efforts, principally the snapper/grouper fishery. This holds true not only for the state’s industry but nationally as well. Subsequently, almost all commercial landings come from the EEZ. This is a small fishery with total annual harvests in SC never reaching 10,000 pounds during the period of 1989 – 1999. Under the NMFS’s CFSP mandated-reporting requirement, only total pounds, not the number of individual fish, are reported by the commercial fish houses. Data for 1989 through 1999 showed that the SC commercial harvest of cobia was insignificant to the total US commercial cobia harvest. SC’s annual contribution ranged from 0.9 to 2.3 percent of the average 355,000 pounds of cobia landed commercially each year in the US (Figure A5). Overall the SC commercial catch amounted to an average of only 1.3 percent, 4,850 pounds, of the annual US commercial catch.

11
Figure A5. Comparison of SC Commercial Cobia Landing to the US Commercial Landings. NMFS data.
0
50000
100000
150000
200000
250000
300000
350000
400000
450000
1989 1990 1991 1992 1993 1994 1995 1996 1997 1998 1999Year
Poun
dsUS LandingsSC Landings
A comparison of the MRFSS data for total pounds of cobia harvested by the SC recreational fishery to that harvested by the SC commercial fishery showed that the commercial fishery contributes very little to the annual harvest (Figure A6). Commercial fishing accounted for an average of only 6.7 percent of the total annual cobia harvest for SC during the 1989 – 00 period. Data for the recreational harvest in 1993 and 2000 were not used for calculations because they were either not available or extremely questionable.
Figure A6. Distribution of Total Annual Cobia Harvest in SC. NMFS data. Shown as percent of total harvest.
-10.0020.00
30.0040.0050.0060.0070.00
80.0090.00
100.00
1989 1990 1991 1992 1993 1994 1995 1996 1997 1998 1999 2000Year
Perc
ent o
f Tot
al
RecreationalCommercial

12
Marine Recreational Fisheries Statistical Survey According to the MRFSS over 2.4 million cobias were caught recreationally in the Gulf and Atlantic combined during the period of 1989 through 2000. The average annual catch was just over 201, 000 fish. It is the Gulf of Mexico that clearly dominates the fishery, accounting for over 72 percent the total US recreational catch during this period (Figure B1). Atlantic coast states contribute only 27.7 percent of the US catch. Florida’s west coast dominates the fishery from every perspective accounting for over 55 percent of the total US catch during this period. South Carolina, on the other-hand, produced less than 2 percent of the total catch.
Figure B1. Area Contribution to US Total Recreational Cobia Catch, 1989 - 2000. MRFSS
data. Shown as percent of total.
South Carolina2% All Other
Atlantic States26%
All Other Gulf States17%
Florida, West Coast55%
South Carolina is still a minor player within the US Atlantic recreational fishery (Figure B2). Recreational cobia captures were reported for 8 states during the 12-year period (1989 – 2000) but for many states (GA, MD, DE and NY) reports were sporadic to singular. This lack of capture data is probably a reflection of the inability of the MRFSS’s sampling strategy to capture data on small or rare-event fisheries. The East coast of Florida dominates the Atlantic fishery producing over 55 percent of the fish caught. SC falls into a distant fourth position behind Virginia and North Carolina, accounting for less than 7 percent of the total Atlantic recreational catch.

13
Figure B2. Distribution of Atlantic Coast Recreational Cobia Catch,1989 - 2000. MRFSS data.
Florida, East Coast55%
South Carolina 7%
Virginia23%
Delaware0% New York
0%
North Carolina14%
Georgia1%
Maryland0%
MRFFS data indicates the total US recreational catch of cobia is evenly divided between the fisheries in state territorial waters and the EEZ. However, in the Atlantic, the EEZ fishery for cobia plays a major role only in the Florida east coast fishery where it provides 56.6 percent of the state’s catch. The other three states with the highest cobia landings, Virginia, North Carolina and South Carolina, had less than 28 percent of their cobia captures occur in the EEZ. South Carolina was shown to have 75.3 percent of the state’s total recreational cobia catch taken in state territorial waters. Data indicate that north of Florida, the cobia fishery is largely carried out in state territorial waters. Over the 12-year period recreational fishermen were shown to retain 44.2 percent of the cobias they caught in the Gulf and Atlantic. South Carolina fishermen tended to retain more of the cobias they caught, keeping an average 55.2 percent of their fish (EEZ and state waters combined). A significantly higher live release rate was shown for SC state waters, 50.9 percent, than in EEZ waters, 12.5 percent, during the 1989 to 2000 period. Overall, 74.8 percent of the cobias retained by recreational fishermen in SC were caught in waters under state jurisdiction. Charter boats operating from SC were shown to contribute 16.5 percent of the overall recreational cobia catch and 24.2 percent of the cobia harvest. Within territorial waters of the state, charter boats factored into the fishery a little higher, accounting for 17.8 percent of the catch and 30.9 percent of the harvest. Over 90 percent of the cobia caught by charter boats and 95 percent of their harvest came from state waters.

14
Marine Game Fish Tagging Program Cobia Data, 1989 - Present The public has tagged a total of 675 cobias under the MGFTP since 1989 (Figure C1). Cobia tagged in other states (101 fish) accounted for 15 percent of the reports (Figure C2). A total of 574 cobias was tagged by anglers fishing in or from a SC departure point. Over 85 percent of the cobia tagged (488 fish) by anglers fishing from SC boat landings/marinas/ports were captured in state waters (Figure C3). About 78 percent of all SC cobia tagging took place in Beaufort county. While the overall tagging data showed that cobia were tagged in every month of the year (Figure C4), in SC they were tagged only from April through November with one additional fish tagged offshore in February. Virtually all of the cobia tagged between November and April were caught off Florida. Over 64 percent of all fish tagged were caught during May and June. July and August contributed the second highest level with 22.4 percent. The fall period of October through December had the lowest tagging activity with only 1.0 percent of the releases.
Figure C1. Number of Cobia Tagged and Recaptured Under the MGFTP.
0
100
200
300
1989
1990
1991
1992
1993
1994
1995
1996
1997
1998
1999
2000
2001
Year
Num
ber o
f Fis
h TaggedRecaptured
Figure C2. Distribution of Release Sites for Cobia Tagged in the MGFTP, 1989 - 01. Shown as percent of total.
Other States15%
South Carolina
85%

15
Figure C3. Distribution of SC Cobia Tagging Activity. MGFTP data, 1989 -
01. Shown as Percent of Total
Federal Waters
15%
Beaufort County
78%
Other State Waters
7%
Figure C4. Monthly Distribution of Tagging and Recaptures Activities in
the MGFTP, 1989 - 2001.
0.010.020.030.040.050.0
Jan Feb Mar Apr May Jun Jul Aug Sep Oct Nov Dec
Month
Perc
ent o
f Tot
al TaggedRecaptured
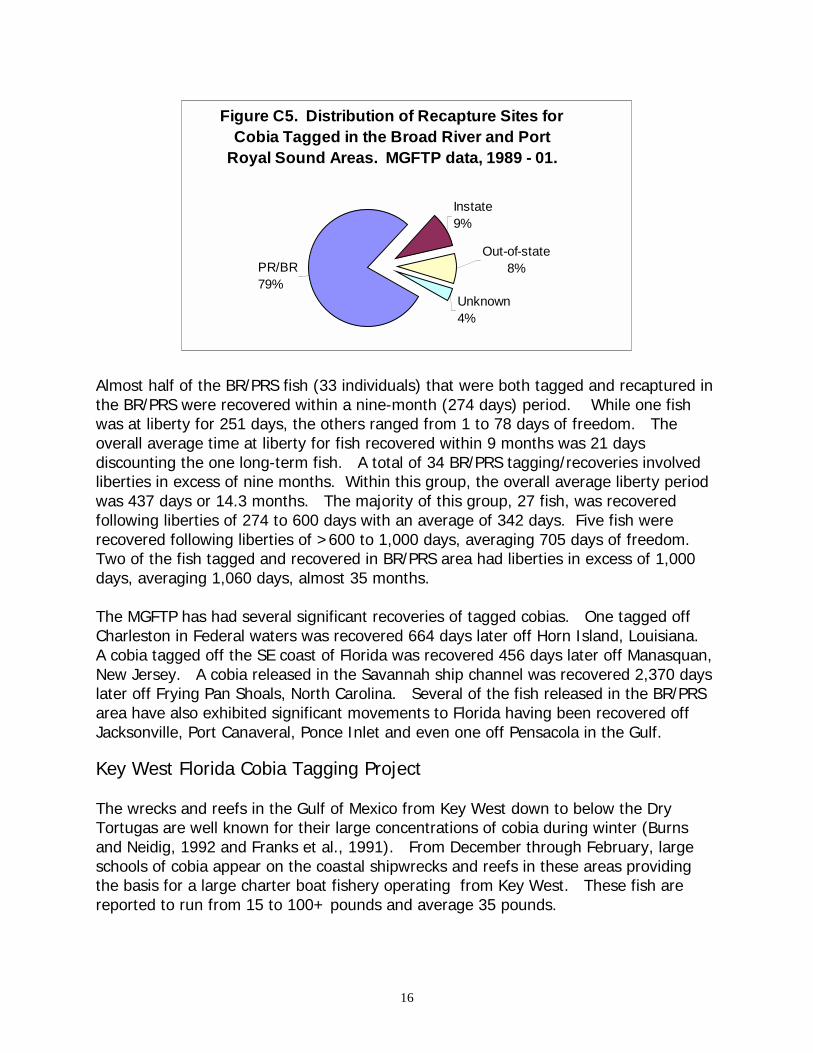
A total of 107 or 15.8 percent of the marked cobias was reported recaptured during this period. While the MGTP recorded cobia recaptures in all months except October and November (Figure C4), recaptures in SC were only reported April through September. Times-at-liberty ranged from one to 2,370 days. All recovered fish had been tagged after 1989. Besides five cobia initially tagged off Florida and 9 whose initial release sites were unknown, all cobia recoveries involved fish initially released in or just off Beaufort county. Of all tags recovered, 85 (79.4 percent) were from fish initially tagged in the Broad River and Port Royal Sound (BR/PRS). Over 78 percent of the recovered fish tagged in these two areas exhibited site fidelity (Figure C5) being recovered in the same two areas as much as 3 years later. Of the 85 cobia recoveries involving fish tagged in the BR/PRS, 8 were recaptured in other areas of the state while an additional 7 were recovered out-of-state. All of the out-of-state recoveries of BR/PRS fish occurred in Florida with all but 2 occurring during winter.
16
Figure C5. Distribution of Recapture Sites for Cobia Tagged in the Broad River and Port
Royal Sound Areas. MGFTP data, 1989 - 01.
PR/BR79%
Instate9%
Out-of-state8%
Unknown4%
Almost half of the BR/PRS fish (33 individuals) that were both tagged and recaptured in the BR/PRS were recovered within a nine-month (274 days) period. While one fish was at liberty for 251 days, the others ranged from 1 to 78 days of freedom. The overall average time at liberty for fish recovered within 9 months was 21 days discounting the one long-term fish. A total of 34 BR/PRS tagging/recoveries involved liberties in excess of nine months. Within this group, the overall average liberty period was 437 days or 14.3 months. The majority of this group, 27 fish, was recovered following liberties of 274 to 600 days with an average of 342 days. Five fish were recovered following liberties of >600 to 1,000 days, averaging 705 days of freedom. Two of the fish tagged and recovered in BR/PRS area had liberties in excess of 1,000 days, averaging 1,060 days, almost 35 months. The MGFTP has had several significant recoveries of tagged cobias. One tagged off Charleston in Federal waters was recovered 664 days later off Horn Island, Louisiana. A cobia tagged off the SE coast of Florida was recovered 456 days later off Manasquan, New Jersey. A cobia released in the Savannah ship channel was recovered 2,370 days later off Frying Pan Shoals, North Carolina. Several of the fish released in the BR/PRS area have also exhibited significant movements to Florida having been recovered off Jacksonville, Port Canaveral, Ponce Inlet and even one off Pensacola in the Gulf.
Key West Florida Cobia Tagging Project The wrecks and reefs in the Gulf of Mexico from Key West down to below the Dry Tortugas are well known for their large concentrations of cobia during winter (Burns and Neidig, 1992 and Franks et al., 1991). From December through February, large schools of cobia appear on the coastal shipwrecks and reefs in these areas providing the basis for a large charter boat fishery operating from Key West. These fish are reported to run from 15 to 100+ pounds and average 35 pounds.

17
Captain Bob Montgomery, a charter boat owner who operated out of Key West volunteered to tag the cobia he released. He tagged a total of 90 cobia from his vessel “Blue Runner” during a period of 38 days, December 26th ,1974 to February 2, 1975. All fish were tagged and released on three offshore shipwrecks located in the Gulf of Mexico. Stainless steel harpoon tags manufactured by Floy Tag Company were supplied through the SC Marine Game Fish Tagging Program.
Shipwreck Number Cobia
Tagged
Number Recaptures
Recaptures at Release Site
Bosiljka 1 1 1 Gunbor 76 8 5
Luckenback 13 2 2 Total 90 11 8
Eleven of the 90 tagged cobias were recaptured for a recovery rate of 12.2 percent. Only three fish exhibited movement traveling northward along the Florida coast and into the northern Gulf of Mexico. These fish were at liberty 98, 154 and 537 days traveling 90, 200 and 660 miles respectively. A total of 8 fish was recovered at the location of their release. Times at liberty ranged from 40 to 782 days with the average being 263 days. Two fish were recovered in less than nine months (274 days) with an average freedom of 53.5 days. Five of the fish had liberties between 274 and 600 days. One was at liberty for 782 days (25.7 months).
Summary South Carolina Fishery Data on SC’s fisheries for cobia are very limited. Landings data are received from the commercial sector but the commercial catch is very small, never reaching 10,000 pounds annually. While all available data point to the recreational fishery as the dominant user group, very poor data exist to quantify the existing fishery. As with other Atlantic coastal states, the available data allow only some very broad generalizations to be drawn. The major SC fishery for cobia is recreational in nature with the commercial sector contributing about 7 percent a year. It is rather insignificant in the context of the combined Gulf and Atlantic recreational fishery (less than 2 percent) and it ranks only a little higher within the US Atlantic recreational fishery (just under 7 percent). Subsequently, the SC fishery would appear to have little bearing on US fishery or on the cobia population as a whole.

18
As in other Atlantic states north of Florida, the SC recreational fishery is largely carried out in waters under state jurisdiction. Roughly 75 percent of the cobias landed come from these waters. While cobias may be landed in SC 12 months out of the year, the primary fishery takes place in May and June trailing off into September. Based on the CBLB survey, Beaufort county accounts for 80 to 85 percent of the cobia caught by SC anglers. The charter boat fishery for cobia has undergone a significant growth in the last three years though it still remains a minor component of the charter boat business (3.4 percent statewide) but an important contributor to the state’s total cobia landings (30 percent). Cobias are caught along the entire length of the SC coast. While a very small fishery exists on the state’s ocean piers, the fishery is primarily carried out from boats. Broad River and Port Royal Sound are the focal points of the fishery with small satellite fisheries occurring in the coastal waters off Beaufort county, Calibogue Sound and in the Combahee River Channel of St. Helena Sound. Because of the small, geographically concentrated and short-term nature of the fishery, neither the SFS nor the MRFSS has generated any substantial catch and effort data for the fishery. The small data base available from the CBLB survey could be viewed as indicating a healthy fishery with CPUE’s above average for the last few years. This increased catch during the late nineties corresponds to a similar increase noted in the Gulf of Mexico.
Management Cobia is managed jointly by the South Atlantic Fisheries Management Council (SAFMC) and the Gulf of Mexico Management Council (GMFMC) under the direction of the Mackerel Stock Assessment Panel. In spite of tag recoveries that show regular mixing between the fish off the Carolinas and the Northern Gulf and an mtDNA study (Hrincevich, 1993) that did not find any differences between the two groups, it was proposed that cobia be managed on a two stock hypothesis (Thompson, 1993). This hypothesis was endorsed by the Mackerel Stock Assessment Panel in 1993. A federal minimum fork length of 33 inches (83.8 cm) was placed on cobia in 1983 for both commercial and recreational fisheries. A federal two fish per person per day bag limit was placed on recreational fishermen in 1990. Atlantic coast states have adopted the federal guidelines or have implemented more stringent regulations in some cases (Table A2). Table A2. Current State Regulations for Recreational Harvest of Cobia. State Season Minimum Size (in. FL) Daily Personal Creel Limit Florida 33” 1 Georgia March 16 – Nov. 30 33” 2 South Carolina 33” 2 North Carolina 33” 2 Virginia 37” TL * 2 * Virginia modified minimum length to reflect the total length of a 33” FL fish since all VA regulations are in TL. VA will consider lowering creel limit to one fish per person in 2001.

19
Stock Status Currently no accurate stock assessment exists for either the Atlantic or the Gulf of Mexico stocks of cobias. The last stock assessment for Gulf and Atlantic cobia was conducted in 1996 using a VPA analysis. This analysis was considered to be very unreliable because of the weak data on which it was based. A recent assessment for the Gulf of Mexico cobia stock for which the largest amount of data is available was conducted by the GMFMC in 2001, (Williams, 2001). His main conclusion was that the population status of the Gulf of Mexico cobia is virtually unknown, given the degree of uncertainty in the estimates from this assessment model. Depending on which natural mortality (M) factor is chosen, from 0.2 – 0.4, the stock would appear to be in healthy to severely declining shape. The one accurate statement that can be made according to Williams (2001), is that the cobia population in the Gulf of Mexico has increased since the 1980’s. This leaves the Atlantic stock in a similar position where it’s condition is unknown. The councils recognize the importance of the species to the recreational fishery, especially in Florida. With the recent growth in the fishery, managers are concerned that the species could become overfished if growth in the fishery continues unchecked. However, they also recognize that no data exist showing that the stocks are suffering under adverse fishing pressure. Conclusions Few data are currently available for the SC cobia fisheries and these limited data should not be the basis of any major management decisions. However, the existing data do not indicate any problems with the stock. The recent growth in the cobia charter fishery in Beaufort county coupled with an increased CPUE shown by these vessels could be viewed as indicator of growth in the population similar to that observed in the Gulf of Mexico. Subsequently, no biological evidence exists to warrant altering the current regulations restricting the harvest of cobia in South Carolina. Three facts do stand out about cobia. First, boom or bust, the SC fishery will have little impact on the US stock(s) of cobia. Secondly, tagging studies have clearly shown that adult cobia exhibit strong site fidelity for summer and winter grounds. Thirdly, as far as the Atlantic recreational fishery north of Florida is concerned, the fishery is predominately carried out within the territorial waters of the individual states. The latter two facts could indicate that prevention of over harvest during the inshore spawning run could strongly influence the health of the fishery for that state in future years. This is barring any catastrophic environmental events that would severely impact the annual spawn survival or some unusually high mortality during the open ocean period of their life.
20
Recognizing that the minimum legal size for cobia is roughly 15 pounds with the average size in excess of 20 pounds, the current daily bag limit of two fish provides a very generous supply of fish per person. Some Beaufort county fishermen view this bag limit as excessive. The success enjoyed by Beaufort county charter boats which occasionally run two charters a day, limiting out on cobia on both trips, has caused some area fishermen to be concerned for the health of the local cobia stock. These fishermen would have the daily bag limit reduced to one fish per person per day. While a one fish bag limit would not hurt the future of the fishery, the findings of this report indicate that such an action at this time would be based on sociological issues and not a biological one. Recommendations The State Finfish Survey should expand the sampling in Beaufort county in order to better capture catch, effort, sex composition and size distribution data on the cobia fishery so that it can be effectively monitored. Collection of saggital otoliths for aging would be extremely valuable for future stock assessments and would require little additional time from creel clerks. A study should be undertaken on cobia reproduction in SC. The study should attempt to define the temporal and spatial spawning activity for the fish using Port Royal Sound and evaluate and define the role Port Royal Sound plays in the fish’s life history. Mariculture work being conducted on cobia by the MRD should consider examining the dispersal pattern of juvenile cobia from Port Royal Sound through the release of tagged juveniles in early fall. This would serve to define the contribution of the SC cobia spawn to the US Atlantic stock(s). It would provide information on the feasibility of stocking of cobia in estuaries. An assessment of the genetic diversity of the cobia population found in Port Royal Sound as-well-as other areas of the coast should be a high priority. This study should be conducted prior to any attempt at stocking cobia. The concept of catch and release fishing should be specifically promoted and stressed for the Beaufort county and state cobia fishery. Fishing clubs and conservation groups pushing for stronger angling ethics in this area, can help guide and direct the future of this localized fishery through community avocation and awareness.
21
Acknowledgements Bob Low with the Finfish Management Section is thanked for providing the data summaries and analysis of the State Finfish Survey, Charter Boat Log Book Program and commercial fisheries data. Robert Wiggers with the Fisheries Statistics Program kindly provided summaries of the cobia tagging data collected in the Marine Game Fish Tagging Program. The author is indebted to Hansje Gold for the extensive assistance with the computer processing of the data. A special appreciation is extended to K. B. Davy for her many years of dedicated work to the Marine Game Fish Tagging Program and to David M. Cupka who founded the public tagging program in 1974. Appreciation is extended to David Whitaker, Wayne Waltz, Mel Bell, Catherine Riley, Bob Low, Bob Martore, and David Cupka for their review and many helpful suggestions on the report. Literature Cited Briggs, J. C.
1958. A list of Florida fishes and their distribution. Bull. Fla. State Mus., Biol. Sci. 2:221-318. 1960. Fishes of worldwide (circumtropical) distribution. Copeia 1960 3):171-180.
Burns, K. M., and C. Neidig.
1992. Cobia, Rachycentron canadum, amberjack, (Seriola drumerili), and dolphin, (Corypheana hippurus) migration and life history study off the southwest coast of Florida. Mote Mar. Lab. Tech. Rep. 267, 58p.
Burns, K. M.,C. Neidig, J. Lotz, and R. Overstreet.
1998. Cobia (Rachycentron canadum) stock assessment study in the Gulf of Mexico and in the south Atlantic. Mote Mar. Lab. Tech. Rep. 571, 108p.
Davy, K. B. 1994. South Carolina Marine Game Fish Tagging Program, 1974 – 1992.
SC Mar. Res. Tech. Rep. No. 83, 128p. Franks, J. S., J. R. Warren and M. V. Buchanan.
1999. Age and Growth of cobia, Rachycentron canadum, from the northeastern Gulf of Mexico. Fish. Bull. 97:459-471.
Franks, J. S., M. H. Zuber, and T. DmcIlwain.
1991. Trends in seasonal movements of cobia, Rachycentron canadum, tagged and released in the northern Gulf of Mexico. J. Miss. Acad. Sci. 36(1):55.
Hassler,W. W. and R. P. Rainville.
1975. Techniques for hatching and rearing cobia, Rachycentron canadum, through larval and juvenile stages. Publ.UNC-SC-75-30, Univ. N. C. Sea Grant Coll. Prog., Raleigh, NC, 26p.

22
Howse, H. D., R. M. Overstreet, W. E. Hawkins and J. S. Franks.
1992. Ubiquitous perivenous smooth muscle cords in viscera of the teleost Rachycentron canadum, with special interest on liver. J. Morphol. 212:175-189
Hrincevich, A. W.
1993. Analysis of cobia, Rachycentron canadum, population structure in the northern Gulf of Mexico using mitochondrial DNA. M. S. Thesis, Univ. Southern Miss., Hattiesburg, MS, 91p.
Joseph, E. B.,J. J. Norcross and W. H. Massman.
1964. Spawning of the cobia, Rachycentron canadum, in the Chesapeake Bay area, with observations of juvenile specimens. Chesapeake Sci. 5:67-71.
Richards,C. E.
1967. Age, growth and fecundity of the cobia, Rachycentron canadum, from the Chesapeake Bay and adjacent mid-Atlantic waters. Trans. Am. Fish. Soc. 96:343-350.
Shaffer, R. V., and E. L. Nakamura.
1989. Synopysis of biological data on the cobia, Rachycentron canadum. (Pisces:Rachycentridae). FAO Fisheries Synop. 153 (NMFS/S 153). U.S. Dep. Commer., NOAA Tech. Rep. NMFS 82, 21p.
Smith, J. W.
1995. Life history of cobia, Rachycentron canadum, (Osteichthyes: Rachycentridae), In North Carolina waters. Brimleyana. 23:1-23
Thompson, N. B.
1993. Assessment of the status of cobia in the Gulf and Atlantic: A working paper presented to the Mackerel Stock Assessment Panel. NMFS Southeast Fisheries Science Center, Miami Lab. Contr. MIA-92/93-45.
Williams, E. H.
2001. Assessment of cobia, Rachycentron canadum, in the waters of the U.S. Gulf of Mexico. A report presented to the Mackerel Stock Assessment Panel. Center for Coastal Fisheries and Habitat Research, Beaufort, NC. 55p.