Status of Higher Education in South India 2013 - Deloitte US · PDF fileStatus of Higher...
74
Status of Higher Education in South India 2013 November 2013 For private circulation
Transcript of Status of Higher Education in South India 2013 - Deloitte US · PDF fileStatus of Higher...

Status of Higher Education in South India 2013
November 2013 For private circulation

Contents
Foreword …………………………………………………………………………………………………………. 1
Current Status of Higher Education Sector in India ………………………………………………………… 5
Rashtriya Uchchatar Shiksha Abhiyan (RUSA) - Shaping the future of higher education in India ……… 21
Overview of Higher Education in Southern Region ………………………………………………………… 27
India ……………………………………………………………………………………………………………… 28
Andhra Pradesh …………………………………………………………………………………………………. 34
Karnataka ………………………………………………………………………………………………………… 38
Kerala ……………………………………………………………………………………………………………. 43
Tamil Nadu ……………………………………………………………………………………………………… 47
Puducherry ………………………………………………………………………………………………………. 51
Survey on key challenges faced by Southern Higher Education Institutions ……………………………... 55
About CII …………………………………………………………………………………………………………. 68
Acknowledgements …………………………………………………………………………………………….. 69
About Deloitte …………………………………………………………………………………………………… 70
Glossary ………………………………………………………………………………………………………….. 71

1 Status of Higher Education in Southern Region 2 013
Foreword
India’s higher education system is one of the largest systems of this kind in the world and is also the fastest growing sector in the country. With the increasing demand for quality higher education in the country it has become imminent that a consistent plan is laid for the growth and enhancement of quality higher education in India.
Confederation of Indian Industry (CII) has been actively engaging with the government for enabling policies to support the changing dynamics and requirements of higher education in India. With the presence of large number of industry as well as good educational institutions in its membership, CII takes leadership in initiatives towards enhancing the quality of higher education vis a vis the industry requirements.
Southern region today is a preferred destination for learning, as it has adequate educational institutions, efficient and committed teachers, strong education policy of the government, and infrastructural facilitates for professional education.
Over the last few years, the scenario of Higher Education in the southern region has witnessed manifold increase in the educational activities. The CII Southern Region subcommittee on higher education plays an active role in connecting with the stake holders in the higher education sector including the administrators, regulatory bodies and the government to identify areas of improvement in issues like enhancing quality and quantity of higher education, issues of governance & policies, support for academic & physical infrastructure, and greater financial resources etc.
CII Southern region Sub Committee on Higher education continues to work in pursuit of excellence in this sector and accordingly lot of initiatives have been taken by the Sub Committee on Higher Education including initiatives like CII Innovator Award for showcasing the best innovative ideas, Employability Bridge for enabling high frequency, qualitative interaction between academic institutions and industry, Education Excellence Forum to address the industry-institute employability concerns., International missions to learn from the best international practises and the University Industry Congress project to identify the best industry linked engineering institute amongst many others.
I am happy that CII Southern Region has conducted a survey on the issues and challenges faced by educational institutions which has been incorporated in this CII - Deloitte Study report and I hope this report will be useful for all the stakeholders in this sector.
B Santhanam Chairman, CII Southern Region & MD Saint Gobain Glass India Limited

2 Status of Higher Education in Southern Region 2 013
Foreword
CII is organising the first edition of the National Higher Education Conclave in Coimbatore with the theme Transformational Change in Higher Education: Global Excellence through Governance, Research & Innovation. The objective is to encourage an open and inclusive format for discussion, involving all the stakeholders of the higher education sector to identify solutions for enhancement of quality of higher education in India.
The two day National Higher Education Conclave would have sessions focused on the topics relating to the management, administration and teaching excellence with paper presentations and case studies that are needed for the institutions to bench mark their strategic growth & development.
As an additional initiative to support the proceedings of this conclave, we also conducted a survey on present issues and challenges of the higher educational institutions focusing on the southern states. The findings of the survey has been covered in this report, that also includes the snapshots of performance of all southern states in higher education sector that has been taken from the CII Deloitte National report.
I am pleased that the Rashtriya Uchchatar Shiksha Abhiyan (RUSA) initiative by the central government touches some of these issues that has been brought out in this report, but I also through this report, request the state governments to extend their support and help in addressing these issues at the state level simultaneously.
In this report we have tried to highlight the major concerns of higher education institutions - specifically in the southern states - and the challenges that need to be addressed at different policy, process, and control levels. I hope this study report will be useful to all the stake holders of higher education sector.
C R Swaminathan Co Chair, CII National Committee on Higher Education & Past Chairman, CII Southern Region

3 Status of Higher Education in Southern Region 2 013
Foreword
The government’s consistent focus on school education through schemes like Sarva Shiksha Abhiyan (SSA) and Rashtriya Madhyamik Shiksha Abhiyan (RMSA) has yielded positive results in terms of the resultant increase in enrolments. This has created the need for a strategic intervention to address the higher education system in the country. With over 700 universities, 35,000 plus colleges and numerous stand-alone technical/professional institutions having annual enrolment in excess of 25 million students, India has one of the largest higher education systems in the world.
Despite the growth, the higher education sector is facing enormous challenges, which need to be addressed urgently to achieve the country’s vision of becoming a knowledge economy. In this background, CII and AICTE conducted a two-day long the Global University-Industry Congress on 7 and 8 November 2013, that witnessed the industry and academia coming together to share their experience on challenges being faced by the higher education sector in the country and measures required to address them. Deloitte was the knowledge partner for this prestigious event and authored a report, in partnership with MHRD, titled “Annual Status of Higher Education of States and UTs in India 2013”. The report was released during the event by Sh. Pawan Agrawal, Adviser – Higher Education, Planning Commission.
States constitute an important part of the overall higher education system as can be established from the fact that about 94% of students enrolled in government higher educational institutions come under state higher education system besides private higher educational institutions, which account for about 59% of total enrolments. This report titled ‘Annual Status of Higher Education in Southern Regio n 2013’ is an abridged version of the aforementioned report, and it stresses upon the higher education system of southern region besides providing an overview of key indicators of higher education at a national level.
The higher education system in the southern region has fared better over the years in comparison to overall higher education system. For instance, Tami Nadu has the highest number of universities in the country while Andhra Pradesh and Karnataka rank third and fifth, respectively in terms of number of universities in India. Further, the Gross Enrolment Ratio (GER) of all states in southern region is better than the national average. However, the region has its own set of issues which could potentially affect the growth of higher education in the region. In order to assess the challenges faced by the administrators of higher educational institutions in the southern region, CII has conducted a survey on key challenges in higher education under key parameters. This report captures the key findings of this survey. The survey will be useful in providing insights to regulatory authorities in addressing the challenges by way of suitable policy intervention and other measures.
Of the recent reforms initiated by government in higher education sector, RUSA comes out as the most important measure as its seeks to address some of the challenges in the existing system by developing an efficient funding mechanism and improving the quality in existing institutions among others. This report presents an analysis of the probable impact of the RUSA on the higher education sector.
We would like to express our sincere gratitude CII for its support and cooperation in preparation of this report.
Deloitte Education Sector Team

4 Status of Higher Education in Southern Region 2 013
Part I National perspective on Higher Education

5 Status of Higher Education in Southern Region 2 013
Current Status of Higher Education Sector in India
Introduction
A sound higher education sector plays an important role in economic growth and development of a nation. Higher education, in terms of its relevance and importance, enjoys a significant position in the education system as it equips people with appropriate knowledge and skills to be gainfully employed. India has one of the largest systems of higher education in the world offering facility of education and training in almost all aspects of human creativity and intellectual endeavour. In the context of current demographic structure of India where the majority of population is below the age of 25 years, the role of higher education is critical.
Figure 1: Structure of Higher Education
Source: Deloitte analysis
The general education mainly consists of higher education courses in arts, commerce and science, the technical education on the other hand comprises of programmes of education, research and training in engineering technology, architecture, town planning, management, pharmacy and applied arts and crafts. Professional education includes courses in medical education, law and other specialized fields.
Age (Years)
General Technical / Professional
Elementary Education
Doctoral Education
Post-Graduate education (General)
Graduate education (General)
Higher & Senior Secondary schooling
Secondary schooling
Post-Graduate education (Technical / Professional)
Graduate education (Technical / Professional)
Polytechnic education (Technical)
> 23
18 - 23
16-18
14-16
6-14

6 Status of Higher Education in Southern Region 2 013
Key Features of the Indian Higher Education System
Infrastructure
Number of Higher Education Institutions
Higher education in India has witnessed an impressive growth over the years. The number of higher educational institutions (HEIs) has increased from about 30 universities and 695 colleges in 1950-51 to about 700 universities (as of 2012-13) and 35,000 colleges (as of 2011-12) as per a recent UGC report1. With an annual enrolment of above 25 million (including enrolment under Open and Distance Learning system), India is today ranked as the third largest higher education system in the world after US and China.
Figure 2: Higher Education Institutions in India
Source: UGC Higher Education at a Glance - June, 2013
As may be seen from Figure 2 above, there has been a threefold increase in the number of HEIs in the country during the last decade.
Higher Education Institutions by type
The break-up of number of HEIs in the country shows that the share of state universities is the highest (44%) followed by private universities (22%), deemed universities (18%), institutes of national importance (10%) and central universities (6%).
1 UGC Higher Education at a Glance - June, 2013
Number of Colleges Number of Universities
695 1,5423,604 4,722
7,346
12,806
31,564
35539
0
5000
10000
15000
20000
25000
30000
35000
40000
3055
103133
193
256
574
700
0
100
200
300
400
500
600
700
800

7 Status of Higher Education in Southern Region 2 013
Figure 3: Break up of HEIs
Private sector participation
The public expenditure in higher education remained close to 1% of the country’s Gross Domestic Product (GDP) over the years, which has been quite low in proportion to the burgeoning requirements of this sector. This has led to an exponential growth of private sector institutions. The number of private HEIs has increased by more than 60% during the five year period between 2007 and 2012, as illustrated in Figure 3. As a result, the share of private sector in terms of total HEIs has increased to about 64% in 20122.
Source: Twelfth Five Year Plan (2012-2017) - Social Sectors
Enrolment
Growth in enrolment and GER
The increase in the enrolment figures is consistent with the expansion of HEIs over the years. The total enrolment in higher education has increased from 0.21 million in 1950-51 to about 22 million in 2011-12, while the GER has increased from 0.40% in 1950-51 19.4% in 2012-133.
2 Twelfth Five Year Plan (2012-2017) - Social Sectors
3 UGC Higher Education at a Glance - June, 2013 and RUSA, 2013
Figure 3: Number of private HEIs Figure 4: Type wise distribution of HEIs, 2012
Source: UGC Higher Education at a Glance - June, 2013
306
129
44
67
154
State University
Deemed University
Central University
Institution of National Importance
Private University
0 50 100 150 200 250 300 350
18,145
29,662
0
20,000
40,000
2007 2012
Central Govt, 221 ,
0.5%State Govt,
16,547 , 35.6%
Private, 29,662 , 63.9%

8 Status of Higher Education in Southern Region 2 013
Source: UGC Higher Education at a Glance - June, 2013 and RUSA, 2013
While we have been able to cross the GER of 15%, which can largely be attributed to the focused efforts of the 11th Five Year Plan, a lot more needs to done in order to translate the favourable age-structure of the country into a demographic dividend.
Insitution wise enrolment
The increase in number of private HEIs has also resulted in an increased private sector share in the total enrolment. The share of private sector in terms of total enrolment has grown from 33% in 2001 to 59% in 20124. While the number of private HEIs account for about 64% of the total HEIs, the share of private sector in total enrolment stands at 59%, as illustrated in the following figures. The central and state government institutes on the other hand account for 2.6% and 38.6% of the total enrolments, respectively.
Source: Twelfth Five Year Plan (2012-2017) - Social Sectors
The government is targeting to achieve a GER of 30% by 20205 which will require creation of additional enrolment capacity at an unprecedented scale. Accordingly, the 12th Five Year Plan envisages creating an additional enrolment capacity of 10 million, which is expected to raise the GER from present level of 17.4% to 25.2% in 2017-18. The 12th Five Year Plan also acknowledges the need for a continued and growing role of the private sector in higher education.
4 Twelfth Five Year Plan (2012-2017) - Social Sectors
5 Twelfth Five Year Plan (2012-2017) - Social Sectors
Figure 5: India’a GER in higher education (in %) Figure 6: Enrolment in higher education (in 000’)
Figure 7: Share of higher education instituions in enrolment
Figure 8: Percentage share of private sector in hig her education enrolments
207 1064 1954 2752
4825
879518670
22373
1950-51 1960-61 1970-71 1980-81 1990-91 2000-01 2010-11 2011-12
33%
54%
59%
20
40
60
2001 2007 2012
0.40%
11% 11.9% 12.7% 13.6% 15%19.4%
1950-51 2005-06 2006-07 2007-08 2008-09 2011-12 2012-13
Central Govt,
563,000 , 2.6%
State Govt, 8,400,000 ,
38.6%
Private, 12,823,000 ,
58.9%

9 Status of Higher Education in Southern Region 2 013
Infact, of the additional enrolment capacity of 10 million to be created during the 12th Five Year Plan, 6.2 million6 is expected to be created by the private sector.
Enrolment by course
In terms of distribution of enrolment across various courses, Arts has been the favourite choice amongst students with 37.09% of enrolment, followed by 18.64% in Science, 17.57% in Commerce/Management and 16.06%7 in Engineering/ Technology.
Source: Twelfth Five Year Plan (2012-2017) - Social Sectors
Enrolment by social groups
The overarching goal of a progressive higher education system is to ensure that that the education is available uniformly to all concerned without any bias. Therefore, it is imperative to understand higher education system on various social parameters. The below mentioned figure provides an overview of GER in higher education for different social groups.
6 Twelfth Five Year Plan (2012-2017) - Social Sectors 7 Source: Twelfth Five Year Plan (2012-2017) - Social Sectors
Figure 9: Distribution of enrolment in higher educ ation courses
Arts7,519,495
37.1%
Commerce/Management
3,571,083 17.6%
Engineering/ Technology3,261,500
16.1%
Science3,789,967
18.7%
Medicine715,706 3.5%
Education/ 712,627 3.5%
Law373,206 1.8%
Veterinary Science28,504 0.1% Agriculture & Allied
97,313 0.5%
Others212,947 1.0%

10 Status of Higher Education in Southern Region 2013
Figure 10: GER in higher education on various socia l parameters (2009-10) 8
Source: NSS 66th Round 2009-10; some of the figures have been estimated from unit level data of NSS 66th Round of Employment and Unemployment
by Bino Paul, Labour Market Research Facility, TISS and RUSA
The representation of Scheduled Castes (SCs) and Scheduled Tribes (STs) in enrolments in the Indian higher education have remained low over the years. As may be seen from the above figure, the GER of SCs in higher education is 12.2% (2009-10), while that of the ST population stands at 9.7% (2009-10), which is far below than the national average. This underscores the need to initiate special efforts for these groups.
Similarly, there exists a wide variation between male and female GERs in the country. The share of females enrolled in higher education is only 12.7%, while it is 17.1% for males. The gap between male and female GER is more pronounced in urban areas than in the rural areas.
Further, analysis of GER among urban and rural populations provides useful insights. The GER in urban areas (32.5%) is more than double that of the GER in rural areas (13.9%). This is reflective of the concentration of private HEIs in urban areas which aim to attract young urban population. There is an urgent need to broaden the institutional reach in rural areas in order to strike a balance.
RUSA, the landmark scheme of MHRD on higher education also highlights the wide disparities existing in higher education on aforementioned social parameters.
Qualitative aspects
Faculty
Availability of good quality faculty is a critical input in the functioning of a sound higher education system. While there has been a consistent growth in the faculty strength in higher education, it has not matched the growth in student enrolment numbers. While the student enrolments have gone up by more than 100 times between 1950-51 and 2011-12, the number of teachers has gone up by less than 40 times, which implies the student-teacher ratios have declined by about 2.5 times over this period. This has also led to the country’s poor performance on student-teacher ratio at the international level, as can be seen in the figure below.
8 The data on the above mentioned parameters is available for the year 2009-10.
17.1
12.7
12.2
13.0
9.0
9.7
7.5 13
.1
32.5
29.6
13.7
13.9
13.7
8.3
0
5
10
15
20
25
30
35
All
(M)
All
(F)
SC
(All)
SC
(M
)
SC
(F
)
ST
(All)
ST
(M
)
ST
(F
)
Urb
an(A
ll)
Urb
an(M
)
Urb
an(F
)
Rur
al(A
ll)
Rur
al(M
)
Rur
al(F
)

11 Status of Higher Education in Southern Region 2013
Source: UGC Higher Education at a Glance - June, 2013, UNESCO Institute of Statistics and Statistics of Higher and Technical education in Indi, 2009,
MHRD
Further, an analysis of the availability of faculty on the basis of experience reveals that a majority of universities and colleges hire lecturers who are relatively less experienced, while the more experienced readers and professors, especially in the affiliated colleges, constitute a small proportion, which has a bearing on the quality of education.
Source: UGC Annual Report, 2011-12
Research
Research is an essential component of a higher education system to ensure it remains vibrant and is quick to respond to and anticipate changes arising in the contextual conditions. One of the input parameters to ascertain progress in research is the quantum of spending on research and development activities. As per a study9, India’s share in R&D
9 Source : Battelle, R&D Magazine -2009 RD Funding final report
(https://www.google.co.in/?gws_rd=cr&ei=JM5sUqjsL8TorQfh_oDoCQ#q=Research+%26+Development+expenditure+a+concept+paper+deloitte)
Figure 11: Growth in Faculty Strength Figure 12: Student Teacher Ratio in Select Countrie s
Figure 13: Level wise distribution of faculty in University Department and Constitutent colleges
Figure 14: Level wise distribution of faculty in Affiliated Colleges
2354959,673
128,876193,341
263,125
411,628
816,966
933761
0
100000
200000
300000
400000
500000
600000
700000
800000
900000
1000000
13.6
18 18.1
9.5
17.4 16.8
22.2
16.3
24
0
5
10
15
20
25
30
Sr. Lecturer, 12%
Lecturer, 41%
Tutor / Demonstrato
r, 5%
Professor, 17%
Reader, 25%
Sr. Lecturer, 13%
Lecturer, 57%
Tutor / Demonstrat
or, 3.0%
Professor, 7%
Reader, 20%

12 Status of Higher Education in Southern Region 2013
spending to the total global R&D spending stands at 2.1% while the share of China is 12.5%. Figure 15 compares the R&D spending of India and China with other developed economies. There is clearly a need to increase spending on R&D as we move forward to become a knowledge economy.
Source: Battelle, R&D Magazine -2009 RD Funding final report
Another important parameter to measure research is the enrolment and award of PhDs. The number of PhDs awarded in India has doubled over a ten year period from 1998 to 200710. The study11 also indicates that only 0.25% of the students who enrolled at the graduate level get themselves enrolled for PhD. The number of PhDs produced in India grew at an annual rate of about 9% during the period from 2002 to 2007, whereas the number of PhDs awarded in China grew at a rate of over 18%12 during the same period. The following figure provides a comparison of PhDs produced by India, China and USA during the period 2002-2007.
Figure 16: Number of PhDs awarded in India, China & US
Source: Sunder. S. Higher Education Reforms in India, Yale University 2010
10 Source: Trends in Higher Education - Creation And Analysis Of A Database of PhDs In India, National Institute Of Advanced Studies
11 Source: Trends in Higher Education - Creation And Analysis Of A Database of PhDs In India, National Institute Of Advanced Studies
12 Source: Sunder. S. Higher Education Reforms in India, Yale University 2010
Figure 15: Share of total global R&D spending
US, 33.6%,
Europe, 25%
Japan, 12.6%
China, 12.5%
India, 2.1%
Others, 15%
11974
1532817853 17898 18730
2013114,70618,625
22,593
26,392
36,247
41,464
40024 40024 4075742112
38195
48112
0.0
10,000.0
20,000.0
30,000.0
40,000.0
50,000.0
60,000.0
2002 2003 2004 2005 2006 2007
India China USA

13 Status of Higher Education in Southern Region 2013
Accreditation
Accreditation ensures that the education delivered in a particular stream/college is of an acceptable quality as per prescribed standards. Accreditation in higher education in India has been a voluntary exercise over the years, as a result, only a small percentage of HEIs have opted for accreditation. The statistics13 show that only 31% of the universities and 14.5% of the colleges are accredited with the National Assessment and Accreditation Council (NAAC).
Source: NAAC, Bangalore, 2013
The University Grants Commission (UGC) has recently made accreditation mandatory for all universities and colleges, which will force the HEIs to improve quality in order to attract students. The technical institutions, which have currently been kept out of the purview of these regulations, are expected to be brought within the ambit of mandatory accreditation in near future.
Role of the Government
In India, education has been considered a public good and, therefore, responsibility of providing education to the citizens lies largely with the central and state governments. The government departments and agencies are mainly involved in framing policies and regulations that facilitate higher education and in supporting the institutions through financial and other forms of assistance. Education is on the concurrent list of the Indian Constitution and, therefore, the aforesaid responsibility is often shared between the central and state governments, which often necessitate a good coordination mechanism to avoid conflicts. Over the years, the multiple agencies have been formed at a national level in order to administer and regulate different components of higher education, some of which have been mentioned below.
Key institutions
Ministry of Human Resources Development
Department of Higher Education, Ministry of Human Resource Development, Government of India is the apex body with regards to policy formulation in the field of higher education in the country. The following subjects (a selective set of relevant subjects presented hereunder for reference) were allocated to the Department of Higher Education, as per Second Schedule to the Government of India (Allocation of Business) Rules, 1961:
• University education; Central Universities; Rural Higher Education, Foreign Aid Programme relating to Higher Education, Technical Education Planning.
• Institutions of higher learning (other than Universities).
13 Source: NAAC, Bangalore, 2013
Figure 17: Universities accredited by NAAC Figure 18: Colleges accredited by NAAC
Accredited, 179 , 31.2%
Not Accredited, 395, 68.8%
Accredited, 5,156 , 14.5%
Not Accredited,
30,383, 85.5%

14 Status of Higher Education in Southern Region 2013
• Educational Exchange Programmes, exchange of teachers, professors, educationists, technologists, etc.; programme of exchange of scholars between India and foreign countries.
• Grant of permission to teachers of Universities, colleges and institutions of higher learning to accept assignments abroad.
• Admission of foreign students in Indian Institutions. • Expansion, Development and Coordination of Technical Education. • University Grants Commission. • All Indian Council for Technical Education, including conduct of its National Diploma and National Certificate
Examinations.
While the MHRD oversees policy making with respect to higher education, its implementation and enforcement rests with the various institutions and regulatory authorities set-up for different streams of higher education.
University Grants Commission
The UGC, a statutory body constituted under the UGC Act, has been entrusted with the task of coordination, determination and maintenance of standards of university education in India. The UGC is also responsible for disbursement of grants to central and state universities to enable them to carry out their activities. Besides this, UGC advises the central and stated governments on the measure necessary for improvement of university education. The UGC has framed various regulations to ensure minimum infrastructure requirements in order to maintain quality and standards of the higher education. The UGC regulations provide that the right of conferring degrees can be exercised only by a university or deemed university established under a Central Act or a State Act. Key functions of the UGC include the following:
• Take all steps for the promotion and co-ordination of university education and for the determination and maintenance of standards of teaching, examination and research in universities.
• Inquire into the financial needs of universities and allocate and disburse grants to universities for the maintenance and development of such universities.
• Recommend to any university the measures necessary for the improvement of university education and advise the university upon the action to be taken for the purpose of implementing such recommendation.
All India Council for Technical Education
The All India Council for Technical Education (AICTE) is a statutory body constituted under the AICTE Act, 1987 with a view to ensure proper planning and coordinated development of the technical education system throughout the country. It is also responsible for the promotion of qualitative improvement of technical education and regulation of norms and standards in the technical education system. The technical education has covers programmes of education, research and training in engineering technology, architecture, town planning, management, pharmacy and applied arts and crafts. Under the AICTE regulations, no institution providing technical education can be established without prior approval of AICTE. The regulations contain a detailed procedure for seeking AICTE approval. However, the recent Supreme Court judgment has completely turned the situation by holding that the AICTE’s role with respect to technical colleges (affiliated to university) is restricted to just advisory & recommendatory, while the powers of defining and maintaining standards of technical education vest in the UGC.

15 Status of Higher Education in Southern Region 2013
National Board of Accreditation (NBA)
The National Board of Accreditation (NBA) was constituted by the AICTE, as an Autonomous Body, under Section 10 (u) of the AICTE Act, 1987 to periodically conduct evaluation of technical institutions or programmes on the basis of guidelines, norms and standards specified by it and to make recommendations to it, or to the AICTE or to other bodies, regarding recognition or de-recognition of the institution or the programme.
National Assessment and Accreditation Council (NAAC)
It is an autonomous body established by the UGC to assess and accredit institutions of higher education in the country. It is an outcome of the recommendations of the National Policy in Education (1986) that laid special emphasis on upholding the quality of higher education in India. The key tasks of the organization are:
• To arrange for periodic assessment and accreditation of institutions of higher education or units thereof, or specific academic programme or projects.
• To stimulate the academic environment for promotion of quality of teaching-learning and research in higher education institutions.
• To encourage self-evaluation, accountability, autonomy and innovations in higher education. • To undertake quality-related research studies, consultancy and training programme. • To collaborate with other stakeholders of higher education for quality evaluation, promotion and sustenance.
NAAC primarily assesses the quality of institutions of higher education that volunteer for the process, through an internationally accepted methodology.
Inter-University Board/ Association of Indian Universities
The Inter-University Board (IUB) of India was formed in 1925 with the view of promoting university activities, especially by way of sharing information and cooperation in the field of education, culture, sports and allied areas. The Inter-University Board acquired a legal status with its registration in 1967 as a Society under the Societies Registration Act, 1860. In 1973, it assumed its present name: the “Association of Indian Universities” (AIU). The membership includes traditional universities, open universities, professional universities, Institutes of National Importance and deemed-to-be universities. In addition, there is a provision of granting of Associate Membership to universities of neighboring countries. Apart from serving as an Inter-University forum, AIU acts as a bureau of information and facilitates communication, coordination and mutual consultation amongst universities. As a representative of Indian universities, it liaises between universities and the Government (Central as well as the State Governments) and assists universities in obtaining recognition for their degrees, diplomas and examinations from other universities, Indian as well as foreign.
Distance Education Council
Over the years, there has been a phenomenal increase in institutes providing Open and Distance Learning (ODL) education in the country. One of the main reasons is the lack of infrastructure in conventional education system to serve the growing population. Therefore, it was considered imperative to set up a separate authority to coordinate and promote the ODL education in the country. Accordingly, the Indira Gandhi National Open University (IGNOU) Act was enacted. Apart from performing the functions of a university, IGNOU is also responsible for promotion of ODL system and for co-ordination and determination of its standards. For this purpose, Distance Education Council (DEC) was set up by IGNOU to regulate the ODL education in the country.
However, the IGNOU, vide its notification dated 1st May 2013, has dissolved the DEC and consequently, the powers to govern the ODL system has been vested in the UGC and AICTE for their respective domains.
Government expenditure
The public expenditure in education sector, especially in higher education has remained very low over the years, only a little over 1% of the GDP as shown in the following figure. The National Education Policy 1968 and 1986 (revised in 1992) recommends government expenditure on education at 6% of GDP, whereas the 2010-11 (BE) expenditure was only at 3.8%.

16 Status of Higher Education in Southern Region 2013
Source: Analysis of Budgeted Expenditure on Education, MHRD
Realizing the need to provide a good quality higher education to the growing young population of the country, the 11th Five Year Plan saw a 4.6 fold increase in allocation over the 10th Five Year Plan. This constituted 19.4% of the overall central plan allocation. To continue the trend, the 12th Five Year Plan proposes an outlay of Rs.1,10,700 crore for higher education, an increase of 30% over the 11th Five Year Plan. However, given the burgeoning requirements of this sector, the government funding alone may not be sufficient and significant involvement would be required of the private sector as well.
Key Issues
While there has been a significant development in the field of higher education in India, it still lags behind in comparison to many developed countries. In fact developing countries like China, Malaysia and South Korea fare better than India on many counts. The situation gets compounded as India has a daunting task of providing employment opportunities to its growing workforce, which can only be possible if it has a sound higher education system. The following table highlights the key issues facing the higher education sector in India.
Figure 19: Expenditure on education as % of public expenditure
Figure 20: Expenditure on higher education (as %of GDP)
7.92
11.99
10.16 10.67
13.3714.42 14.16
0.641.48
2.112.98
3.84 4.28 3.8
0
2
4
6
8
10
12
14
1619
51-
52
196
0-61
197
0-71
198
0-81
199
0-91
200
0-01
201
0-11
(B
E)
% of publicexpenditure% of GDP
3.6
4.03.8
1.181.29 1.22
0
1
1
2
2
3
3
4
4
5
2008-09 2009-10 (RE) 2010-11 (BE)
On Education On Higher Education
17 Status of Higher Education in Southern Region 2013
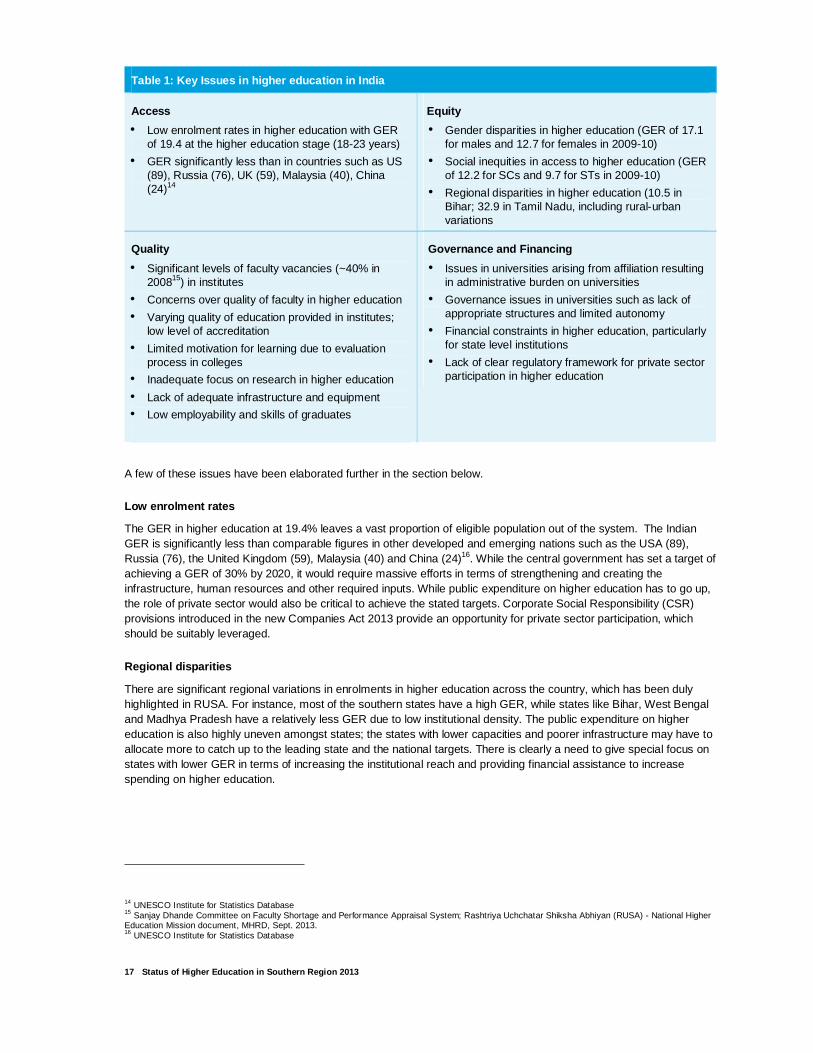
Table 1: Key Issues in higher education in India
Access
• Low enrolment rates in higher education with GER of 19.4 at the higher education stage (18-23 years)
• GER significantly less than in countries such as US (89), Russia (76), UK (59), Malaysia (40), China (24)14
Equity
• Gender disparities in higher education (GER of 17.1 for males and 12.7 for females in 2009-10)
• Social inequities in access to higher education (GER of 12.2 for SCs and 9.7 for STs in 2009-10)
• Regional disparities in higher education (10.5 in Bihar; 32.9 in Tamil Nadu, including rural-urban variations
Quality
• Significant levels of faculty vacancies (~40% in 200815) in institutes
• Concerns over quality of faculty in higher education
• Varying quality of education provided in institutes; low level of accreditation
• Limited motivation for learning due to evaluation process in colleges
• Inadequate focus on research in higher education
• Lack of adequate infrastructure and equipment
• Low employability and skills of graduates
Governance and Financing
• Issues in universities arising from affiliation resulting in administrative burden on universities
• Governance issues in universities such as lack of appropriate structures and limited autonomy
• Financial constraints in higher education, particularly for state level institutions
• Lack of clear regulatory framework for private sector participation in higher education
A few of these issues have been elaborated further in the section below.
Low enrolment rates
The GER in higher education at 19.4% leaves a vast proportion of eligible population out of the system. The Indian GER is significantly less than comparable figures in other developed and emerging nations such as the USA (89), Russia (76), the United Kingdom (59), Malaysia (40) and China (24)16. While the central government has set a target of achieving a GER of 30% by 2020, it would require massive efforts in terms of strengthening and creating the infrastructure, human resources and other required inputs. While public expenditure on higher education has to go up, the role of private sector would also be critical to achieve the stated targets. Corporate Social Responsibility (CSR) provisions introduced in the new Companies Act 2013 provide an opportunity for private sector participation, which should be suitably leveraged.
Regional disparities
There are significant regional variations in enrolments in higher education across the country, which has been duly highlighted in RUSA. For instance, most of the southern states have a high GER, while states like Bihar, West Bengal and Madhya Pradesh have a relatively less GER due to low institutional density. The public expenditure on higher education is also highly uneven amongst states; the states with lower capacities and poorer infrastructure may have to allocate more to catch up to the leading state and the national targets. There is clearly a need to give special focus on states with lower GER in terms of increasing the institutional reach and providing financial assistance to increase spending on higher education.
14 UNESCO Institute for Statistics Database 15 Sanjay Dhande Committee on Faculty Shortage and Performance Appraisal System; Rashtriya Uchchatar Shiksha Abhiyan (RUSA) - National Higher Education Mission document, MHRD, Sept. 2013. 16 UNESCO Institute for Statistics Database

18 Status of Higher Education in Southern Region 2013
Figure 21: GER of select states in higher education Figure 22: Public expenditure on higher education a s % of GSDP
Shortage of Faculty
Faculty shortages and the inability of the educational system to attract and retain well-qualified teachers have been posing challenges to quality education for many years. The number of teachers in the system has not kept pace with the growth in student enrolments and this aspect needs considerable and concerted attention to ensure the sustainability of the higher education system. A study conducted by the National Skill Development Corporation (NSDC)17 has estimated that there will be incremental requirement of about 31,71,000 teachers in higher education between 2008 and 2022 to ensure a student teacher ratio of 20:1. This is a huge challenge given that this target means a more than three-fold increase in the total number of teachers present in the system currently.
Concerns over quality of HEIs
The quality of education imparted to students in the HEIs has been a matter of concern for quite some time. As per the recently released by Times Higher Education Rankings, 2013-14, none of the Indian HEI features on the list of top 200 institutions, which is a reflection of quality of HEIs in the country. A recent study conducted by NASSCOM reveals that only 25% of engineering graduates are readily employable in the IT industry. Further, as per NAAC about 62% of the universities and 90% of the colleges were rated average or below average on specified quality parameters.
Regulatory issues
Ambiguity over regulations
There is a considerable amount of ambiguity with respect to regulations governing higher education. For instance, the applicability of regulations to colleges affiliated to universities, standalone institutions offering certificate, instead of degree/diploma programs, which are of lesser duration as provided for in the AICTE regulations and many more have been a matter of controversy. Similarly, the provisions governing course curriculum, fees, admission tests etc. have resulted in a number of challenges for the existing institutions. These conditions have also acted as a deterrent for genuine education providers from foreign countries to enter the Indian higher education sector.
Conflict of authority
Education being on the concurrent list has resulted into a multiplicity of regulators and regulations, which sometimes are in conflict of each other. This state of affairs was highlighted in the Yashpal Committee Report as submitted to the Union Minister Education in 2009. It observed that: “there is very little co-ordination among the statutory bodies in
17 NSDC Report on Human Resource and Skill Requirements in the Education and Skill Development Services Sector
32.9
28.4 27.625.5
13.612.4
10.5
0.0
5.0
10.0
15.0
20.0
25.0
30.0
35.0
TN AP MAH KTK MadhyaPradesh
WestBengal
Bihar
1.50%
0.85%
0.14%0.21%
1.27%
0.31%
0.55%
0.0%
0.4%
0.8%
1.2%
1.6%
TN AP MAH KTK MadhyaPradesh
WestBengal
Bihar

19 Status of Higher Education in Southern Region 2013
respect of degree durations, approval mechanisms, accreditation processes, etc. It sometimes leads to very embarrassing situations in which we find two regulatory agencies at loggerheads and fighting legal cases against each other.”
Lack of autonomy
Higher education in India is often criticised for being over-regulated with regulators exercising control over administrative and operational aspects such as admission policy, duration of programs, eligibility conditions, fixation of fee, salary of teachers, intake capacity, infrastructure requirements etc. These conditions leave virtually no autonomy with individual institutions to offer programs as per global standards through innovative pedagogy.
Lack of clear-cut policies for private sector participation18
The role of the private sector in higher education is critical as brought out in the preceding sections. This has also been acknowledged by the Working Group for Higher Education constituted for the 12th Five-Year Plan (2012-17) as: ‘while almost all major committees and policy documents have accepted the need for increased involvement of private sector in higher education, there is also lack of clarity on funding pattern, incentives, and regulatory oversight’. These issues need to be addressed and clarified so as to incentivize the private and corporate sectors to invest in higher education.”
The exisiting policy on higher education does not provide much clarity on these aspects of private sector participation and a clearer and unambiguous policy direction is essential to encourage a meaningful and effective private sector particpation..
Some Recent Developments
Higher education sector has witnessed some major policy and regulatory developments lately, which mainly seeks to address some of the pressing challenges faced by the sector. This section provides a brief account of these developments. Of these, the RUSA has been dealt in a greater detail in the following chapters.
Entry of Foreign Universities
In a major development, the MHRD issued a press release dated 10th September 2013 apprising that the Government is in the process of notifying rules which will pave the way for entry and operation of foreign universities in India. This proposal has also been supported by DIPP (nodal agency for facilitating FDI) and DEA (Nodal agency administration of exchange control regulations). The proposed rules require the Foreign Educational Institutions (FEIs) to fulfill certain eligibility conditions such as: (a) The FEI should be ranked amongst the top 400 universities of the world as per the rankings published by the prescribed agencies; (b) The FEI should form a not-for-profit legal entity in India, registered under section 25 of the Companies Act for setting up the campus; (c) The FEI has been registered as a not-for-profit legal entity in the host country, and should be in existence for at least twenty years; (d) It should be accredited by an accrediting agency of the host country. In absence of its accreditation in that country, it should be accredited by an internationally accepted system of accreditation; (e) It will offer programmes of study or courses to be of quality comparable to those offered to students in its main campus overseas; (f) It is required to maintain a corpus of not less than ₹ 250 million with respect to its Indian campus.
While the conditions mentioned above are as per press release issued by the MHRD, the final list of requirements will emerge as and when the proposed rules get notified. The proposed rules once notified will not only allow FEIs to bring in global best practices in higher education, it will also help the country saving millions of dollars spent by Indian students on higher education abroad. It would also be helpful to check the brain drain as it has been seen that the students studying abroad are reluctant to come back home for jobs.
18 Inclusive and Qualitative Expansion of Higher Education - Compilation Based on the Deliberations of the Working Group for Higher Education in the
12th Five-Year Plan (2012-17) University Grants Commission

20 Status of Higher Education in Southern Region 2013
Academic collaboration in higher education
In an attempt to promote excellence in higher education, the UGC has recently notified regulations which seek to provide a regulatory framework for academic collaboration / twinning arrangements in higher education (other than technical education). The regulations require the Foreign Educational Institutions, (FEIs) intending to operate in India through collaboration with Indian Educational Institutions (IEIs) for degrees and postgraduate diplomas programs, to obtain prior approval of the UGC. The existing IEIs or FEIs, already having collaborative arrangements, are also required to comply with these regulations within a period of 6 months from the date of notification. In addition, only those FEIs accredited with the highest grade in their homeland are allowed to enter into collaboration with IEIs which are accredited with a grade not less than B or its equivalent. The eligible IEI should have experience of atleast 5 years in offering educational programme(s) in India at the level of degree and postgraduate diploma and should have the prescribed infrastructure facilities among others.
These regulations are expected to facilitate academic collaborations between foreign and Indian educational institutions while ensuring that only the top foreign institutions which are accredited with highest grade can collaborate with Indian institutions.
Hon’ble Supreme Court judgment on AICTE powers over technical education
The Hon’ble Supreme Court has recently laid down certain important principles governing technical education system in the country. The Court held that AICTE’s role with respect to colleges affiliated to universities, offering technical programs is restricted to just advisory and recommendatory and is not of an approval authority. The Court also held that the AICTE can provide suggestions to the UGC for defining and maintaining standards of technical education in the colleges but can’t directly regulate these colleges. The judgment is expected to have a far reaching impact on technical education system in the country as UGC, with no prior experience of regulating technical programs, will now subsume the powers of AICTE. As per a recent directive issued by UGC to all universities, a complete ban on further affiliation to colleges offering technical education has been enforced as the UGC is stated to have been in the process of drafting regulations governing technical education.
Further, the Court has held that ‘MBA’ is not a technical program as defined under the AICTE Act and thus falls outside its purview. This has resulted in ambiguity as the judgment does not provide clarity on whether just MBA, which is a degree program, fall outside AICTE’s ambit or whether more popular programs such as post graduate diploma in management will also no longer require AICTE’s approval.
Dissolution of Distance Education Council
The IGNOU has vide its notification dated 1st May 2013 dissolved the DEC which was responsible for regulating the ODL system in the country. Consequently, the MHRD has vested the responsibility of governing ODL system in the UGC and AICTE as envisaged in their respective Acts. The UGC is currently in the process of framing regulations on the ODL system. As an interim measures, the UGC has vide its notification dated 17th June 2013 adopted the ‘Guidelines on Minimum Requirements for Recognition of ODL Institutions’ framed by erstwhile DEC. These guidelines shall cease to in force with effect from date of coming into force of proposed UGC regulations on ODL system.
There were debates on the manner in which DEC was dissolved and power vested in the UGC and AICTE to govern the ODL system. The fact that IGNOU Act, 1985 specifically allows IGNOU to govern the standards of ODL system in the country and without any amendment in IGNOU Act, the validity of powers vested in the UGC may be questioned.
Compulsory Accreditation
In an attempt to raise the quality of higher education in the country, UGC has notified regulations, which make accreditation mandatory for all higher education institutions (other than technical institutions). As per the Regulations, the HEIs, other than technical institutes, shall be mandatorily required to get accredited by the accreditation agency after passing out two batches or 6 years of existence, whichever is earlier, within a period of 6 months. The accreditation shall be valid for 5 years and shall be required to be applied for reaccreditation before 6 months of expiry of 5 years. Any failure to comply with the regulations shall to attract penalties including removal of impugned institute from the list of HEIs of the UGC and declaring the institute as ineligible for any financial assistance by UGC in future.
This is certainly a positive move as it aims to meet the crying demand of ensuring quality in higher education. It is expected that technical institutions, which have currently been kept out of the purview of these regulations, will soon be brought within the ambit of mandatory accreditation. A bill aiming to achieve a similar objective is presently awaiting approval of the parliament.

21 Status of Higher Education in Southern Region 2013
Rashtriya Uchchatar Shiksha Abhiyan (RUSA) Shaping the future of higher education in India
On 3rd October 2013, the Cabinet Committee on Economic Affairs of the Government of India gave its approval to the RUSA, a new centrally sponsored flagship scheme for higher education in India. This section looks at the need, key objectives and features of RUSA in the context of the higher education system in India, and how it attempts to address some of the key challenges outlined in the preceding chapter19.
The need for RUSA – addressing challenges at the St ate level
There are several key issues with respect to the higher education system in India which need to be tackled if the target of achieving a GER of 30% in higher education is to be attained. Amongst the major factors responsible for the challenges facing higher education in India is the poor status of state higher education systems. In particular, they face issues relating to inadequate financing, ineffective planning at the state level and lack autonomy, as described below.
• Inadequate financing for state higher education ins titutions - While state universities cater to a large number
of students, they face severe constraints in terms of access to finances, particularly in relation to central
institutions. The sources of funding for state universities include Plan and Non-Plan grants from state governments,
funding from the UGC and other Central government projects as well as fees and other university receipts through
avenues such as affiliations.
State government support to state institutions has been inadequate, with resources spread thinly over an
increasing numbers of institutions. Plan expenditure on higher education in states has been declining with the
expenditure on higher education as a proportion of the Gross State Domestic Product (GSDP) at an average of
only 0.5%20.
With regard to UGC funding, while state universities are provided some funds through this route, UGC is only
mandated to fund institutions that are categorized as compliant to Sections 12B and 2(f) of the UGC Act, which
stipulate norms in terms of physical facilities, infrastructure and quality to be eligible for central funding. This
excludes about 37% of the universities and 81% of the colleges which, therefore, lack funding support because
they do not have the facilities to begin with, thereby accentuating the problem.
UGC also lacks the mandate to fund new institutions in a state. States are sometime unaware of development
funds that come to the state institutions from the Centre as they are not routed through UGC. Additionally, funding
to state institutions and universities is often done on an ad-hoc basis, and based on item-wise allocations instead of
block grants. This leads to bureaucratic hurdles and difficulties in utilization of funds.
19 Note – The primary reference for this section is the final Rashtriya Uchchatar Shiksha Abhiyan (RUSA) - National Higher Education Mission document dated September 2013.
20 Rashtriya Uchchatar Shiksha Abhiyan (RUSA) - National Higher Education Mission document, MHRD, Sept 2013.

22 Status of Higher Education in Southern Region 2013
As a result, over the years, this shortage of funding has been a key factor responsible for several of the issues
plaguing higher education institutes, including poor infrastructure, faculty shortages and inadequate research
output.
• Ineffective planning for higher education at the st ate level - A related concern in higher education is with
regards to planning at the state level. The UGC cannot channelize funds through the state government or through
any entity other than an educational institution, and the growing number of institutes in the country has made it
extremely difficult for the UGC to effectively plan, manage and monitor fund disbursements. Planning at the state
level is further hampered by the fact the UGC does not provide funds for setting up new institutes. These factors
result in ineffective planning for the development of higher education and to address issues at a state level.
• Affiliations and lack of autonomy - Without access to adequate funds, affiliated institutions have become an
alternative source of finances for universities, through their affiliation fees. However, the increasing numbers of
affiliated institutions has also had a negative impact in terms of quality of education as well as added administrative
burden for universities. It has also resulted in reduced autonomy of affiliated institutions with respect to aspects
such as teaching, curriculum development and research.
Since the state higher education institutions account for a significant share of the total enrolments in higher education in India (94% of enrolments in Government institutions and a majority of such enrolments in private institutions21), attaining the targets for reforming higher education in India would necessitate significant measures to develop the state higher education institutions.
In this context, the need for a new framework aimed at reforming the state higher education institutions was felt, which would address some of these key constraints relating to financing, regulation and governance and which would allow for a more planned and coherent approach for the development of higher education at the state level. The efforts towards the development of the primary and, more recently, the secondary education sector provided by the Sarva Shiksha Abhiyan (SSA) and Rashtriya Madhyamik Shiksha Abhiyan (RMSA) programmes also provided support for a similar initiative in higher education to address its requirements through a mission mode programme.
These factors led to the launch of the RUSA, a new centrally sponsored scheme for higher education which will focus on state higher educational institutions and be spread over the 12th and 13th Five Year Plan periods. The following sections highlight the objectives and key features of RUSA and how it attempts to address some of the challenges facing higher education in India, and state higher education systems, in particular.
Objectives of RUSA
RUSA aims to improve access, equity and quality in higher education through planned development of higher education at the state level. Through RUSA, it is proposed to improve the GER from 19% at present to 32% by 2022, while incentivizing states to increase Plan investments in higher education. Key objectives of RUSA include the following:
Aid reforms in state higher education system by creating a facilitating institutional structure for planning and monitoring at state level, promoting autonomy in state universities and improving governance.
Improve the overall quality of existing state institutions by ensuring that all institutions conform to prescribed norms and standards and adopt accreditation as a mandatory quality assurance framework.
Expand the institutional base by creating additional capacity in existing institutions and establishing new institutions, to achieve enrolment targets.
21 Rashtriya Uchchatar Shiksha Abhiyan (RUSA) - National Higher Education Mission document, MHRD, Sept 2013.

23 Status of Higher Education in Southern Region 2013
Correct regional imbalances in access to higher education through setting up of higher education institutions in un-served and underserved areas.
Improve equity in higher education by providing adequate opportunities to socially deprived communities; promote inclusion of women, minorities, SC/ST, OBCs and differently abled persons.
Ensure adequate availability of quality faculty in all higher educational institutions and ensure capacity building at all levels.
Create an enabling atmosphere in higher educational institutions to devote themselves to research and innovation.
Create opportunities for states to undertake reforms in the affiliating system in order to ensure that the reforms and resource requirements of affiliated colleges are adequately met.
Ensure academic and examination reforms in the higher educational institutions.
Key Features of RUSA
• Scope - RUSA is an umbrella scheme to be operated in mission mode that would subsume other existing similar
schemes in the sector. It will support all state universities and colleges (both 12B and 2(f) and non-12B and non-
2(f)) from all states and Union Territories (UTs) across the country.
• Institutional structure – The institutional structure for RUSA comprises of institutions at the national, state and
institutional levels.
- At the national level, there are four bodies - the RUSA Mission Authority, Project Approval Board,
Technical Support Group and the Project Directorate (in MHRD) - for overall guidance, policy decisions and project management, coordination and implementation.
- At the state level, the key entity would be the State Higher Education Council (SHEC), to be supported by
the Project Directorate (in the State Government) and Technical Support Group for management, coordination, implementation and monitoring of the project at the state/UT levels.
- At the institutional level, the Board of Governors (BoG) and a Project Monitoring Unit would be the main institutional structures for RUSA
• State Plans for Higher Education – One of the key functions of the State Higher Education Councils will be to
develop State Higher Education Plans. These include longer term Perspective Plans as well Annual Plans. The
plans would be each state’s strategy to address issues of equity, access and excellence in higher education. They
would be based on aggregated institutional plans as well as a superlayer of state component.
• Basis of Funding - Funds would be provided both for infrastructure as well as for quality improvement. All funding
under RUSA would be norm based and future grants would be outcome dependent. The funding to states would be
based on appraisals of State Higher Education Plans, and performance in key result areas (access, equity and
excellence) in relation to norms set by the plans.
• Funding pattern - The central funding would flow from MHRD to institutions, through SHEC. SHECs will be the
key institutions at the state level to channelize resources to the institutions. Centre-State funding will be in the ratio
of 90:10 for North-Eastern States, J&K, Sikkim, Himachal Pradesh and Uttarakhand and 65:35 for other states and
Union Territories. Funding will be available to even private-aided institutions, for permitted activities based on
certain norms and parameters, in a ratio of 50:50.
• Pre-requisites - Certain academic, administrative and governance reforms will be a precondition for receiving
funding under RUSA. The prerequisites are at two levels, commitment given by states to the central government
and commitments given by institutions to states. Unless these commitments are fulfilled, the states and institutions
will not be able to avail of grants under RUSA.

24 Status of Higher Education in Southern Region 2013
• Sector Reforms - Reforms in the areas of governance of universities, academic and examination reforms and
affiliation system of state universities are other important components of the scheme. These include limiting the
number of colleges that can be affiliated to a university and provision of more autonomy to universities.
• Monitoring – The three-tier institutional structure at the national, state and institution levels would facilitate the
monitoring of RUSA at the respective levels. Government of India will conduct annual reviews of the project, based
on action plans prepared by each project institution and achievements made on a set of norms defined in the
institutional plans. A Management Information System will also be established for the purpose of monitoring and
evaluation.
Accreditation – Adoption of accreditation as a mandatory quality assurance framework. Funding under RUSA
would be contingent upon accreditation.
How is RUSA different?
The launch of RUSA will introduce a significant shift in the approach towards development of higher education in India, with the emphasis on reforming state higher education systems. The key difference with the introduction of RUSA is with respect to funding higher education in state universities, which have been receiving a disproportionately small share of central government funds in relation to central government institutions. Additionally, funding will now be performance-based funding, incentivizing well performing institutions and decision making through clearly defined norms.
Some of the key provisions of RUSA which seek to address the issues under the current higher education system across various aspects are highlighted in the following table.
Component Issues under current system RUSA provisions
Scope • UGC funding only to institutes compliant under sections 12B and 2(f) of UGC Act
• Funding to Non 12B and 2(f) institutions included under scope of RUSA
Funding Mechanism
• Direct funding by Centre and UGC to higher education institutions.
• Ad-hoc nature of funding
• Stagnant or declining Plan and non-Plan support from the states
• Funding through State Councils to facilitate holistic planning
• Norm-based and performance based funding
• State Govts. to commit at least 2% of GSDP for higher education within 3 years
Planning • Ineffective planning at the state level for higher education since funding is directly to institutions and UGC is unable to fund creation of new institutes
• Creation of State Higher Education Councils to plan and monitor higher education in a state
• Preparation of State Higher Education Plans with funding linked to achievements
Access • GER in higher education is only 19.4%
• Need to increase access to higher education to achieve target GER of 32% by 2022.
• Focus on consolidating and developing the existing system to add capacity
• Expansion of distance learning programmes and improvements in usage of ICT
Equity • Need to provide more equitable access to higher education for marginalized groups and communities
• Integration of various equity related schemes for higher impact
• Model colleges in each district
Faculty • Acute faculty shortages (~40%) with ban on faculty recruitment in some states
• States not recruiting faculty in adequate numbers due to financial constraints
• States to ensure that faculty positions are filled a phase-wise manner
• Not more than 15% of the faculty positions can remain vacant at any time in the State
• Support for faculty recruitment
Academic and examination processes
• Lack of flexibility in higher education
• Examination centered approach towards
• Curriculum revisions not consistent across disciplines and in periodicity
• Admission processes are often ad-hoc and lack transparency
• Introduction of Semester system and choice-based credit system (CBCS)
• Reforms of curriculum development and admission procedures
• Examination Reforms - Continuous and End of Semester evaluations

25 Status of Higher Education in Southern Region 2013
Component Issues under current system RUSA provisions
Infrastructure • Poor infrastructure and facilities, particularly in state institutes
• Infrastructure upgradation of existing institutions with focus on quality and equity
Research and Innovation
• Insufficient funding and focus on research
• Limited research output in Indian higher educational institutions
• Provision of research and innovation grants/funds
• Support for state endeavors to create Research Universities
Administration/ Governance
• Weak quality assurance mechanisms, with financial planning and allocation not linked to performance.
• Lack of autonomy for universities from state and central governments
• Administrative burden for universities due to affiliation system
• Reforms at sectoral (state) level and institutional level including Accountability Framework for universities
• Provision for greater academic, financial and administrative autonomy for universities
• Limit on colleges affiliated to a university and creation of College Cluster Universities
Accreditation • Few recognized accreditation agencies
• Limited numbers of accredited colleges (15%) and universities (31%)
• Creation of state level accreditation agencies
• Requirement of mandatory accreditation for higher education institutions
Monitoring • Ineffective monitoring and evaluation mechanisms
• Three-tier institutional structure to monitor progress and implementation of reforms
• All institutions to be linked to a web-based Management Information System (MIS)
Leadership development
• Need for quality leadership and requisite governance structures
• Development of current and future leadership capabilities at various levels of university administration
Role of private sector
• Lack of clear framework for private sector participation in higher education
• Concerns over commercialization of higher education by private sector
• Establishment of appropriate regulatory framework to set quality standards
• Creation of enabling conditions to attract investments - aim to mobilize 50% of the state contribution through private participation
How can key stakeholders benefit?
In order to benefit from RUSA, key stakeholders at the state and institution levels must comply with certain pre-requisites. The central government has already initiated the process for implementation of RUSA by asking the state governments to make a prior commitment in writing that they will fulfill the scheme pre-requisites. The pre-requisites at the state and institution level include the following:
State level pre-requisites Institutional level pre-requisites
• Formation of State Higher Education Council
• Preparation of State Perspective Plans and Annual Plans
• State funding commitment – share and timeliness
• Agreement to create separate fund for RUSA
• Filling faculty positions
• Affiliation reforms
• Governance/administrative reforms
• Academic and examination reforms
• Commitment to institutional governance and administrative reforms
• Commitment to affiliation reforms
• Commitment to academic and examination reforms
• Creation of separate project management teams for RUSA
• Preparation of institution level perspective plans
• Equity related commitments
• Commitments on research and innovation efforts
• Mandatory faculty recruitment and improvement
• Regulatory compliance

26 Status of Higher Education in Southern Region 2013
Conclusion
RUSA represents a key milestone in the history of higher education in India. It introduces a significant strategic shift in the approach towards developing the higher education system in the country, by focusing on state level institutions which have been neglected over the years in relation to centrally funded institutions. It also seeks to introduce measures such as performance and norm based funding as well as governance and academic reforms at the institutional and state levels to address some of the challenges in higher education today.
However, the success of the scheme will depend on whether it can be managed and executed effectively. What is apparent is that if this is achieved, RUSA could well become a turning point for the Indian higher education system as it seeks to achieve higher enrolment rates and address access, equity and quality related concerns.

27 Status of Higher Education in Southern Region 2013
Part II Overview of Higher Education in Southern Region
Note: The data in this chapter has been taken from All India Survey of Higher Education, 20001-11, MHRD unless otherwise stated. The latest UGC data used in Chapter I does not have detailed information on certain parameters presented in this chapter.

28 Status of Higher Education in Southern Region 2013
India
Key Indicators
Table 1: Key Indicators – India
Indicator Total Male Female
Total Population, Crores (2011) 121.1 62.3 58.7
Literacy Rate (2011) 74.0% 82.1% 65.5%
Pop. in 18-23 age group (lakhs), 2011 Share to total pop. (%)
14.03 (11.6%)
7.3 (11.8%)
6.7 (11.4%)
Sex ratio (2011) 940
Gross Enrollment Ratio in Higher Education (2011) 19.4 20.8 17.9
Source: Census 2011; All India Survey of Higher Education, MHRD 2011; Status of Education & Vocational Training in India, NSSO 66th Round, 2010
Education Infrastructure
Universities by Type: The break-up of number of universities in the country on the basis of type of university is shown below. There are a total of 621 universities (as of 2010-11) across the country, with state public universities constituting the highest share (45.2%). The top five states with the highest number of uni versities include Tamil Nadu (59, 9.5% of total in India), Uttar Pradesh (56, 9.0%), Andhra Pradesh (46, 7.4%), Maharashtra (44, 7.1%), and Rajasthan (43, 6.9%) .
The break-up of the universities by type indicates variance between the top five states as follows: While Tamil Nadu is ranked first in India in terms of private deemed universities (28, 47.5% of total universities in the state), state public universities comprised the biggest share of universities in A.P (30, 65.2%), U.P. (23, 41.1%), and Maharashtra (18, 40.9%). In Rajasthan, state private universities comprised the highest share of universities (17, 39.5%).
Universities by Specialization: Figure 2 below reflects the break-up of number of universities in India on the basis of specialization. The country is reported to have 300 general universities (54.2% of total), 80 technical universities (16.1%), 80 other universities (14.4%), 34 agricultural universities (6.1%), 25 medical universities (4.5%), 17 law universities (3.1%) and 9 veterinary universities (1.6%).
13
40
41
59
87
91
281
0 50 100 150 200 250 300
State Open University
Govt. Deemed University
Central University
Institution of National Importance
State Private University
Private Deemed University
State Public University
Figure 1: Universities by Type - India

29 Status of Higher Education in Southern Region 2013
Tamil Nadu has the highest number of general univer sities (29) and technical universities (14 ). Maharashtra (4) has the highest number of agricultural universities, while Karnataka (6) and Maharashtra (6) have the highest number of medical universities. Andhra Pradesh (2), Delhi (2) and Karnataka (2) have the highest number of law universities while Uttar Pradesh (2) has the highest number of veterinary universities. The three southern states of Tamil Nadu, Andhra Pradesh and Karnataka accounted for 36% of medical universities, 33.3% of veterinary universities, 29.4% of law universities, 26.3% of other universities, 25.8% of technical universities and 25.3% of general universities in India.
Table 2: College & Institution Indicators - India
Colleges and Institutions: India has a total of 32,974 colleges ((as of 2010-11) with Andhra Pradesh ranking first (4780, 14.5% of total colleges) , followed by Maharashtra (4512, 3.7%), Uttar Pradesh (4049, 12.3%), Karnataka (3098, 9.4%) and Rajasthan (2435, 7.4%).
The average enrolment per college in India is 700, with Jharkhand (2376) reported to have the highest avera ge enrolment in colleges among all states, followed by Arunachal Pradesh (1943), Manipur (1796) , Bihar (1794) and West Bengal (1655) . Total enrolment of students in regular mode in higher education institutes in India is around 241.8 lakhs.
Table 3: Colleges per lakh pop – Top 5 States/UTs
In terms of access, India has 23 colleges per lakh population (aged 18-23 years), with Puducherry estimated to have 54 colleges per lakh population, followed by Andhra Pradesh (48), Karnataka (44), Himachal Pradesh (38 ), Maharashtra (35).
Indicator Colleges Stand-alone Institutions
Total No. of colleges/ institutions 32974 11139
Colleges per lakh population (18-23 yrs) 23 -
Average enrollment per college/ institution
700 286
Total estimated enrolment (Lakhs) 241.8 31.8
State/Union Territory
Colleges per lakh pop
Puducherry 54
Andhra Pradesh 48
Karnataka 44
Himachal Pradesh 38
Maharashtra 35
9
17
25
34
80
89
300
0 50 100 150 200 250 300 350
Veterinary
Law
Medical
Agriculture
Others
Technical
General
Figure 2: Universities by Specialization - India

30 Status of Higher Education in Southern Region 2013
Out of the total colleges in the country, 89% are affiliated to Universities, and the remaining are constituent/university colleges, PG/off campus or recognized centres by the Universities.
Figure 3: Type of Colleges – India
Stand-alone Institutions are those that are outside the purview of the University & College and they require
recognition from one or other Statutory Bodies. These include Polytechnics, PGDM, Nursing, Teacher Training, CA, CS etc. In India, there are 11,139 such stand-alone institutions and the total enrolment in these is estimated to be around 31.8 lakhs. Maharashtra has the highest number of such institutions in the country (2640).
Student Enrolment
Total enrolment of students in regular mode in higher education institutes in India is around 241.8 lakhs, with 55.7% male and 44.2% female enrolments. With a huge population base (highest share of 18-23 population in India, 16.9%), Uttar Pradesh ranked first in terms of enrolment (37.7 lakhs, 15.6%); followed by Maharashtra (32.2 lakhs, 13.4%), Andhra Pradesh (23.7 lakhs, 9.8%), Tamil Nadu (18 lakhs, 7.4%) and Karnataka (16.1 lakhs, 6.6%). The three southern states of Andhra Pradesh, Tamil Nadu and Karnataka accounted for approximately one-third (33.8%) of the total enrolments across India.
By Level: The Enrolment through Regular Mode at various levels is 2.4 crores in India. Break-up across various levels and split by gender is given in the figure / table below. As can be inferred, the highest share of enrolment (82.9%) is at under-graduate level, followed by post-graduate (8.7%) and Diploma (7.0%), with all other levels forming only 1.4%. As can be seen from table above, maximum enrolment share (39.2%) is in government colleges in the country.
By Stream: The total enrolment at under graduate level for the top ten streams (in terms of enrolment) is presented in the figure below. Arts/Humanities/Social Sciences tops the list with 40.3% enrolment, followed by Engineering & Technology (13.7%). It is interesting to note that female share of enrolment (48.0%, as a % of total female enrolment) in arts/humanities/social sciences is higher than the male share (34.8%, as a % of total male enrolment) while the male share of enrolment (16.6%) in engineering & technology is much higher than the female share of enrolment (9.5%).
Ph.D. M.Phil Post Graduate UnderGraduate
PG Diploma Diploma Certificate Integrated
Female 29834 12522 986570 9080748 32542 483560 59174 20638
Male 47964 12579 1117764 10970156 47625 1206937 42651 34031
0%
10%
20%
30%
40%
50%
60%
70%
80%
90%
100%
Figure 4: Enrolment through Regular Mode a t various levels - India
89%
6%
4%1%
Types of Colleges
Affiliated College
Recognized Centre
Constituent / UniversityCollegePG / Off-CampusCentre

31 Status of Higher Education in Southern Region 2013
Marine Sciences/Oceanography courses had the least enrolment (77 seats).
Foreign Students: The total number of foreign students is estimated at 27,531 in India with Karnataka (10,103) attracting the highest share , followed by Andhra Pradesh(4698), Maharashtra (4369), Tamil Nadu (2383) and Delhi (1529).
By Gender: In terms of gender, enrolment is skewed as 55.7% comprises males, while only 44.3% of the enrolment is females, indicating significant gender disparity.
The GER for males (20.8) is higher than GER for females (17.9), resulting in the Gender Parity Index (GPI) of 0.86. In terms of overall GER, Chandigarh ranks first (41.4) with highest male (42 .2) and female (40.4) GER as well.
Figure 6: GER for All, SC & ST - India
Table 4: GER – Top 5 states/UTs
GER Indicator
Rank 1 Rank 2 Rank 3 Rank 4 Rank 5 Total
Total Chandigarh (41.4)
Manipur (35.9)
Goa
(33.2)
Tamil Nadu (32.9)
Delhi
(32.5)
India
(19.4)
20.8
14.6
12.9
17.9
12.3
9.5
19.4
13.5
11.
2
0
5
10
15
20
25
All SC ST
Male
Female
Total
Arts/Humanities/
SocialSciences
Engineering&
TechnologyCommerce Science
ElectronicEngineering
ComputerEngineering
ComputerScience/Com
puterapplications
MedicalSciences
MechanicalEngineering
Female 3129519 621090 763135 682568 192873 195538 147012 201623 20766
Male 3172697 1518401 1068429 785058 349605 280332 254262 175250 335360
0%
10%
20%
30%
40%
50%
60%
70%
80%
90%
100%
Figure 5: Enrolment at Under Graduate Level, by top ten str eams - India

32 Status of Higher Education in Southern Region 2013
By Social Group: The GER of SCs (13.5) and STs (11.2) is lower than the average national GER of 19.4. Arunachal Pradesh, Mizoram and Manipur have the highest GER for SCs (100) and Goa and UP for STs (100). Further, there is disparity within the social groups between male and female GER.
The Gender Parity Index (GPI) for SC is 0.84 and that for STs is 0.74. Daman & Diu has the highest GPI for SCs (2.07) and Andaman & Nicobar Islands the highest GPI for STs (2.01). As can be seen from table 6 below on Gender and Social representation, the share of student enrolment across all backward groups in India is lesser than their proportionate share in population. OBCs had the highest share of enrolments (27.6%), followed by SCs (11.1%), Muslims (6%), STs (4.4%), and other minorities (2.9%) following the trend of respective population shares of each group in the total population.
Faculty and Staff
Table 5: Key Faculty & Staff Indicators - India
The PTR of colleges in India is 15.1. Dadra & Nagar Haveli (5.1) ranks first with the low est PTR, followed by Daman & Diu (5.3), Chandigarh (6.1), Tamil Nadu (7. 0), and Punjab (7.6). It is important to note although Dadra & Nagar Haveli and Daman & Diu rank the highest, each accounted for less than 1% of the total enrolments in higher education (regular mode). Tamil Nadu performs well in this regard being ranked fourth in India even in terms of enrolments (7.4% of total). On the other hand, Uttar Pradesh had the highest PTR at 40.0, and is notably the state with the largest enrolment in higher education (15.6% of total)
Maharashtra had the highest estimated number of teaching and non-teaching staff in all colleges, 2.6 lakhs and 2.3 lakhs respectively. The number of teachers per college is 46.4 and non-teaching staff per college is 34.3 in India, with Arunachal Pradesh ranked first with 218.7 teachers per college and Chandigarh with 266.1 non-teaching staff per college.
In terms of the post-wise share of teaching staff, the figure 7 provides the break-up in India. 62% of the teaching posts are at level of Lecturer/ Assistant professor . Around 13% of the staff are Readers & Associate Professors, while 12% are professors & equivalent. Temporary teachers comprise 8% of total teaching staff.
By Social Group: In terms of representation of various social groups and gender in the teaching and non-teaching staff, the table below provides the relative comparison with the population. It reveals that females are significantly under-represented among the faculty and staff in hi gher education institutes as compared to males . In case of social groups also, all the groups shown in the table 6 indicate a deficit in terms of representation in both faculty and staff in higher educational institutions as compared to their share of population in the state.
Male Chandigarh (42.2)
Manipur (38.5)
Tamil Nadu (36.5)
Delhi
(35)
Arunachal Pradesh (33.6)
India
(20.8)
Female Chandigarh (40.4)
Goa
(35.8)
Manipur (33.3)
Puducherry (29.9)
Delhi
(29.8)
India
(17.9)
Key Indicators INDIA
Pupil Teacher Ratio (PTR) 15.1
Teachers per College 46.4
Non-teaching staff per College 37.3
62%8%
13%
12%
5%Lecturer / Assistant Professor
Temporary Teacher
Reader & Associate Professor
Professor & Equivalent
Demonstrator / Tutor
Figure 7: Post-wise share of teaching staff - India

33 Status of Higher Education in Southern Region 2013
Table 6: Student, Faculty and Staff - Gender and So cial representation - India
Indicator Male Female SC ST OBC Muslim Other Minority
Share of Population 51.5% 48.5% 19.9% 8.6% 42.3% 12.9% 4.7%
Share of Enrolment 56.2% 43.8% 11.1% 4.4% 27.6% 6.0% 2.9%
Share of teaching staff 62.7% 37.3% 6.9% 2.2% 21.3% 2.9% 3.2%
Share of non-teaching staff
75.1% 24.9% 12.1% 3.7% 23.7% 2.4% 2.5%
Source: Share of population - Census 2011 & India Human Development Report 2011; Calculations of teaching and non-teaching staff using data from All India Survey of Higher Education, MHRD 2011;

34 Status of Higher Education in Southern Region 2013
Andhra Pradesh (AP)
Key Indicators
Table 4: Key Indicators – AP
Indicator Total Male Female
Total State Population, Lakhs (2011) 845.8 424.4 421.4
Literacy Rate (2011) 67.0 % 74.9 % 58.7 %
Pop. in 18-23 age group (lakhs), 2011 Share to total state pop. (%)
100.3 (11.9%)
50.4 (11.9%)
49.9 (11.8%)
Share of state 18-23 pop. to All-India 18-23 pop. ( 2011) 7.1% 6.9% 7.4%
Sex ratio (2011) 993
Gross Enrollment Ratio (2011) 28.4 32.1 24.4
Share of Graduates & above in total state populatio n (2010)
7.7% 10.4% 4.9%
Source: Census 2011; All India Survey of Higher Education, MHRD 2011; Status of Education & Vocational Training in India, NSSO 66th Round, 2010
Education Infrastructure
The break-up of number of universities in the state on the basis of type of University is shown below. Andhra Pradesh ranks third highest among all states in India with 46 Universities after Tamil Nadu (59) and Uttar Pradesh (56) on total of number of Universities. The state also ranks first on number of State public universities with 30 Universities. AP has 7.4% of all Universities in the country.
Figure 8: Universities by Type - AP
Figure 9: Universities by Specialization - AP
1
1
2
2
2
3
5
30
0 5 10 15 20 25 30
Others
State Open University
Institution of National Importance
Institution Established Under State Legislature Act
Government Deemed University
Central University
Private Deemed University
State Public University
1
2
2
2
6
6
26
0 5 10 15 20 25 30
Veterinary
Medical
Law
Agriculture
Others
Technical
General

35 Status of Higher Education in Southern Region 2013
Figure 2 above reflects the break-up of number of universities in AP on the basis of specialization. Andhra Pradesh ranks second with 45 Universities in total (not counting “Others” above). The state also ranks third highest on number of General Universities with 26 Universities following Tamil Nadu (29) and Uttar Pradesh (27).
Table 5: College & Institution Indicators - AP
AP with 4,780 colleges has a share of 14.5% of all colleges in India and ranks #1 in terms of total colleges in any state in India . In terms of access, AP has the highest concentration among all major states with 48 colleges per lakh population as compared to the all India average of 23 colleges per lakh population. In terms of average enrolment per college, AP (493) is significantly lesser than all India average of 700 . Total enrolment of students in regular mode in higher education institutes in AP is around 23.76 lakhs.
Out of the total colleges in the state, 96% are affiliated to Universities, and the remaining are constituent/university colleges, PG/off campus or recognized centres by the Universities. In terms of management, AP colleges are dominated by the Private Unaided colleges, forming 81% of all colleges in the state, followed by 12% owned by Government and 7% that are private aided.
Figure 10: Type of Colleges – AP
Table 6: Management of Colleges - AP
Type of Management Share of colleges Share of enrolments Avg enrolment / college
Private Aided 7.2% 10.5% 715
Private Unaided 80.8% 75.7% 462
Government 12.0% 13.8% 566
* Calculations in above table is based on the number of responses as given in the AISHE 2010-11 survey
Stand-alone Institutions: In AP, there are 599 such stand-alone institutions and the total enrolment in these is estimated to be around 1.8 lakhs.
Indicator Colleges Stand-alone Institutions
Total No. of colleges/ institutions 4780 599
Colleges per lakh population (18-23 yrs) 48 -
Average enrollment per college/ institution 493 300
Total estimated enrolment (Lakhs) 23.76 1.80
96%
2%
1%1%
Types of Colleges
Affiliated College
Constituent / UniversityCollege
PG / Off-Campus Centre
Recognized Centre

36 Status of Higher Education in Southern Region 2013
Student Enrolment
By Level: The state-wise enrolment through regular mode at various levels is 23.76 lakhs. Break-up across various levels and split by gender is given in the figure / table below. As can be inferred, the highest share of enrolment (78.9%) is at under-graduate level, followed by post-graduate (16.3%) and Diploma (3.9%), with all other levels forming only 0.9%. As can be seen from table above, maximum enrolment share (75.7%) is in private unaided colleges in the state.
Figure 11: State ‐‐‐‐wise Enrolment through Regular Mode at various leve ls - AP
Foreign Students: Andhra Pradesh is reported to have around 4,700 foreign students, which constitutes around 17.1% of total foreign students studying in India. It is second only to Karnataka in attracting students from overseas .
By Gender: In terms of gender, enrolment is skewed as 58.2% comprises males, while only 41.8% of the enrolment constitutes females, indicating significant gender disparity. The GER for males (32.1) is much higher than GER for females (24.4), resulting in the gender parity index of just 0.76 (which is lower as compared to 0.86 at all-India level). In terms of overall GER, AP ranks 2 nd amongst all major states in India.
By Social Group: The GER of SCs (25.9) and STs (23.8) is lower than the state GER of 28.4. Further, there is disparity within the social groups between male and female GER. The gender parity Index for SC is 0.74, but it is much lower in case of STs (0.53). As can be seen from Table 5 below on Gender and Social representation, the share of student enrolment across all backward groups in AP is lesser than their proportionate share in population.
Figure 12: GER for All, SC & ST - AP
Ph.D. M.Phil Post Graduate UnderGraduate
PG Diploma Diploma Certificate Integrated
Female 2777 815 189704 926149 1397 48150 1905 2402
Male 5435 1463 269000 1288425 3074 60576 1245 3850
0%
10%
20%
30%
40%
50%
60%
70%
80%
90%
100%
32.1
29.8 31
.5
24.4
21.
9
16.8
28.4
25.9
23.8
0
5
10
15
20
25
30
35
All SC ST
Male
Female
Total

37 Status of Higher Education in Southern Region 2013
Faculty and Staff
Table 7: Key Faculty & Staff Indicators - AP
Figure 13: Post-wise share of teaching staff - AP
The PTR of colleges in AP at 12.4 students per teacher is better than the all-India average of 15.1. Total number of teaching staff and non-teaching staff in all colleges in AP is estimated to be 1.9 lakhs and 1.12 lakhs, respectively (extrapolating data available for 75.5% colleges in state). However, given the large number of colleges in the state, the number of teachers per college (39.6) and non-teaching staff per college (23.5) are lesser than the corresponding all-India levels as shown in Table 4.
In terms of the post-wise share of teaching staff, the figure 6 provides the break-up in the state. 69% of the teaching posts are at level of Lecturer/ Assistant professor with there being almost equal numbers of Readers/ Associate Professors and Professors. Around 5% of the staff is temporary.
In terms of representation of various social groups and gender in the teaching and non-teaching staff, Table 5 provides the relative comparison with the state population. It reveals that females are significantly under-represented among the faculty and staff in higher education institutes as compared to males. In case of social groups also, all the groups shown in the table indicate a deficit in terms of representation in both faculty and staff in higher educational institutions as compared to their share of population in the state.
Table 8: Student, Faculty and Staff - Gender and So cial representation - AP
Indicator Male Female SC ST OBC Muslim Other Minority
Share of Population 50.2% 49.8% 19.8% 7.1% 48.4% 7.7% 1.6%
Share of Enrolment 58.2% 41.8% 14.5% 5.0% 37.2% 6.6% 1.2%
Share of teaching staff 64.4% 35.6% 10.1% 2.3% 25.5% 3.8% 1.3%
Share of non-teaching staff 67.6% 32.4% 15.0% 3.4% 29.1% 4.0% 1.1% Source: Share of population - Census 2011 & India Human Development Report 2011; Calculations of teaching and non-teaching staff using data from All India Survey of Higher Education, MHRD 2011;
Key Indicators AP INDIA
Pupil Teacher Ratio (PTR) 12.4 15.1
Teachers per College 39.6 46.4
Non-teaching staff per College 23.5 37.3 Calculation is based on the total number of responses as given in the AISHE 2010-11 survey
11%
12%
69%
3%5%
Professor & Equivalent
Reader & Associate Professor
Lecturer / Assistant Professor
Demonstrator / Tutor
Temporary Teacher

38 Status of Higher Education in Southern Region 2013
Karnataka (KTK)
Key Indicators
Table 9: Key Indicators – KTK
Indicator Total Male Female
Total State Population, Lakhs (2011) 611.0 309.7 301.3
Literacy Rate (2011) 75.4 82.5 66.0
Pop. in 18-23 age group (lakhs), 2011 Share to total state pop. (%)
74.0 (12.1%)
38.1 (12.3%)
35.9 (11.9%)
Share of state 18-23 pop. to All-India 18-23 pop. (2011) 5.3% 5.2% 5.4%
Sex ratio (2011) 973
Gross Enrollment Ratio (2011) 25.5 25.5 25.5
Share of Graduates & above in total state population (2010) 7.9 10.3 5.4
Source: Census 2011; All India Survey of Higher Education, MHRD 2011; Status of Education & Vocational Training in India, NSSO 66th Round, 2010
Education Infrastructure
The break-up of number of universities in the state on the basis of type of University is shown below. Karnataka ranks 5th highest among all states and Union Territories in India on total of number of Universities with 43 Universities. The state also ranks 2nd on number of State Public Universities with 23 Universities and 3rd on Deemed Universities with 11 Universities. KTK has 6.9% of all Universities in the country.
Figure 14: Universities by Type - KTK
1
1
1
2
4
11
23
0 5 10 15 20 25 30
State Open University
Central University
Institution of National Importance
State Private University
Government Deemed University
Private Deemed University
State Public University

39 Status of Higher Education in Southern Region 2013
Figure 15: Universities by Specialization - KTK
Figure 2 reflects the break-up of number of universities in Karnataka on the basis of specialization. KTK has the highest number of Medical Universities (6 Universities). It also ranks 5th highest on number of General Universities (21).
Table 10: College & Institution Indicators - KTK
KTK with 3098 colleges has a share of 9.4% of all colleges in India and ranks #4 in terms of total colleges in any state in India . In terms of access, KTK has the 2nd highest concentration of 44 colleges per lakh population as compared to the all India average of 23 colleges per lakh population. In terms of average enrolment per college, KTK (414) is lesser than all India average of 700 . Total enrolment of students in regular mode in higher education institutes in KTK is around 16.06 lakhs.
Out of the total colleges in the state, 90% are affiliated to Universities, and the remaining are constituent/university colleges, PG/off campus or recognized centres by the Universities. In terms of management, KTK colleges are dominated by Private Unaided colleges, forming 66.3% of all colleges in the state, followed by 20% owned by Government and 13.5% that are private aided.
Figure 16: Type of Colleges – KTK
Indicator Colleges Stand-alone Institutions
Total No. of colleges/ institutions 3098 1922
Colleges per lakh population (18-23 yrs) 44 -
Average enrollment per college/ institution 414 172
Total estimated enrolment (Lakhs) 16.06 3.31
1
2
3
3
6
7
21
0 5 10 15 20 25
Veterinary
Law
Agriculture
Technical
Medical
Others
General
90%
5%
3%2%
Types of Colleges
Affiliated College
Recognized Centre
Constituent / University College
PG / Off-Campus Centre

40 Status of Higher Education in Southern Region 2013
Table 11: Management of Colleges - KTK
Type of Management Share of colleges Share of enrolments Avg enrolment / college
Private Aided 13.5% 25.1% 770
Private Unaided 66.3% 46.4% 290
Government 20.0% 28.5% 584
* Calculations in above table is based on the number of responses as given in the AISHE 2010-11 survey
Stand-alone Institutions: In KTK, there are 1922 such stand-alone institutions and the total enrolment in these is estimated to be around 3.31 lakhs.
Student Enrolment
By Level : The state-wise Enrolment through Regular Mode at various levels is 16.06 Lakhs. Break-up across various levels and split by gender is given in the figure / table below. As can be inferred, the highest share of enrolment (73.1%) is at under-graduate level, followed by Diploma (13.8%) and post-graduate (11.7%), with all other levels forming only 1.4%. As can be seen from table above, maximum enrolment share (46.4%) is in Private Unaided colleges in the state.
Figure 17: State ‐‐‐‐wise Enrolment through Regular Mode at various leve ls - KTK
Foreign Students: Karnataka is reported to have around 10,100 foreign students, which constitutes around 36.7% of total foreign students studying in India. It is the leading state in attracting students from overseas followed by Andhra Pradesh which attracts only 4700 students (17.06%).
Figure 18: GER for All, SC & ST - KTK
Ph.D. M.Phil Post GraduateUnder
GraduatePG Diploma Diploma Certificate Integrated
Female 2621 491 93054 618497 3137 104549 3829 1532
Male 5317 505 116459 692571 3871 142830 1796 1984
0%
10%
20%
30%
40%
50%
60%
70%
80%
90%
100%

41 Status of Higher Education in Southern Region 2013
By Gender: In terms of gender, enrolment is skewed as 53.8% comprises males, while only 46.2% of the enrolment is females, indicating gender disparity. The GER for males (26.6) is higher than GER for females (24.3), resulting in the gender parity index of 0.92 (which is higher as compared to 0.86 at all-India level). In terms of overall GER, KTK ranks 4 th among all major states in India.
By Social Group: The GER of SCs (19.8) and STs (18) is lower than the state GER of 25.5. As can be seen from table 5 below on Gender and Social representation, the share of student enrolment across all backward groups except other minorities in KTK is lesser than their proportionate share in population.
Faculty and Staff
Table 12: Key Faculty & Staff Indicators - KTK
The PTR of colleges in KTK at 9.7 students per teacher is better than the all India average of 15.1. Total number of teaching staff and non-teaching staff in all colleg es in KTK is estimated to be 1.32 lakhs and 0.95 la khs, respectively (extrapolating data available for 91.8% colleges in state). However, given the large number of colleges in the state, the number of teachers per college (42.5) and non-teaching staff per college (30.5) are lesser than the corresponding all–India levels as shown in table 4.
In terms of the post-wise share of teaching staff, the figure 6 provides the break-up in the state. 53% of the teaching posts are at level of Lecturer/ Assistant professor followed by 16% Professors and almost equal numbers of Readers/ Associate Professors, temporary teachers and Demonstrator /Tutor Level.
Figure 19: Post-wise share of teaching staff - KTK
In terms of representation of various social groups and gender in the teaching and non-teaching staff, the table 5 below
Key Indicators KTK INDIA
Pupil Teacher Ratio (PTR) 9.7 15.1
Teachers per College 42.5 46.4
Non-teaching staff per College 30.5 37.3 Calculation is based on the total number of responses as given in the AISHE 2010-11 survey
26.6
21.2
19.5
24.3
18.3
16.3
25.5
19.8
18
0
5
10
15
20
25
30
All SC ST
Male
Female
Total
53%
16%
12%
10%
9%Lecturer / Assistant Professor
Professor & Equivalent
Reader & Associate Professor
Demonstrator / Tutor
Temporary Teacher

42 Status of Higher Education in Southern Region 2013
provides the relative comparison with the state population. It reveals that females are under-represented among the faculty and staff in higher education institutes as compared to males. In case of social groups also groups shown in the table, except other minority, indicates a deficit in terms of representation in both faculty and staff in higher educational institutions as compared to their share of population in the state.
Table 13: Student, Faculty and Staff - Gender and S ocial representation - KTK
Indicator Male Female SC ST OBC Muslim Other Minority
Share of Population 50.7% 49.3% 18.40% 6.80% 41.10% 11.60% 2.54%
Share of Enrolment 53.8% 46.2% 12.0% 4.3% 37.1% 6.1% 3.7%
Share of teaching staff 58.8% 41.2% 6.4% 1.8% 18.9% 3.2% 4.6%
Share of non-teaching staff 65.8% 34.2% 10.4% 3.2% 22.8% 3.0% 3.6% Source: Share of population - Census 2011 & India Human Development Report 2011; Calculations of teaching and non-teaching staff using data from All India Survey of Higher Education, MHRD 2011;

43 Status of Higher Education in Southern Region 2013
Kerala (KER)
Key Indicators
Table 14: Key Indicators – KER
Indicator Total Male Female
Total State Population, Lakhs (2011) 334.1 160.3 173.8
Literacy Rate (2011) 94.0 % 96.1% 92.1% %
Pop. in 18-23 age group (lakhs), 2011 Share to total state pop. (%)
31.7 (11.9%)
15.8 (11.9%)
15.8 (11.8%)
Sex ratio (2011) 1058
Gross Enrollment Ratio (2011) 21.9 18.8 25.1
Share of Graduates & above in total state population (2010) 9.5% 9.2% 9.7%
Source: Census 2011; All India Survey of Higher Education, MHRD 2011; Status of Education & Vocational Training in India, NSSO 66th Round, 2010
Education Infrastructure
The break-up of number of universities in the state on the basis of type of University is shown alongside. Kerala ranks 17 among all states in India with 16 Universities on total of number of Universities. The state also ranks twelfth on number of State public universities with 10 Universities. Kerala has 2.6% of all Universities in the country.
Figure 20: Universities by Type - KER
Figure 21: Universities by Specialization - KER
1
2
3
10
0 5 10 15 20 25 30
Central University
Government DeemedUniversity
Institution of NationalImportance
State Public University
1
1
1
1
6
6
0 1 2 3 4 5 6 7
Veterinary
Law
Agriculture
Technical
Others
General

44 Status of Higher Education in Southern Region 2013
Figure 2 above reflects the breakup of number of universities in KER on the basis of specialization. Kerala ranks 15 with 16 Universities in total.
Table 15: College & Institution Indicators - KER
Kerala with 962 colleges has a share of 2.92% of all colleges in India and ranks #11 in terms of total colleges in any state in India . In terms of access, KER has a high concentration among states with 29 colleges per lakh population as compared to the all India average of 23 colleges per lakh population. In terms of average enrolment per college, KER (557) is significantly lesser than all India average of 700 . Total enrolment of students in regular mode in higher education institutes in KER is around 6.66 lakhs.
Out of the total colleges in the state, 88% are affiliated to Universities, and the remaining are constituent/university colleges, PG/off campus or recognized centres by the Universities. In terms of management, KER colleges are dominated by the Private colleges, forming 81% of all colleges (46.3% of total unaided and 53.7% of total aided) in the state, followed by 19.2% owned by Government.
Figure 22: Type of Colleges – KER
Table 16: Management of Colleges - KER
Type of Management Share of colleges Share of enrolments Avg enrolment / college
Private Aided 53.6% 43.4% 1011
Private Unaided 23.9% 37.4% 388
Government 22.5% 19.2% 477
* Calculations in above table is based on the number of responses as given in the AISHE 2010-11 survey
Stand-alone Institutions: There are 590 stand-alone institutions and the total enrolment in these institutions is estimated to be around 0.99 lakhs.
Indicator Colleges Stand-alone Institutions
Total No. of colleges/ institutions 962 590
Colleges per lakh population (18-23 yrs) 29 -
Average enrollment per college/ institution 557 167
Total estimated enrolment (Lakhs) 6.66 0.99
88%
4%
2%
6%
Types of Colleges
Affiliated College
Constituent / University College
PG / Off-Campus Centre
Recognized Centre

45 Status of Higher Education in Southern Region 2013
Student Enrolment
By Level : The state-wise Enrolment through Regular Mode at various levels is 6.66 Lakhs. Break-up across various levels and split by gender is given in the figure / table below. As can be inferred, the highest share of enrolment (79.8%) is at under-graduate level, followed by post-graduate (10.0%) and Diploma (8.4%), with all other levels forming only 1.9%. As can be seen from table above, maximum enrolment share (43.4%) is in private aided colleges in the state.
Figure 23: State ‐‐‐‐wise Enrolment through Regular Mode at various leve ls - KER
Foreign Students: Kerala is reported to have around 190 foreign students, which constitutes around 0.69% of total foreign students studying in India.
Figure 24: GER for All, SC & ST - KER
By Gender: In terms of gender, enrolment is skewed as 42.9% comprises males, while 57.1% of the enrolment is females, indicating gender disparity. The GER for males (18.8) is lower than GER for females (25.1), resulting in the gender parity index of 1.34 (which is much higher as compared to 0.86 at all-India level). In terms of overall GER, KER ranks 15th among all major states in India.
By Social Group: The GER of SCs (14.2) and STs (18.3) is lower than the state GER of 21.9. Further, there is disparity within the social groups between male and female GER. The gender parity Index for SC is 1.76, but it a bit lower in case of STs (1.11). As can be seen from Table 5 on Gender and Social representation, the share of student enrolment across all backward groups except STs in KER is lesser than their proportionate share in population.
Ph.D. M.Phil Post Graduate UnderGraduate
PG Diploma Diploma Certificate Integrated
Female 1451 413 41909 300704 133 32490 6253 1040
Male 1418 186 24823 230286 30 23112 650 754
0%
10%
20%
30%
40%
50%
60%
70%
80%
90%
100%18
.8
10.3
17.4
25.1
18.1
19.121
.9
14.2 18
.3
0
5
10
15
20
25
30
All SC ST
Male
Female
Total

46 Status of Higher Education in Southern Region 2013
Faculty and Staff
Table 17: Key Faculty & Staff Indicators - KER
The PTR of colleges in KER at 10.4 students per teacher is better than the all India average of 15.1. Total number of teaching staff and non-teaching staff in all colleg es in KER is estimated to be 0.52 lakhs and 0.41 la khs, respectively (extrapolating data available for 75.5% colleges in state). However, given the large number of colleges in the state, the number of teachers per college (53.6) and non-teaching staff per college (42.5) are more than the corresponding all–India levels as shown in table 4.
In terms of the post-wise share of teaching staff, the figure 6 provides the break-up in the state. 69% of the teaching posts are at level of Lecturer/ Assistant professor with there being almost equal numbers of Readers/ Associate Professors and Professors. Around 5% of the staff is temporary.
Figure 25: Post-wise share of teaching staff - KER
In terms of representation of various social groups and gender in the teaching and non-teaching staff, Table 5 below provides the relative comparison with the state population. It reveals that all the groups shown in the table are under-represented among the faculty and staff in higher education institutes in proportion to their share of population in the state. In case of gender groups also, women show more representation in both faculty and staff in higher educational institutions as compared to their share of population in the state.
Table 18: Student, Faculty and Staff - Gender and S ocial representation - KER
Indicator Male Female SC ST OBC Muslim
Share of Population 48.0% 52.0% 10.30% 1.10% 61.50% 24.10%
Share of Enrolment 42.9% 57.1% 6.7% 1.1% 29.6% 16.9%
Share of teaching staff 44.3% 55.7% 2.8% 0.2% 24.1% 7.5%
Share of non-teaching staff 59.9% 40.1% 5.4% 0.9% 29.9% 5.8%
Source: Share of population - Census 2011 & India Human Development Report 2011; Calculations of teaching and non-teaching staff using data from All India Survey of Higher Education, MHRD 2011;
Key Indicators KER INDIA
Pupil Teacher Ratio (PTR) 10.4 15.1
Teachers per College 53.6 46.4
Non-teaching staff per College 42.5 37.3
Calculation is based on the total number of responses as given in the AISHE 2010-11 survey
11%
12%
69%
3%
5%Professor & Equivalent
Reader & Associate Professor
Lecturer / Assistant Professor
Demonstrator / Tutor
Temporary Teacher

47 Status of Higher Education in Southern Region 2013
Tamil Nadu (TN)
Key Indicators
Table 19: Key Indicators – TN
Indicator Total Male Female
Total State Population, Lakhs (2011) 721.5 361.4 360.1
Literacy Rate (2011) 80.1 % 86.8 % 73.1 %
Pop. in 18-23 age group (lakhs), 2011 Share to total state pop. (%)
77.7 (10.8%)
38.8 (10.7%)
38.9 (10.8%)
Share of state 18-23 pop. to All-India 18-23 pop. (2011) 5.5% 5.3% 5.8%
Sex ratio (2011) 996
Gross Enrollment Ratio (2011) 32.9 36.5 29.1
Share of Graduates & above in total state population (2010) 8% 9.7% 6.5%
Source: Census 2011; All India Survey of Higher Education, MHRD 2011; Status of Education & Vocational Training in India, NSSO 66th Round, 2010
Education Infrastructure
The break-up of number of universities in the state on the basis of type of University is shown below. Tamil Nadu ranks First among all states in India with 59 Universities followed by Uttar Pradesh (56) and Andhra Pradesh (46) on total of number of Universities. The state also ranks second on number of State public universities with 23 Universities followed by Andhra Pradesh (30). TN has 9.5% of all Universities in the country.
Figure 26: Universities by Type - TN
Figure 27: Universities by Specialization - TN
1
1
2
4
23
28
0 5 10 15 20 25 30
State Open University
Government Deemed University
Central University
Institution of National Importance
State Public University
Private Deemed University
1
1
1
1
8
14
29
0 5 10 15 20 25 30 35
Veterinary
Medical
Law
Agriculture
Others
Technical
General

48 Status of Higher Education in Southern Region 2013
Figure 2 reflects the break-up of number of universities in TN22 on the basis of specialization. The state also ranks First highest on number of Technical Universities with 14 Universities followed by AP & MP with 6 Technical Universities each.
Table 20: College & Institution Indicators - TN
TN with 1,985 colleges has a share of 6.02% of all colleges in India and ranks #7 in terms of total colleges in any state in India . TN has average access with 27 colleges per lakh population as compared to the all India average of 23 colleges per lakh population. However in comparison to major states this number could still be improved. In terms of average enrolment per college, TN (574) is significantly lesser than all India average of 700 . Total enrolment of students in regular mode in higher education institutes in TN is around 18 lakhs.
Out of the total colleges in the state, 93% are affiliated to Universities, and the remaining are constituent/university colleges, PG/off campus or recognized centres by the Universities. In terms of management, TN colleges are dominated by the Private Unaided colleges, forming 88.5% of all colleges in the state, followed by 5.8% owned by Government and 5.6% that are private aided.
Figure 28: Type of Colleges - TN
Table 21: Management of Colleges - TN
Type of Management Share of colleges Share of enrolments Avg enrolment / college
Private Aided 5.6% 11.5% 1170
Private Unaided 88.5% 78.8% 511
Government 5.8% 9.7% 954
* Calculations in above table is based on the number of responses as given in the AISHE 2010-11 survey
22 Data available for 55 universities only.
Indicator Colleges Stand-alone Institutions
Total No. of colleges/ institutions 1985 1460
Colleges per lakh population (18-23 yrs) 27 -
Average enrollment per college/ institution 574 517
Total estimated enrolment (Lakhs) 18 7.55
93%
5%
1%1%
Types of Colleges
Affiliated College
Constituent / University College
PG / Off-Campus Centre
Recognized Centre

49 Status of Higher Education in Southern Region 2013
Stand-alone Institutions: There are 1460 stand-alone institutions in the state and the total enrolment in these is estimated to be around 7.55 lakhs.
Student Enrolment
By Level: The state-wise Enrolment through Regular Mode at various levels is 18 Lakhs. Break-up across various levels and split by gender is given in the figure / table below. As can be inferred, the highest share of enrolment (65.4%) is at under-graduate level, followed by Diploma (16.3%) and post-graduate (16.1%), with all other levels forming only 2.1%. As can be seen from table above, maximum enrolment share (78.8%) is in private unaided colleges in the state.
Figure 29: State ‐‐‐‐wise Enrolment through Regular Mode at various leve ls - TN
Foreign Students: Tamil Nadu is reported to have around 2,400 foreign students, which constitutes around 8.66% of total foreign students studying in India. It is the fourth highest amongst all states in attr acting foreign students .
Figure 30: GER for All, SC & ST - TN
By Gender: In terms of gender, enrolment is skewed as 56.9% comprises males, while only 43.1% of the enrolment is females, indicating significant gender disparity. The GER for males (36.5) is much higher than GER for females (29.1), In terms of overall GER, TN ranks 1st among all major states in India.
By Social Group: The GER of SCs (21.7) and STs (23.7) is lower than the state GER of 32.9. As can be seen from Table 5 below on Gender and Social representation, the share of student enrolment across backward groups is lesser than their proportionate share in population except for Muslims.
Ph.D. M.Phil Post GraduateUnder
GraduatePG Diploma Diploma Certificate Integrated
Female 3070 2765 187009 764762 4842 64916 7332 3984
Male 4925 1847 201662 810432 10079 328172 4741 7982
0%
10%
20%
30%
40%
50%
60%
70%
80%
90%
100%
36.5
23.4
30.6
29.1
19.9
17.5
32.9
21.7 23.7
05
10152025
303540
All SC ST
Male
Female
Total

50 Status of Higher Education in Southern Region 2013
Faculty and Staff
Table 22: Key Faculty & Staff Indicators - TN
Figure 31: Post-wise share of teaching staff - TN
The PTR of colleges in TN at 7 students per teacher is much better than the all India average of 15.1. TN has the healthiest PTR compared to other states in the country. Total number of teaching staff and non-teaching sta ff in all colleges in TN is estimated to be 1.64 lakhs and 1. 16 lakhs, respectively (extrapolating data available for 51.9 colleges in state). TN also has almost double number of teachers per college (82.5) compared to All India figures (46.4) and non-teaching staff per college (58.7) is also much higher than the corresponding all–India levels (37.3) as shown in table 4.
In terms of the post-wise share of teaching staff, the figure 6 provides the break-up in the state. 78% of the teaching posts are at level of Lecturer/ Assistant professor with there being almost equal numbers of Readers/ Associate Professors and Professors. Around 4% of the staff is temporary and demonstrator/tutor.
In terms of representation of various social groups and gender in the teaching and non-teaching staff, Table 5 below provides the relative comparison with the state population. It reveals that females are under-represented among the faculty and staff in higher education institutes as compared to males. In case of social groups also, ST (teaching staff), SC, OBC and Muslim groups shown in the table show a deficit in terms of representation in both faculty and staff in higher educational institutions as compared to their share of population in the state.
Table 23: Student, Faculty and Staff - Gender and S ocial representation - TN
Indicator Male Female SC ST OBC Muslim
Share of Population 50.1% 49.9% 22.8% 0.8% 70.7% 5%
Share of Enrolment 56.9% 43.1% 12.7% 0.7% 51.2% 6.4%
Share of teaching staff 59.7% 40.3% 7.6% 0.3% 55.9% 1.5%
Share of non-teaching staff 69.4% 30.6% 13.7% 0.8% 55.3% 1.3% Source: Share of population - Census 2011 & India Human Development Report 2011; Calculations of teaching and non-teaching staff using data from All India Survey of Higher Education, MHRD 2011;
Key Indicators TN INDIA
Pupil Teacher Ratio (PTR) 7 15.1
Teachers per College 82.5 46.4
Non-teaching staff per College 58.7 37.3 Calculation is based on the total number of responses as given in the AISHE 2010-11 survey
78%
10%
8%
2% 2%Lecturer / Assistant Professor
Professor & Equivalent
Reader & Associate Professor
Temporary Teacher
Demonstrator / Tutor

51 Status of Higher Education in Southern Region 2013
Puducherry (PDY)
Key Indicators
Table 24: Key Indicators – PDY
Indicator Total Male Female
Total State Population, Lakhs (2011) 12.5 6.1 6.4
Literacy Rate (2011) 85.9 91.3 84.1
Pop. in 18-23 age group (lakhs), 2011 Share to total state pop. (%)
1.3 (10.4%)
0.6 (10.3%)
0.7 (10.6%)
Share of state 18-23 pop. to All-India 18-23 pop. (2011) 0.1% 0.1% 0.1%
Sex ratio (2011) 1037
Gross Enrollment Ratio (2011) 31.2 32.6 29.9
Share of Graduates & above in total state population (2010) 16.2 21.7 10.9 Source: Census 2011; All India Survey of Higher Education, MHRD 2011; Status of Education & Vocational Training in India, NSSO 66th Round, 2010
Education Infrastructure
The break-up of number of universities in the state on the basis of type of University is shown below. PDY ranks 24th st among the states and Union territories and has 0.6% of all Universities in the country.
Figure 32: Universities by Type - PDY
Puducherry23 has 1 general University and 1 technical University.
Table 25: College & Institution Indicators - PDY
23 Data available for 2 universities only.
Indicator Colleges Stand-alone Institutions
Total No. of colleges/ institutions 82 57
Colleges per lakh population (18-23 yrs) 54 -
1
1
2
0 5 10 15 20 25 30
Central University
Private Deemed University
Institution of National Importance

52 Status of Higher Education in Southern Region 2013
PDY with 82 colleges has a share of 0.25% of all colleges in India and ranks #26 in terms of total colleges in any state/UT in India . In terms of access, PDY is above the all India average of 23 colleges per lakh population with 54 colleges per lakh population. In terms of average enrolment per college, PDY (483) is lower than the all India average of 700 . Total enrolment of students in regular mode in higher education institutes in PDY is around 0.47 lakhs.
Out of the total colleges in the state, 91% are affiliated to Universities, and the remaining are Constituent/University college and PG/off campus centres. In terms of management, PDY colleges are dominated by the Private Aided and Government colleges, forming 42.4% of all colleges in the state, followed by 15.2% owned by Private Unaided.
Figure 2: Type of Colleges - PDY
Table 26: Management of Colleges - PDY
Type of Management Share of colleges Share of enrolments Avg enrolment / college
Private Aided 2.8% 5.0% 856
Private Unaided 67.6% 54.5% 389
Government 29.6% 40.5% 661
* Calculations in above table is based on the number of responses as given in the AISHE 2010-11 survey
In PDY, there are 57 stand-alone institutions and the total enrolment in these is estimated to be around 0.25 lakhs.
Student Enrolment
By Level: The state-wise Enrolment through Regular Mode at various levels is 0.47 Lakhs. Break-up across various levels and split by gender is given in the figure / table below. As can be inferred, the highest share of enrolment (75.5%) is at under-graduate level, followed by Diploma (10.3%), Ph.D (7.2%) and post-graduate (6.8%), with all other levels forming only 0.1%. As can be seen from table above, maximum enrolment share (54.5%) is in Private Unaided colleges in the state.
Figure3: State ‐‐‐‐wise Enrolment through Regular Mode at various leve ls - PDY
Average enrollment per college/ institution 483 442
Total estimated enrolment (Lakhs) 0.47 0.25
Ph.D. M. Phil Post Graduate Under Graduate PG Diploma Diploma
Female 1287 25 1485 18912 4 1501
Male 2147 21 1751 16868 15 3386
0%
10%
20%
30%
40%
50%
60%
70%
80%
90%
100%
91%
6%
3%
Types of Colleges
Affiliated College
Constituent/University college
PG / Off-Campus Centre

53 Status of Higher Education in Southern Region 2013
Figure 4: GER for All, SC & ST - PDY
By Gender: In terms of gender, enrolment amongst men and women is almost equal as 50.8% comprises males, while 49.2% of the enrolment is females. The GER for males (32.6) is higher than GER for females (29.9), resulting in the gender parity index of 0.92 (which is much higher than 0.86 at all-India level). In terms of overall GER, PDY ranks 6th among all states and union territories in India.
By Social Group: The GER of SCs (26) is lower than the state GER of 31.2. As can be seen from table 5 below on Gender and Social representation, the share of student enrolment among OBC and Muslims is lesser than their proportionate share in population.
Faculty and Staff
Table 27: Key Faculty & Staff Indicators - PDY
Figure 5: Post-wise share of teaching staff - PDY
The PTR of colleges in PDY at 7.8 students per teacher is better than the all India average of 15.1. Total number of teaching staff and non-teaching staff in all colleg es in Puducherry is estimated to be 0.05 lakhs and 0.06 lakhs, respectively (extrapolating data available for 86.6% colleges in state). The number of teachers per college (61.5) and non-teaching staff per college (69.8) is higher than the corresponding all–India levels as shown in table 4.
In terms of the post-wise share of teaching staff, the figure 5 provides the break-up in the state. 60% of the teaching posts are at level of Lecturer/ Assistant professor followed by almost equal numbers of Readers/ Associate Professors and Professors, 8% are demonstrator/tutor level and 3% temporary teachers.
In terms of representation of various social groups and gender in the teaching and non-teaching staff, the table below provides the relative comparison with the state population. It reveals that females are under represented among the
Key Indicators PDY INDIA
Pupil Teacher Ratio (PTR) 7.8 15.1
Teachers per College 61.5 46.4
Non-teaching staff per College 69.8 37.3 Calculation is based on the total number of responses as given in the AISHE 2010-11 survey
32.6
28.9
29.9
23.2
31.2
26
0
5
10
15
20
25
30
35
All SC
Male
Female
Total
60%16%
13%
8% 3% Lecturer / Assistant Professor
Reader & Associate Professor
Professor & Equivalent
Demonstrator / Tutor
Temporary Teacher

54 Status of Higher Education in Southern Region 2013
faculty and staff in higher education. In case of social groups, all the groups except ST and other minority show a deficit in terms of representation in both faculty and staff in higher educational institutions as compared to their share of population in the state.
Table 28: Student, Faculty and Staff - Gender and S ocial representation - PDY
Indicator Male Female OBC Muslim Other Minority
Share of Population 49.1% 50.9% 70.80% 11.30% 5.51%
Share of Enrolment 50.8% 49.2% 59.4% 3.9% 7.6%
Share of teaching staff 63.4% 36.6% 48.5% 1.9% 6.1%
Share of non-teaching staff 61.1% 38.9% 59.4% 0.7% 5.8% Source: Share of population - Census 2011 & India Human Development Report 2011; Calculations of teaching and non-teaching staff using data from All India Survey of Higher Education, MHRD 2011;

55 Status of Higher Education in Southern Region 2013
Survey on key challenges faced by Southern Higher Education institutions
Background
As discussed in the preceding chapters, higher education in the country has been facing significant challenges which need to be immediately addressed in order to reap the benefits of a favorable demographic structure. There are a wide range of challenges encompassing higher education in the country such as quality of education imparted, lack of governance, long awaited reforms, low physical infrastructure and financial resources. In order to assess the challenges faced by the administrators of higher educational institutions in Southern India, CII has conducted a survey in the month of October. The survey will be useful in providing insights to regulatory authorities in addressing the challenges by way of suitable policy intervention and other reformatory measures. This chapter contains the key findings of this survey.
Methodology, composition and profile of survey resp ondents
Methodology
The survey was conducted in the form of questionnaire, designed by CII, containing questions on key challenges in higher education under nine broad parameters. The respondents were asked to rate the challenges on a scale of 1 to 10, wherein 10 signifies “most challenging” issue and 1 signifies the “least challenging” issue. The questionnaire was sent to HEIs located in the southern region, namely, Andhra Pradesh, Karnataka, Kerala, Tamil Nadu and Puducherry. However, the HEIs from the state of Tamil Nadu and Andhra Pradesh have responded.
Designation/position of the respondents
Out of total respondents participated, 48% are Principal/Directors, followed by 22% of trustee/promoters, 15% of others, 7% of secretaries, 4% deans and faculty.
Figure 1: Position wise distribution of respondents
.
Discipline of Institute
Based on faculty of institute who participated in the survey, 52% comprises of Technical/Engineering Institutes, 13%
from Arts & Science, 7% from Management and 28% were Multi Faculty. Multi faculty institutes are those which offer all
three technical/engineering, arts & science and management disciplines or any combination of them.
Principal/Director48%
Trustee/Promoter
22%
Others15%
Secretary7%
Dean4%
Faculty4%

56 Status of Higher Education in Southern Region 2013
Figure 2: Faculty wise distribution of respondent i nstitutes
State wise institutes
Of the total respondents, 83% are from the state of Tamil Nadu and the remaining 17% are from Andhra Pradesh. From the southern region, there were no respondents from Karnataka, Kerala and Puducherry.
Figure 3: State wise distribution of respondent ins titutes
Key Findings
Aspect 1: Admissions and Students intake
When asked about the challenges faced with admission and intake of students, respondents felt that the inadequate level of fee structure fixed by government ranks as the topmost challenge with an average score of 7.65 followed by low focus of the government in attracting foreign students with a score of 7.15. Further, differential fees structure across states and universities, lack of uniformity in admissions system and process across states and universities and low number of students from professional backgrounds are other important challenges with a score of 6.60, 6.56 and 6.35, respectively as can be seen in Figure 4 below.
On the other hand respondents feel the least challenging issue in admission and student intake is efficacy of utilization of funds by the institutes and knowledge on process to apply for funding.
Technical/Engineer
ing52%
Multi faculty 28%
Arts & Science
13%
Management7%
Tamil Nadu83%
Andhra Pradesh
17%
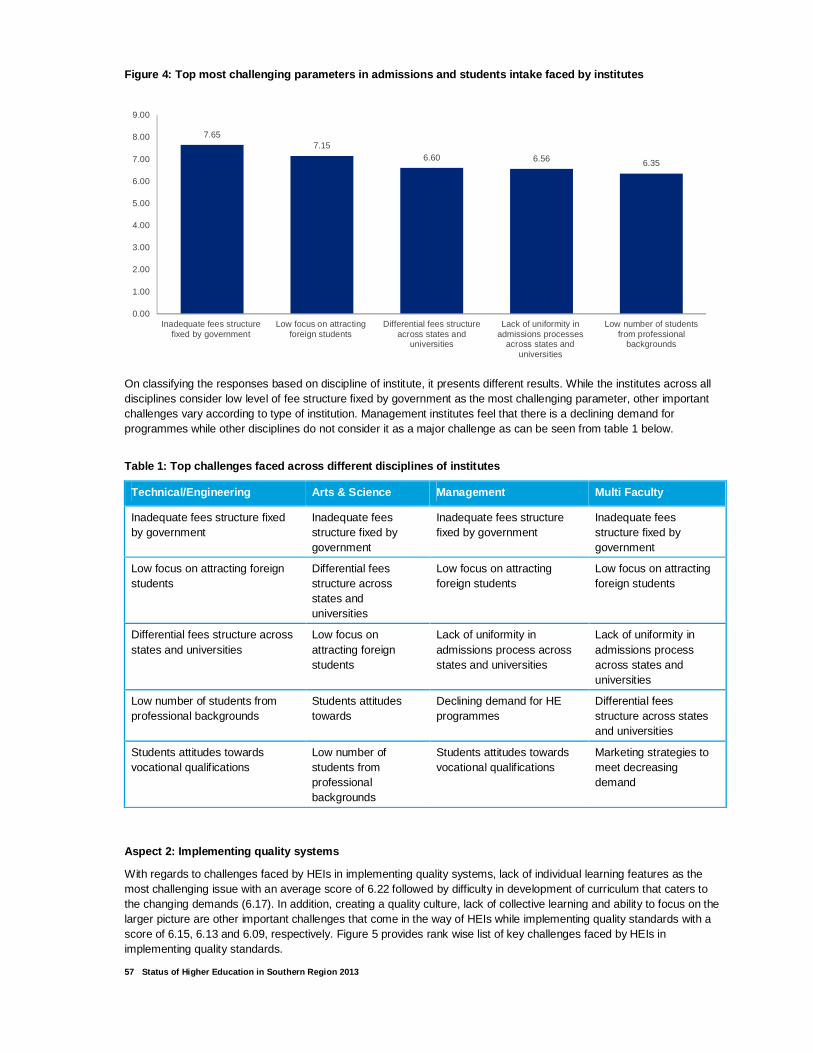
57 Status of Higher Education in Southern Region 2013
Figure 4: Top most challenging parameters in admiss ions and students intake faced by institutes
On classifying the responses based on discipline of institute, it presents different results. While the institutes across all disciplines consider low level of fee structure fixed by government as the most challenging parameter, other important challenges vary according to type of institution. Management institutes feel that there is a declining demand for programmes while other disciplines do not consider it as a major challenge as can be seen from table 1 below.
Table 1: Top challenges faced across different disc iplines of institutes
Technical/Engineering Arts & Science Management Multi Faculty
Inadequate fees structure fixed by government
Inadequate fees structure fixed by government
Inadequate fees structure fixed by government
Inadequate fees structure fixed by government
Low focus on attracting foreign students
Differential fees structure across states and universities
Low focus on attracting foreign students
Low focus on attracting foreign students
Differential fees structure across states and universities
Low focus on attracting foreign students
Lack of uniformity in admissions process across states and universities
Lack of uniformity in admissions process across states and universities
Low number of students from professional backgrounds
Students attitudes towards
Declining demand for HE programmes
Differential fees structure across states and universities
Students attitudes towards vocational qualifications
Low number of students from professional backgrounds
Students attitudes towards vocational qualifications
Marketing strategies to meet decreasing demand
Aspect 2: Implementing quality systems
With regards to challenges faced by HEIs in implementing quality systems, lack of individual learning features as the most challenging issue with an average score of 6.22 followed by difficulty in development of curriculum that caters to the changing demands (6.17). In addition, creating a quality culture, lack of collective learning and ability to focus on the larger picture are other important challenges that come in the way of HEIs while implementing quality standards with a score of 6.15, 6.13 and 6.09, respectively. Figure 5 provides rank wise list of key challenges faced by HEIs in implementing quality standards.
7.657.15
6.60 6.56 6.35
0.00
1.00
2.00
3.00
4.00
5.00
6.00
7.00
8.00
9.00
Inadequate fees structurefixed by government
Low focus on attractingforeign students
Differential fees structureacross states and
universities
Lack of uniformity inadmissions processes
across states anduniversities
Low number of studentsfrom professional
backgrounds

58 Status of Higher Education in Southern Region 2013
On the other hand respondents feel the least challenging issues in implementing quality standards are lack of leadership support/involvement and inefficiency of communication channels.
Figure 5: Top most challenging parameters for imple menting quality systems
On classifying the responses based on discipline of institute, it presents different results. While institutes across all discipline consider lack of individual learning as a major challenge, arts and science institutes find that academic rigor is less and management institutes find that there are no proper audit systems in place as can be seen in the table 2 below.
Table 2: Top challenges faced across different disc iplines of institutes
Technical/Engineering Arts & Science Management Multi Faculty
Development of curriculum that caters to the changing demands
Difficulty to focus on the larger picture
Lack of collective learning Accreditation norms varies with regulatory bodies
Lack of individual learning To create a quality culture
Accreditation norms varies with regulatory bodies
To create a quality culture
Lack of collective learning Development of curriculum that caters to the changing demands
Ensuring Quality in process, systems and outcomes
Difficulty to focus on the larger picture
Communication skill enhancement is difficult
Academic rigor is less No proper audit system Faculty tenure is less
Conducting training beyond syllabus is less
Lack of individual learning
Lack of individual learning Lack of individual learning
Aspect 3: Policies and Expectations
When asked about the importance of parameters with respect to policies and expectations in higher education, emphasis on the quality of higher education tops the list with average score of 9.06 followed by acquiring talented faculty with a score of 8.96. Further, continuous search for excellence (8.60), grant of autonomy based on outcomes and not merely on years of existence (8.60), manpower development (8.42) and institutional autonomy (8.42) are other important parameters. Figure 6 provides the graphical description of the same.
On the other hand respondents feel the least important parameters in respect of policies and expectation in higher education are diversity in the system and uniformity in policies across universities and states.
6.22
6.166.15
6.13
6.09
6.00
6.05
6.10
6.15
6.20
6.25
Lack of individual learning Developing a curriculumthat caters to the
changing demands
To create a quality culture Lack of collective learning Ability to focus on thelarger picture

59 Status of Higher Education in Southern Region 2013
Figure 6: Most important parameters in respect to p olicies and expectations in Higher Education
On classifying the responses based on discipline of institute, it presents different results. While institutes across all discipline consider emphasis on the quality of higher education as the most important parameter, management and multi faculty institute believe that syllabus must be in line with industry requirements. Table 3 below reflects the important parameters across all disciplines.
Table 3: Most important parameters across different disciplines of institutes
Technical/Engineering Arts & Science Management Multi Faculty
Emphasis on Quality of Higher Education
Emphasis on Quality of Higher Education
Emphasis on Quality of Higher Education
Emphasis on Quality of Higher Education
Talented Faculty Grant of autonomy based on outcomes and not merely on years of existence
Talented Faculty Talented Faculty
Continuous search for excellence
Continuous search for excellence
Curriculum and syllabi in line to industry requirements
Curriculum and syllabi in line to industry requirements
Grant of autonomy based on outcomes and not merely on years of existence
Talented Faculty Uniformity in standard of higher education
Institutional autonomy
Outcome based learning Provide hands on experience to students
Provide hands on experience to students
Grant of autonomy based on outcomes and not merely on years of existence
Aspect 4: Governance and Regulation of Higher Educa tion
When asked about the most challenging parameters in terms of governance and regulation in higher education respondents felt that determination of values inside the institution is the topmost challenge faced with an average score of 6.35 followed by contradicting regulatory measures issued by governing bodies with a score of 5.83. Further, professionalization in establishing systems (5.74), lack of clarity in governance specified by various regulatory bodies (5.59) and difficulty in upholding relationship with stakeholders (5.56) are other important challenges faced. Figure 7 provides the graphical description of the same.
On the other hand respondents feel the least challenging issues in implementing quality standards are lack clarity of a mission or purpose of the institute and hierarchical structure in the institute.
9.06
8.96
8.6 8.6
8.42 8.42
8.00
8.20
8.40
8.60
8.80
9.00
9.20
Emphasis on theQuality of Higher
Education
Talented Faculty Grant of autonomybased on outcomesand not merely onyears of existence
Continuous search forexcellence
ManpowerDevelopment
Institutional autonomy

60 Status of Higher Education in Southern Region 2013
Figure 7: Top most challenging parameters in govern ance and regulations faced by institutes
On classifying the responses based on discipline of institute, it presents different results. Both technical/engineering and multi faculty institutes have challenges maintaining external relationships. While arts & science institutions find that there are unclear systems of decision making as can be seen from table 4 below.
Table 4: Top challenges faced across different disc iplines of institutes
Technical/Engineering Arts & Science Management Multi Faculty
Determination of values inside institution
Professionalization in establishing systems
Determination of values inside institution
Contradiction in regulatory measures issued by governing bodies
Professionalization in establishing systems
Difficulty in upholding relationship with stakeholders
Difficulty in upholding relationship with stakeholders
Difficulty in upholding relationship with stakeholders
Managing external stakeholders Determination of values inside institution
Lack of clarity in governance specified by various regulatory bodies
Managing external stakeholders
Contradiction in regulatory measures issued by governing bodies
Contradiction in regulatory measures issued by governing bodies
Contradiction in regulatory measures issued by governing bodies
Lack of clarity in governance specified by various sections
Lack of clarity in governance specified by various regulatory bodies
Unclear system of decision making
Lack of clarity in governance specified by various sections
Determination of values inside institution
Aspect 5: Funding and Investment oppurtunitites
When asked about the challenges faced while seeking funding opportunities for the institute, low focus on patent orientation of funded projects ranks highest with an average score of 7.65 followed by disproportionate allocation of funds across institutions with a score of 7.29. Further, seeking private participation/collaboration for funded projects (7.28), low response from funding organizations for clarifying doubts (6.55) and low quality of projects that would opt for funding (6.44) are other key challenges. Figure 8 below provides the graphical description of the same.
On the other hand respondents feel the least challenging issues while seeking funding and investments are lack of effectiveness of utilization of funds and lack of clarity in the process of applying for funds.
6.35
5.835.74
5.59 5.56
5.00
5.20
5.40
5.60
5.80
6.00
6.20
6.40
6.60
Determination of valuesinside institution
Contradiction in regulatorymeasures issued by
governing bodies
Professionalization inestablishing systems
Lack of clarity ingovernance specified byvarious regulatory bodies
Difficulty in upholdingrelationship with key stake
holders

61 Status of Higher Education in Southern Region 2013
Figure 8: Most challenging parameters in respect to funding and investment opportunities
On classifying the responses based on discipline of institute, it presents fairly similar results. Arts & Science institutes find lack of commitment of faculty to work towards funding as reflected in table 5 below.
Table 5: Top challenges faced across different disc iplines of institutes
Technical/Engineering Arts & Science Management Multi Faculty
Low focus on patent oriented outcome of funded projects
Low focus on patent oriented outcome of
funded projects
Disproportionate allocation of funds across disciplines
Low focus on patent oriented outcome of funded projects
Seeking Private participation/collaboration for funded projects
Disproportionate allocation of funds across institutions
Low focus on patent oriented outcome of funded projects
Disproportionate allocation of funds across institutions
Disproportionate allocation of funds across institutions
Seeking Private participation/collaboration for funded projects
Disproportionate allocation of funds across institutions
Minimal response from funding organizations to
clarify doubts
Low quality projects opt for funding
Low quality projects opt for funding
Seeking Private participation/collaboration for funded projects
Seeking Private participation/collaboration for funded projects
Minimal response from funding organizations to clarify doubts
Lack of commitment of faculty to work towards funding
Minimal response from funding organizations for clarifying doubts
Low quality projects opt for funding
Aspect 6: International Collaboration
When asked about the difficulty faced in terms of achieving global excellence through foreign collaboration, the respondents have cited that lack of clarity in the regulations and systems of domestic country is the main challenge with an average score of 7.35 followed by lack of coordinated and coherent government strategy to enhance internationalization efforts with a score of 7.10. In addition, lack of improved coordination among regional, national and non-governmental stakeholders and working on collaborative projects with international institutions are the other important challenges with a score of 6.87 and 6.75, respectively.
On the other hand respondents feel that absence of self-motivation is the least challenging issue affecting foreign collaboration in higher education. Figure 9 provides rank wise list of key challenges faced by HEIs in foreign collaboration.
7.65
7.29 7.28
6.556.44
5.80
6.00
6.20
6.40
6.60
6.80
7.00
7.20
7.40
7.60
7.80
Low focus on patentorientation of projects
Disproportionate allocationof funds across institutions
Seeking participation ofprivate entitites for funded
projects
Minimal response fromfunding organizations to
clarify doubts
Low quality projects opt forfunding

62 Status of Higher Education in Southern Region 2013
Figure 9: Top most challenging parameters in intern ational collaboration
Upon analysing the responses on the basis of discipline of institute, it presents different results. While technical and management institutes cite lack of clarity in the regulations and systems of domestic country as the main challenge, arts and science institutes attribute insufficient financial capacity as the top most challenge. Further, according to multi faculty institutes, lack of coordinated and coherent government strategy to enhance internationalization efforts feature as the main challenge. Table 6 below highlights the top 5 challenges faced across different discipline of institutes in international collaboration.
Table 6: Challenges faced across different discipli nes of institutes in international collaboration
Technical/Engineering Arts & Science Management Multi Faculty
Procedures and systems of domestic country regulations are not clear
Insufficient financial capacity
Procedures and systems of domestic country regulations are not clear
Lack of coordinated and coherent government strategy to enhance internationalization efforts
Lack of improved coordination among regional, national and non-governmental stakeholders
Lack of adequate hostel facility for international collaboration
Working on Collaborative projects with international institutions
Procedures and systems of domestic country regulations are not clear
Lack of coordinated and coherent government strategy to enhance internationalization efforts
Procedures and systems of domestic country regulations are not clear
Lack of coordinated and coherent government strategy to enhance internationalization efforts
Working on Collaborative projects with international institutions
Establishing effective collaboration with foreign institutions
Multiple focus and expectations while establishing goals
Multiple focus and expectations while establishing goals
Unclear instructions and communication
Lack of identification of clear and strategic priorities due to increased demands and opportunities for international engagement
Insufficient time and human capacity
Insufficient financial capacity
Lack of improved coordination among regional, national and non-governmental stakeholders
Aspect 7: Research and Innovation
In relation to challenge faced in implementing research and innovation measures, the respondents felt that obtaining funds for undertaking research project is the most important issue with an average score of 7.36 followed by the issue involving low focus in bringing out innovative research outcomes with a score of 6.71. In addition, issues like lack of
7.32
7.10
6.926.87
6.75
6.40
6.50
6.60
6.70
6.80
6.90
7.00
7.10
7.20
7.30
7.40
Procedures and systems ofdomestic country
regulations are not clear
Lack of coordinated andcoherent governmentstrategy to enhance
internationalization efforts
Lack of improvedcoordination among
regional, national and non-governmental stakeholders
Working on Collaborativeprojects with international
institutions
Establishing effectivecollaboration with foreign
institutions

63 Status of Higher Education in Southern Region 2013
committed faculty (6.55) and low encouragement for inter-disciplinary research (6.39) are other challenges that are responsible for low research and innovation activities as can be seen from Figure 10.
On the other hand respondents feel the least challenging issues while implementing research and innovation measures is the lack of leadership involvement.
Figure 10: Top most challenging parameters in resea rch and innovation
Upon analysing the responses on the basis of discipline of institute, it shows that obtaining funds is the most important challenge faced across all categories of institutes. The other key challenges vary on the basis of category of institutions as can be seen from Table 7 below.
Table 7: Challenges faced across different discipli nes of institutes in research and innovation
Technical/Engineering Arts & Science Management Multi Faculty
Obtaining funds for research projects
Obtaining funds for research projects
Obtaining funds for research projects
Obtaining funds for research projects
Less focus in bringing out innovative research outcomes
Resources necessary to accomplish a innovation programme is not clear
Non availability of qualified supporting faculty
Less encouragement for interdisciplinary research
Lack of committed faculty Lack of benchmarking best practices
Lack of creating, acquiring and transferring of new knowledge and skills (innovativeness) in your team
Non availability of qualified supporting faculty
Less encouragement for interdisciplinary research
Non availability of qualified supporting faculty
Lack of customer orientation (customer -beneficiaries of research projects)
Non availability of qualified project coordinators
Partnership (with other colleagues, other institutes etc.)
Partnership (with other colleagues, other institutes etc.)
Resources necessary to accomplish a innovation programme is not clear
Lack of customer orientation (customer -beneficiaries of research projects)
7.36
6.71
6.55
6.396.31
5.60
5.80
6.00
6.20
6.40
6.60
6.80
7.00
7.20
7.40
7.60
Obtaining funds forresearch projects
Less focus in bringing outinnovative research
outcomes
Lack of committed faculty Less encouragement forinterdisciplinary research
Partnership (with othercolleagues, other institutes
etc.)

64 Status of Higher Education in Southern Region 2013
Aspect 8: Fostering Entrepreneurship through educat ion
When asked about the difficulty faced in terms of fostering entrepreneurship through education, the respondents have cited that perception of students to consider entrepreneurship as risky is the most significant challenge with an average score of 7.18. This is followed by the issue of lack of entrepreneurial intentions amongst students with an average score of 7.11. In addition, difficulty in accessing government supported strategies (6.98) and lack of understanding among faculty members towards entrepreneurship education (6.91) feature as the other important issues that come in the way of nurturing entrepreneurship through education as can be seen from Figure 11 below.
On the other hand respondents feel that the prevailing culture of the place where the institute is located is the least challenging issue for fostering entrepreneurship through education.
Figure 11: Top most challenging parameters for fost ering entrepreneurship through education
Upon comparing the responses on the basis of category of institutions, it reveals that the technical / engineering institutes attribute perception of students to consider entrepreneurship as risky as the top most challenge, while arts and science institutes consider the difficulty in accessing government supported strategies as the main issue. These challenges also vary in management and multi faculty institutes. Table 8 below highlights the top 5 challenges faced across different discipline of HEIs in fostering entrepreneurship through education.
Table 8: Challenges faced across different discipli nes of institutes in fostering entrepreneurship thr ough education
Technical/Engineering Arts & Science Management Multi Faculty
Students perceive entrepreneurship is risky
It is not easy to access government supported strategies
Students intention changes (away from entrepreneurship) in their course of study
Faculty members lack the mentality towards entrepreneurship education
Students do not have entrepreneurial intentions or setting up their own businesses
Faculty and students perceive entrepreneurship is troublesome
Students perceive entrepreneurship is risky
Students perceive entrepreneurship is risky
There is a lag in relating theory and practice in these courses
Support from existing entrepreneurs is less
Students do not have entrepreneurial intentions or setting up their own businesses
Students do not have entrepreneurial intentions or setting up their own businesses
Faculty and students perceive entrepreneurship is troublesome
Students perceive entrepreneurship is risky
Support from existing entrepreneurs is less
There is a lag in relating theory and practice in these courses
7.18
7.11
6.98
6.91 6.91
6.75
6.80
6.85
6.90
6.95
7.00
7.05
7.10
7.15
7.20
7.25
Students perceiveentrepreneurship as risky
Students do not haveentrepreneurial intentions
or setting up their ownbusinesses
Not easy to accessgovernment supported
strategies
Faculty members lack thementality towards
entrepreneurship education
Lag in relating theory andpractice in these courses

65 Status of Higher Education in Southern Region 2013
It is not easy to access government supported strategies
Students intention changes (away from entrepreneurship) in their course of study
There is a lag in relating theory and practice in these courses
It is not easy to access government supported strategies
Aspect 9: Industry–Institute interaction initiative s
In relation to difficulty faced in implementing industry-institute interaction initiatives, the main challenge attributed by the respondents is the limited time and resources for industry to spend time on institutions with an average score of 7.73 followed by live industry projects having a score of 7.31. Other top challenges include the basic mismatches in terms of focus and expectations (6.84), difficulty in making industry training a part of curriculum (6.76) and lack of information about what is on offer from institutes (6.69) as can be seen from Figure 12 below.
On the other hand, respondents consider that institute curriculum, programme, methodology etc. not insisting on interaction with industry as the least challenging issue that affect the implementation of industry-institute interaction initiatives.
Figure 12: Top most challenging parameters for Indu stry–Institute interaction initiatives
Upon comparing the challenges on the basis of category of institutions, it shows that technical/ engineering institutes and multi faculty institutes cite limited time and resources for industry to spend time on institutions as the main challenge while arts and science institutes consider basic mismatches in terms of focus and expectations as the main challenge. The management institutes on the other hand attribute lack of information about what is on offer from institutes as the most important challenge. Table 9 below highlights the topmost challenges faced across different discipline of HEIs in implementing Industry–Institute interaction initiatives. Table 9: Challenges faced across different discipli nes of institutes in implementing Industry–Institut e interaction initiatives
Technical/Engineering Arts & Science Management Multi Faculty
Limited time and resources for industry to spend time on institutions
Basic mismatches in terms of focus and expectations
Lack of information about what is on offer from institutes
Limited time and resources for industry to spend time on institutions
Making industry training a part of curriculum
Limited time and resources for industry to spend time on institutions
Basic mismatches in terms of focus and expectations
Live industry projects
Live industry projects Live industry projects Lack of quality of information/ inputs provided by institutes
Basic mismatches in terms of focus and expectations
7.73
7.31
6.846.76
6.69
6.00
6.20
6.40
6.60
6.80
7.00
7.20
7.40
7.60
7.80
8.00
Limited time and resourcesfor industry to spend time
on institutions
Live industry projects Basic mismatches in termsof focus and expectations
Making industry training apart of curriculum
Lack of information aboutwhat is on offer from
institutes

66 Status of Higher Education in Southern Region 2013
Lack of information about what is on offer from institutes
Lack of quality of information/ inputs provided by institutes
Institute activities are not relevant to industry activities
Students fall short of expectations from employers/ industry guides for projects with regard to reliability, integrity, self-motivation etc.
Basic mismatches in terms of focus and expectations
Students fall short of expectations from employers/ industry guides for projects with regard to reliability, integrity, self-motivation etc.
Students fall short of expectations from employers/ industry guides for projects with regard to reliability, integrity, self-motivation etc.
Lack of information about what is on offer from institutes
Summary
Analysis of the above finding suggests the need for intervention from various stakeholders to improve the higher education system in southern region. The below mentioned table provides a summary of key challenges, based on the survey findings, affecting the growth of higher education in southern region.
S No
Component Key Issues and Challenges
1. Admissions and Students intake
• Inadequate fee structure fixed by government • Low focus of the government in attracting foreign students • Differential fees structure across states and universities • Lack of uniformity in admissions system and process across
states and universities
2. Implementing quality systems
• Lack of individual learning • Developing of curriculum that caters to the changing demands • Creating a quality culture • Lack of collective learning
3. Governance and Regulation
• Determination of values inside institution • Contradicting regulatory measures issued by governing bodies • Professionalization in establishing systems • Lack of clarity in governance specified by various regulatory
bodies
4. Funding and Investment oppurtunitites
• Low focus on patent orientation of funded projects • Disproportionate allocation of funds across institutions • Seeking private participation/collaboration for funded projects • Low quality of projects seeking funding
5. International Collaboration
• Lack of clarity in the regulations and systems of domestic country
• Lack of coordinated and coherent government strategy to enhance internationalization efforts
• Lack of improved coordination among regional, national and non-governmental stakeholders
• Working on collaborative projects with international institutions • Establishing effective collaboration with foreign institutions
6. Research and Innovation • Obtaining funds for undertaking research project • Low focus in bringing out innovative research outcomes

67 Status of Higher Education in Southern Region 2013
S No
Component Key Issues and Challenges
• Lack of committed faculty • Low encouragement for inter-disciplinary research
7. Fostering entrepreneurship through education
• Perception of students to consider entrepreneurship as risky • Lack of entrepreneurial intentions amongst students • Difficulty in accessing government supported strategies • Lack of understanding among faculty members towards
entrepreneurship education
8. Industry – Institute interaction initiatives
• Limited time and resources for industry to spend time on institutions
• Live industry projects • Basic mismatches in terms of focus and expectations • Difficulty in making industry training a part of curriculum

68 Status of Higher Education in Southern Region 2013
About CII
The Confederation of Indian Industry (CII) works to create and sustain an environment conducive to the development of India, partnering industry, Government, and civil society, through advisory and consultative processes.
CII is a non-government, not-for-profit, industry-led and industry-managed organization, playing a proactive role in India's development process. Founded over 118 years ago, India's premier business association has over 7100 members, from the private as well as public sectors, including SMEs and MNCs, and an indirect membership of over 90,000 enterprises from around 257 national and regional sectoral industry bodies.
CII charts change by working closely with Government on policy issues, interfacing with thought leaders, and enhancing efficiency, competitiveness and business opportunities for industry through a range of specialized services and strategic global linkages. It also provides a platform for consensus-building and networking on key issues.
Extending its agenda beyond business, CII assists industry to identify and execute corporate citizenship programmes. Partnerships with civil society organizations carry forward corporate initiatives for integrated and inclusive development across diverse domains including affirmative action, healthcare, education, livelihood, diversity management, skill development, empowerment of women, and water, to name a few.
The CII Theme for 2013-14 is Accelerating Economic Growth through Innovation, Transformation, Inclusion and Governance. Towards this, CII advocacy will accord top priority to stepping up the growth trajectory of the nation, while retaining a strong focus on accountability, transparency and measurement in the corporate and social eco-system, building a knowledge economy, and broad-basing development to help deliver the fruits of progress to all.
With 63 offices, including 10 Centres of Excellence, in India, and 7 overseas offices in Australia, China, Egypt, France, Singapore, UK, and USA, as well as institutional partnerships with 224 counterpart organizations in 90 countries, CII serves as a reference point for Indian industry and the international business community.

69 Status of Higher Education in Southern Region 2013
Acknowledgements
Dr Nandini R Chairperson, CII Southern Region Sub Committee on Higher Education & Founder Trustee & Secretary, GRG Institutions
Dr Sundararaman S K Chairman, CII Coimbatore Zone & ED Shivatex Yarn Ltd
Dr Sheela Ramachandran , Convenor – Education & III Panel, CII Coimbatore Zone & Vice Chancellor Avinashilingam University for Women
Prof Balasubramanian S Co-Convenor – Education & III Panel CII Coimbatore Zone & Director GRG School of Management Studies
Ms Malarvizhi S Chairperson Sri Krishna Institutions
Ms Anusha R Chief Executive Officer Park Group of Institutions
Mr Senthil Ganesh K Managing Trustee RVS Educational Trust
Dr Krishna Kumar P Chief Executive Officer Nehru Group of Institutions
Dr Radhakrishnan P Director PSG Institute of Advanced Studies
Mr Balaji P Trustee Sri Vasavi Group of Institutions
Dr Natesan A K Chairman Excel Group
Dr Aby Sam Director, Hindustan University
Dr R S K Lakshmana Prabhu Director PSNA College of Engineering & Technology

About Deloitte
"Deloitte” is the brand under which tens of thousands of dedicated professionals in independent firms throughout the world collaborate to provide audit, consulting, financial Advisory, risk management and tax services to select clients base. These firms are members of Deloitte Touche Tohmatsu Limited (DTTL), a UK private company limited by guarantee. In India, we offer a range of Assurance & Enterprise risk, Tax, Consulting and Financial advisory services across thirteen cities.
Mumbai
Indiabulls Finance Centre
Tower 3, 27th-32nd Floor,
Senapati Bapat Marg,
Elphinstone Road (W),
Mumbai – 400013
Tel: + 91 (022) 6185 4100
Fax: + 91 (022) 6185 4101
Bangalore
Deloitte Centre,
Anchorage II,100/2,
Richmond Road,
Bangalore 560 025.
Tel: +91 (080) 6627 6000
Fax: +91 (080) 6627 6409
Delhi/Gurgaon
Building 10,
Tower B, 7th Floor,
DLF Cyber City,
Gurgaon 122 002
Tel : +91 (0124) 679
2000
Fax : + 91 (0124) 679
2012
Chennai
No.52, Venkatanarayana
Road, 7th Floor, ASV N
Ramana Tower,
T-Nagar, Chennai 600 017.
Tel: +91 (044) 6688 5000
Fax: +91 (044) 6688 5019
Kolkata
Bengal Intelligent Park
Building, Alpha, 1st floor,
Plot No –A2, M2 & N2,
Block – EP & GP Sector –
V, Salt Lake Electronics
Complex,
Kolkata - 700 091.
Tel : + 91 (033) 6612 1000
Fax : + 91 (033) 6612 1001
Ahmedabad
“Heritage” 3rd Floor,
Near Gujarat Vidyapith,
Off Ashram Road,
Ahmedabad – 380 014.
Tel: + 91 (079) 2758 2542
Fax: + 91 (079) 2758 2551
Hyderabad
1-8-384 & 385, 3rd Floor,
Gowra Grand S.P.Road,
Begumpet,
Secunderabad – 500 003.
Tel: +91 (040) 4031 2600
Fax:+91 (040) 4031 2714
Vadodara
Chandralok,
31, Nutan Bharat Society,
Alkapuri,
Vadodara – 390 007
Tel: + 91 (0265) 233 3776
Fax: +91 (0265) 233 9729

71 Status of Higher Education in Southern Reg ion 2013
Glossary
AICTE All India Council of Technical Education
AIU Association of Indian Universities
CII Confederation of Indian Industry
CPSE Central Public Sector Enterprises
CSR Corporate Social Responsibility
DEC Distance Education Council
DTTIPL Deloitte Touche Tohmatsu India Private Limited
FEIs Foreign Educational Institutions
GDP Gross Domestic Product
GER Gross Enrolment Ratio
GSDP Gross State Domestic Product
HEIs Higher Education Institutes
IGNOU Indira Gandhi National Global University
IUB Inter-University Board
MHRD Ministry of Human Resource Development
NAAC National Assessment and Accreditation Council
NASSCOM National Association of Software and Services Companies
NBA National Board of Accreditation
NSDC National Skills Development Corporation
OBCs Other Backward Class
ODL Open and Distance Learning
PTR Pupil Teacher Ratio
SHEC State Higher Education Council
SSA Sarva Shiksha Abhiyan
RMSA Rashtriya Madhyamik Shiksha Abhiyan
UGC University Grants Commission
US United States of America
RUSA Rashtriya Uchchatar Shiksha Abhiyan
SCs Scheduled Castes
STs Scheduled Tribes
NAAC National Assessment and Accreditation Council

Deloitte refers to one or more of Deloitte Touche Tohmatsu Limited, a UK private company limited by guarantee, and its network of member firms, each of which is a legally separate and independent entity.
Please see www.deloitte.com/about for a detailed description of the legal structure of Deloitte Touche Tohmatsu Limited and its member firms.
This material and the information contained herein prepared by Deloitte Touche Tohmatsu India Private
Limited (DTTIPL) is intended to provide general information on a particular subject or subjects and is not an exhaustive treatment of such subject(s). None of DTTIPL, Deloitte Touche Tohmatsu Limited, its member firms, or their related entities (collectively, the “Deloitte Network”) is, by means of this material, rendering professional advice or services. The information is not intended to be relied upon as the sole basis for any decision which may affect you or your business. Before making any decision or taking any action that might affect your personal finances or business, you should consult a qualified professional adviser.
No entity in the Deloitte Network shall be responsible for any loss whatsoever sustained by any person who relies on this material.
©2013 Deloitte Touche Tohmatsu India Private Limited. Member of Deloitte Touche Tohmatsu Limited