Status of Green Bonds · PDF fileManagement of Proceeds The net ... Real Estate, Waste &...
12
Michael Eckhart Managing Director Global Head of Environmental Finance Citigroup Capital Markets, Inc. [email protected] Status of Green Bonds
Transcript of Status of Green Bonds · PDF fileManagement of Proceeds The net ... Real Estate, Waste &...

Michael EckhartManaging Director
Global Head of Environmental FinanceCitigroup Capital Markets, Inc.
Status of Green Bonds
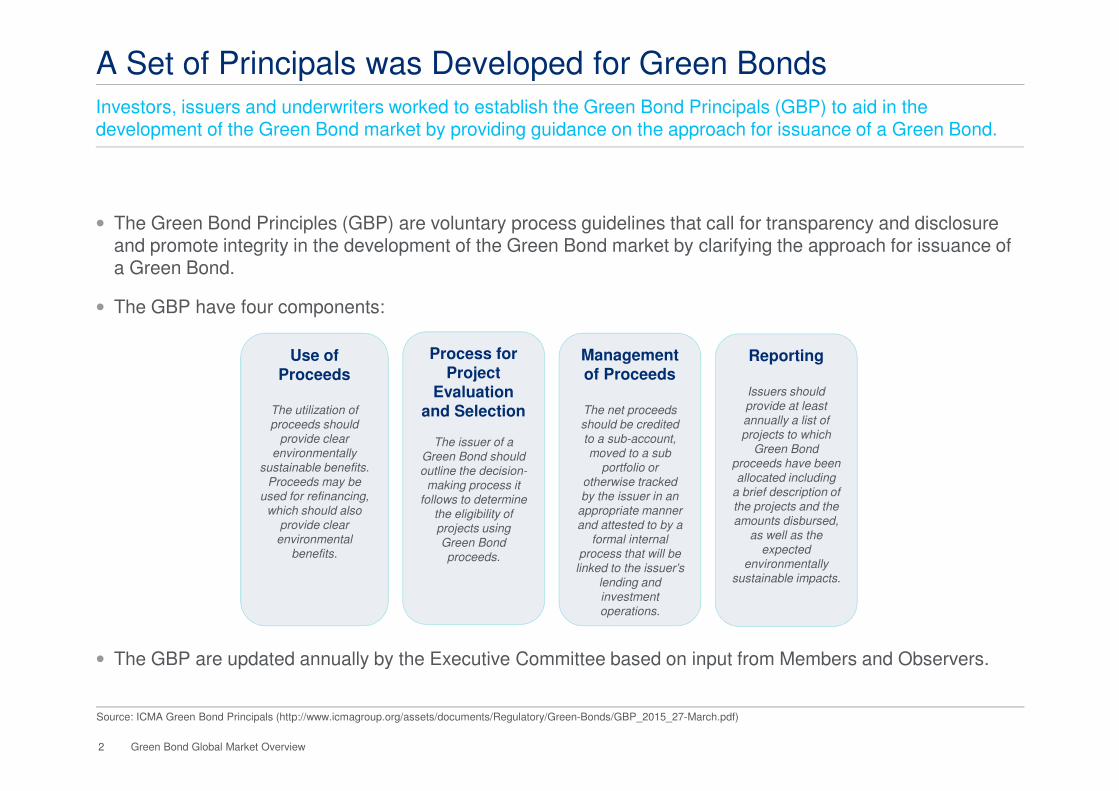
• The Green Bond Principles (GBP) are voluntary process guidelines that call for transparency and disclosure and promote integrity in the development of the Green Bond market by clarifying the approach for issuance of a Green Bond.
• The GBP have four components:
• The GBP are updated annually by the Executive Committee based on input from Members and Observers.
A Set of Principals was Developed for Green BondsInvestors, issuers and underwriters worked to establish the Green Bond Principals (GBP) to aid in the development of the Green Bond market by providing guidance on the approach for issuance of a Green Bond.
Source: ICMA Green Bond Principals (http://www.icmagroup.org/assets/documents/Regulatory/Green-Bonds/GBP_2015_27-March.pdf)
Use of Proceeds
The utilization of
proceeds should
provide clear
environmentally
sustainable benefits.
Proceeds may be
used for refinancing,
which should also
provide clear
environmental
benefits.
Process for Project
Evaluation and Selection
The issuer of a
Green Bond should
outline the decision-
making process it
follows to determine
the eligibility of
projects using
Green Bond
proceeds.
Management of Proceeds
The net proceeds
should be credited
to a sub-account,
moved to a sub
portfolio or
otherwise tracked
by the issuer in an
appropriate manner
and attested to by a
formal internal
process that will be
linked to the issuer’s
lending and
investment
operations.
Reporting
Issuers should
provide at least
annually a list of
projects to which
Green Bond
proceeds have been
allocated including
a brief description of
the projects and the
amounts disbursed,
as well as the
expected
environmentally
sustainable impacts.
2 Green Bond Global Market Overview

• As of 9/9/2015 the GBP Executive Committee has a total of 24 members reflecting a representative group of:
– 8 Investors: Actiam, Blackrock, CalSTRS, KFW, Natixis Asset Management / Mirova, Standish Melon Asset Management, TIAA-CREF, Zurich Insurance Group
– 8 Issuers: EDF, EBRD, European Investment Bank, ENGIE, International Finance Corporation, Unibail-Rodamco, Unilever, World Bank
– 8 Underwriters: Bank of America Merrill Lynch, Citi, Credit Agricole CIB, HSBC, JPMorgan Chase, Morgan Stanley, Rabobank, Skandinaviska Enskilda Banken
• ICMA serves as Secretariat to the GBP carrying out the governance of the Green Bond Principles
GBP Organizational Chart
Investors Underwriters
GBP Executive Committee
Has the authority to address all matters relating to the GBPand issues the annual update of the GBP.
A Governance document sets forth the rules for GBP administration and establishes a GBP Executive Committee
Issuers
3 Green Bond Global Market Overview

1) XXXXX
Member Organizations of the GBP (as of 21/8/2015)
Membership in the GBP is open to organizations that have issued, underwritten, or invested in a Green Bond.
Source: International Capital Markets Association
Investors• ACTIAM • BlackRock• Blue Morpho Investments • Breckinridge Capital Advisors• British Columbia IM• CalSTRS• CM-CIC • Erste• Generation • Humanis Gestion d'Actifs• ING Groep• KfW• MainStreet Capital • Natixis AM – Mirova• NN Investment Partners • OFI • PGGM Vermogensbeheer• Standish Mellon • State Street • TIAA-CREF • Union Investment • Wasmer, Schroeder & Co.• Zurich Insurance Group
Issuers• African Development Bank• Berlin Hyp AG• BNG Bank• Commonwealth of
Massachusetts• D.C. Water and Sewer
Authority• EDF SA• ENGIE (ex GDF Suez)• European Bank of
Reconstruction and Development
• European Investment Bank• FMO• Hannon Armstrong
Sustainable Infrastructure • IFC• Kommunalbanken• Nordic Investment Bank• NRW.BANK• NWB Bank• Overseas Private Investment
Corporation• Région Ile-de-France• Toronto-Dominion Bank• Unibail-Rodamco• Unilever• World Bank
Underwriters• ABN AMRO Bank• Banca IMI SpA• Banco Santander• Bank of America - Merrill
Lynch• Barclays• BBVA• Belfius Bank SA/NV• Bank of Montreal• BNP Paribas• Caixa Bank• Casgrain & Company Limited• CastleOak Securities• CIBC World Markets• Citi• CM-CIC securities• Commerzbank• Crédit Agricole• Crédit Suisse• Daiwa Capital Markets
Europe• Danske Bank• Deutsche Bank • DNB• DZ Bank • Goldman Sachs• Handelsbanken• HSBC Bank• Incapital
• ING Bank• JCI Capital• Jefferies International• JP Morgan Chase & Co• KBC Bank• LBBW• Lloyds Bank• Mitsubishi UFJ • Morgan Stanley & Co • National Australia Bank• National Bank Financial• Natixis• Nomura International• Nordea Bank Finland Oyj• Piper Jaffray & Co• Rabobank• RBC Europe• RBI• Royal Bank of Scotland• Skandinaviska Enskilda
Banken• SMBC Nikko• Société Générale• Standard Chartered• Stifel, Nicolaus & Co• UBS• UniCredit Bank• Wells Fargo Bank• Westpac Institutional Bank
4 Green Bond Global Market Overview

Green Bond Market has Experienced Rapid GrowthOver $30 billion of bonds related to climate change were issued in 2014, against $13 billion in the whole of 2013. Volume in 2015 will exceed 2014, with a decline in SSA1 issuance offset by growth in corporate and municipal.
Source: Bloomberg and Citi.1. Corporate includes: Real Estate, Waste & Environment Services & Equipment, Financial Services, Food & Beverage, Consumer Products, Consumer Finance, Educational Services, Consumer Services, Semiconductors and Industrial Other
Since 2009, interest in green bonds has expanded globally, as investors have looked to invest capital in products that support environmental sustainability.
$1.8 $0.6
$1.7
$13.2
$31.1
$23.2
$31.7
0.0
5.0
10.0
15.0
20.0
25.0
30.0
$35.0
2009 2010 2011 2012 2013 2014 2015 YTD
Power Generation and Utilities Corporate¹ Government Agencies
Supranationals Banks and Diversified Banks Renewable Energy
Government Development Banks Government Regional and Local Projected
5 Market Dynamics and Key Developments

Green Bonds Are Issued by Public and Private EntitiesSo far in 2015, the green bond market has seen increased activity from a wider range of issuers over the past few years.
Source: Bloomberg.
Illustrative Green Bond Issuers
Power Generation and
Utilities21%
Corporate21%
Government Agencies
2%
Supranationals29%
Banks and Diversified
Banks2%
Renewable Energy
1%
Government Development
Banks20%
Government Regional and
Local4%
Power Generation and
Utilities25%
Corporate23%
Government Agencies
12%
Supranationals12%
Banks and Diversified
Banks10%
Renewable Energy
9%
Government Development
Banks5%
Government Regional and
Local4%
2015 YTD
2014
Green Bonds: By issuer type 2014 to 2015
6 Market Dynamics and Key Developments

• The bulk of green issuance continues to be in USD and EUR, however development banks have been increasingly issuing new green bond transactions in local currencies
The Green Bond Market is Becoming Increasingly More GlobalThe globalization of green bonds can be viewed from two perspectives: the currency and the location of the issuer.
Green Bonds: by Currency 2014 to 2015 YTD
Source: Bloomberg.1. Other1 includes: BRL, CAD, CHF, CNY, COP, HUF, IDR, INR, JPY, MXN, MYR, NOK, NZD, PEN, PLN, RUB, TRY and ZAR.2. Other2 includes: BRL, CHF, CNY, COP, HUF, IDR, INR, JPY, MXN, MYR, NOK, NZD, PEN, PLN, RUB, TRY and ZAR.
Green Bonds have been Issued by Organizations in Many Countries
> $10bn issued< $10bn issued
2015 YTD
2014
USD45%
EUR37%
GBP6%
SEK5%
AUD4%
Other¹3%
EUR49%
USD20%
SEK9%
GBP8%
CAD4%
AUD2%
Other²8%
7 Market Dynamics and Key Developments

Additional Detail on GlobalizationThe globalization of green bonds can be viewed from two perspectives: the currency and the location of the issuer.
Source: J.P. Morgan.1. Count of signatories, only includes Asset Owners and Investment Managers (excludes Professional Service Partners)
Legend1
100 – 200
30 – 100
10 – 30
0 – 10
Global Distribution of Green SRI Investors (UN PRI Signatories)
UK
USA
France
Australia
Brazil
Netherlands
Switzerland
Canada
Germany
South Africa
Sweden
Finland
Japan
Spain
Denmark
New Zealand
Luxembourg
Italy
Norway
Hong Kong
Austria/Liechtenstein
Iceland
Ireland
Singapore
South KoreaTurkey
Channel Islands
Estonia
China
India
Indonesia
Nigeria
Puerto Rico
Vietnam
Bermuda
Botswana
British Virgin IslandsCayman Islands
ColumbiaGhana
Malaysia
Namibia
Peru
Portugal
Thailand
UnitedArab
Nations
Mauritius
Belgium
• The bulk of green issuance continues to be in USD and EUR, however development banks have been increasingly issuing new green bond transactions in local currencies
8 Market Dynamics and Key Developments

SSA Bonds: Wide Range of Deal Size and CouponsThe majority of SSA green bonds have been large scale, low coupon, low risk bonds, however, there are many examples of higher risk, higher coupon, higher risk bonds as well.
Source: Bloomberg.
• How to interpret: Coupon on y-axis, date on x-axis, bubble size based on size of issuance, bubble color based on issuer industry
10 Market Dynamics and Key Developments
0.0
2.0
4.0
6.0
8.0
10.0
12.0%
Dec-11 Jun-12 Dec-12 Jun-13 Dec-13 Jun-14 Dec-14 Jun-15 Dec-15
Coupo
n
Supranationals Government Agencies Government Development Banks Government Regional and Local
Scale
$1bn
$500mm

Corporate Bonds: Also a Wide Range of Deal Size and CouponsThe majority of corporate green bonds have been large scale, low coupon, low risk bonds, however, there are many examples of higher risk, higher coupon, higher risk bonds as well.
Source: Bloomberg.
• How to interpret: Coupon on y-axis, date on x-axis, bubble size based on size of issuance, bubble color based on issuer industry
0.0
2.0
4.0
6.0
8.0
10.0
12.0%
Dec-11 Jun-12 Dec-12 Jun-13 Dec-13 Jun-14 Dec-14 Jun-15 Dec-15
Cou
pon
Power Generation and Utilities Corporate Banks and Diversified Banks Renewable Energy
Scale
$1bn
$500mm
11 Market Dynamics and Key Developments

Major Investors in Green BondsThe success of a Green Bond is often judged in part by support from the ‘deep green’ investors. Below is an overview of both well-known & niche buyers.
Illustrative Green Bond Investors: Green Bond Investors Expectations
Some investors have a dedicated SRI/Green Portfolio while others who have a particular interest in green bonds purchase these from a general fund.
Some investors may have a preference for Green bonds to adhere to voluntary standards such as the Green Bond Principles.
To avoid the risk of green washing, investors are increasingly interested in impact reporting over the life of a green bond.
Investors have begun to add ESG (Environmental Social Governance) as a key component of their credit / equity research reports. At times their investment decision is linked to the issuers overall ESG score.
In general, as the green bond market grows investors are developing a better understanding of what level of transparency they want from the issuers of green bonds.
12 Market Dynamics and Key Developments

Outlook for Green Bonds
The Green Bond market is just starting, but the upside potential is $1 trillion/year or more, to meet climate goals.
Source: International Energy Agency World Energy Outlook 2012, IEA, Ceres, IRENA.
• Recent estimates by reputable sources suggest that an enormous amount of capital investment in green uses will be required over the next 50 years
• If debt capital markets provide 50% of the needed capital, then the Green Bond market could exceed $1 trillion/year of new issuances.
20
25
30
35
40
45
1990 2000 2010 2020 2030
Gt
Current Policies Scenario
New Policies Scenario
Efficient World Scenario
450 Scenario (2ºC)
IEA’s Global Energy-Related CO2 Emissions by Scenario
IRENA
Ceres
IEA $8.25 trillion (between now and 2030)
$48 trillion (between now and 2035)
$44 trillion (between now and 2050)
16 Issues and Outlook