Status of Decentralized Wastewater Treatment in Europe Overview of the European and... · Status of...
60
Visu 1 Decentralized WWT in Europe Status of Decentralized Wastewater Treatment in Europe: Need, Drivers, Trends and Technologies Prof. C. Visvanathan Environmental Engineering and Management Program Asian Institute of Technology Thailand email: [email protected] Web: http://www.faculty.ait.ac.th/visu/
Transcript of Status of Decentralized Wastewater Treatment in Europe Overview of the European and... · Status of...

Visu 1Dec
entr
aliz
ed W
WT
in
Eur
ope
Status of Decentralized
Wastewater Treatment in Europe:
Need, Drivers, Trends and Technologies
Prof. C. VisvanathanEnvironmental Engineering and Management Program
Asian Institute of TechnologyThailand
email: [email protected] Web: http://www.faculty.ait.ac.th/visu/

Visu 2Dec
entr
aliz
ed W
WT
in
Eur
ope
Outline Need
Conventional Sanitation System
Europe Largest WWTP in Paris
World Population Distribution
Asia Vs Europe
Urban Growth Pattern
Drivers
Sustainable Sanitation System
First Generation Decentralized WWTP
Status of MBR in Europe
Drivers and Trends in Europe
Case study MBR at the Sant’ Erasmo Island
Advance Remote Control System at Venice
High-tech Vs Low-tech

Visu 3Dec
entr
aliz
ed W
WT
in
Eur
ope
Need
No wastewater treatment in,
Póvoa de Varzim in Portugal Mehedinti in Romania
Europe: 540 Major Cities
Only 79 cities have advanced tertiary sewage treatment
223 have secondary treatment
168 cities have no or an unknown form of treatment of their wastewater

Visu 4Dec
entr
aliz
ed W
WT
in
Eur
ope
Wastewater and Wastewater
Treatment
4

Visu 5Dec
entr
aliz
ed W
WT
in
Eur
ope
Wastewater Treatment by World
Regions
5
Visu 6Dec
entr
aliz
ed W
WT
in
Eur
ope
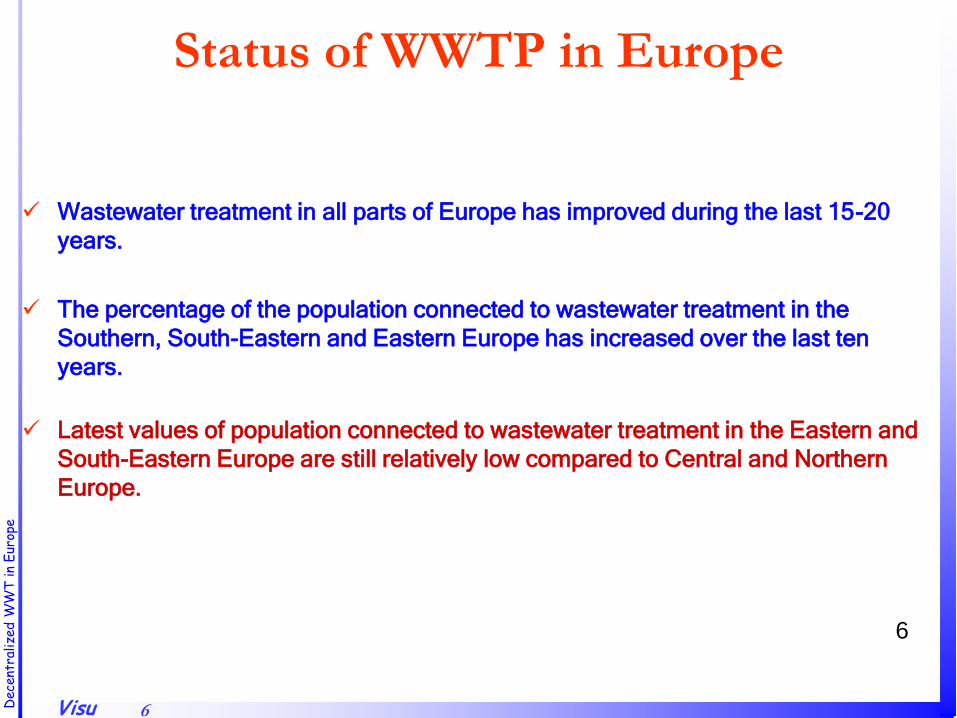
Status of WWTP in Europe
Wastewater treatment in all parts of Europe has improved during the last 15-20
years.
The percentage of the population connected to wastewater treatment in the
Southern, South-Eastern and Eastern Europe has increased over the last ten
years.
Latest values of population connected to wastewater treatment in the Eastern and
South-Eastern Europe are still relatively low compared to Central and Northern
Europe.
6

Visu 7Dec
entr
aliz
ed W
WT
in
Eur
ope
Water supply and sanitation in the
European Union The Urban Waste Water Treatment Directive (91/271/EEC) of 21 May 1991
concerning discharges of municipal and some industrial waste waters;
The Drinking Water Directive (98/83/EC) of 3 November 1998 concerning
potable water quality;
The Water Framework Directive (2000/60/EC) of 23 October 2000
concerning water resources management.
7

Visu 8Dec
entr
aliz
ed W
WT
in
Eur
ope
EU Directive on Wastewater
Treatment
The Urban Waste Water Treatment (UWWT) Directive is one of the major water policy tools in
Europe, was adopted on 21 May 1991.
Directive requires:
The Collection and treatment of waste water in all agglomeration of >2000 population
equivalents (p.e.)
Secondary Treatment of all discharges from agglomerations of > 2000 p.e., and more
advanced treatment for agglomerations >10 000 P.e. in designated sensitive areas and their
catchments;
A requirement for pre-authorisation of all discharges of urban wastewater, of discharges from
the food-processing industry and of industrial discharges into urban wastewater collection
systems;
Monitoring of the performance of treatment plants and receiving waters; and
Controls of sewage sludge disposal and re-use, and treated waste water re-use whenever it is
appropriate.
8

Visu 9Dec
entr
aliz
ed W
WT
in
Eur
ope
Urban Waste Water Treatment (UWWT) Directive
9

Visu 10Dec
entr
aliz
ed W
WT
in
Eur
ope
Compliance Time Table Timetable for the compliance with the UWWT Directive varies for EU15 and for new EU
Member States (EU12).
For Austria, Belgium, Denmark, Finland, France, Germany, Greece, Ireland, Italy,
Luxembourg, Netherlands, Portugal, Spain, Sweden and UK the latest date to fully comply
with the Directive was 31/12/2005.
For the new Member States in Central and Eastern Europe and in the Mediterranean,
staged transitional periods have been set within the Accession Treaties; In principle these
transitional periods do not exceed the year 2015;
Only in Romania, smaller agglomerations (with less than 10,000 p.e.) have to comply with
the Directive by the end of 2018.
10
Visu 11Dec
entr
aliz
ed W
WT
in
Eur
ope
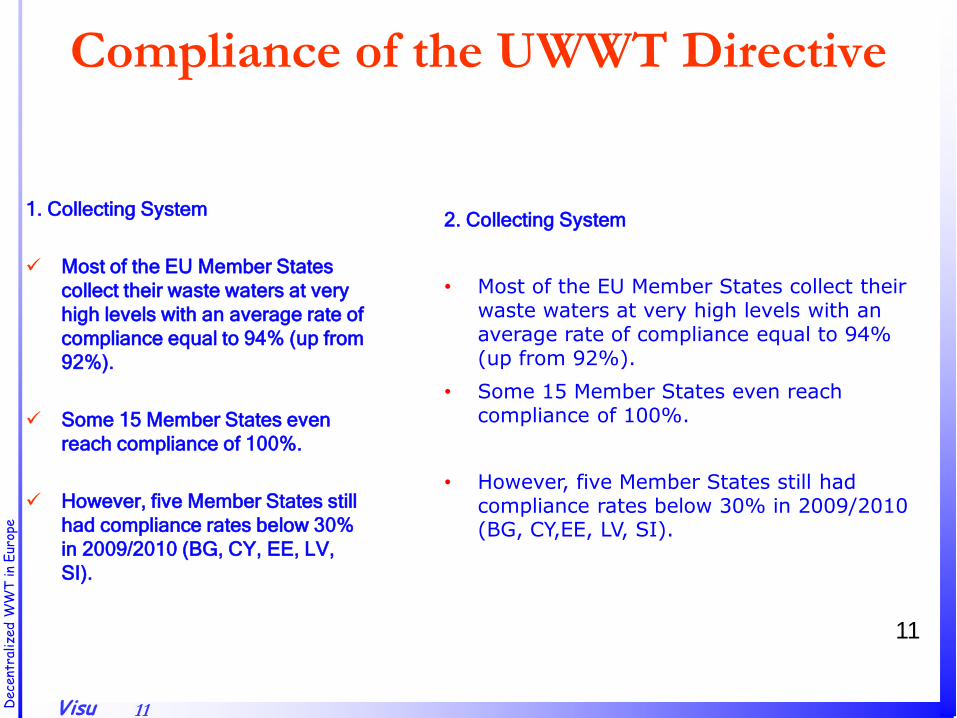
Compliance of the UWWT Directive
1. Collecting System
Most of the EU Member States
collect their waste waters at very
high levels with an average rate of
compliance equal to 94% (up from
92%).
Some 15 Member States even
reach compliance of 100%.
However, five Member States still
had compliance rates below 30%
in 2009/2010 (BG, CY, EE, LV,
SI).
11
2. Collecting System
• Most of the EU Member States collect their waste waters at very high levels with an average rate of compliance equal to 94% (up from 92%).
• Some 15 Member States even reach compliance of 100%.
• However, five Member States still had compliance rates below 30% in 2009/2010 (BG, CY,EE, LV, SI).
Visu 12Dec
entr
aliz
ed W
WT
in
Eur
ope
Compliance of the UWWT Directive
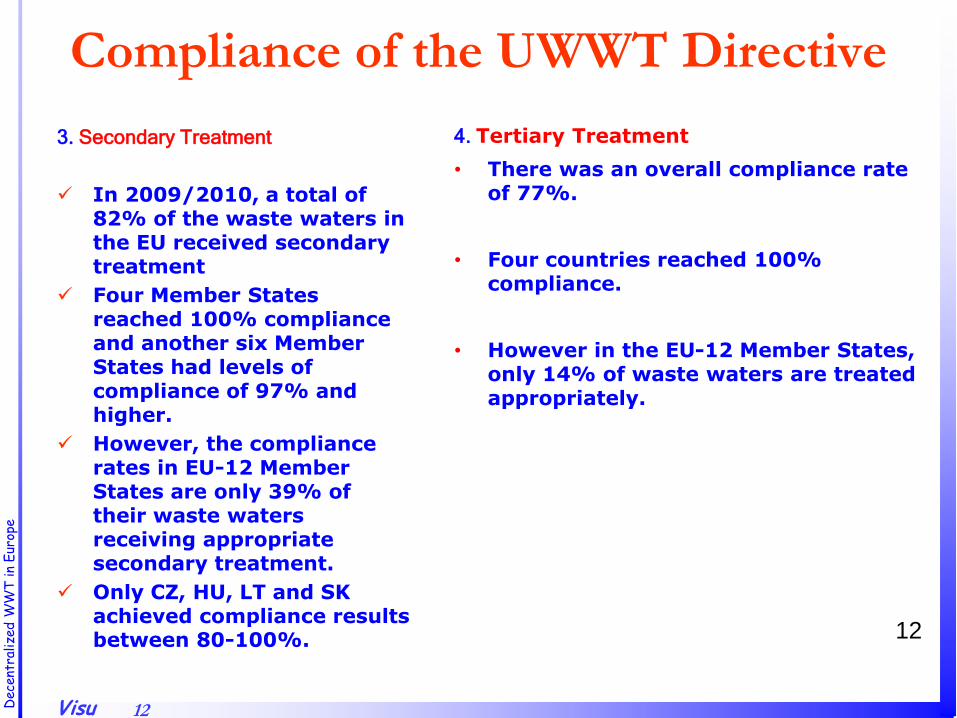
3. Secondary Treatment
In 2009/2010, a total of 82% of the waste waters in the EU received secondary treatment
Four Member States reached 100% compliance and another six Member States had levels of compliance of 97% and higher.
However, the compliance rates in EU-12 Member States are only 39% of their waste waters receiving appropriate secondary treatment.
Only CZ, HU, LT and SK achieved compliance results between 80-100%. 12
4. Tertiary Treatment
• There was an overall compliance rate of 77%.
• Four countries reached 100% compliance.
• However in the EU-12 Member States, only 14% of waste waters are treated appropriately.
Visu 13Dec
entr
aliz
ed W
WT
in
Eur
ope
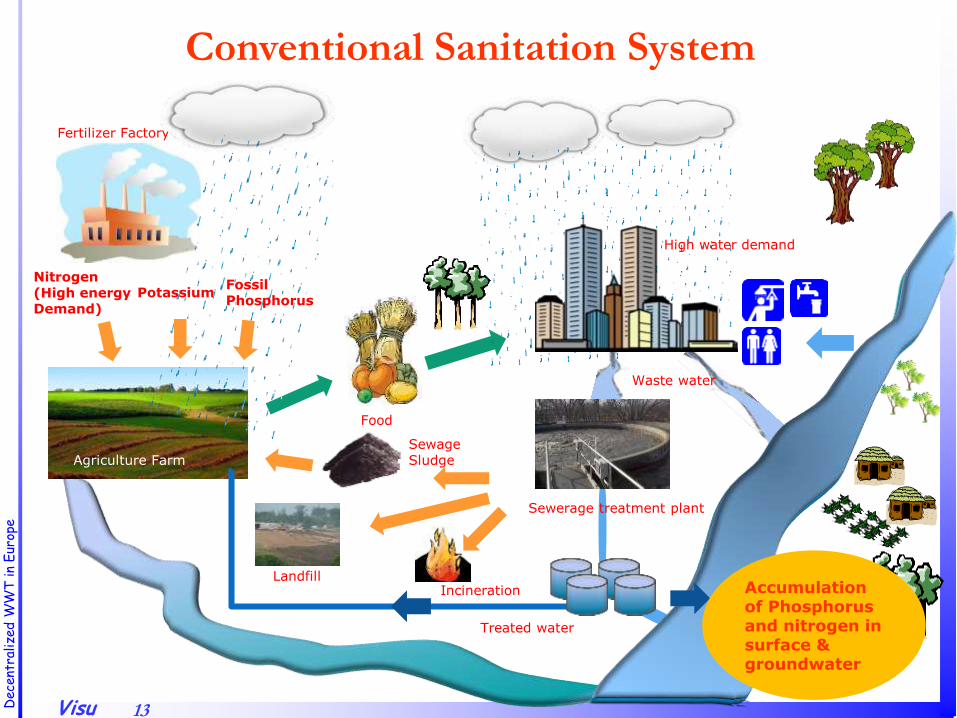
Conventional Sanitation System
Nitrogen(High energy Demand)
Potassium
Fertilizer Factory
Food
Waste water
Sewerage treatment plant
Sewage Sludge
LandfillIncineration
Fossil Phosphorus
High water demand
Treated water
Agriculture Farm
Accumulation of Phosphorus and nitrogen in surface & groundwater

Visu 14Dec
entr
aliz
ed W
WT
in
Eur
ope
Europe Largest WWTP in Paris
Seine Aval treats the wastewater generated by over 75% of the population in the Paris
By 2015 aim to achieve full nitrification and denitrification of effluent in Greater Paris area
Treatment capacity is 2.1 million m3/d
Long distance view of new facility with existing primary treatment works on the left
Grass roof above new sludge treatment works at Seine Aval wastewater treatment plant

Visu 15Dec
entr
aliz
ed W
WT
in
Eur
ope
Advantages
Easy for management in terms of effluent quality and operation
Successfully applied in high density population areas
Thus,
Centralized Treatment System
1970 – 1980 Urban WWTP has Suspended Solids (SS) and Organic Removal as a primary objective

Visu 16Dec
entr
aliz
ed W
WT
in
Eur
ope
High cost in term of maintenance and operation
High cost of investment
Large area requirement
Centralized WWTP is only a part of the solution, and certainly not a sustainable solution…
Disadvantages

Visu 17Dec
entr
aliz
ed W
WT
in
Eur
ope
Population Density Map of Asia
Asia Vs Europe Population Distribution
Population is concentrated on cities
Cities are outstretched and people are moving away from
the city
Population Density Map of Europe
World Population Distribution

Visu 18Dec
entr
aliz
ed W
WT
in
Eur
ope
Urban Growth Pattern in Asia

Visu 19Dec
entr
aliz
ed W
WT
in
Eur
ope
Urban Sprawl Spatial Patterns:
Europe

Visu 20Dec
entr
aliz
ed W
WT
in
Eur
ope
Comparison: Asia Vs Europe

Visu 21Dec
entr
aliz
ed W
WT
in
Eur
ope
Urban sprawl spatial patterns

Visu 22Dec
entr
aliz
ed W
WT
in
Eur
ope
Vertical Growth in Asia
Sewer capacity
Sewer line length
Urban Growth Pattern

Visu 23Dec
entr
aliz
ed W
WT
in
Eur
ope
Out Structured Growth in Europe
Sewer capacity
Sewer line length

Visu 24Dec
entr
aliz
ed W
WT
in
Eur
ope
Drivers As the effluent standards changed
“from organic and SS removal to Nutrient removal”
Diversity of wastewaters and specific requirements in each case
i.e.: Toxic industrial wastewaters Vs Domestic wastewater which needs separate treatment technologies
Difficulties of handling large volumes with specific treatment systems
Reuse: Centralized becomes less attractive due to several reasons
i.e: Reuses someone's waste?
Treatment technology became more complex , This complexity demanded new WWTP technologies, making centralized WWTP un-attractive..

Visu 25Dec
entr
aliz
ed W
WT
in
Eur
ope
Sustainable Sanitation System
Visu 26Dec
entr
aliz
ed W
WT
in
Eur
ope
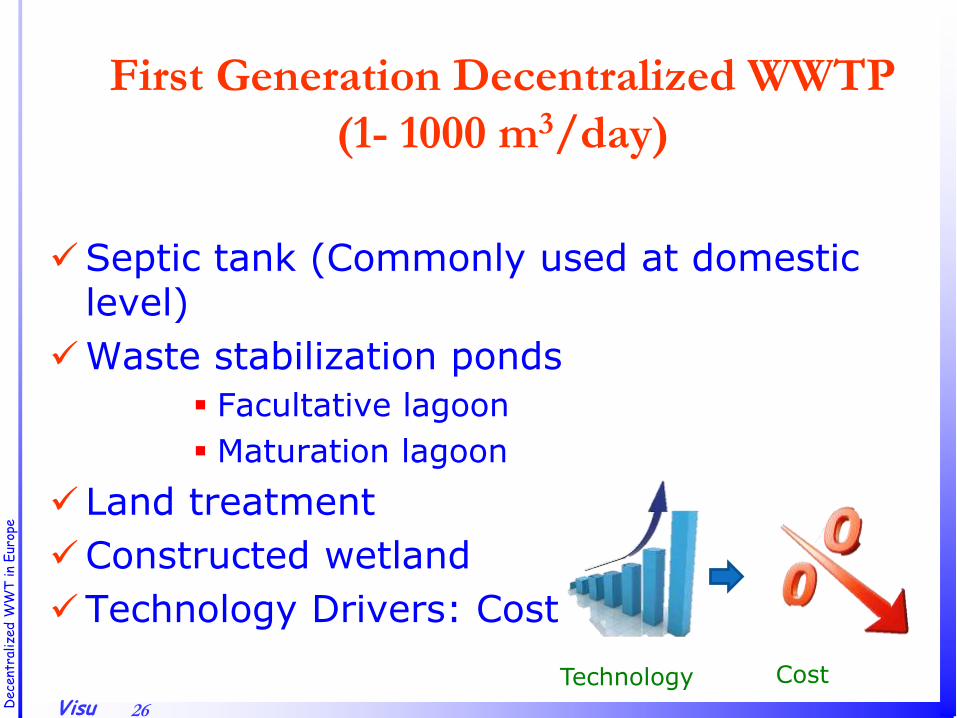
First Generation Decentralized WWTP
(1- 1000 m3/day)
Septic tank (Commonly used at domestic level)
Waste stabilization ponds
Facultative lagoon
Maturation lagoon
Land treatment
Constructed wetland
Technology Drivers: Cost
CostTechnology

Visu 27Dec
entr
aliz
ed W
WT
in
Eur
ope
Constructed Wetlands at Greenmount Campus, Cafre
Septic Tank in Bulgaria Waste Stabilization Ponds in France
Constructed Wetland on RisdalFarm, Bear Creek, Iowa.

Visu 28Dec
entr
aliz
ed W
WT
in
Eur
ope
Water Reuse Water-Quality Requirements
Concerns for emerging pathogenic organisms
(e.g., the protozoan parasites Cryptosporidium
Parvum and Giardia lamblia)
Drivers for MBR
Incompetence of centralized conventional systems to tackle these requirements
Decentralized WWTP with membrane technology is capable of meeting the requirement
Visu 29Dec
entr
aliz
ed W
WT
in
Eur
ope
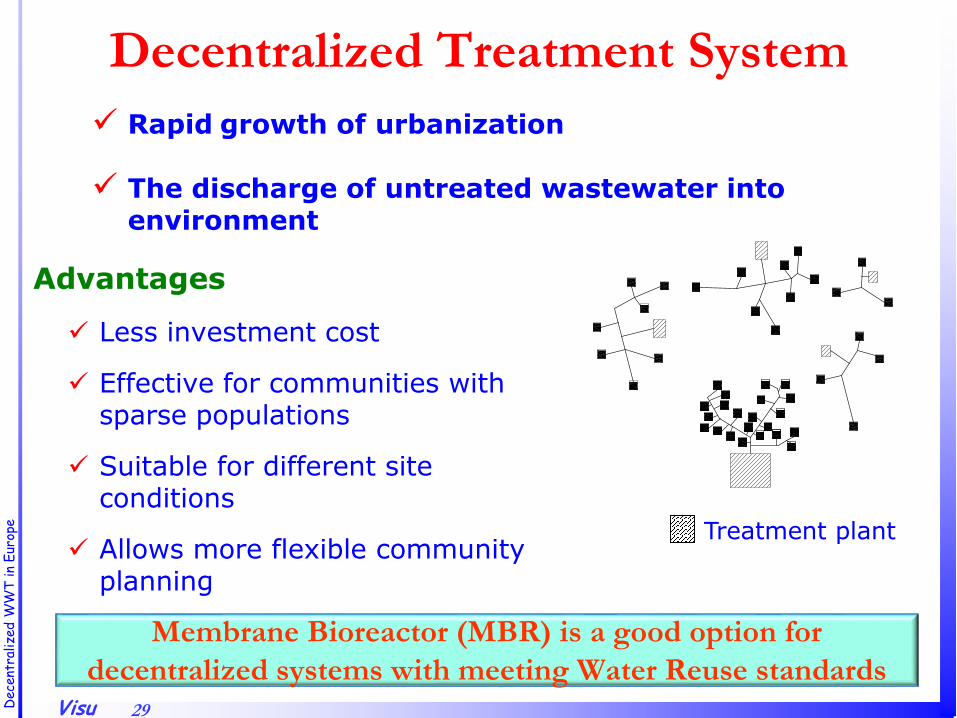
Rapid growth of urbanization
The discharge of untreated wastewater into environment
Treatment plant
Decentralized Treatment System
Advantages
Less investment cost
Effective for communities with sparse populations
Suitable for different site conditions
Allows more flexible community planning
Membrane Bioreactor (MBR) is a good option for
decentralized systems with meeting Water Reuse standards

Visu 30Dec
entr
aliz
ed W
WT
in
Eur
ope
Membrane Bioreactor (MBR)
Influent
Sludge returned
Aeration Tank
Sludge
storage
Clarifier
Excess
sludge
Effluent
Influent
Membrane
unit

Visu 31Dec
entr
aliz
ed W
WT
in
Eur
ope
MBRs in Europe
Oxford wastewater treatment plant
HUBER MBR, Germany
MBR plant Nordkanal, Germany

Visu 32Dec
entr
aliz
ed W
WT
in
Eur
ope
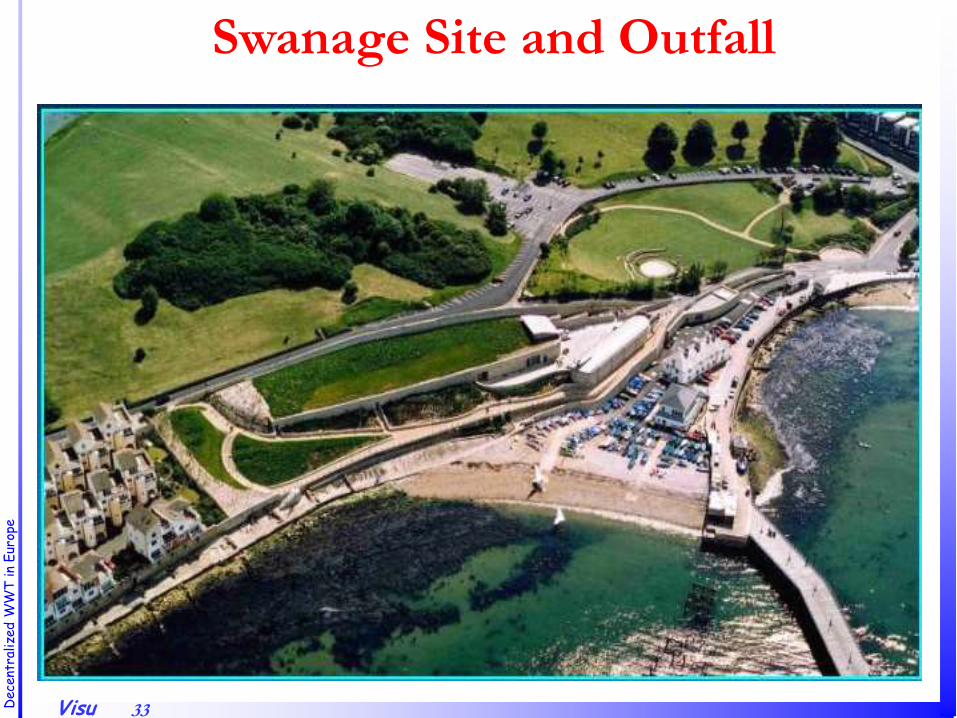
Open Wastewater Plant cannot be located in a place where tourists are visiting
Swanage Bay
The old pier at
Swanage
Swanage Pier
Visu 33Dec
entr
aliz
ed W
WT
in
Eur
ope
Swanage Site and Outfall

Visu 34Dec
entr
aliz
ed W
WT
in
Eur
ope

Visu 35Dec
entr
aliz
ed W
WT
in
Eur
ope
Swanage Site and Outfall
Main process flow
MCC room, Generator,
Extractor fans
Inlet works
screens

Visu 36Dec
entr
aliz
ed W
WT
in
Eur
ope
Kubota System Layout
0.4 m polyethylene flat sheets welded to backing plate
Situated above diffuser below which air is injected

Visu 37Dec
entr
aliz
ed W
WT
in
Eur
ope
Global Overview Global MBR market is worth $ 420.9 million in 2006
with a Compound Annual Growth Rate (CAGR) of 12.5%
European market, continues to be one of the significant markets and accounts for a 21% share of the total MBR market.
Source: Research conducted by Environment & Building Technologies at Frost & Sullivan Frost & Sullivan
Easten
Europe,
14%
Southern
Europe,
36%
North
Europe,
50%
Easten Europe
Southern Europe
North Europe
European Membrane Bioreactor Market-Revenue Share Estimates by Geographic Region (2006)

Visu 38Dec
entr
aliz
ed W
WT
in
Eur
ope
Revenue Forecast for Global Membrane Bioreactor
Market, 2003-2013
0
5
10
15
20
25
0
200
400
600
800
1000
1200
Annual GrowthRate %
Million $Revenue($milion)Growth Rate p.a(%)
Source: Research conducted by Environment & Building Technologies at Frost & Sullivan

Visu 39Dec
entr
aliz
ed W
WT
in
Eur
ope
Key Drivers in the Worldwide Market Legislation to curb water pollution and water scarcity
prompting the need for wastewater recycling
Diverse need and application
Water recycling in buildings, municipal wastewater treatment for small communities
Industrial wastewater treatment and landfill leachate treatment
Treatment of wastes generated from agricultural sources and livestock operations
Wastewater originating from food processing industries, removal of herbicides and pesticides and biological nitrate removal
Sports stadiums, shopping complexes and office blocks are becoming typical end users, especially in areas of water stress.

Visu 40Dec
entr
aliz
ed W
WT
in
Eur
ope
Status of MBR in Europe
< 100 membrane bioreactor (MBR) systems installed in 2000
Projected annual market growth of 7.9%
Boasts over 350 employed in municipal and industrial wastewater applications

Visu 41Dec
entr
aliz
ed W
WT
in
Eur
ope
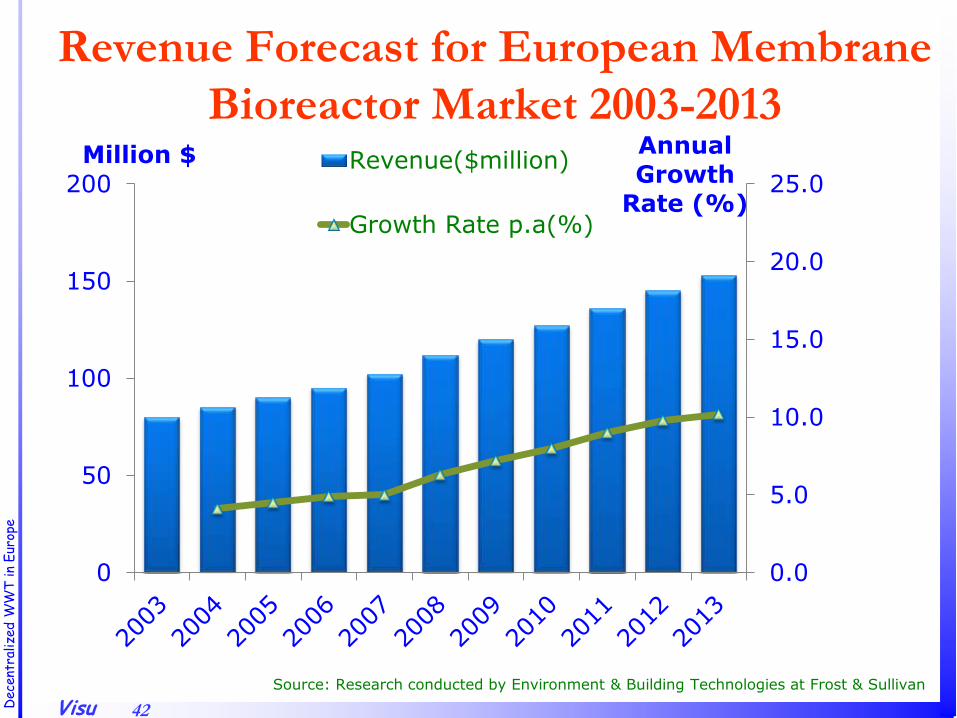
Drivers and TrendsEuropean MBR market @ $100 million in 2010
One key trend driving this growth is increasing use of MBR systems for decentralized treatment and water reuse
Characterized by medium- and small-sized municipal and industrial MBR systems
Source: Research conducted by Environment & Building Technologies at Frost & Sullivan
Reverse Osmosis 50%
Other10%
Microfiltration 10%
UltraFiltration30%
Market Share of Various Membrane Separation Process in Europe
Visu 42Dec
entr
aliz
ed W
WT
in
Eur
ope
Revenue Forecast for European Membrane
Bioreactor Market 2003-2013
Source: Research conducted by Environment & Building Technologies at Frost & Sullivan
0.0
5.0
10.0
15.0
20.0
25.0
0
50
100
150
200
Annual Growth
Rate (%)
Million $ Revenue($million)
Growth Rate p.a(%)

Visu 43Dec
entr
aliz
ed W
WT
in
Eur
ope
Trends
Traditionally, although Scandinavia has been the home of advanced wastewater and sludge treatment systems, acceptance of MBR has lagged with virtually zero penetration in this region. Apart from a few small systems installed by Kubota,
Since 1999, Companies such as Zenon and Kubota have been leading the implementation
of large- and medium-scale MBRs for municipal wastewater treatment in the UK, Germany,
France, Italy, the Netherlands and Spain among other countries
The Northern European MBR market is dominated by activity in the municipal sector
• first full-scale commercial MBR was installed in Hungary in 2003• There are now 10 MBR plants in Hungary, four of them municipal plants• Poland is a growing market that only came online with MBR systems since 2006.
More demand for MBR systems from the industrial sector, This region dominates the overall European MBR market with a revenue share of 50%.
The dominant driver for this region is water scarcity prompting a need for wastewater recycling.
Source: Research conducted by Environment & Building Technologies at Frost & Sullivan
Visu 44Dec
entr
aliz
ed W
WT
in
Eur
ope
Trends cont.
Accession to the European Union also has catalyzed MBR opportunities in countries such as Cyprus
Cyprus which has recently joined and is the focus of significant investment in water and wastewater treatment infrastructure upgrades
Among the Alpine countries of Austria and Switzerland, mostly the focus is on medium-sized industrial and municipal MBR systems
There are limited opportunities in this saturated market unless demand arises for small household wastewater treatment systems in remote areas.

Visu 45Dec
entr
aliz
ed W
WT
in
Eur
ope
Drivers
Number of discrete and small systems are
growing and this trend is expected to be
driven by the following factors:
Experience gained with pilot/small-scale projects
Drastic decrease in the cost of membranes
Availability of subsidies
Small footprint and small reactor volume
Development of guarantees on membrane life spans
and of maintenance contracts.

Visu 46Dec
entr
aliz
ed W
WT
in
Eur
ope
Other Drivers MBR markets have received a huge boost in the municipal
segment with legislative drivers such as the Urban Wastewater Treatment Directive (UWWTD) requiring lower nutrient discharge limits
Implementation of Integrated Pollution Prevention Control (IPPC) policies have catalyzed growth of the MBR markets for the industrial sector
The ceiling for discharge is even more severe in the designated “Sensitive Areas” and improvements in membrane performance have resulted in high treatment efficiencies with MBR use
MBR also gains an edge over conventional systems with its ability to substantially reduce the amount of sludge generated
The largest industrial MBR system in Europe in terms of installed capacity is currently installed at a petrochemical facility in Italy,
with a capacity of 47,420 m3/day. Also there’s an increasing trend toward use of MBRs to treat difficult wastewater such as landfill
leachate treatment applications.
Visu 47Dec
entr
aliz
ed W
WT
in
Eur
ope
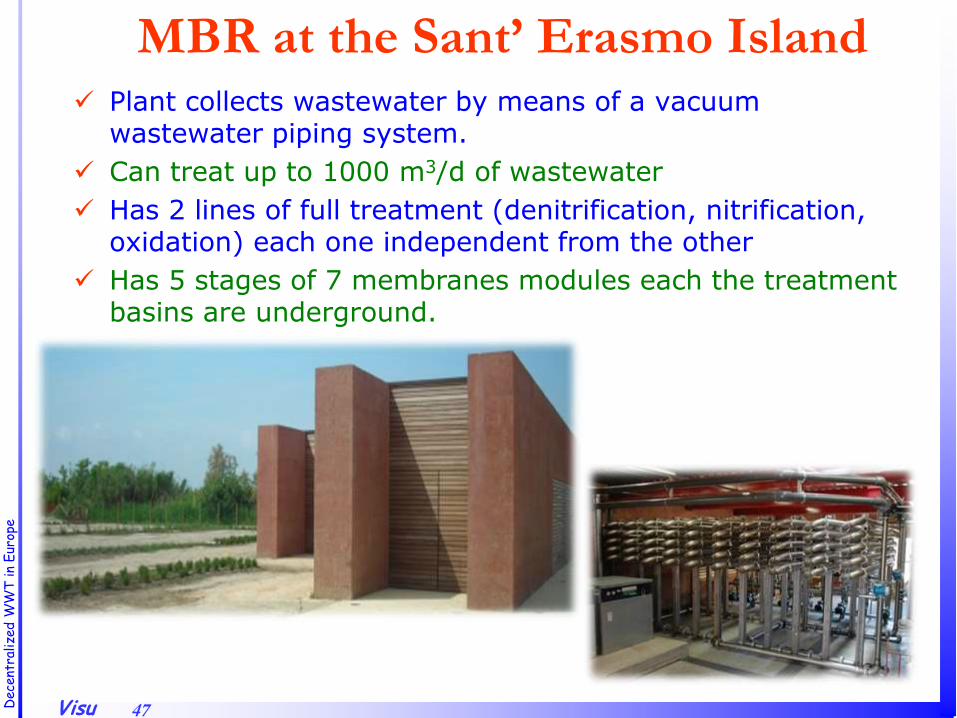
MBR at the Sant’ Erasmo Island Plant collects wastewater by means of a vacuum
wastewater piping system.
Can treat up to 1000 m3/d of wastewater
Has 2 lines of full treatment (denitrification, nitrification, oxidation) each one independent from the other
Has 5 stages of 7 membranes modules each the treatment basins are underground.

Visu 48Dec
entr
aliz
ed W
WT
in
Eur
ope
Remote Control System of the Treatment
Plants of the Venice
The remote control system (SisTeMAV) allows to control the state of operation of each plant within Venice and the islands in lagoon
Electrical, analogical and digital signals from each equipment and instrumentation of the plants are monitored and transmitted by GSM network
Monitoring all plants
through GSMVenice
Sant’ Erasmo
Burano
Visu 49Dec
entr
aliz
ed W
WT
in
Eur
ope
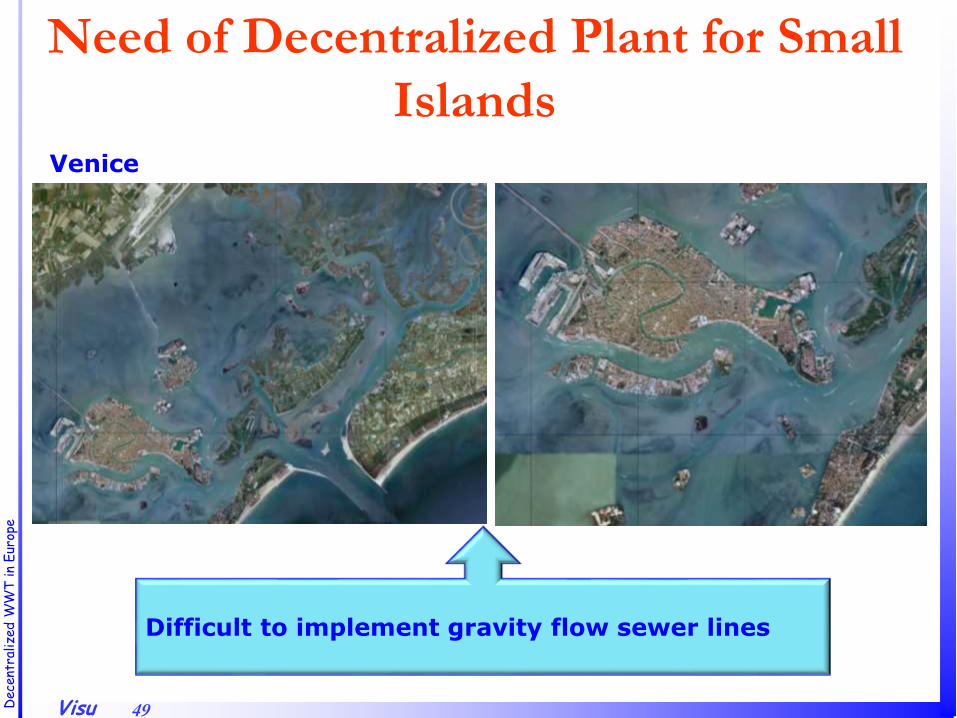
Need of Decentralized Plant for Small
Islands
Difficult to implement gravity flow sewer lines
Venice

Visu 50Dec
entr
aliz
ed W
WT
in
Eur
ope
High-tech Vs Low-tech
MBR Concept
Eco-Sanitation
High-tech Low-tech
Still Popular
in Europe

Visu 51Dec
entr
aliz
ed W
WT
in
Eur
ope
Eco-Sanitation
Save water
Recycle local nutrient
Extract energy
Open sustainable options for all both in rich
and poor countries
Ecology
Visu 52Dec
entr
aliz
ed W
WT
in
Eur
ope
Advantages of Eco-San
Reduce the cost for pipe lines
Can provide sustainable sanitary system
at an affordable cost
Flexible
Increase health and dignity by introducing
new method to handle fecal matter
Recycling and saving resources
Water saving by using water saving toilets
and reuse grey water

Visu 53Dec
entr
aliz
ed W
WT
in
Eur
ope
Technologies
Urine Diversion Toilets
Composting Toilets

Visu 54Dec
entr
aliz
ed W
WT
in
Eur
ope
Sweden Urine diversion is using in several urban houses
such as,
Palsternackan(50 apartment)
Understenshojden(44 apartment)
Geber(30 apartment)
Newest Kullan(250 apartment)
Black water and household organic waste are used
for Biogas production
Grey water is treated in a natural system
Visu 55Dec
entr
aliz
ed W
WT
in
Eur
ope
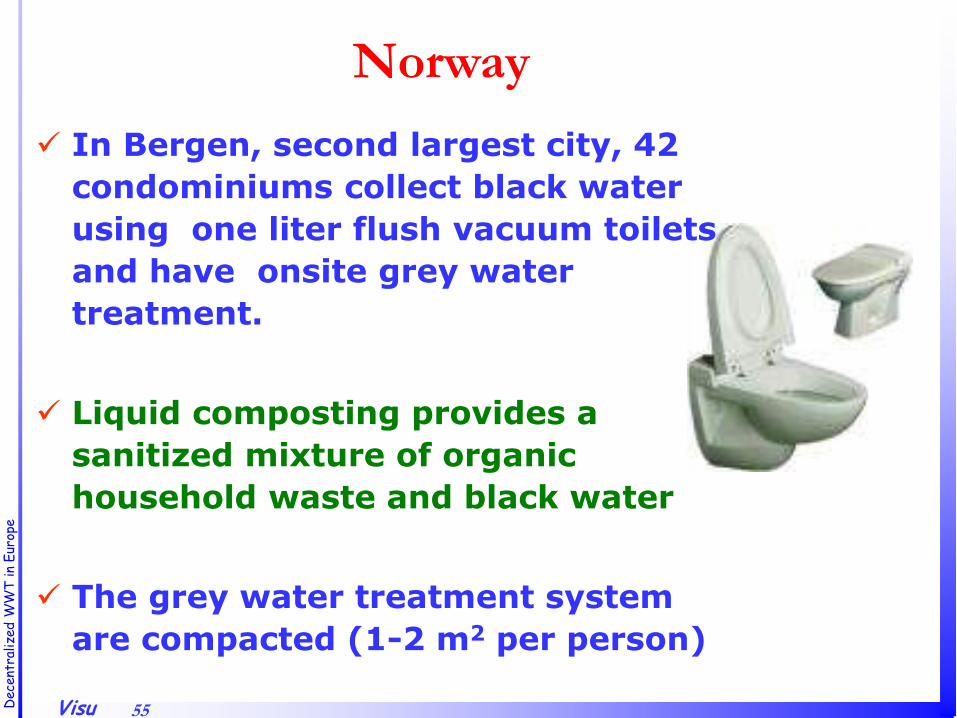
In Bergen, second largest city, 42
condominiums collect black water
using one liter flush vacuum toilets
and have onsite grey water
treatment.
Liquid composting provides a
sanitized mixture of organic
household waste and black water
The grey water treatment system
are compacted (1-2 m2 per person)
Norway

Visu 56Dec
entr
aliz
ed W
WT
in
Eur
ope
Toilet in City Centrum with a view…And they constitute a substantially small package of world inhabitants

Visu 57Dec
entr
aliz
ed W
WT
in
Eur
ope
Toilet with a View and Natural AC
Smile please….
Raw Practices in Rural

Visu 58Dec
entr
aliz
ed W
WT
in
Eur
ope
Cool.. Stuff…

Visu 59Dec
entr
aliz
ed W
WT
in
Eur
ope
A Bit Ahead…

Visu 60Dec
entr
aliz
ed W
WT
in
Eur
ope