StatTools Guide - Max M. Fisher College of Business instructions.pdf · StatTools Guide . Table of...
19
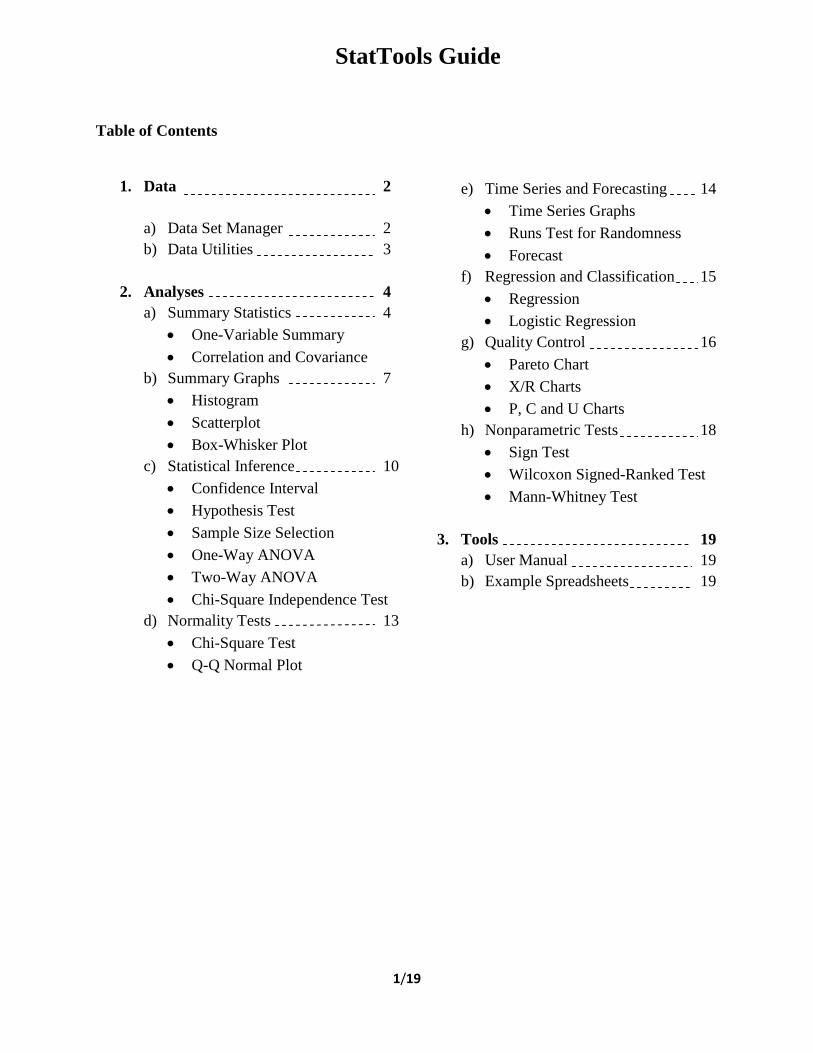
1/19 StatTools Guide Table of Contents 1. Data 2 a) Data Set Manager 2 b) Data Utilities 3 2. Analyses 4 a) Summary Statistics 4 • One-Variable Summary • Correlation and Covariance b) Summary Graphs 7 • Histogram • Scatterplot • Box-Whisker Plot c) Statistical Inference 10 • Confidence Interval • Hypothesis Test • Sample Size Selection • One-Way ANOVA • Two-Way ANOVA • Chi-Square Independence Test d) Normality Tests 13 • Chi-Square Test • Q-Q Normal Plot e) Time Series and Forecasting 14 • Time Series Graphs • Runs Test for Randomness • Forecast f) Regression and Classification 15 • Regression • Logistic Regression g) Quality Control 16 • Pareto Chart • X/R Charts • P, C and U Charts h) Nonparametric Tests 18 • Sign Test • Wilcoxon Signed-Ranked Test • Mann-Whitney Test 3. Tools 19 a) User Manual 19 b) Example Spreadsheets 19
Transcript of StatTools Guide - Max M. Fisher College of Business instructions.pdf · StatTools Guide . Table of...
1/19
StatTools Guide
Table of Contents
1. Data 2
a) Data Set Manager 2 b) Data Utilities 3
2. Analyses 4
a) Summary Statistics 4 • One-Variable Summary • Correlation and Covariance
b) Summary Graphs 7 • Histogram • Scatterplot • Box-Whisker Plot
c) Statistical Inference 10 • Confidence Interval • Hypothesis Test • Sample Size Selection • One-Way ANOVA • Two-Way ANOVA • Chi-Square Independence Test
d) Normality Tests 13 • Chi-Square Test • Q-Q Normal Plot
e) Time Series and Forecasting 14 • Time Series Graphs • Runs Test for Randomness • Forecast
f) Regression and Classification 15 • Regression • Logistic Regression
g) Quality Control 16 • Pareto Chart • X/R Charts • P, C and U Charts
h) Nonparametric Tests 18 • Sign Test • Wilcoxon Signed-Ranked Test • Mann-Whitney Test
3. Tools 19
a) User Manual 19 b) Example Spreadsheets 19
2/19
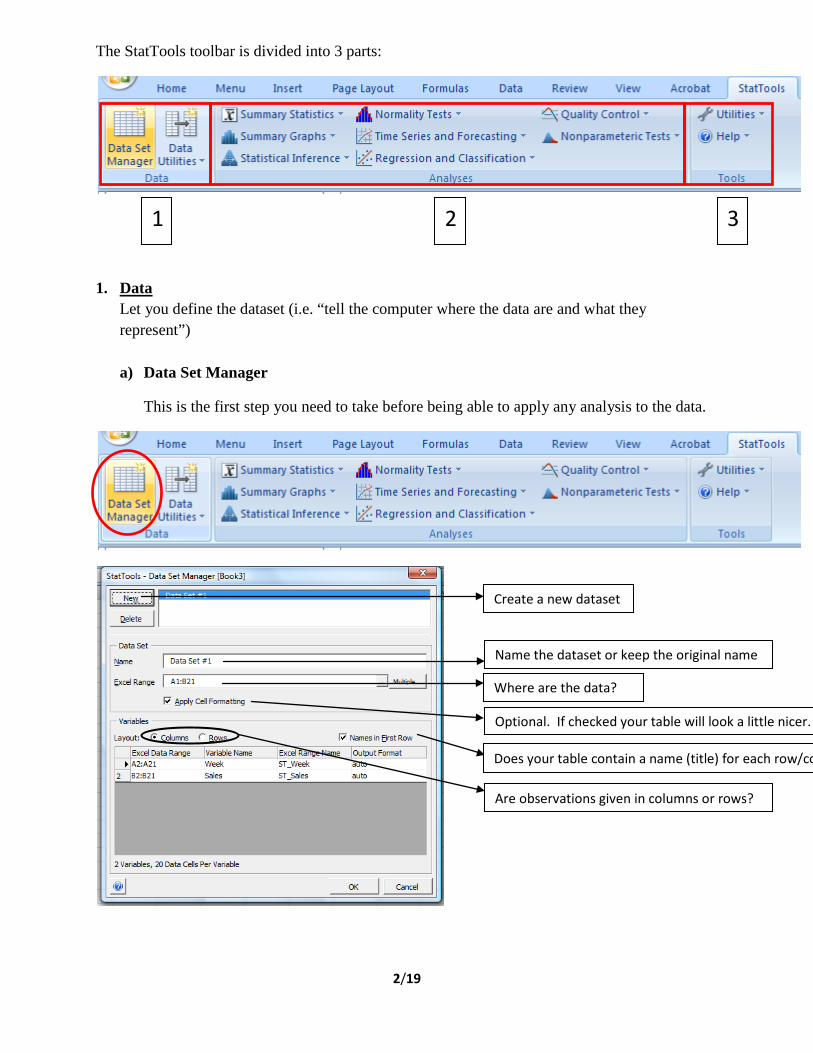
The StatTools toolbar is divided into 3 parts:
1. Data Let you define the dataset (i.e. “tell the computer where the data are and what they represent”) a) Data Set Manager
This is the first step you need to take before being able to apply any analysis to the data.
1 3 2
Create a new dataset
Name the dataset or keep the original name
Where are the data?
Optional. If checked your table will look a little nicer.
Are observations given in columns or rows?
Does your table contain a name (title) for each row/column?

3/19
b) Data Utilities
This is an optional step. It is used only if you want to perform any added treatment to your data (i.e. calculate differences, draw random samples, etc.).
Add calculated columns/rows to your table
Select a random sample out of your population
Group values by category, for example MPG by type of car. You will always be able to stack/unstack your data when asking for analysis so you don’t need to decide right now.
4/19
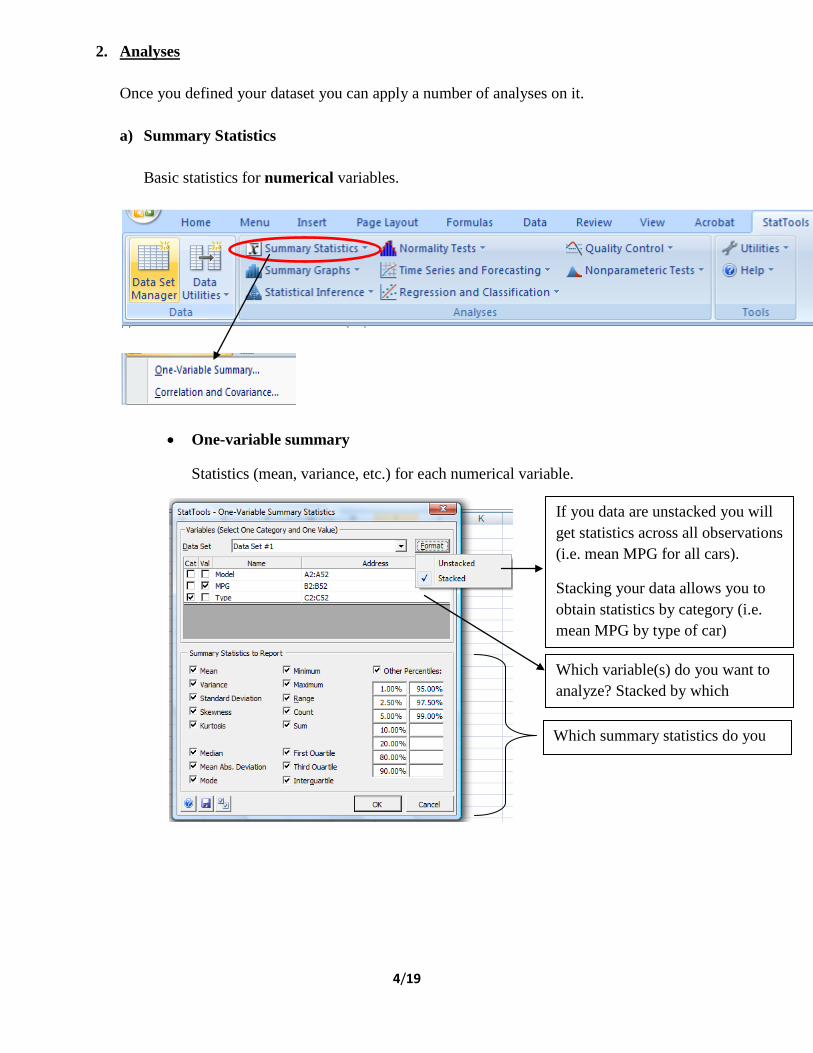
2. Analyses Once you defined your dataset you can apply a number of analyses on it. a) Summary Statistics
Basic statistics for numerical variables.
• One-variable summary
Statistics (mean, variance, etc.) for each numerical variable.
Which summary statistics do you
Which variable(s) do you want to analyze? Stacked by which
If you data are unstacked you will get statistics across all observations (i.e. mean MPG for all cars).
Stacking your data allows you to obtain statistics by category (i.e. mean MPG by type of car)

5/19
Example: One-variable summary for stacked and unstacked variables
Stacked: MPG statistics for all cars Unstacked: MPG statictics for Midsizes and SUVs

6/19
• Correlation and Covariance
Statistics between each pair of numerical variables.
Example: Correlation and Covariance analyses between 3 numerical variables
StatTools (Core Analysis Pack) Analysis: Correlation and Covariance
Performed By: Claire Date: Friday, November 20, 2009
Updating: Live
Age Income Education
Correlation Table Data Set #1 Data Set #1 Data Set #1
Age 1.000 0.084 -0.130 Income 0.084 1.000 -0.111 Education -0.130 -0.111 1.000
Age Income Education
Covariance Table Data Set #1 Data Set #1 Data Set #1
Age 54.822 4.324 -1.921 Income 4.324 48.516 -1.545 Education -1.921 -1.545 4.000
For which pair of variables do you want correlation or covariance?
Correlation or Covariance?
Note: entries above are equal to entries below diagonal (i.e. Cov(A,B)=Cov(B,A))
Note: entries on the diagonal are equal to the variance of each variable (i.e. Cov(A,A)=Var(A))

7/19
b) Summary Graphs
• Histogram
Example: Histogram
Unstacked: one histogram for all data (variable has to be numerical)
Number of bars
Value variable has to be numerical

8/19
• Scatterplot
Example: Scatterplot
0
10
20
30
40
50
60
1975 1980 1985 1990 1995 2000 2005 2010 2015
MPG
/ D
ata
Set #
1
Year / Data Set #1
Scatterplot of MPG vs Year of Data Set #1
Both variables must be numerical
Always unstacked

9/19
• Box-Whisker Plot
Description of Plot Elements
Selected variable must be numerical
Includes the following description
10/19
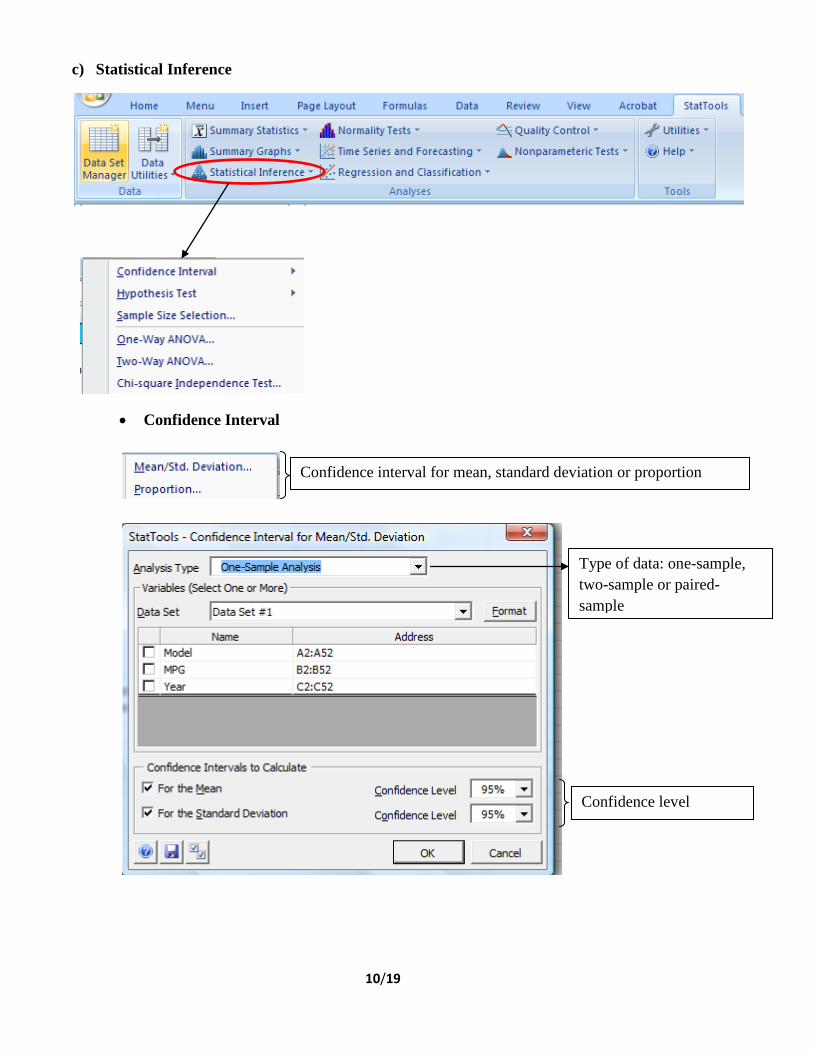
c) Statistical Inference
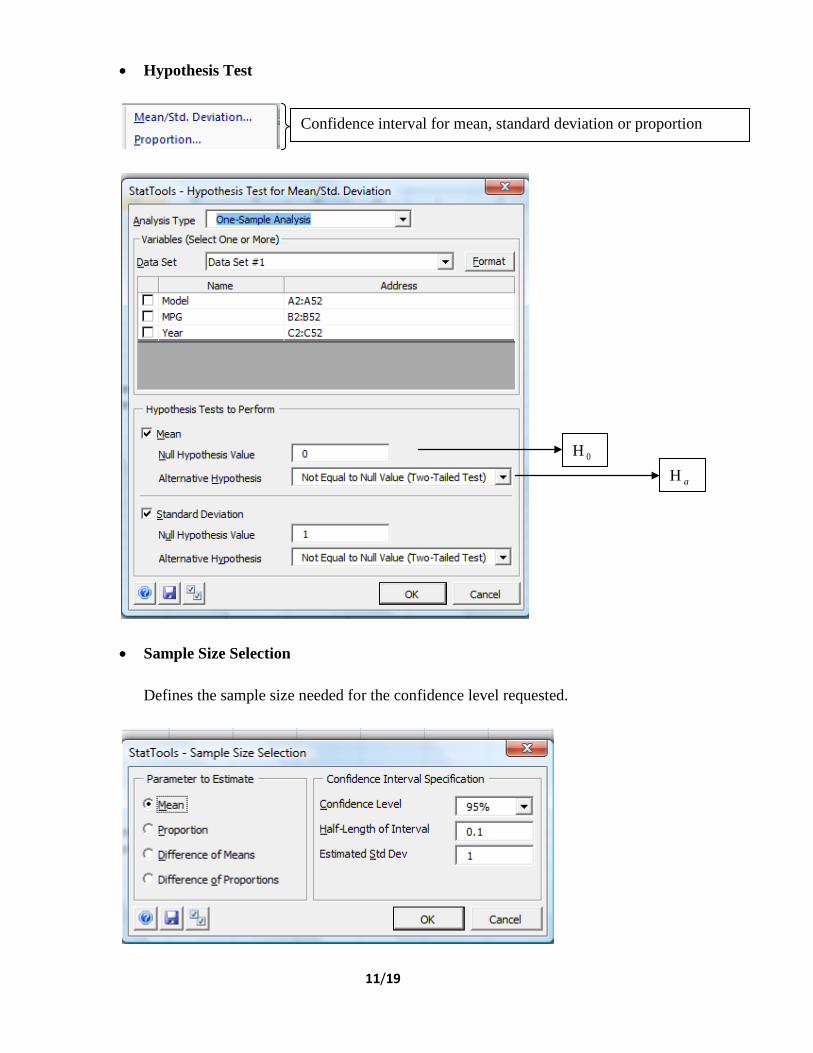
• Confidence Interval
Confidence interval for mean, standard deviation or proportion
Type of data: one-sample, two-sample or paired-sample
Confidence level
11/19
• Hypothesis Test
• Sample Size Selection
Defines the sample size needed for the confidence level requested.
Confidence interval for mean, standard deviation or proportion
H 0
H a

12/19
• One-Way ANOVA Small p-value means that means are different across populations (H 0 : means are equal) If confidence intervals do not contain 0, means are not equal.
• Two-Way ANOVA Variables must be stacked. Two categories and one numerical variable must be selected

13/19
• Chi-Square Independence Test Tests if attribute in rows and attribute in columns are independent from each other. For example if rows are “gender” and columns are “favorite soft drink”, the Chi-square independence test verifies that favorite soft drink is independent from gender. If the p-value is small the attributes are not independent.
d) Normality Tests
• Chi-square Test Compares histogram of data with the histogram had the data been normally distributed. The smaller the p-value is the closer the data are to a normal distribution.
• Q-Q Normal Plot Compares data quantiles with the quantiles had the data been normally distributed. A straight line at a 45 degrees angle means that the data are normal.

14/19
e) Time Series and Forecasting
• Time Series Graph Displays value of a numerical variable across observations.
• Runs Test for Randomness Variables must be unstacked. Indicates if values of a variable seem random. If number of runs above/below mean is significantly different than E(R) (expected number of runs under randomness) observations are not random.

15/19
• Forecast Allows to forecast future observations using different forecasting methods.
f) Regression and Classification

16/19
• Regression
• Logistic Regression Used when response variables is either 0 or 1 (success or failure). Independent variables can be continuous.
g) Quality Control Indicates whether a process is in statistical control.
Multiple considers all independent variables at once.
Other regression types allow each variable to be considered only for a subset of the observations.
17/19
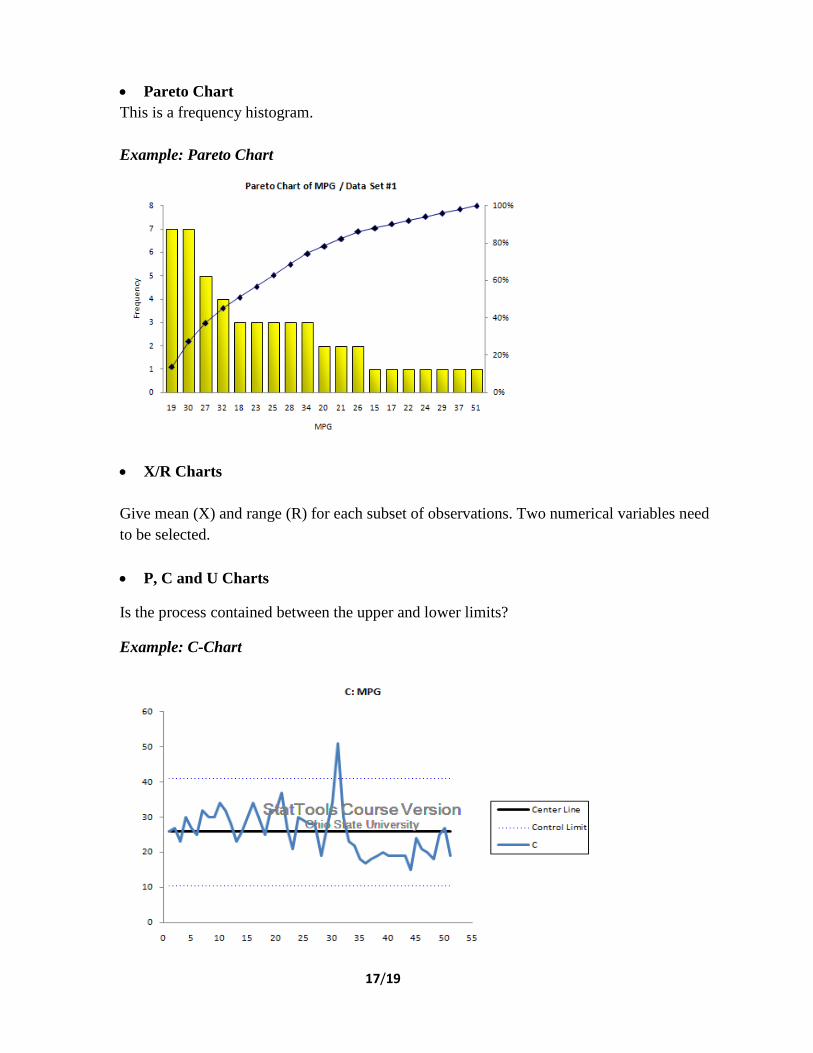
• Pareto Chart This is a frequency histogram. Example: Pareto Chart
• X/R Charts
Give mean (X) and range (R) for each subset of observations. Two numerical variables need to be selected. • P, C and U Charts
Is the process contained between the upper and lower limits?
Example: C-Chart

18/19
h) Nonparametric Tests Used for hypothesis testing about the median when normal distribution is not assumed.
Both Sign and Wilcoxon Signed-Rank tests can be performed for the median of a single variable (one-sample analysis) or for the median of the differences between pairs of variables (paired-sample analysis).
• Sign Test Is the median positive or negative?
• Wilcoxon Signed-Rank Test Assumes that distribution is symmetric (but not necessarily normal).
• Mann-Whitney Test Can only be performed on two samples. Can be used to test whether two samples are issued from the same probability distribution.

19/19
3. Tools
Useful items can be found under the help menu.
a) User Manual
Detailed description of every StatTools item.
b) Example Spreadsheets Examples and explanations of every StatTools analysis.