Early People Jeopardy $100 $200 $300 $400 $500 $100 $200 $300 $400 $500 Final Jeopardy.
Upload
loren-snowCategory
view
218download
0
Stats/Methods I
JEOPARDY

JeopardyValidity Research
StrategiesFrequency Distributions
Descriptive Stats
Grab Bag
$100 $100$100 $100$100
$200 $200 $200 $200 $200
$300 $300
$500$500
$400
$300
$400
$300 $300
$400
$500$500$500
$400$400

Validity--$100
The extent to which a researcher can generalize findings to the population
answer

Validity--$200
The extent to which a researcher can draw a single, unambiguous conclusion from the results
answer

Validity --$300
A study is said to be _______ when an extraneous variable is allowed to vary along with the independent variable.
answer

Validity --$400
An ______ variable is a variable that is not being directly studied, but has the potential of changing along with the independent variable.
answer

Validity -$500
Although tight control over extraneous variables gives you high levels of _____, it may result in low levels of _____.
answer

Strategies & Designs--$100
The goal of this research strategy is to describe a variable as it exists naturally.
answer

Strategies & Designs --$200
The goal of this research strategy is to describe the relationship between two variables as they naturally occur in the environment.
answer
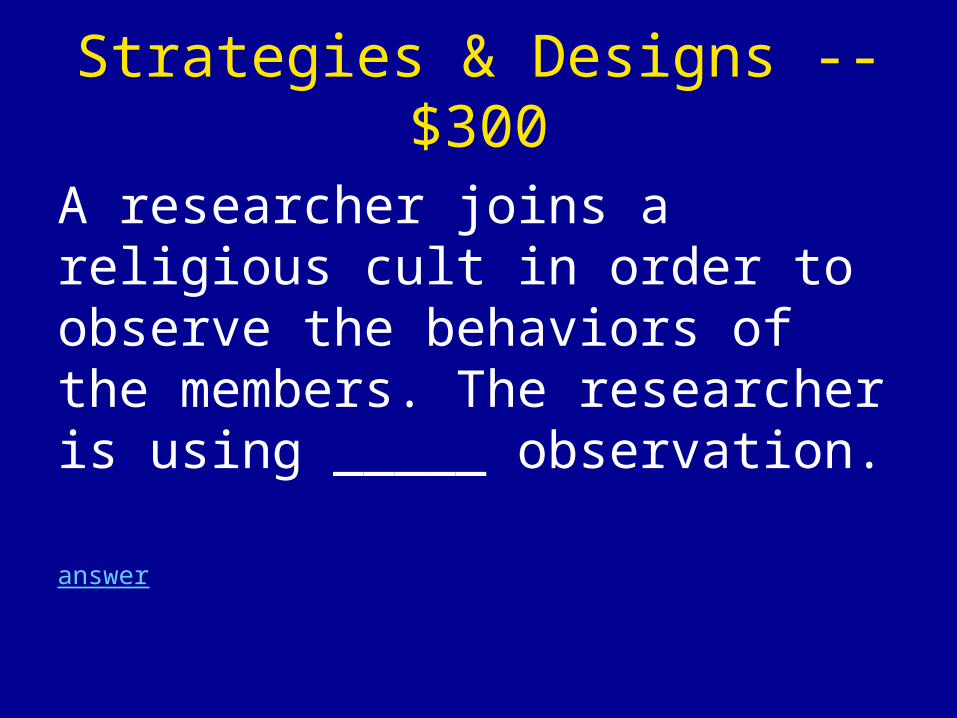
Strategies & Designs --$300
A researcher joins a religious cult in order to observe the behaviors of the members. The researcher is using _____ observation.
answer

Strategies & Designs --$400
This type of research design can be useful for studying unusual clinical cases such as brain injuries.
answer

Strategies & Designs --$500
A researcher systematically varies the amount of caffeine in cola (0, 10, and 20 mg) and observes that his participants’ anxiety levels increase as caffeine amount increases. The 0-mg condition is called the __________.
answer

Frequency Distributions--$100
The simplest frequency distribution consists of these two columns.
answer

Frequency Distributions --$200
The shape of a _____ distribution is perfectly symmetrical.
answer

Frequency Distributions --$300
This is the appropriate type of chart (or visual) for discrete data.
answer

Frequency Distributions --$400
These two types of charts appropriately represent data from continuous variables.
answer
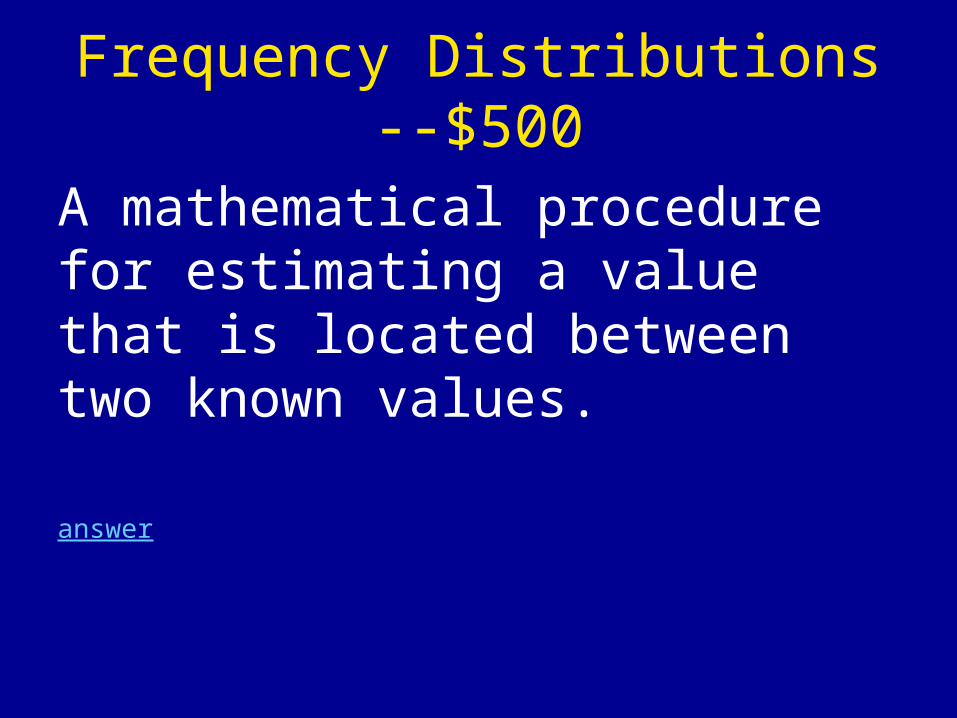
Frequency Distributions --$500
A mathematical procedure for estimating a value that is located between two known values.
answer

Descriptive Stats--$100
A statistical measure that determines a single value that accurately describes the typical score of a distribution.
answer

Descriptive Stats--$200
This measure of central tendency is the score at the 50th percentile.
answer

Descriptive Stats --$300
This measure of variability measures the average distance between scores and the mean.
answer

Descriptive Stats --$400
This measures the average of the squared distances from the mean.
answer

Descriptive Stats --$500
In order to calculate this, take the square root of the population variance.
answer

Grab Bag--$100
The type of correlation that indicates an inverse relationship between two variables.
answer

Grab Bag--$200
In statistical formulas, N represents ______________.
answer

Grab Bag--$300
The only appropriate measure of central tendency for data measured on a nominal scale.
answer

Grab Bag--$400
Percentile ranks correspond to the values in the ______ column of a frequency distribution
answer

Grab Bag--$500
The sum of the deviations from the mean always equal this.
answer
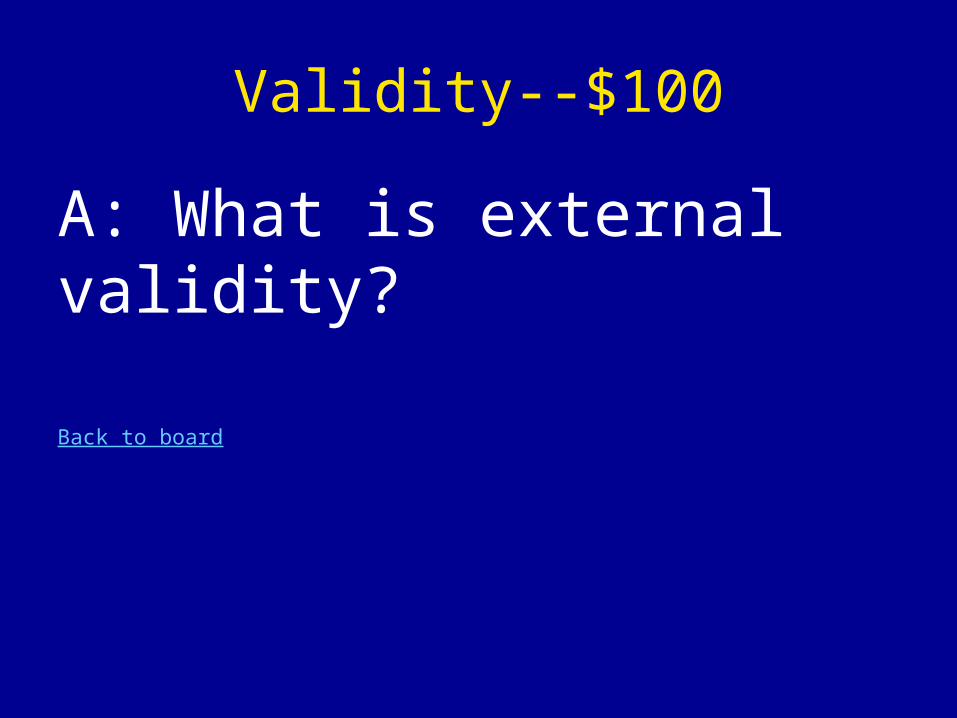
Validity--$100
A: What is external validity?
Back to board

Validity--$200
A: What is internal validity?
Back to board

Validity--$300
A: What is confounded?
Back to board

Validity--$400
A: What is extraneous?
Back to board

Validity--$500
A: What is internal validity and external validity?
Back to board

Strategies & Designs--$100
A: What is descriptive?
Back to board

Strategies & Designs--$200
A: What is correlational?
Back to board

Strategies & Designs--$300
A: What is participant observation?
Back to board
Strategies & Designs--$400
A: What is the case study?
Back to board
Strategies & Designs--$500
A: What is the placebo control group?
Back to board

Frequency Distributions--$100
A: What is score (X) and frequency (f) ?
Back to board

Frequency Distributions--$200
A: What is normal?
Back to board

Frequency Distributions--$300
A: What is a bar graph?
Back to board

Frequency Distributions--$400
A: What are histograms and frequency distribution polygons?
Back to board
Frequency Distributions--$500
A: What is interpolation?
Back to board

Descriptive Stats--$100
A: What is central tendency?
Back to board

Descriptive Stats--$200
A: What is the median?
Back to board

Descriptive Stats--$300
A: What is the standard deviation?
Back to board

Descriptive Stats--$400
A: What is the variance (or mean square)?
Back to board

Descriptive Stats--$500
A: What is population standard deviation?Back to board

Grab Bag--$100
A: What is negative?
Back to board
Grab Bag--$200
A: What is the number of participants/scores in the population?
Back to board

Grab Bag--$300
A: What is the mode?
Back to board

Grab Bag--$400
A: What is cumulative percentage (c%)?
Back to board
Grab Bag--$500
A: What is zero?
Back to board