StatsCraft 2015: Monitoring using riemann - Moshe Zada
63
(Monitoring (and (alerting (with riemann)))) Moshe Zada@Forter 1 / 63
-
Upload
statscraft -
Category
Engineering
-
view
3.385 -
download
4
Transcript of StatsCraft 2015: Monitoring using riemann - Moshe Zada
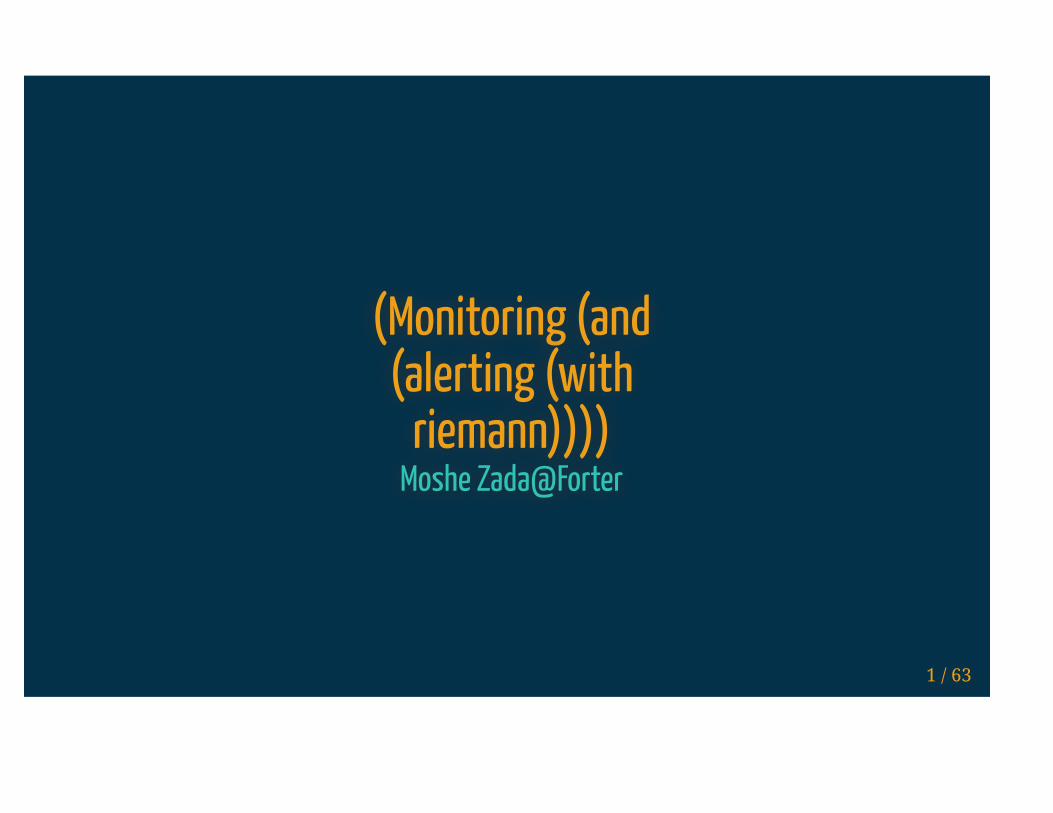
(Monitoring (and
(alerting (with
riemann))))Moshe Zada@Forter
1 / 63
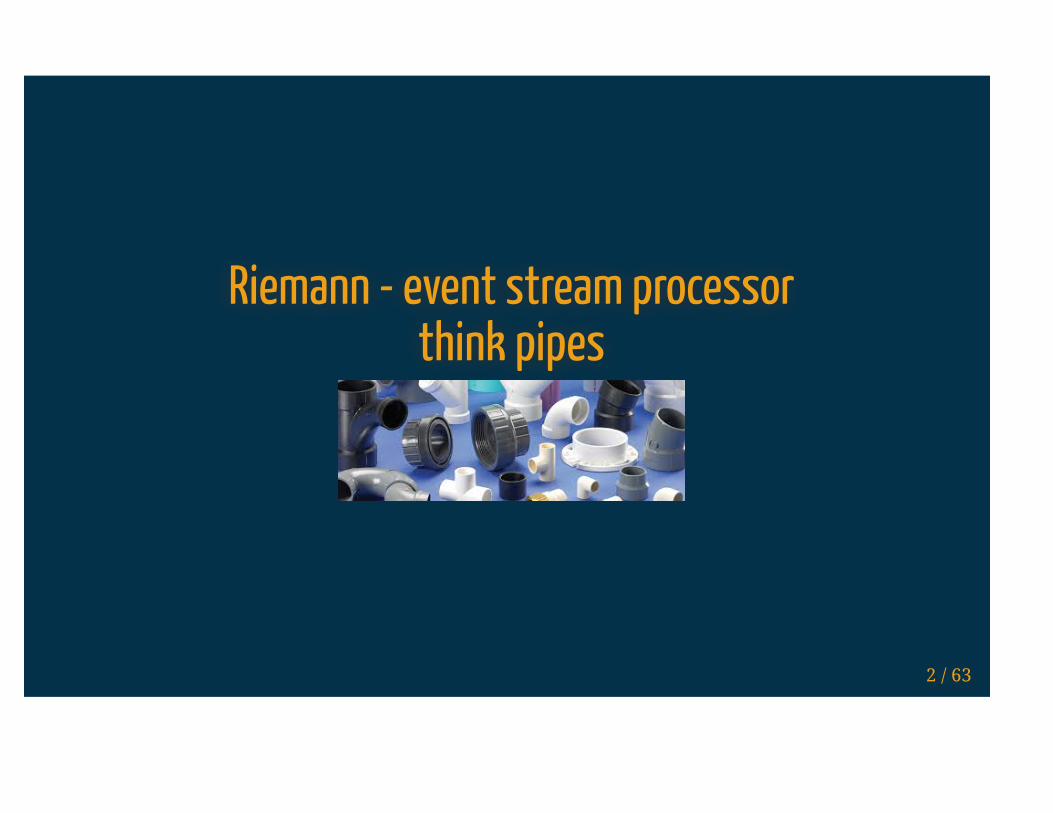
Riemann - event stream processor
think pipes
2 / 63
In the pipeline
Intro
Intro
About Forter
Low latency
3 / 63
In the pipeline
Intro
Basic alerts
Basic Alerts
Implement simple state machine
Throttled alert
Ignore spikes
4 / 63
In the pipeline
Intro
Basic alerts
Visualize
Visualize
Stream to ELK
Event enrichment
Showoff
5 / 63
In the pipeline
Intro
Basic alerts
Visualize
Back to tests
Back to tests
Maintenance mode
Heartbeat alerts
6 / 63
In the pipeline
Intro
Basic alerts
Visualize
Back to tests
Aggregation
Aggregation
Sum/ Count/ Max batch of events
Monitor browser javascript
7 / 63
Lets start
8 / 63
riemann@
forter
Who am I
Moshe Zada
Problem solver@Forter
Responsible for entire monitoring, CI and CD stack among
other stuff
9 / 63
riemann@
forter
Who am I
And where do I
work
Forter
10 / 63

riemann@11 / 63
riemann@
forter
Who am I
And where do I
work
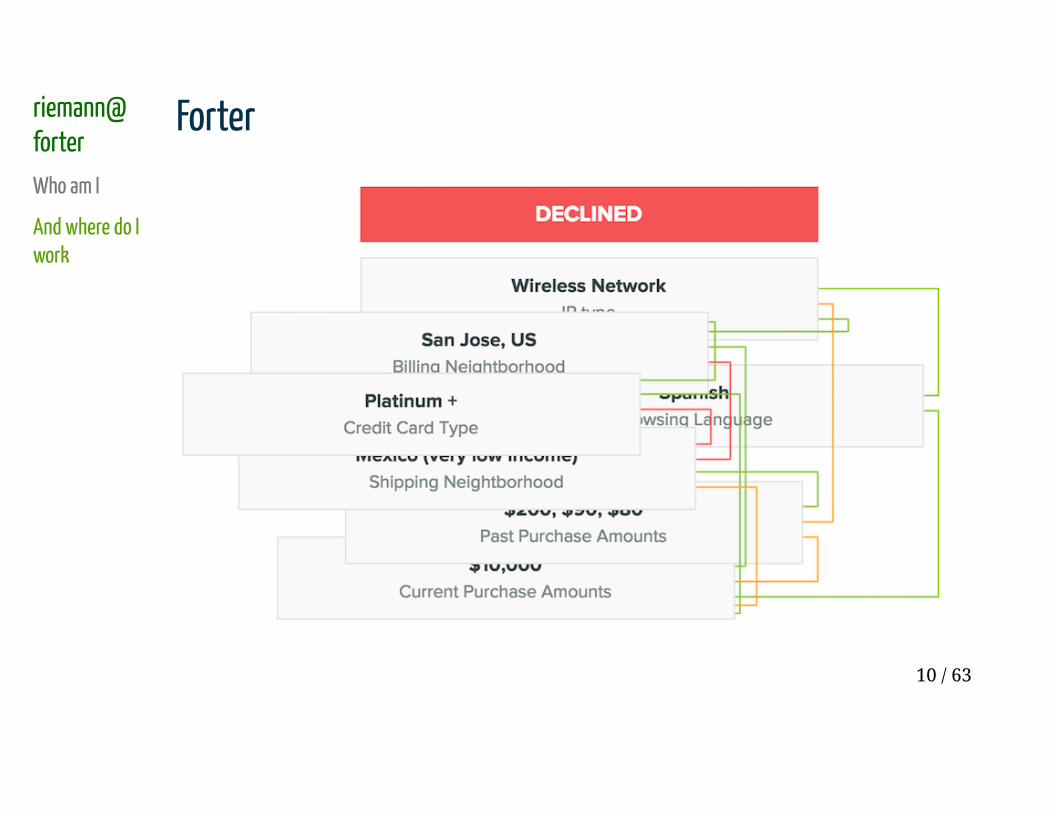
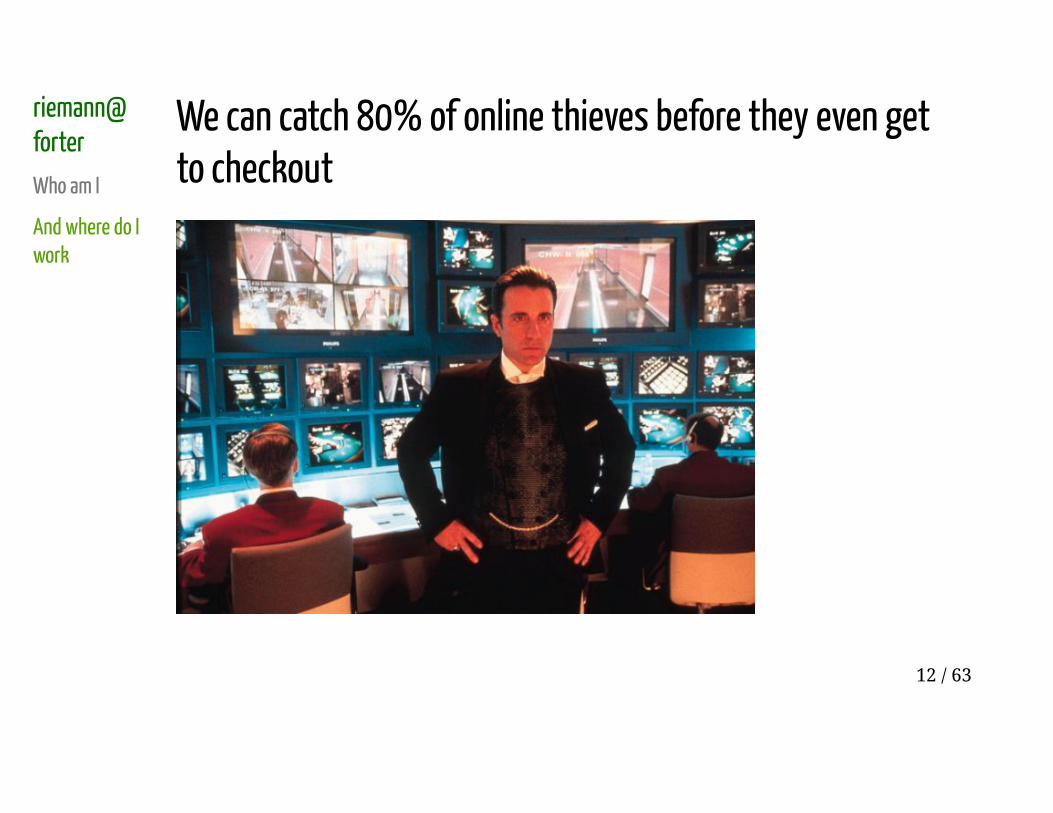
We can catch 80% of online thieves before they even get
to checkout
12 / 63
riemann@
forter
Who am I
And where do I
work
How latency effects forter?
13 / 63
riemann@
forter
Who am I
And where do I
work
Tech
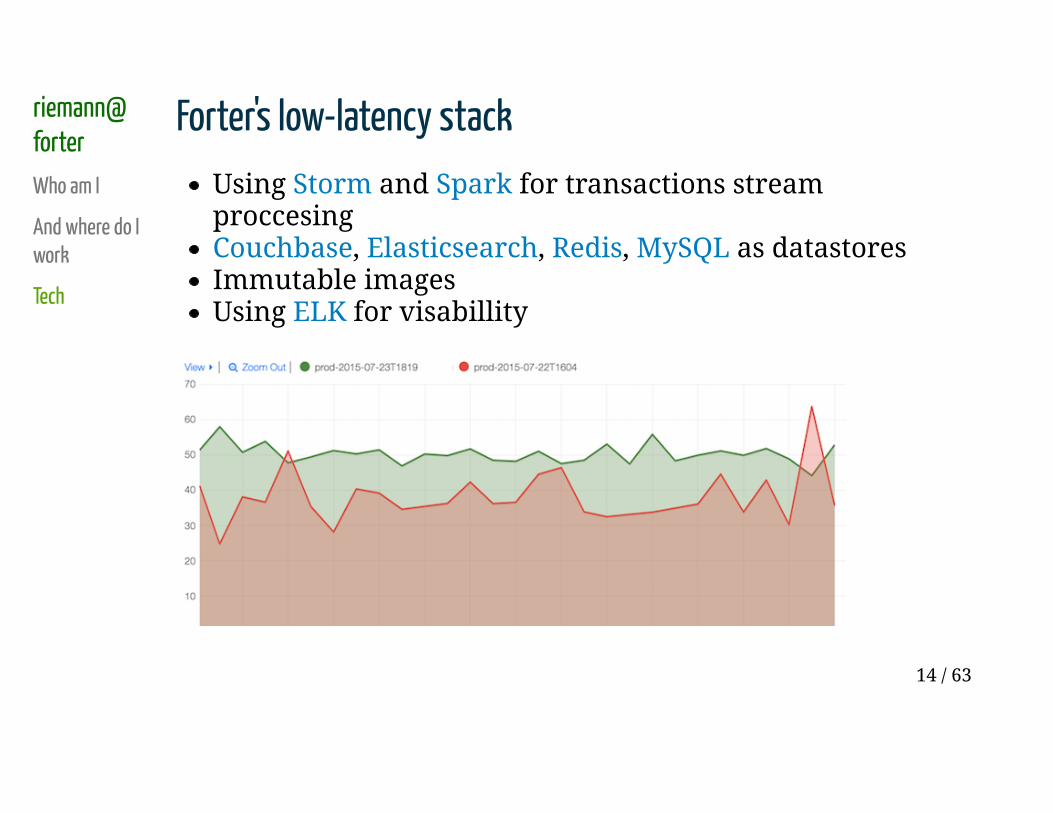
Forter's low-latency stack
Using Storm and Spark for transactions stream
proccesing
Couchbase, Elasticsearch, Redis, MySQL as datastores
Immutable images
Using ELK for visabillity
14 / 63
Riemann - Basic Concepts
15 / 63
Basic Concepts
- Who is behind
riemann?
Who is behind riemann?
16 / 63

Basic Concepts
- Who is behind
riemann?
Who is behind riemann?
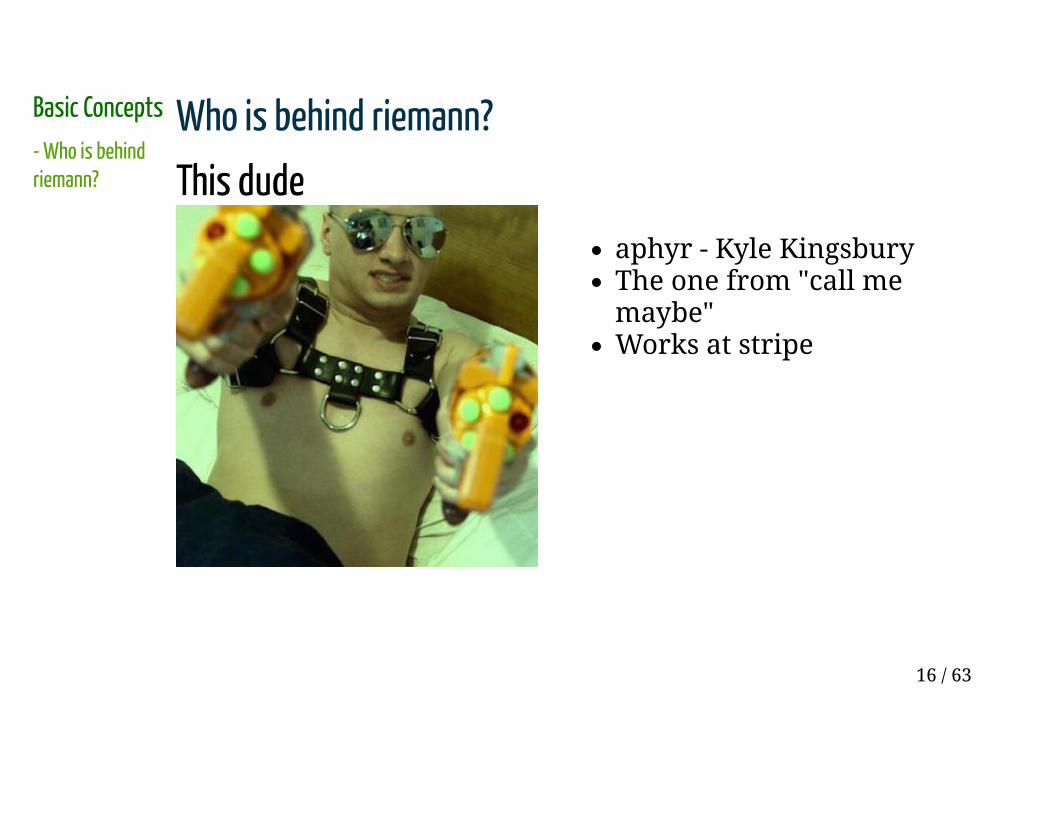
This dude
16 / 63
Basic Concepts
- Who is behind
riemann?
Who is behind riemann?
This dude
aphyr - Kyle Kingsbury
The one from "call me
maybe"
Works at stripe
16 / 63
Basic Concepts
- Who is behind
riemann?
- Event
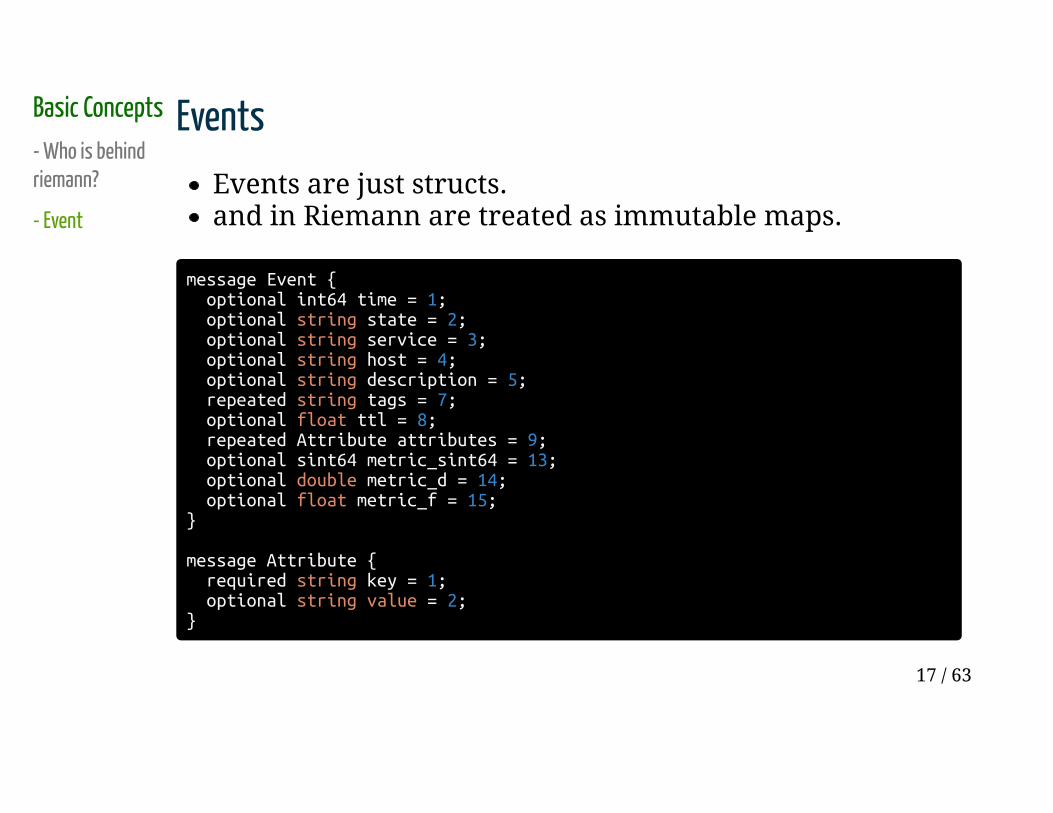
Events
Events are just structs.
and in Riemann are treated as immutable maps.
message Event { optional int64 time = 1; optional string state = 2; optional string service = 3; optional string host = 4; optional string description = 5; repeated string tags = 7; optional float ttl = 8; repeated Attribute attributes = 9; optional sint64 metric_sint64 = 13; optional double metric_d = 14; optional float metric_f = 15;}
message Attribute { required string key = 1; optional string value = 2;}
17 / 63
Basic Concepts
- Who is behind
riemann?
- Event
- Examples
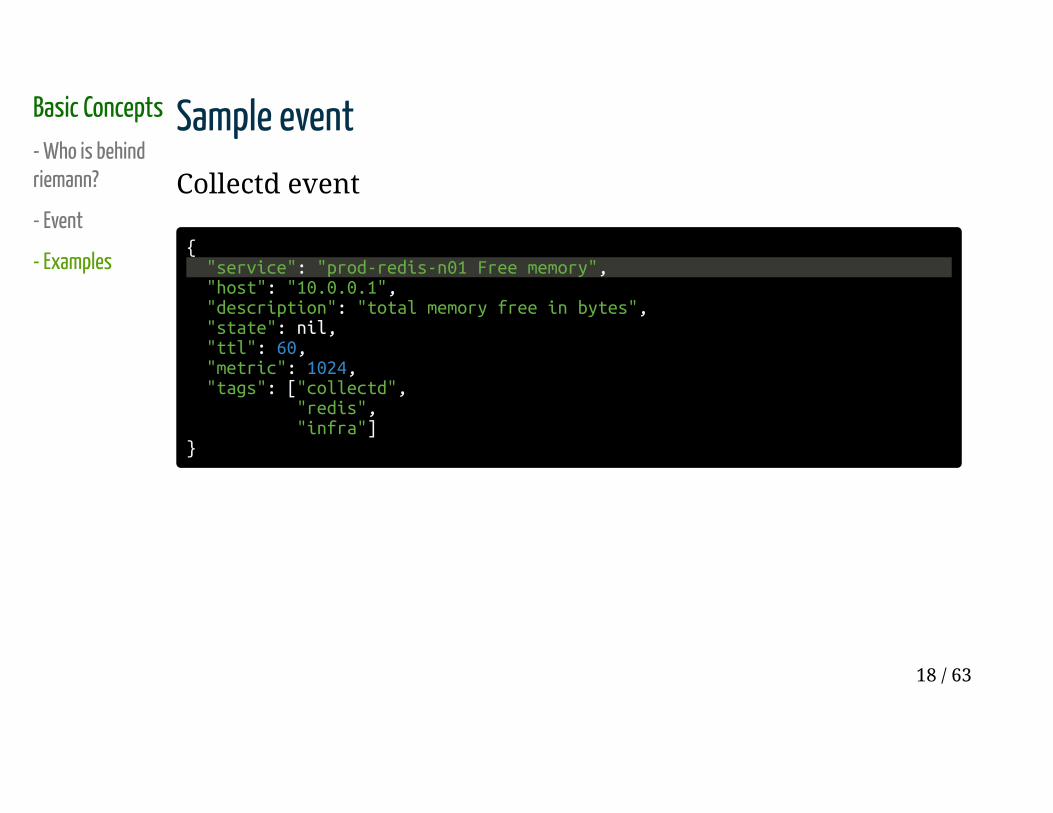
Sample event
Collectd event
{ "service": "prod-redis-n01 Free memory", "host": "10.0.0.1", "description": "total memory free in bytes", "state": nil, "ttl": 60, "metric": 1024, "tags": ["collectd", "redis", "infra"]}
18 / 63
Basic Concepts
- Who is behind
riemann?
- Event
- Examples
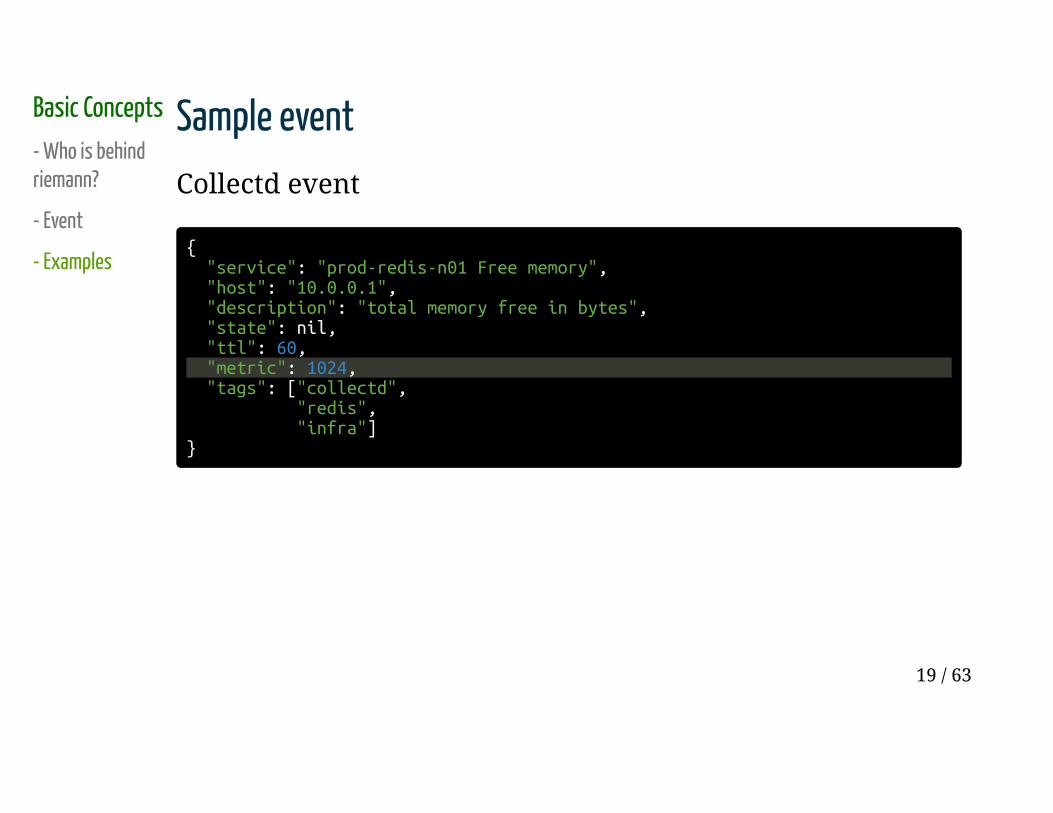
Sample event
Collectd event
{ "service": "prod-redis-n01 Free memory", "host": "10.0.0.1", "description": "total memory free in bytes", "state": nil, "ttl": 60, "metric": 1024, "tags": ["collectd", "redis", "infra"]}
19 / 63
Basic Concepts
- Who is behind
riemann?
- Event
- Examples
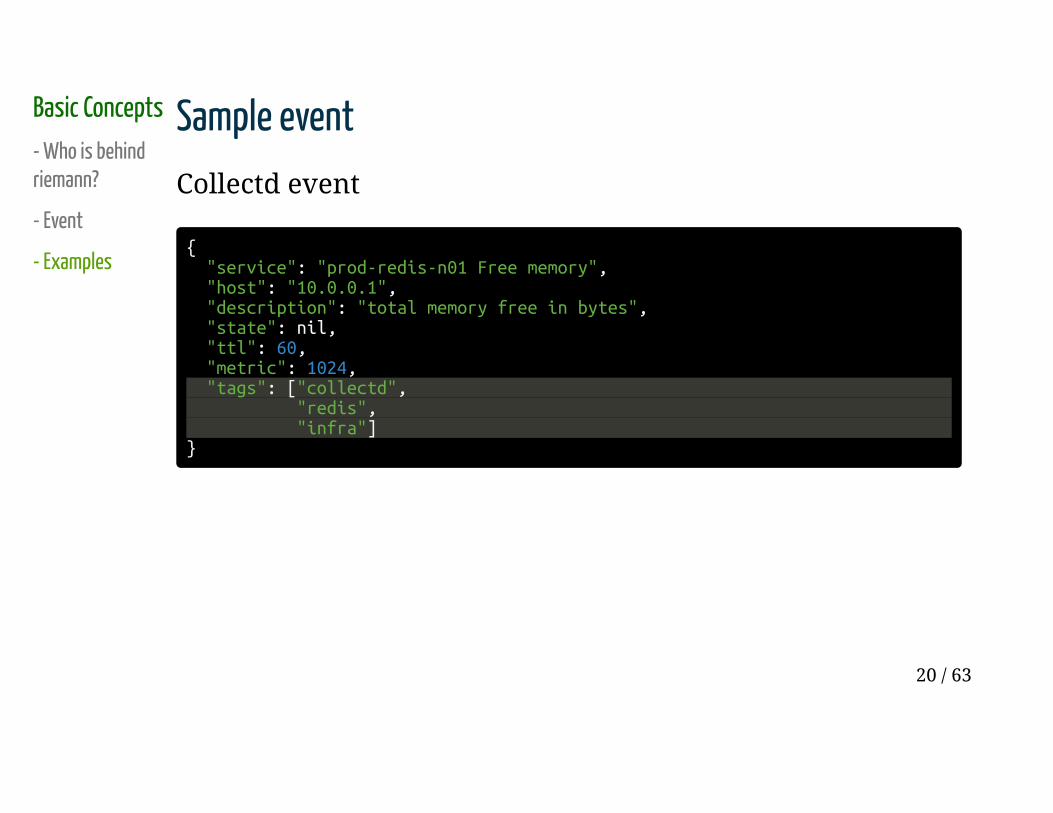
Sample event
Collectd event
{ "service": "prod-redis-n01 Free memory", "host": "10.0.0.1", "description": "total memory free in bytes", "state": nil, "ttl": 60, "metric": 1024, "tags": ["collectd", "redis", "infra"]}
20 / 63
Basic Concepts
- Who is behind
riemann?
- Event
- Examples
- The index
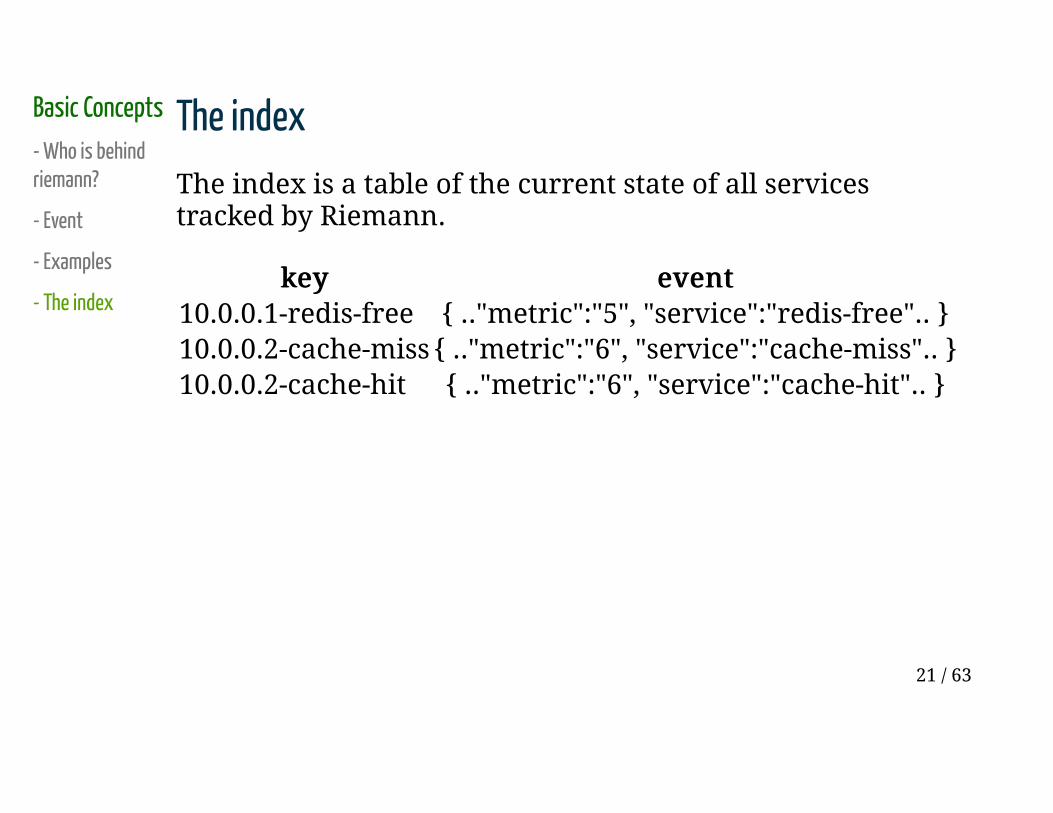
The index
The index is a table of the current state of all services
tracked by Riemann.
keykey eventevent
10.0.0.1-redis-free { .."metric":"5", "service":"redis-free".. }
10.0.0.2-cache-miss { .."metric":"6", "service":"cache-miss".. }
10.0.0.2-cache-hit { .."metric":"6", "service":"cache-hit".. }
21 / 63
Basic Concepts
- Who is behind
riemann?
- Event
- Examples
- The index
- TTL
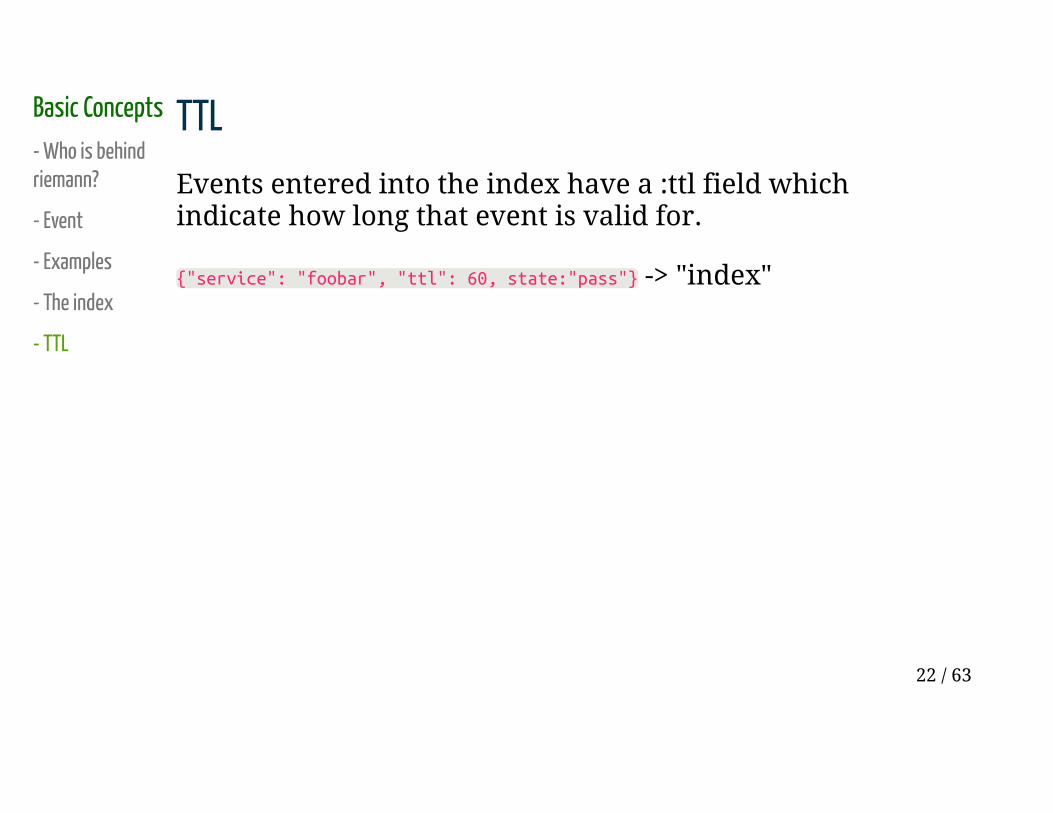
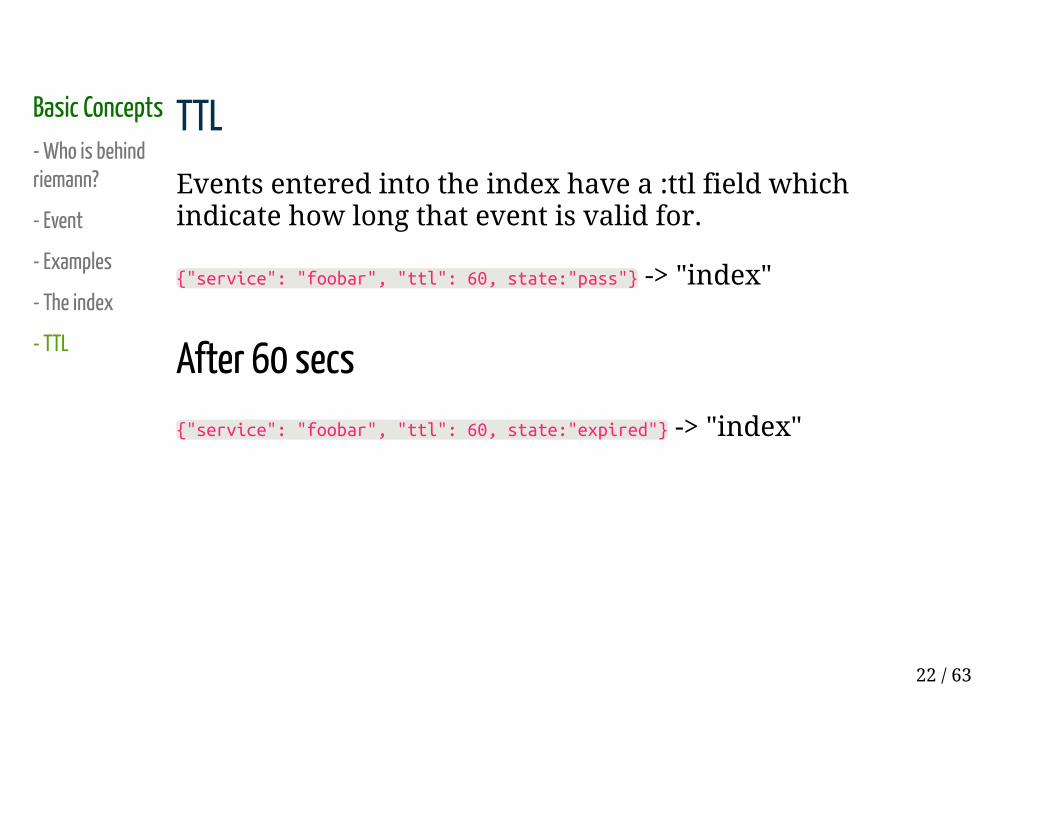
TTL
Events entered into the index have a :ttl field which
indicate how long that event is valid for.
{"service": "foobar", "ttl": 60, state:"pass"} -> "index"
22 / 63
Basic Concepts
- Who is behind
riemann?
- Event
- Examples
- The index
- TTL
TTL
Events entered into the index have a :ttl field which
indicate how long that event is valid for.
{"service": "foobar", "ttl": 60, state:"pass"} -> "index"
After 60 secs
{"service": "foobar", "ttl": 60, state:"expired"} -> "index"
22 / 63
merchantSanity -
Implement simple state machine
23 / 63
Probes and
tests
Simple test
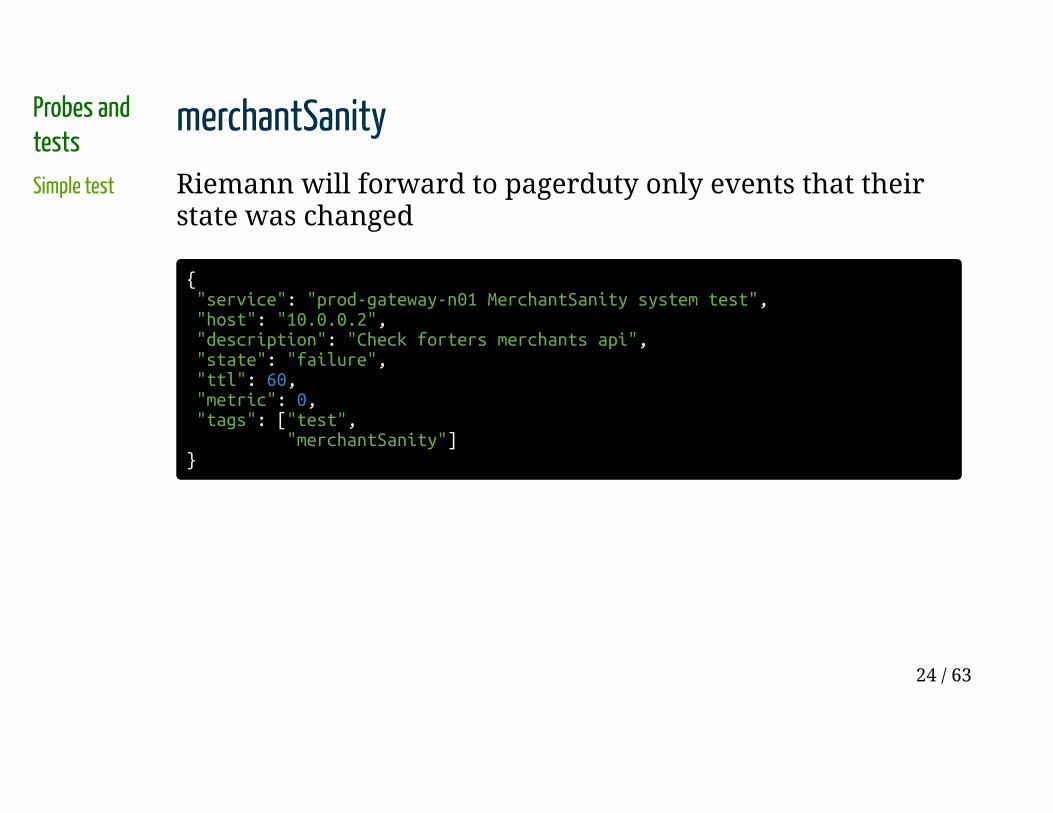
merchantSanity
Riemann will forward to pagerduty only events that their
state was changed
{ "service": "prod-gateway-n01 MerchantSanity system test", "host": "10.0.0.2", "description": "Check forters merchants api", "state": "failure", "ttl": 60, "metric": 0, "tags": ["test", "merchantSanity"]}
24 / 63
Probes and
tests
Simple test
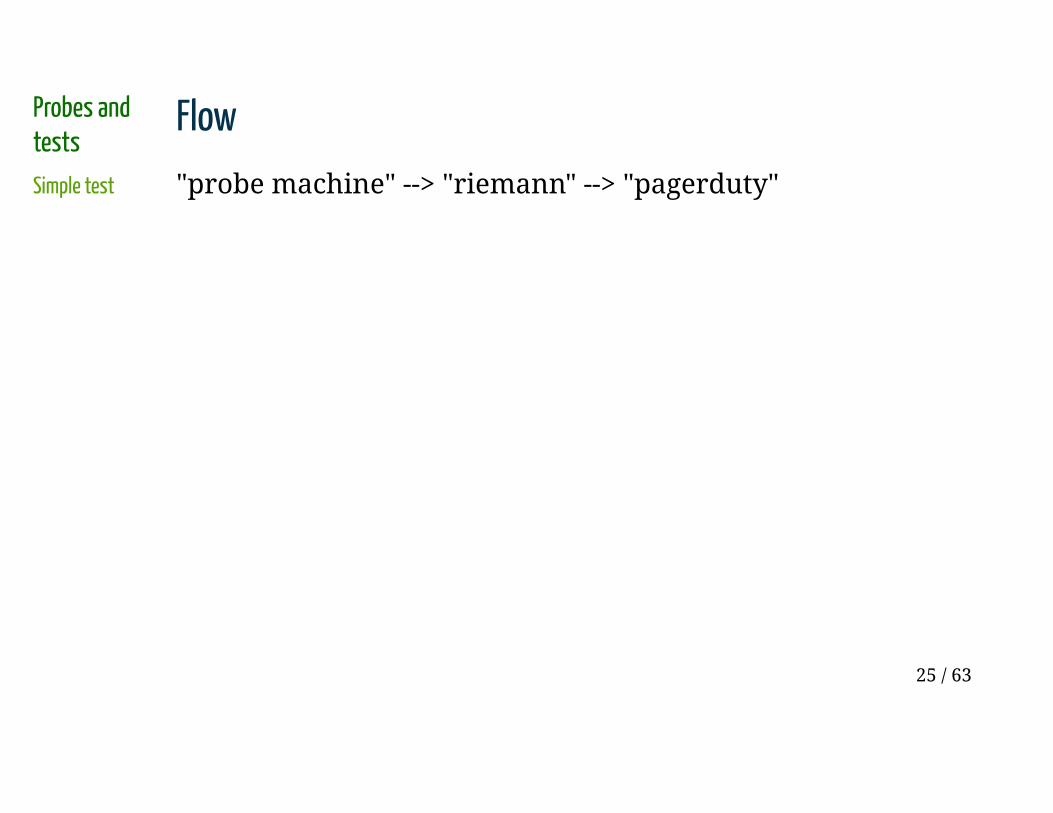
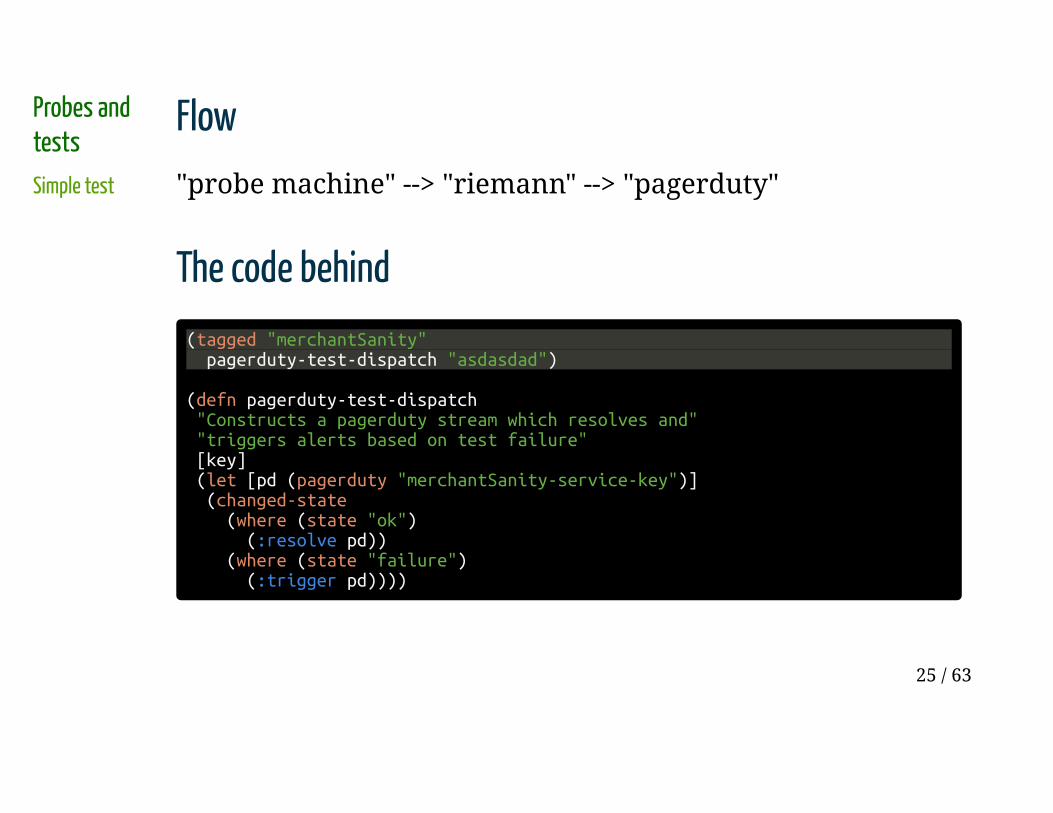
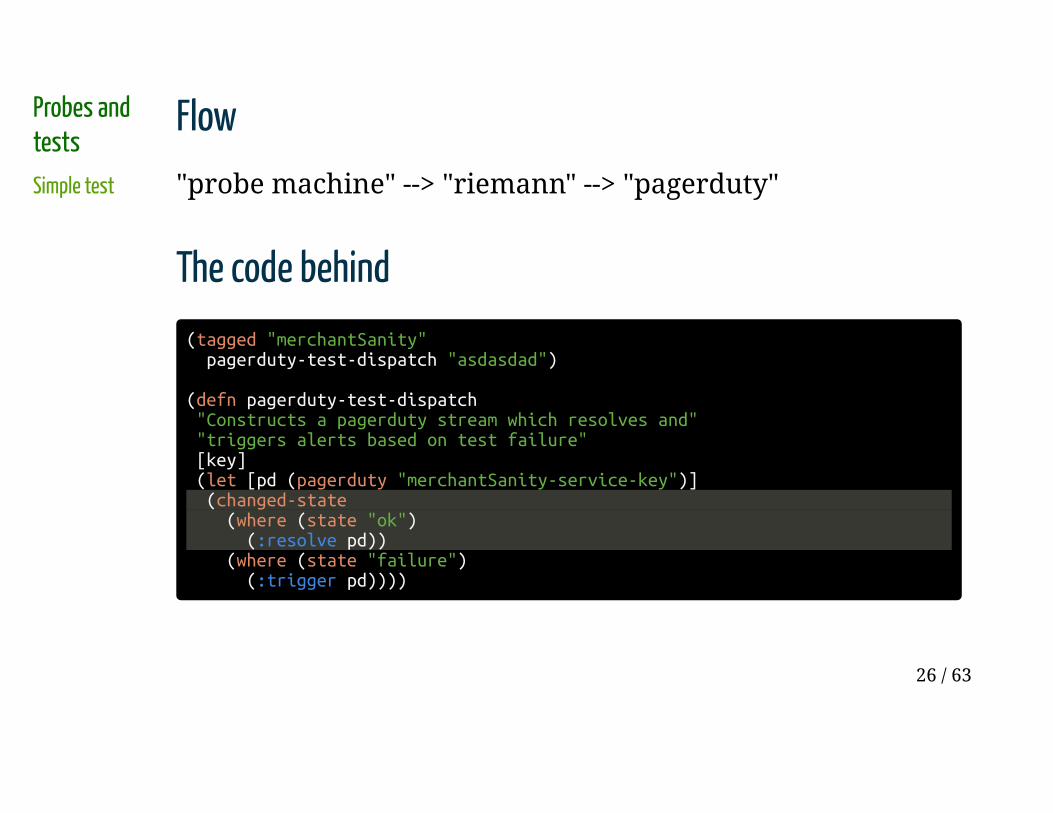
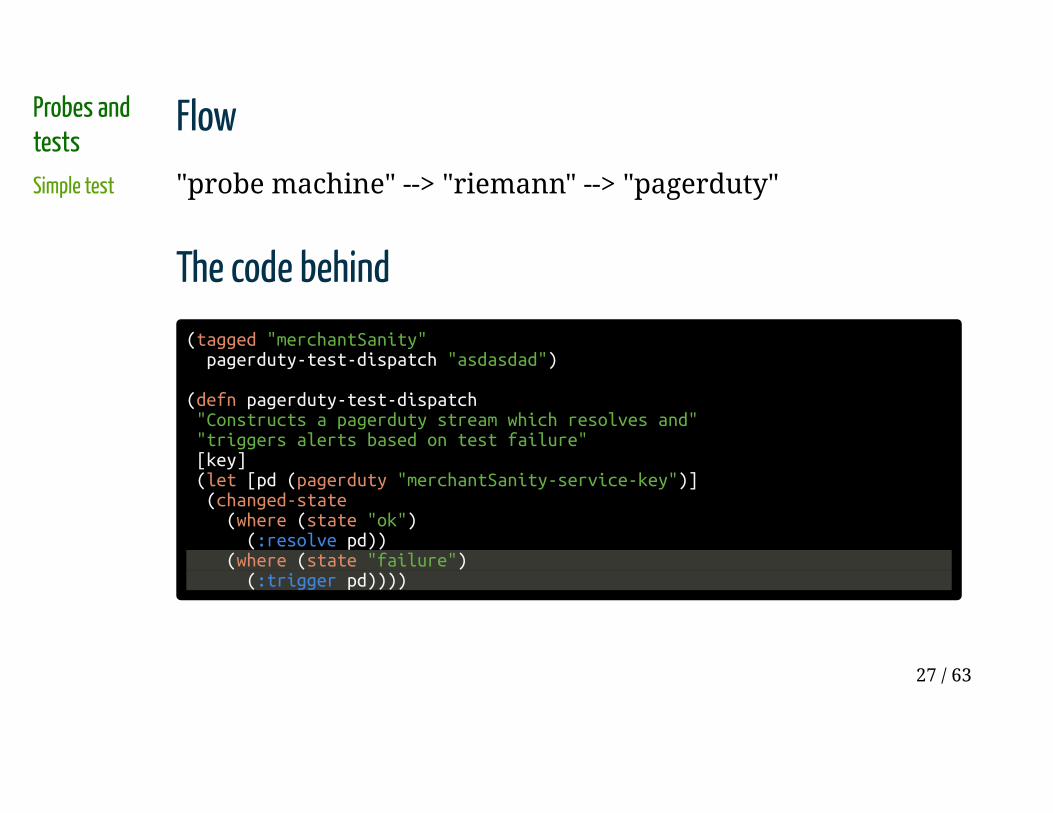
Flow
"probe machine" --> "riemann" --> "pagerduty"
25 / 63
Probes and
tests
Simple test
Flow
"probe machine" --> "riemann" --> "pagerduty"
The code behind
(tagged "merchantSanity" pagerduty-test-dispatch "asdasdad")
(defn pagerduty-test-dispatch "Constructs a pagerduty stream which resolves and" "triggers alerts based on test failure" [key] (let [pd (pagerduty "merchantSanity-service-key")] (changed-state (where (state "ok") (:resolve pd)) (where (state "failure") (:trigger pd))))
26 / 63
Probes and
tests
Simple test
Flow
"probe machine" --> "riemann" --> "pagerduty"
The code behind
(tagged "merchantSanity" pagerduty-test-dispatch "asdasdad")
(defn pagerduty-test-dispatch "Constructs a pagerduty stream which resolves and" "triggers alerts based on test failure" [key] (let [pd (pagerduty "merchantSanity-service-key")] (changed-state (where (state "ok") (:resolve pd)) (where (state "failure") (:trigger pd))))
27 / 63
when things break, they submit a *ton* of events
how can I throttle them?
28 / 63
Probes and
tests
Simple test
Test dispatch -
throttled
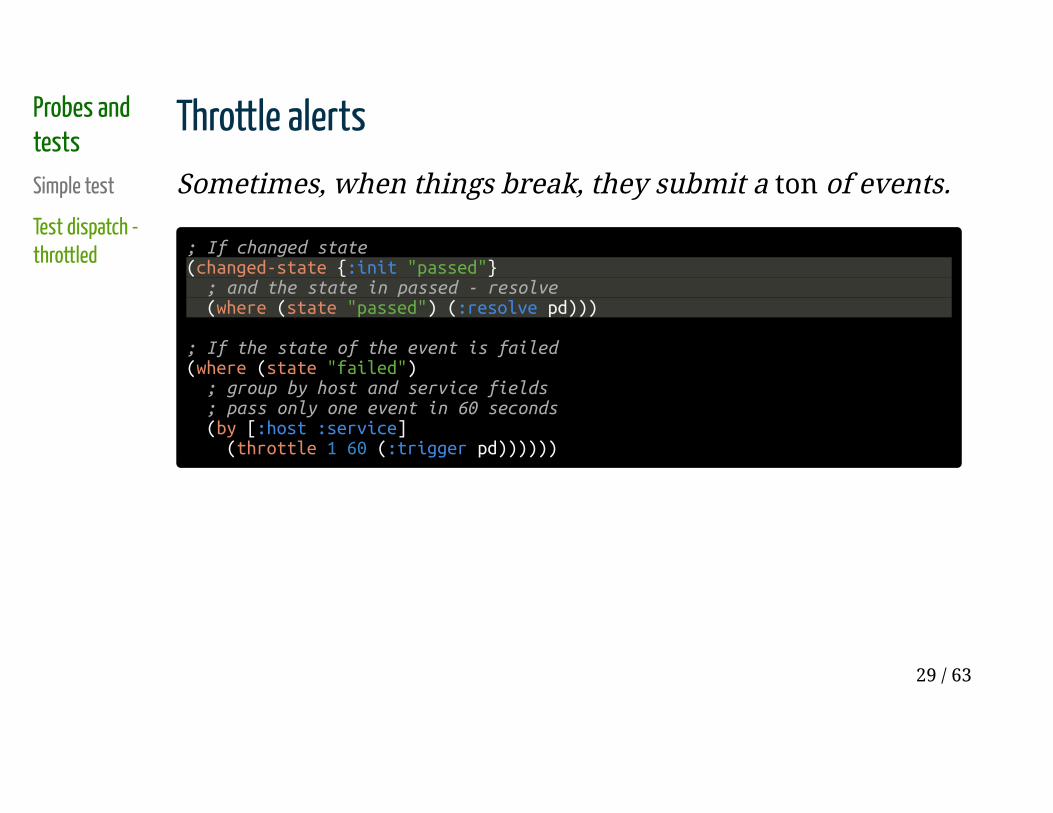
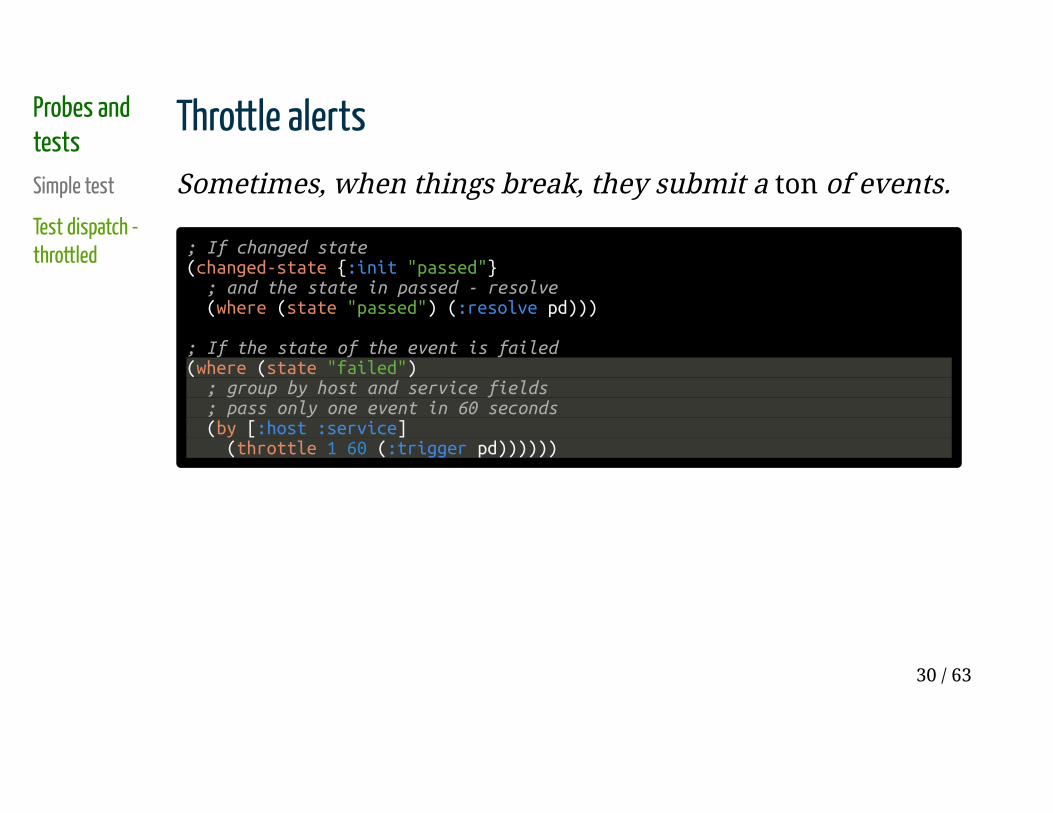
Throttle alerts
Sometimes, when things break, they submit a ton of events.
; If changed state(changed-state {:init "passed"} ; and the state in passed - resolve (where (state "passed") (:resolve pd)))
; If the state of the event is failed(where (state "failed") ; group by host and service fields ; pass only one event in 60 seconds (by [:host :service] (throttle 1 60 (:trigger pd))))))
29 / 63
Probes and
tests
Simple test
Test dispatch -
throttled
Throttle alerts
Sometimes, when things break, they submit a ton of events.
; If changed state(changed-state {:init "passed"} ; and the state in passed - resolve (where (state "passed") (:resolve pd)))
; If the state of the event is failed(where (state "failed") ; group by host and service fields ; pass only one event in 60 seconds (by [:host :service] (throttle 1 60 (:trigger pd))))))
30 / 63
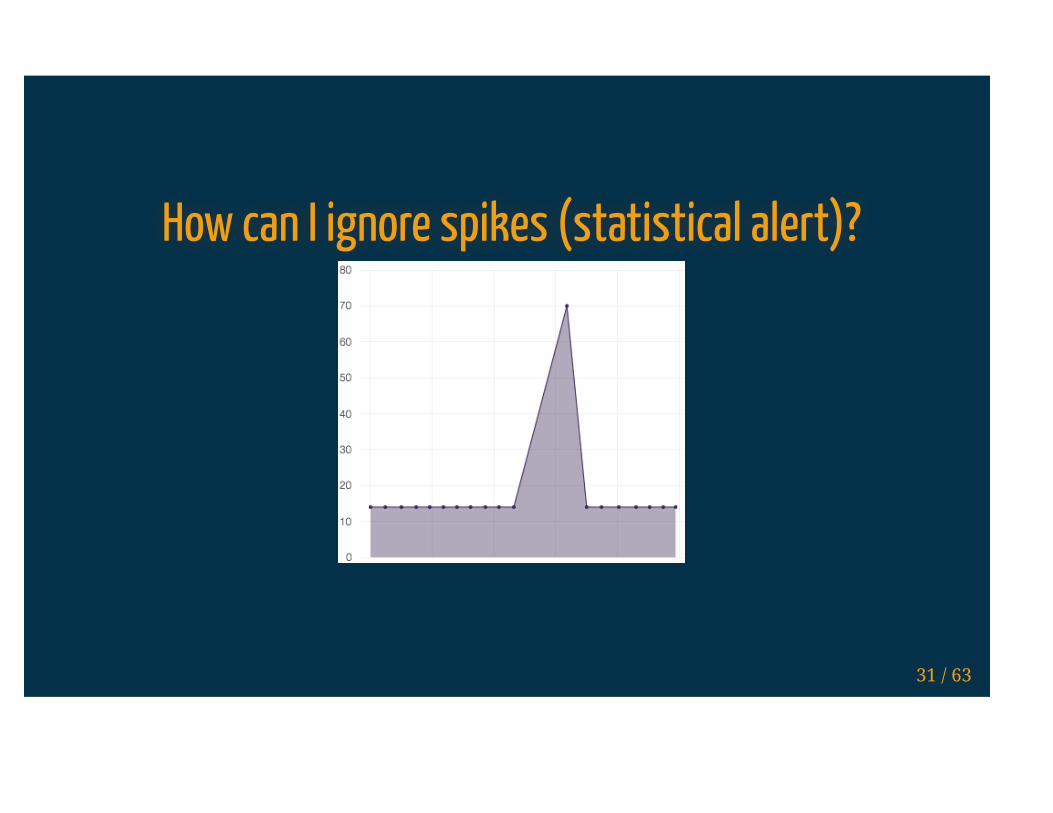
How can I ignore spikes (statistical alert)?
31 / 63
Probes and
tests
Simple test
Test dispatch -
throttled
CPU spikes
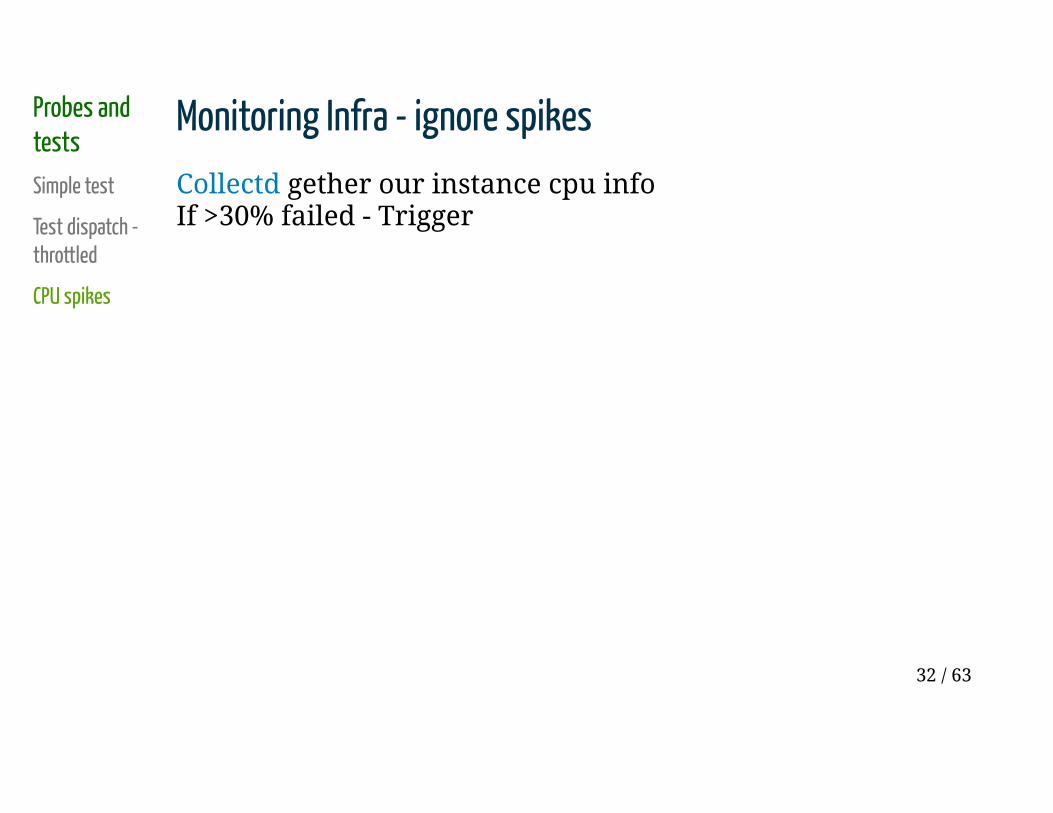
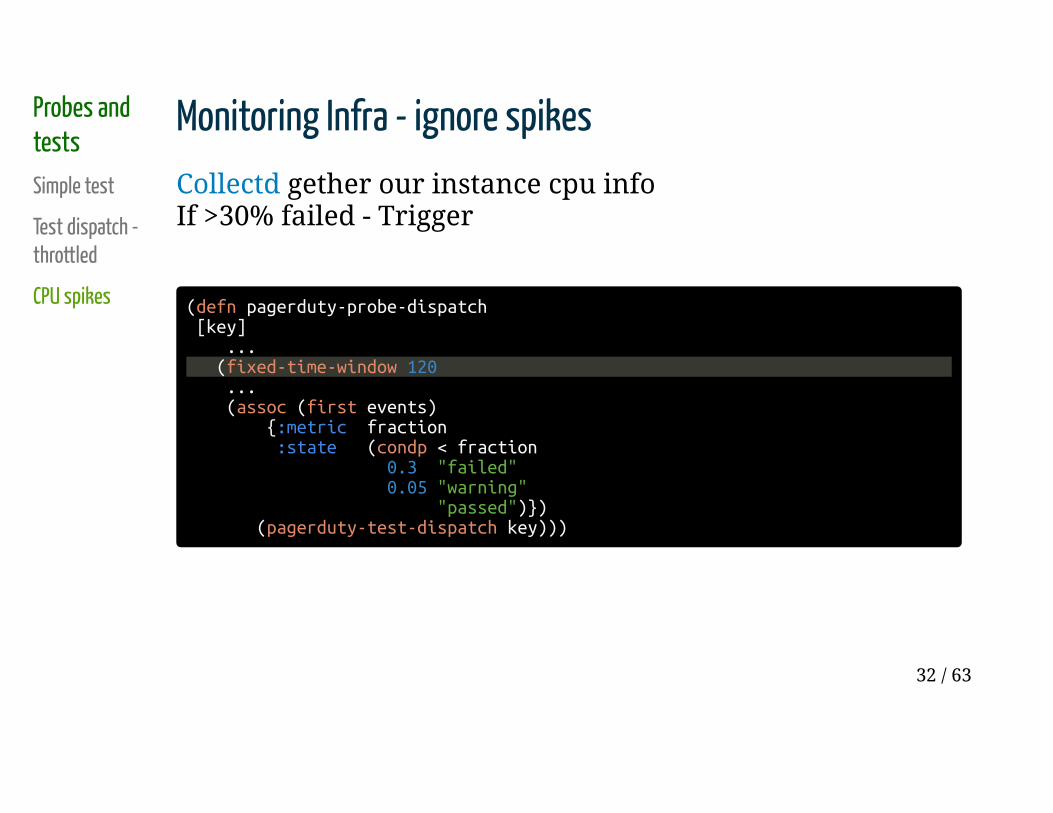
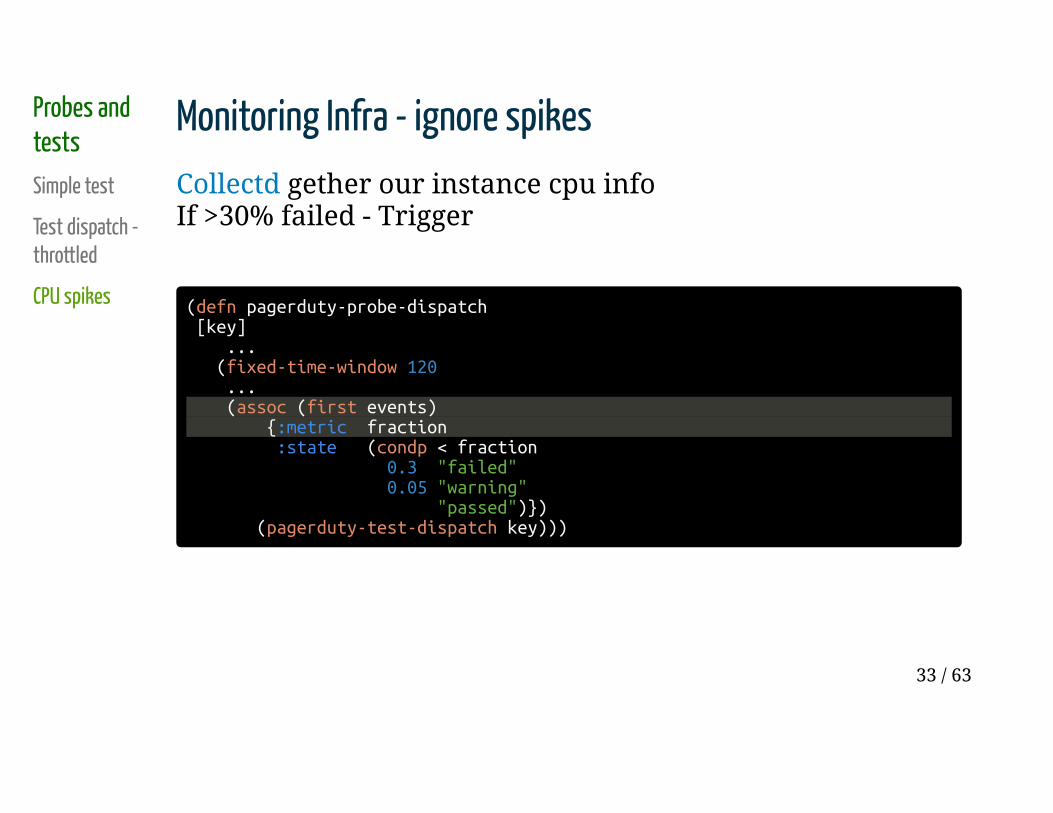
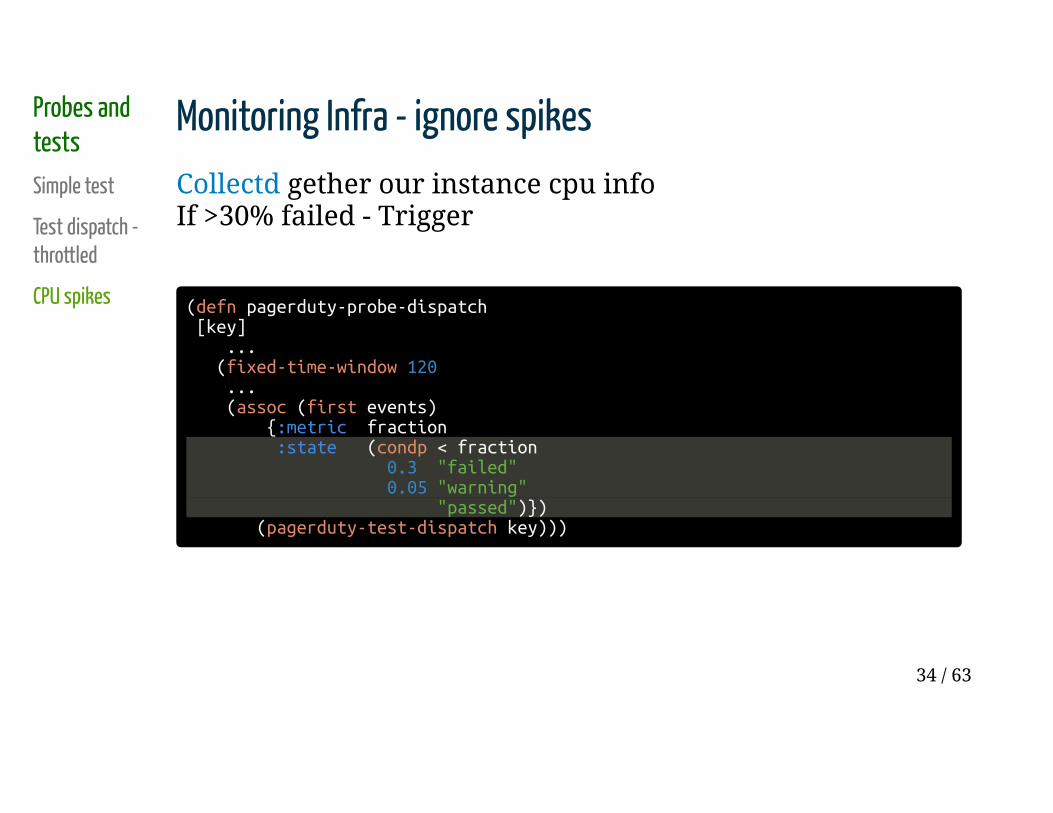
Monitoring Infra - ignore spikes
Collectd gether our instance cpu info
If >30% failed - Trigger
32 / 63
Probes and
tests
Simple test
Test dispatch -
throttled
CPU spikes
Monitoring Infra - ignore spikes
Collectd gether our instance cpu info
If >30% failed - Trigger
(defn pagerduty-probe-dispatch [key] ... (fixed-time-window 120 ... (assoc (first events) {:metric fraction :state (condp < fraction 0.3 "failed" 0.05 "warning" "passed")}) (pagerduty-test-dispatch key)))
33 / 63
Probes and
tests
Simple test
Test dispatch -
throttled
CPU spikes
Monitoring Infra - ignore spikes
Collectd gether our instance cpu info
If >30% failed - Trigger
(defn pagerduty-probe-dispatch [key] ... (fixed-time-window 120 ... (assoc (first events) {:metric fraction :state (condp < fraction 0.3 "failed" 0.05 "warning" "passed")}) (pagerduty-test-dispatch key)))
34 / 63
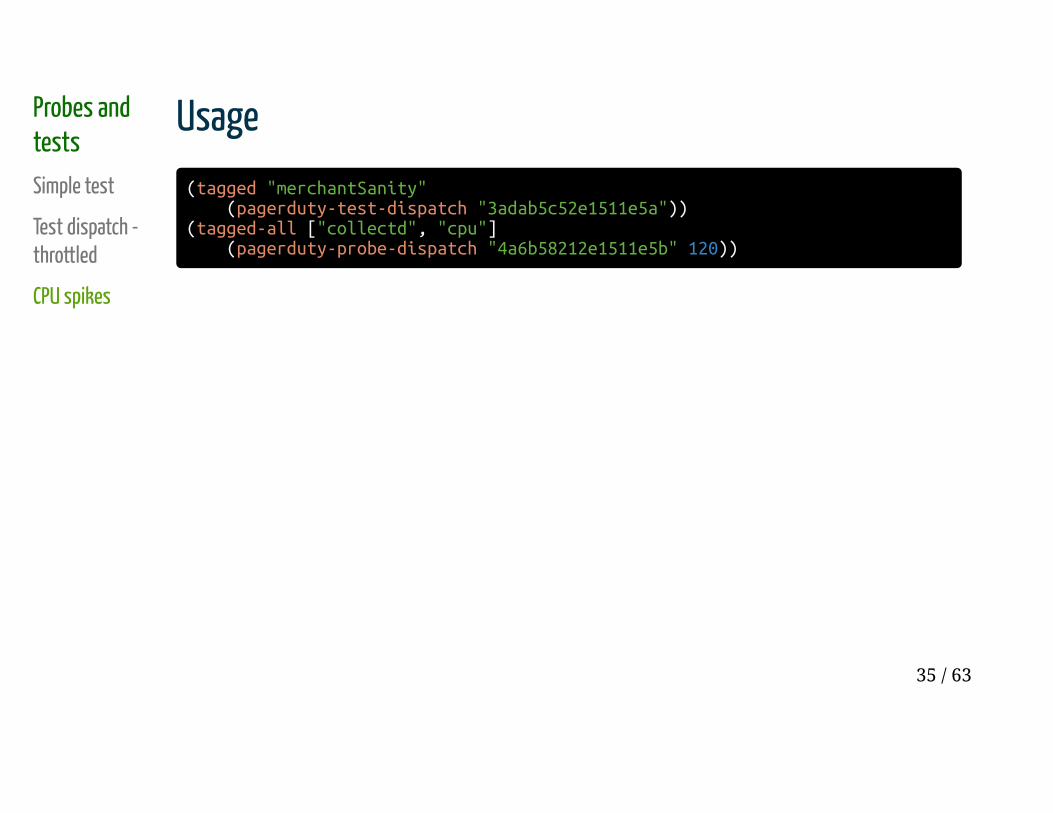
Probes and
tests
Simple test
Test dispatch -
throttled
CPU spikes
Usage
(tagged "merchantSanity" (pagerduty-test-dispatch "3adab5c52e1511e5a"))(tagged-all ["collectd", "cpu"] (pagerduty-probe-dispatch "4a6b58212e1511e5b" 120))
35 / 63
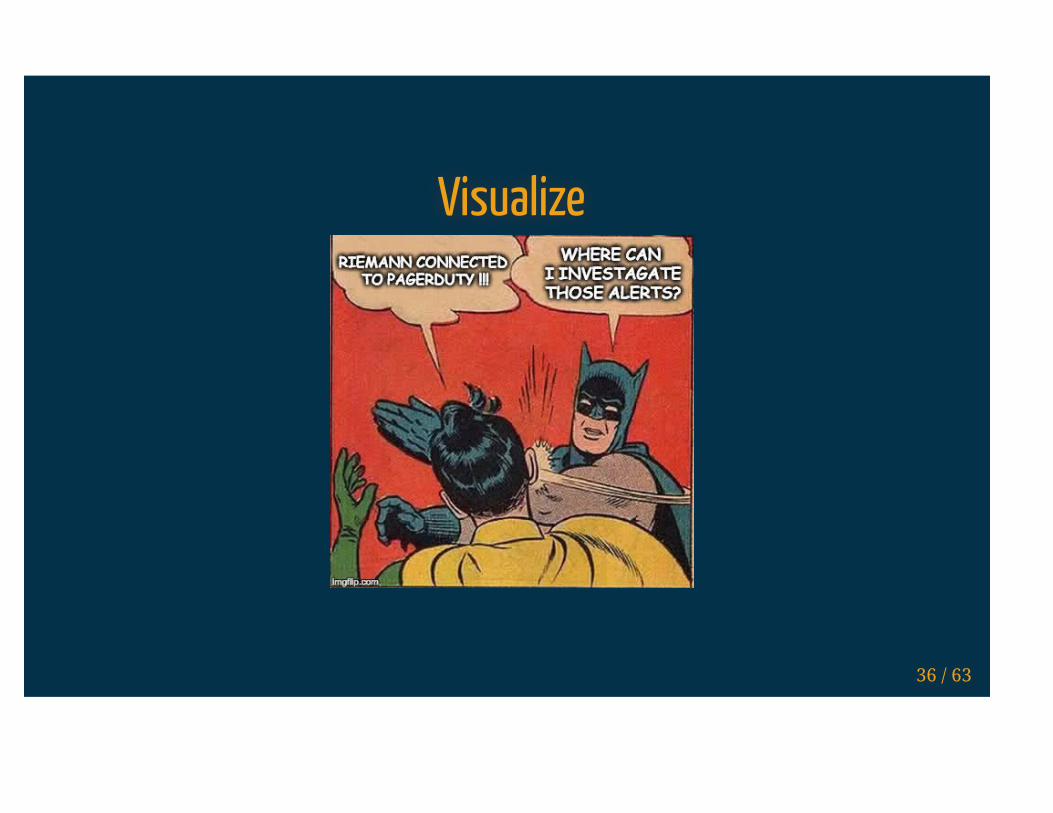
Visualize
36 / 63
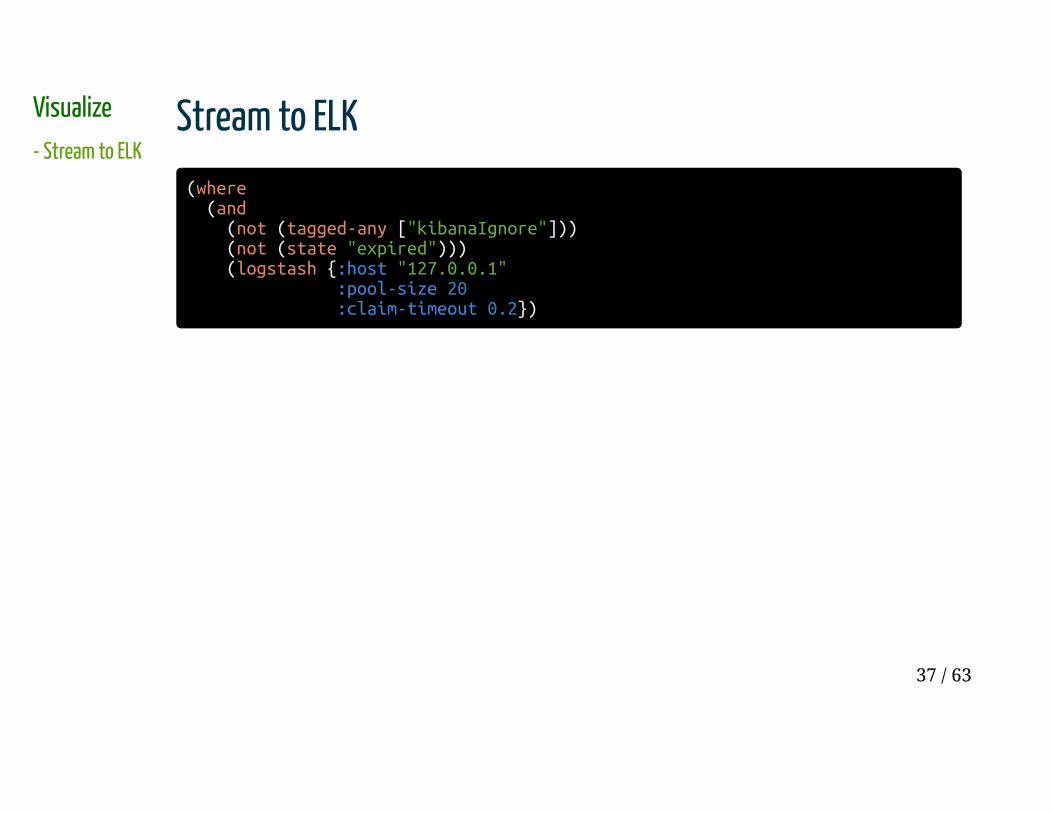
Visualize
- Stream to ELK
Stream to ELK
(where (and (not (tagged-any ["kibanaIgnore"])) (not (state "expired"))) (logstash {:host "127.0.0.1" :pool-size 20 :claim-timeout 0.2})
37 / 63
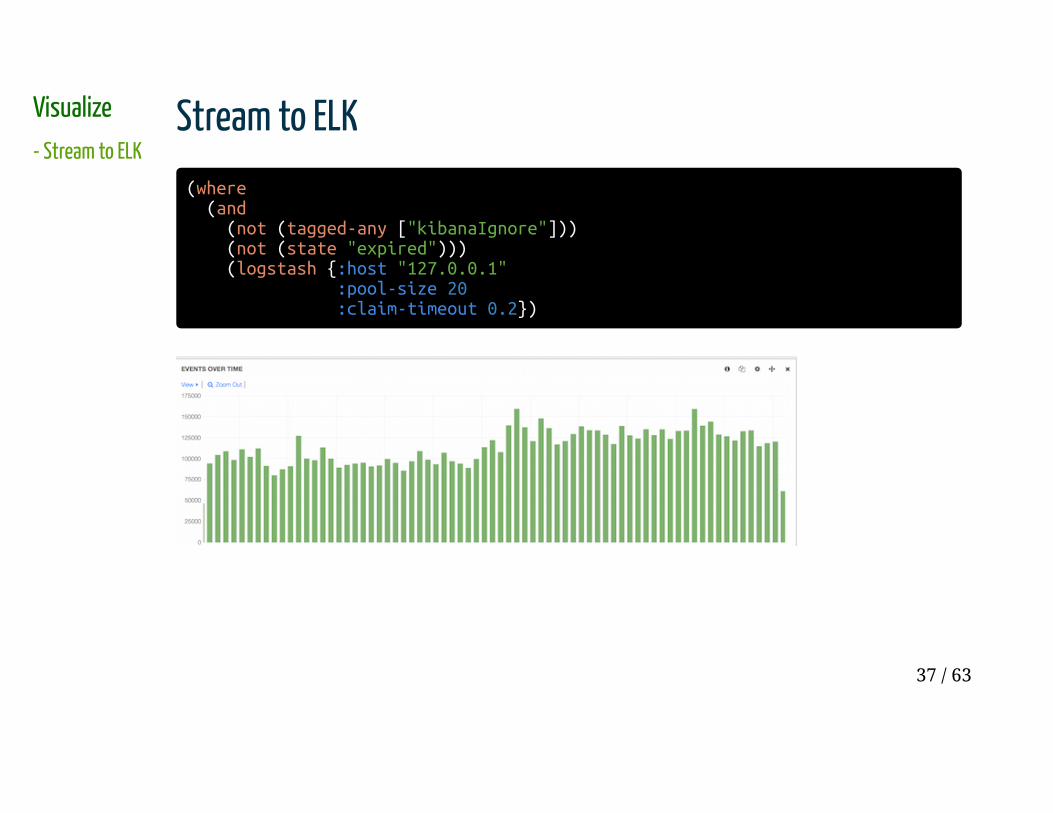
Visualize
- Stream to ELK
Stream to ELK
(where (and (not (tagged-any ["kibanaIgnore"])) (not (state "expired"))) (logstash {:host "127.0.0.1" :pool-size 20 :claim-timeout 0.2})
37 / 63
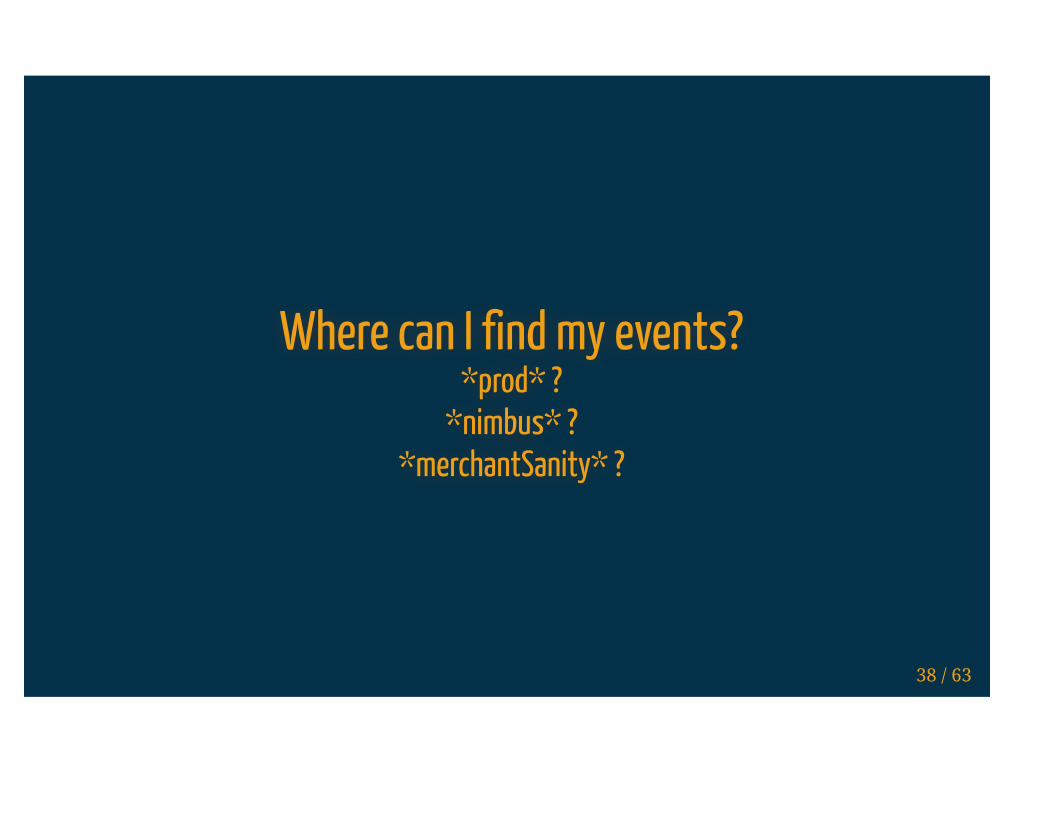
Where can I find my events?*prod* ?
*nimbus* ?
*merchantSanity* ?
38 / 63
Visualize
- Stream to ELK
- Prepare for ELK
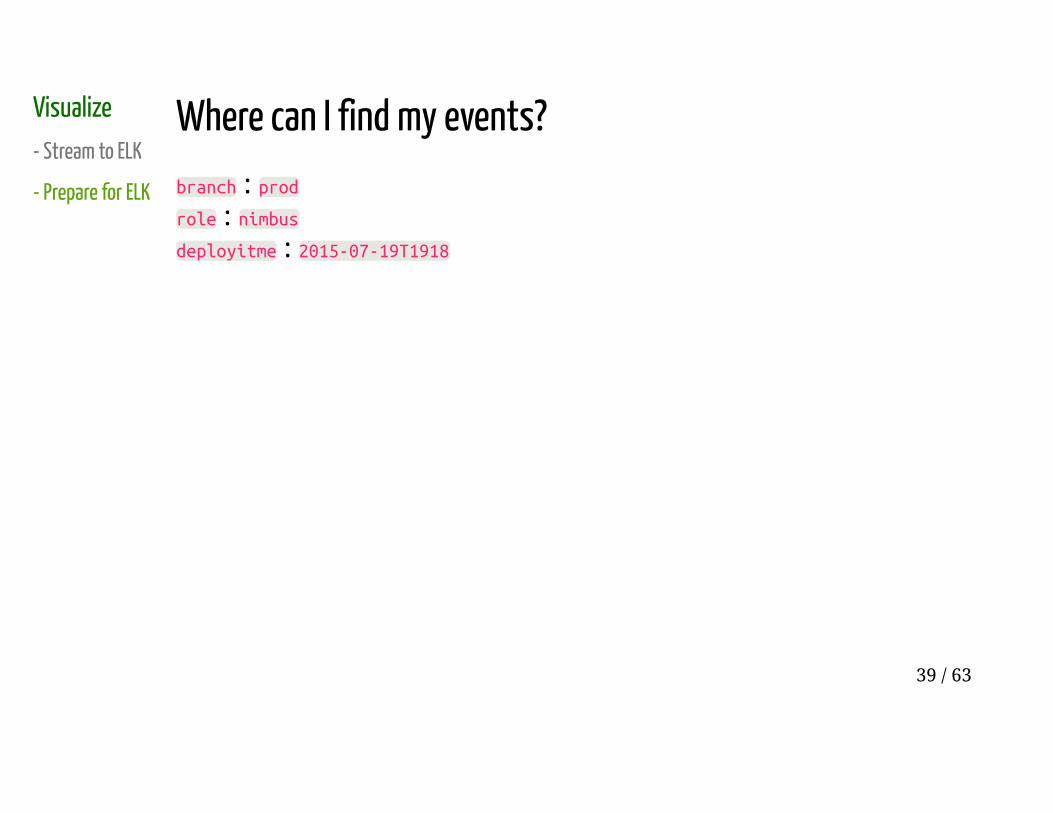
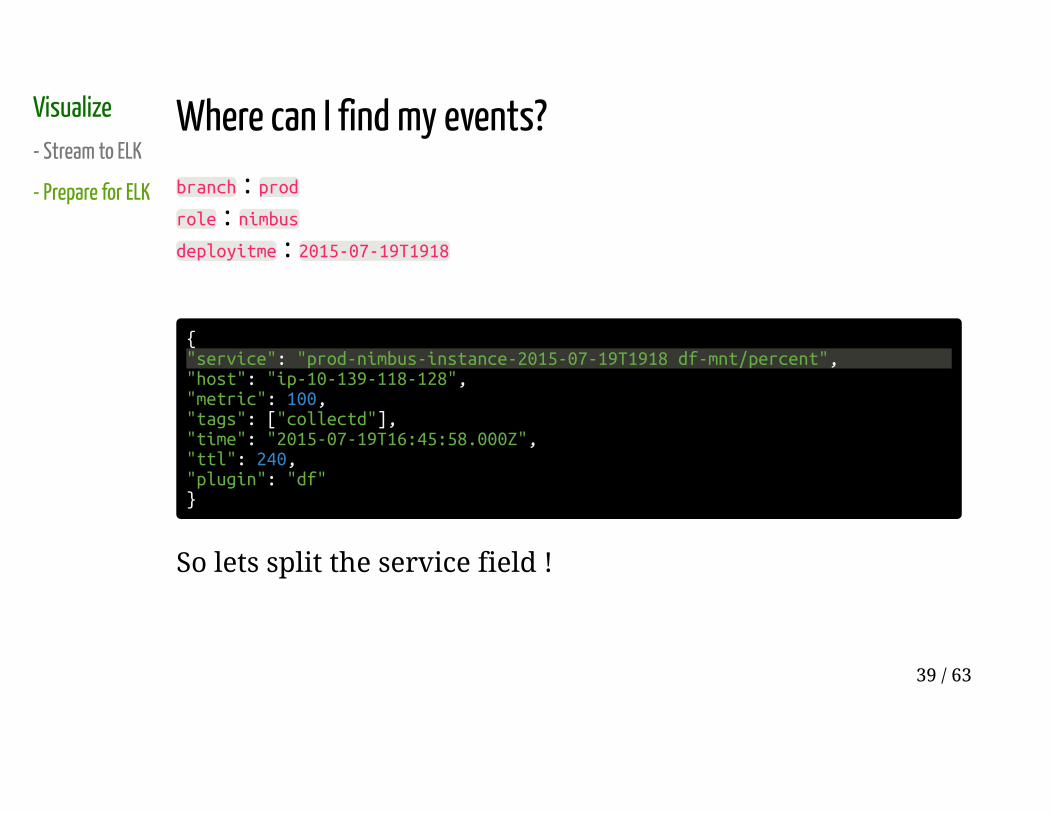
Where can I find my events?
branch : prod
role : nimbus
deployitme : 2015-07-19T1918
39 / 63
Visualize
- Stream to ELK
- Prepare for ELK
Where can I find my events?
branch : prod
role : nimbus
deployitme : 2015-07-19T1918
{"service": "prod-nimbus-instance-2015-07-19T1918 df-mnt/percent","host": "ip-10-139-118-128","metric": 100,"tags": ["collectd"],"time": "2015-07-19T16:45:58.000Z","ttl": 240,"plugin": "df"}
So lets split the service field !
39 / 63
Visualize
- Stream to ELK
- Prepare for ELK
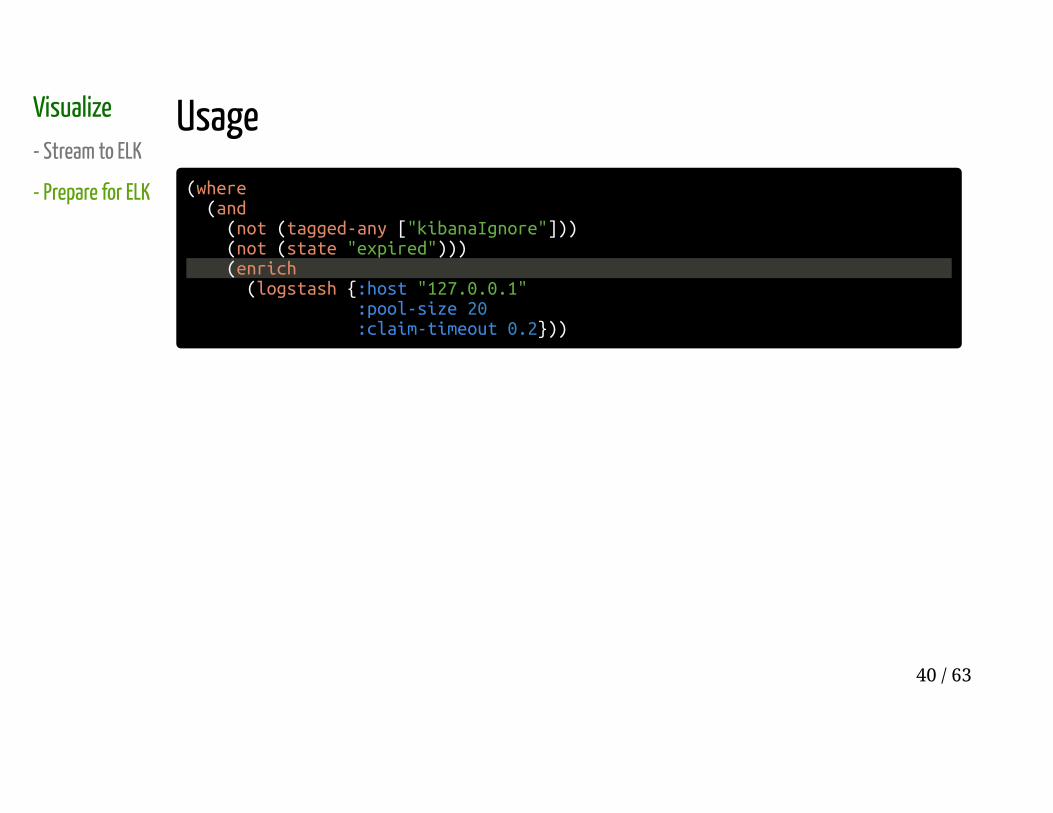
Usage
(where (and (not (tagged-any ["kibanaIgnore"])) (not (state "expired"))) (enrich (logstash {:host "127.0.0.1" :pool-size 20 :claim-timeout 0.2}))
40 / 63
Visualize
- Stream to ELK
- Prepare for ELK
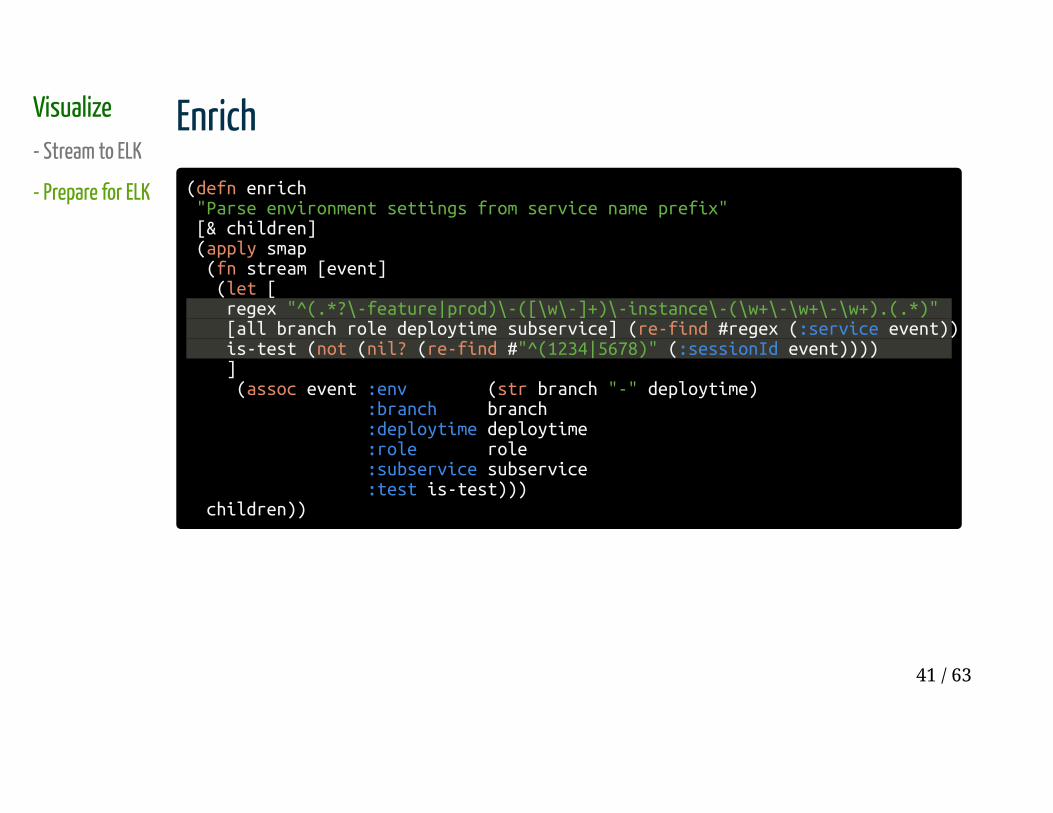
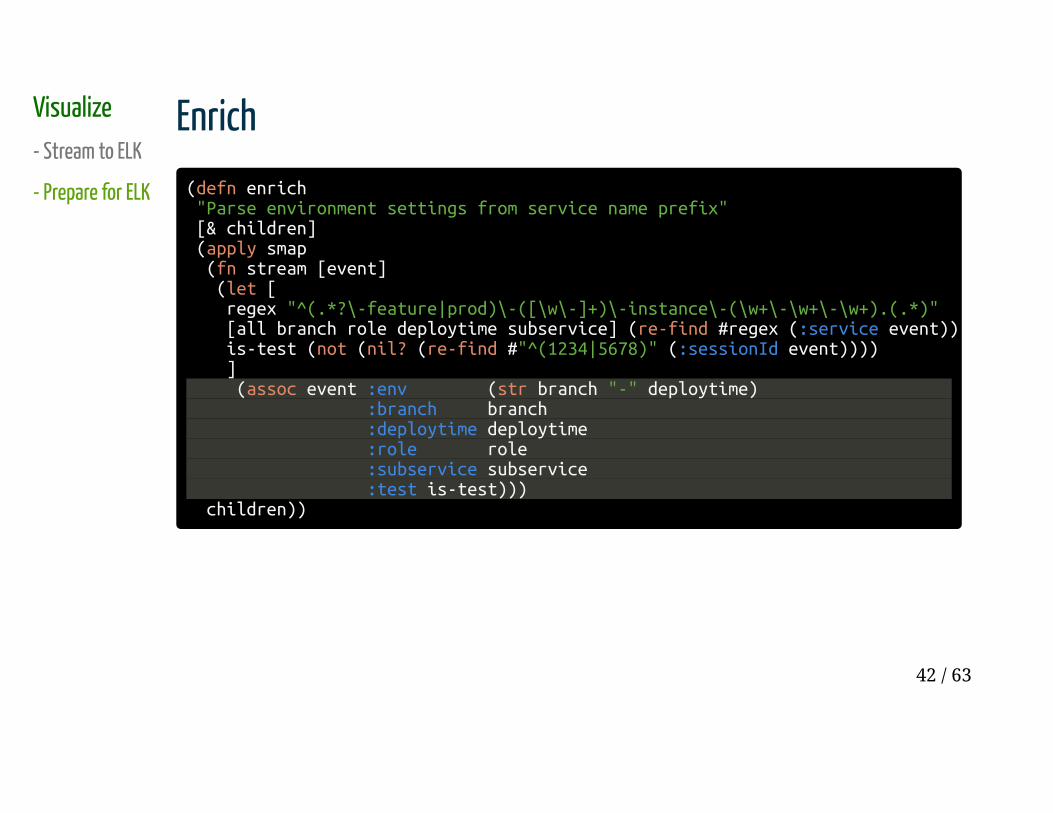
Enrich
(defn enrich "Parse environment settings from service name prefix" [& children] (apply smap (fn stream [event] (let [ regex "^(.*?\-feature|prod)\-([\w\-]+)\-instance\-(\w+\-\w+\-\w+).(.*)" [all branch role deploytime subservice] (re-find #regex (:service event)) is-test (not (nil? (re-find #"^(1234|5678)" (:sessionId event)))) ] (assoc event :env (str branch "-" deploytime) :branch branch :deploytime deploytime :role role :subservice subservice :test is-test))) children))
41 / 63
Visualize
- Stream to ELK
- Prepare for ELK
Enrich
(defn enrich "Parse environment settings from service name prefix" [& children] (apply smap (fn stream [event] (let [ regex "^(.*?\-feature|prod)\-([\w\-]+)\-instance\-(\w+\-\w+\-\w+).(.*)" [all branch role deploytime subservice] (re-find #regex (:service event)) is-test (not (nil? (re-find #"^(1234|5678)" (:sessionId event)))) ] (assoc event :env (str branch "-" deploytime) :branch branch :deploytime deploytime :role role :subservice subservice :test is-test))) children))
42 / 63
Visualize
- Stream to ELK
- Prepare for ELK
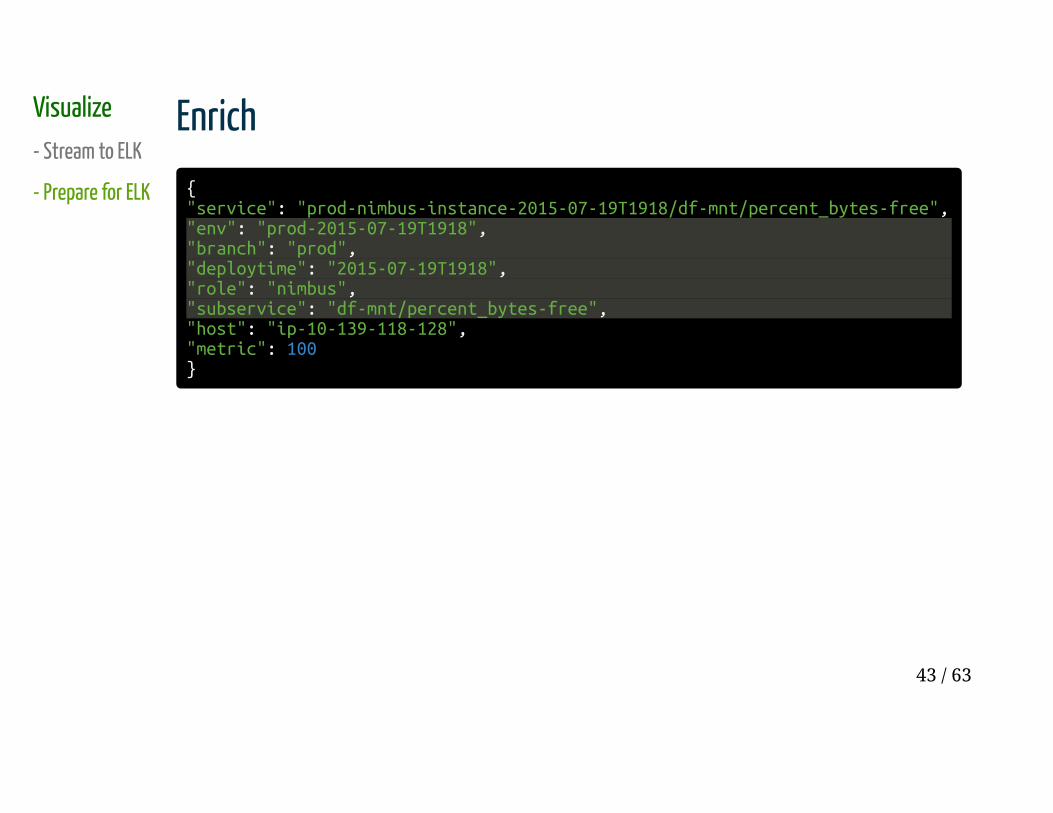
Enrich
{"service": "prod-nimbus-instance-2015-07-19T1918/df-mnt/percent_bytes-free","env": "prod-2015-07-19T1918","branch": "prod","deploytime": "2015-07-19T1918","role": "nimbus","subservice": "df-mnt/percent_bytes-free","host": "ip-10-139-118-128","metric": 100}
43 / 63
Showoff
44 / 63
Visualize
- Stream to ELK
- Prepare for ELK
- Result
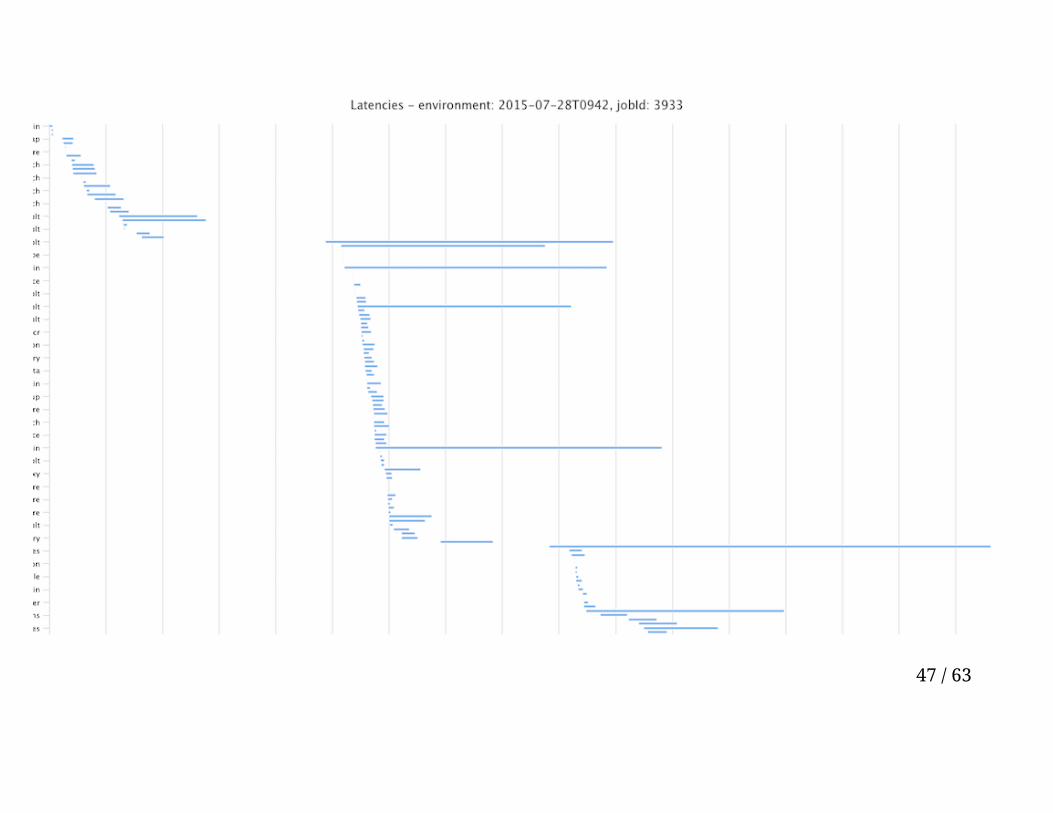
Storm topology with timing
45 / 63
Visualize
- Stream to ELK
- Prepare for ELK
- Result
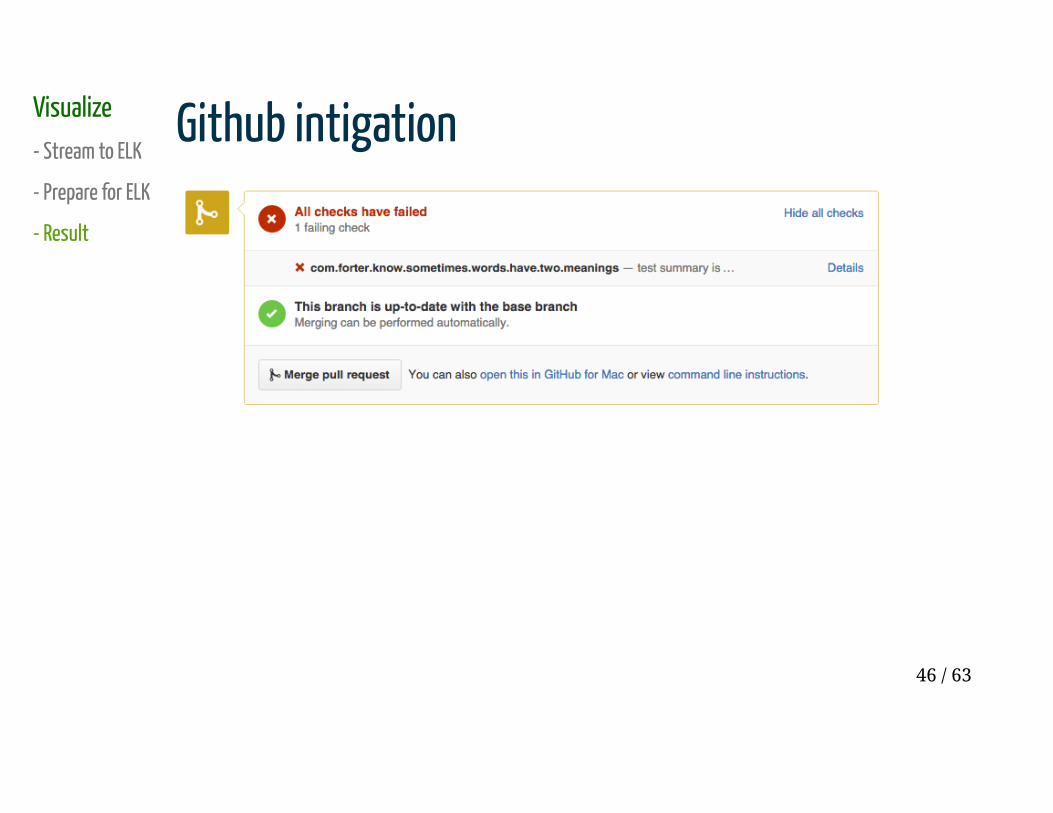
Github intigation
46 / 63
47 / 63
Visualize
- Stream to ELK
- Prepare for ELK
- Result
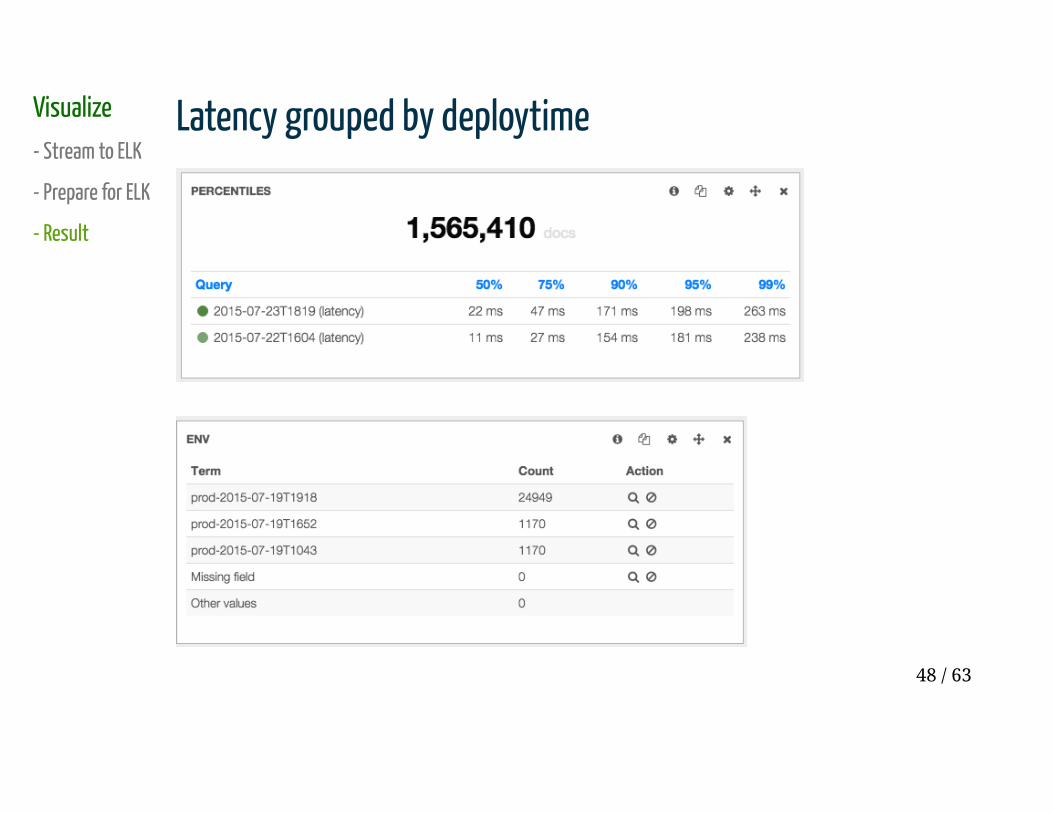
Latency grouped by deploytime
48 / 63
Visualize
- Stream to ELK
- Prepare for ELK
- Result
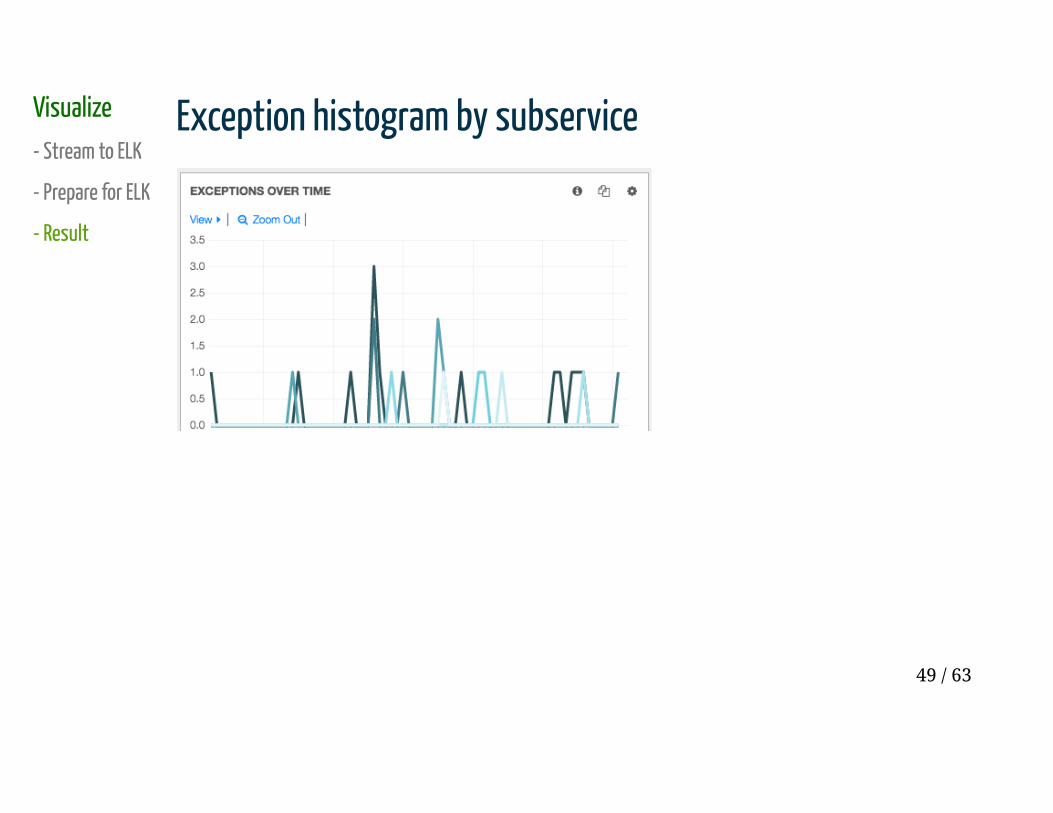
Exception histogram by subservice
49 / 63
Visualize
- Stream to ELK
- Prepare for ELK
- Result
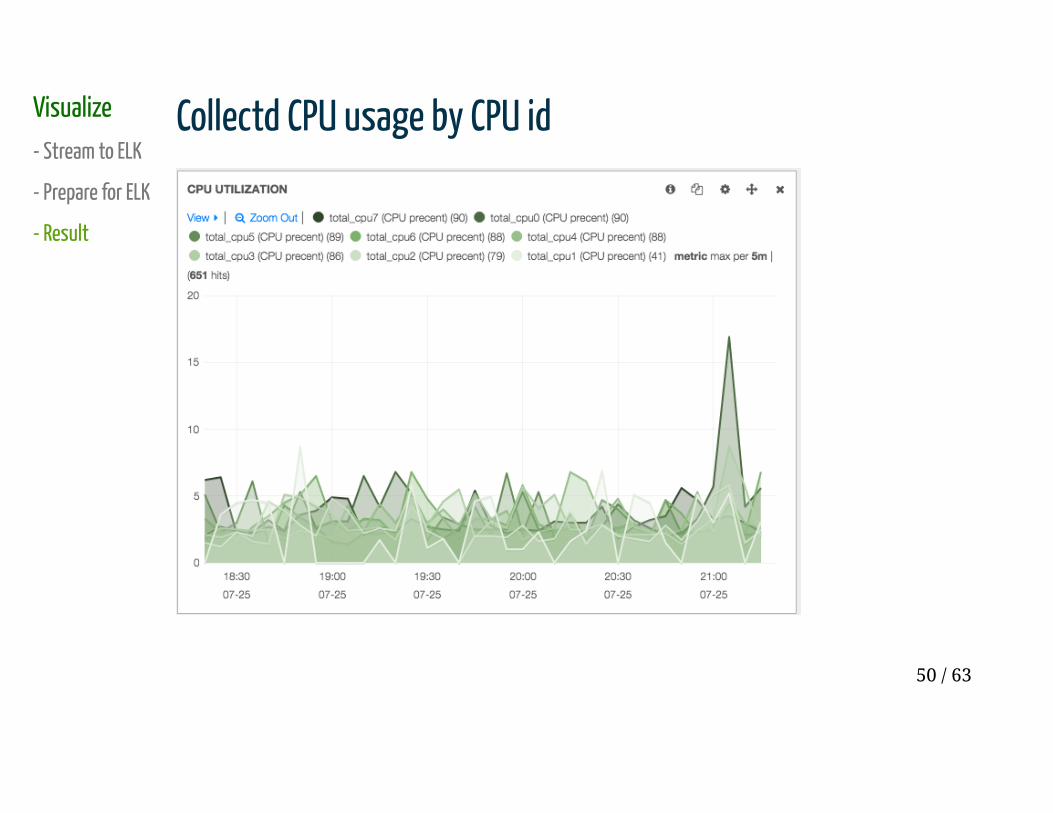
Collectd CPU usage by CPU id
50 / 63
BTW its all open source -
http://github.com/forter
51 / 63

Ignore irrelevant old prod alerts/ Maintenance
52 / 63
Back to tests
- Maintenance
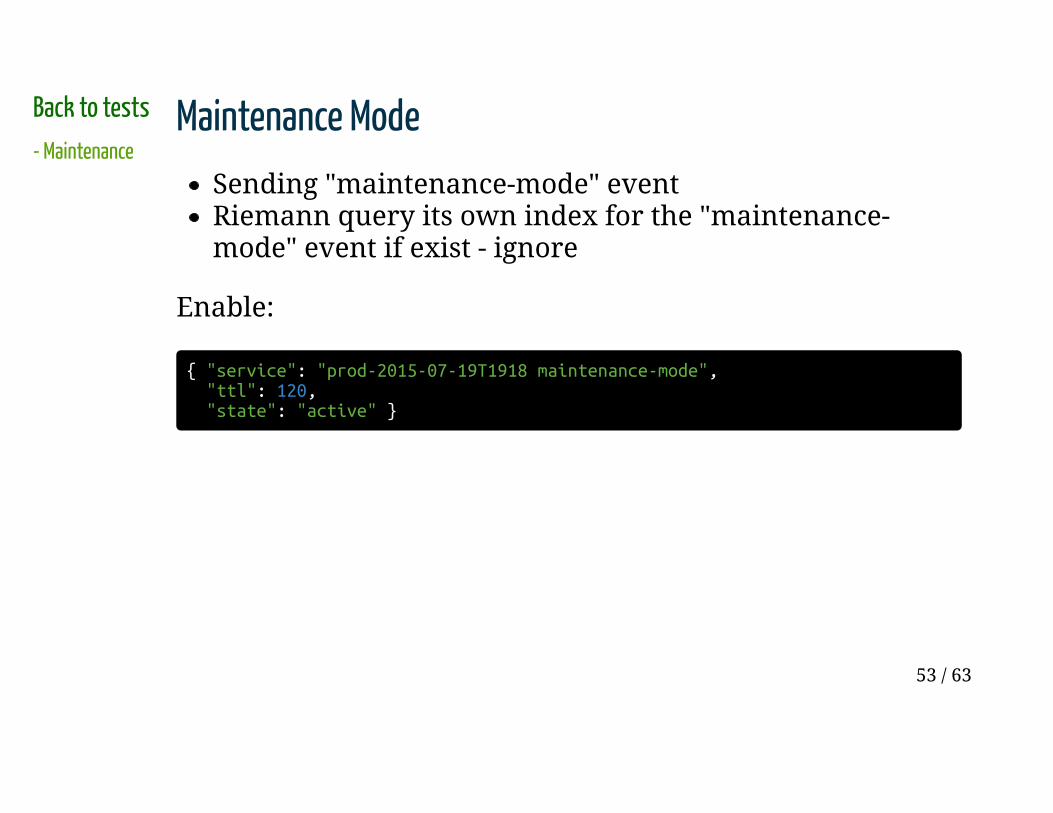
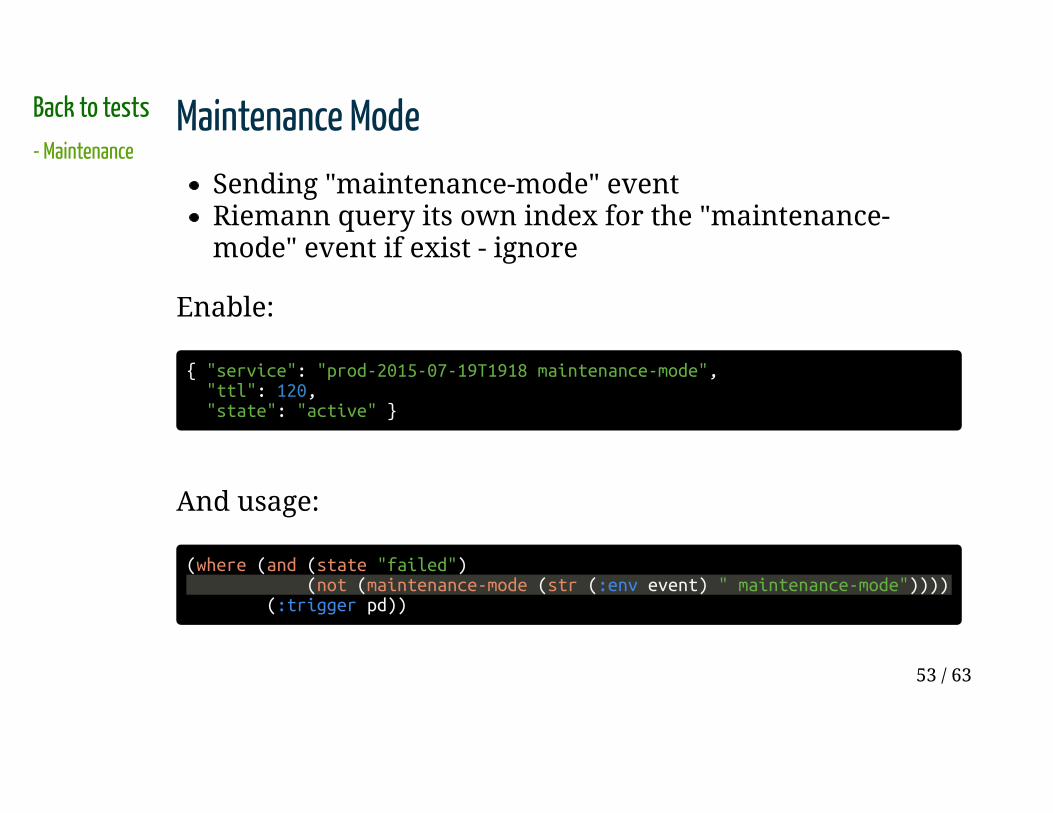
Maintenance Mode
Sending "maintenance-mode" event
Riemann query its own index for the "maintenance-
mode" event if exist - ignore
Enable:
{ "service": "prod-2015-07-19T1918 maintenance-mode", "ttl": 120, "state": "active" }
53 / 63
Back to tests
- Maintenance
Maintenance Mode
Sending "maintenance-mode" event
Riemann query its own index for the "maintenance-
mode" event if exist - ignore
Enable:
{ "service": "prod-2015-07-19T1918 maintenance-mode", "ttl": 120, "state": "active" }
And usage:
(where (and (state "failed") (not (maintenance-mode (str (:env event) " maintenance-mode")))) (:trigger pd))
53 / 63
How can I check heartbeat?
54 / 63
Back to tests
- Maintenance
- Heartbeat alerts
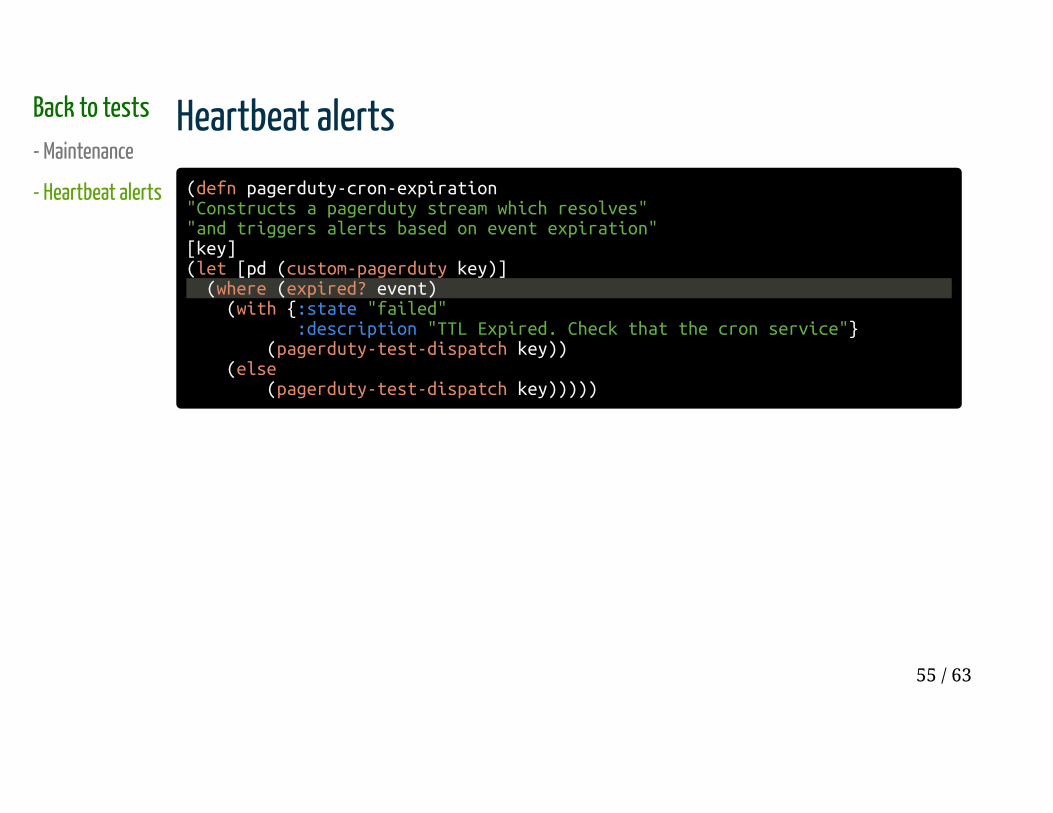
Heartbeat alerts
(defn pagerduty-cron-expiration"Constructs a pagerduty stream which resolves""and triggers alerts based on event expiration"[key] (let [pd (custom-pagerduty key)] (where (expired? event) (with {:state "failed" :description "TTL Expired. Check that the cron service"} (pagerduty-test-dispatch key)) (else (pagerduty-test-dispatch key)))))
55 / 63