Stats151 Spring 2012 Assignment 2...
13
Stats151 Spring 2012 Assignment 2 Solutions Solve the following problems: 4.14, 4.52, 4.80, 4.94, 4.98, 4.112, 4.136 5.10, 5.22, 5.29, 5.62 6.34, 6.60, 6.64, 6.96, 6.118, 6.122, 6.148 7.4, 7.48, 7.72, 7.78 Total Marks = 176 4.14 [4 marks](a) The total number of female hospitalizations for cardiovascular disease was 208,867. Thus, the probability that a randomly selected case was a woman in her 50’s is f/n = 20,983/208,867 = 0.100. (b) The number of women who were less than 50 years old is 810 + 5,029 + 10,977 = 16,816. Thus, the probability that a randomly selected case was a woman less than 50 years old is f/n = 16,816/208,867 = 0.081. (c) The number of women who were between 40 and 69 years old is 10,977 + 20,983 + 36,884 = 68,844. Thus, the probability that a randomly selected case was a woman between 40 and 69 years old is f/n = 68,844/208,867 = 0.330. (d) The number of women who were 70 years old or older is 65,017 + 69167 = 134,184. Thus, the probability that a randomly selected case was a woman less than 50 years old is f/n = 134,184/208,867 = 0.642. 4.52 [6 marks ](a) (not A) = the event that the person is at least 20 years old (b) (B or D) = the event that the person is at least 30 years old (c) (A&C) = the event that the person is under 20 and 50 or older at the same time. There are no people in this event. (d) B and C are not mutually exclusive since people between 50 and 64 are in this event. (e) A, B, and D are mutually exclusive. (f) (not A) includes persons 20 or older while (not D) includes people 64 or younger. Both include all those people between 20 and 64 inclusive, so these two events are not mutually exclusive. 4.80 (a)[3 marks ] P(F) = 0.516; P(D) = 0.104; P(F & D) = 0.060. (b)[1 mark] P(F or D) = 0.516 + 0.104 - 0.060 = 0.560. 56.0% of U.S. adults are either female or divorced (or both). (c)[1 mark] Since male is the complement of female, P(M) = 1 - P(F) = 1 - 0.516 = 0.484. 4.94 (a)[3 marks] First we find cell A 1 T 1 as 1429 – 487 – 203 – 54 – 46 = 639. Then the A 1 total is 6398 + 64 + 41 = 744. The grand total is the sum of the row totals, 744 = 659 + 389 + 162 + 176 = 2130. The T 3 column total is then 2130 – 1429 – 551 = 150. The A 3 T 3 cell entry is 551 – 64 – 131 – 91 – 112 = 153. Finally, the A 3 T 3 cell entry is 389 – 203 – 153 = 33.
Transcript of Stats151 Spring 2012 Assignment 2...

Stats151 Spring 2012 Assignment 2 Solutions
Solve the following problems: 4.14, 4.52, 4.80, 4.94, 4.98, 4.112, 4.136 5.10, 5.22, 5.29, 5.62 6.34, 6.60, 6.64, 6.96, 6.118, 6.122, 6.148 7.4, 7.48, 7.72, 7.78
Total Marks = 176 4.14 [4 marks](a) The total number of female hospitalizations for
cardiovascular disease was 208,867. Thus, the probability that a
randomly selected case was a woman in her 50’s is f/n =
20,983/208,867 = 0.100.
(b) The number of women who were less than 50 years old is 810 + 5,029
+ 10,977 = 16,816. Thus, the probability that a randomly selected
case was a woman less than 50 years old is f/n = 16,816/208,867 =
0.081.
(c) The number of women who were between 40 and 69 years old is 10,977
+ 20,983 + 36,884 = 68,844. Thus, the probability that a randomly
selected case was a woman between 40 and 69 years old is f/n =
68,844/208,867 = 0.330.
(d) The number of women who were 70 years old or older is 65,017 +
69167 = 134,184. Thus, the probability that a randomly selected
case was a woman less than 50 years old is f/n = 134,184/208,867 =
0.642.
4.52 [6 marks ](a) (not A) = the event that the person is at least 20 years old
(b) (B or D) = the event that the person is at least 30 years old
(c) (A&C) = the event that the person is under 20 and 50 or older at the same time. There are no
people in this event.
(d) B and C are not mutually exclusive since people between 50 and 64 are in this event.
(e) A, B, and D are mutually exclusive.
(f) (not A) includes persons 20 or older while (not D) includes people 64 or younger. Both include all
those people between 20 and 64 inclusive, so these two events are not mutually exclusive.
4.80 (a)[3 marks ] P(F) = 0.516; P(D) = 0.104; P(F & D) = 0.060.
(b)[1 mark] P(F or D) = 0.516 + 0.104 - 0.060 = 0.560.
56.0% of U.S. adults are either female or divorced (or both).
(c)[1 mark] Since male is the complement of female, P(M) = 1 - P(F) = 1 - 0.516 = 0.484.
4.94 (a)[3 marks] First we find cell A1 T1 as 1429 – 487 – 203 – 54 – 46 = 639. Then the A1 total is 6398 + 64 +
41 = 744. The grand total is the sum of the row totals, 744 = 659 + 389 + 162 + 176 = 2130. The T3
column total is then 2130 – 1429 – 551 = 150. The A3T3 cell entry is 551 – 64 – 131 – 91 – 112 =
153. Finally, the A3T3 cell entry is 389 – 203 – 153 = 33.
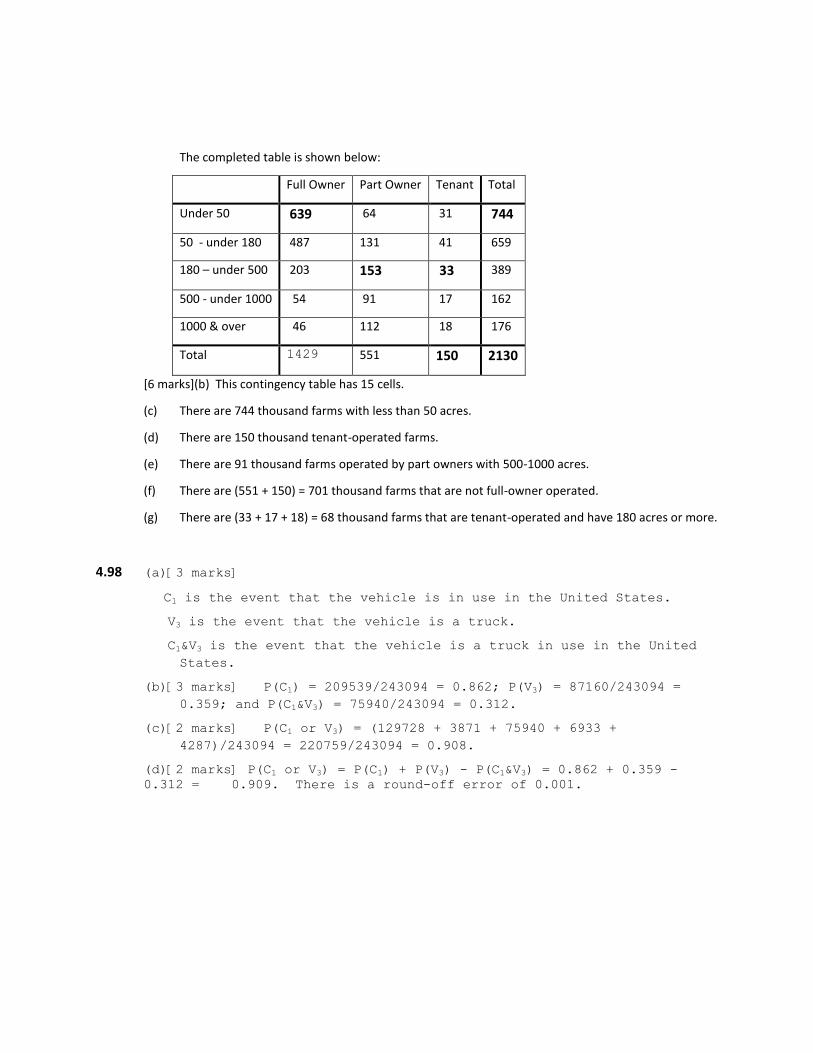
The completed table is shown below:
Full Owner Part Owner Tenant Total
Under 50 639 64 31 744
50 - under 180 487 131 41 659
180 – under 500 203 153 33 389
500 - under 1000 54 91 17 162
1000 & over 46 112 18 176
Total 1429 551 150 2130
[6 marks](b) This contingency table has 15 cells.
(c) There are 744 thousand farms with less than 50 acres.
(d) There are 150 thousand tenant-operated farms.
(e) There are 91 thousand farms operated by part owners with 500-1000 acres.
(f) There are (551 + 150) = 701 thousand farms that are not full-owner operated.
(g) There are (33 + 17 + 18) = 68 thousand farms that are tenant-operated and have 180 acres or more.
4.98 (a)[3 marks]
C1 is the event that the vehicle is in use in the United States.
V3 is the event that the vehicle is a truck.
C1&V3 is the event that the vehicle is a truck in use in the United
States.
(b)[3 marks] P(C1) = 209539/243094 = 0.862; P(V3) = 87160/243094 =
0.359; and P(C1&V3) = 75940/243094 = 0.312.
(c)[2 marks] P(C1 or V3) = (129728 + 3871 + 75940 + 6933 +
4287)/243094 = 220759/243094 = 0.908.
(d)[2 marks] P(C1 or V3) = P(C1) + P(V3) - P(C1&V3) = 0.862 + 0.359 -
0.312 = 0.909. There is a round-off error of 0.001.

(e) [5 marks]
U.S.
C1
Canada
C2
Mexico
C3
Total
Automobiles V1 0.534 0.054 0.035 0.623
Motorcycles V2 0.016 0.001 0.001 0.018
Trucks V3 0.312 0.029 0.018 0.359
0.862 0.084 0.054 1.000
4.112 (a) [1 mark] P(C2) = 33/540 = 0.061
(b) [1 mark]P(C2&L1) = 12/540 = 0.022
(c) [1 mark]P(L1|C2) = 12/33 = 0.364
(d)[2 marks]P(L1|C2) = P(C2&L1)/P(C2) = 0.0222/0.0611 = 0.363
(b) [3 marks]Of all worldwide reported shark attacks, 6.1% were
reported by Brazil with 2.2% of all attacks being fatal and
reported by Brazil. Of the shark attacks reported by Brazil, 36.4%
were fatal.
4.136 (a)[4 marks] P(A) = 18/36 = 0.5; P(B) = 18/36 = 0.5; P(C) = 3/36 = 0.083; P(D) = 18/36 = 0.5.
[6 marks ] (b) P(B A) = 9/18 = 0.5.
(c) Events A and B are independent because P(B A) = P(B).
(d) P(C A) = 2/18 = 0.111
(e) Events A and C are not independent because P(C A) =/ P(C).
(f) P(D A) = 9/18 = 0.5.
(g) Events A and D are independent because P(D A) = P(D).
~~~~~~~~~~~~~~~~~~~~~~~~~~~~~~~~~~~~~~~~~~~~~~~~~~~~~~~~~~~~~~~~~~~~~~~~~~~~~~~~~~~~~~~
5.10 (a)[1 mark] X = 0, 1, 2, 3, 4
(b)[10 marks]The possible outcomes are BBBB, BBBG, BBGB, BGBB, GBBB, BBGG, BGBG, BGGB,
GBBG, GBGB, GGBB, BGGG, GBGG, GGBG, GGGB, GGGG. Thus the probability distribution
is
X P(X = x)
0 1/16
1 4/16
2 6/16
3 4/16
4 1/16
[5 marks] (c) {X = 2}; P(X = 2) = 6/16

0.00
0.05
0.10
0.15
0.20
0.25
0.30
0.35
1 2 3 4 5 6 7
y
P(Y
=y)
(d) {X > 2}; P(X > 2) = P(X =2) + P(X =3) + P(X =4) = 6/16 + 4/16 + 1/16 = 11/16.
(e) {X < 2}; P(X < 2) = P(X = 2) + P(X = 1) + P(X = 0) = 6/16 + 4/16 + 1/16 = 11/16.
(f) {1 < X < 3}; P(1 < X < 3) = P(X = 1) + P(X = 2) + P(X = 3) = 4/16 + 6/16 + 4/16 = 14/16.
(g) {X = 0 or 4}; P(X = 0 or 4) = P(X = 0) + P(X = 4) = 1/16 + 1/16 = 2/16
5.22 The required calculations are
y P(Y=y) yP(Y=y) y2 y2P(Y=y)
1 0.265 0.265 1 0.265
2 0.327 0.654 4 1.308
3 0.161 0.483 9 1.449
4 0.147 0.588 16 2.352
5 0.065 0.325 25 1.625
6 0.022 0.132 36 0.792
7 0.013 0.091 49 0.637
2.538 8.428
(a)[3 marks] y = yP(Y=y) = 2.538. The mean number of persons per housing unit is 2.538.
(b)[3 marks] 2 2 2 8.428 2.538 1.409yy P Y y . Roughly speaking, the
number of persons per housing unit averages about 1.4 away from the mean of 2.538.
(c)[4 marks]
-1.66 -0.26 1.14 2.54 3.94 5.34 6.74
µ-3 µ-2 u– µ µ+ µ+2 µ+3

5.29 (a)[2 marks]
000.1526.0474.0;526.038
20)1(
474.038
18)1(
XP
XP
(b)[2 marks] = x P(X=x) = (1)(0.474) + (-1)(0.526) = -0.052
(c)[1 mark] On the average, you will lose 5.2¢ per play.
(d)[2 marks]If you bet $1 on red 100 times, you can expect to lose 100 0.052 = $5.20. If you bet $1 on
red 1000 times, you can expect to lose $52.00.
(e)[2 marks]Roulette is not a profitable game for a person to play. Parts (c) and (d) demonstrate that, no
matter how much you play, you can expect to lose. Also, part (a) shows that a higher probability is
associated with losing rather than winning.
5.62 The calculations required to answer all parts of this exercise are
0 6 4 2
1 5 5 1
2 4 6
6 6(0) (.314) (.686) 0.1042 (4) (.314) (.686) 0.0686
0 4
6 6(1) (.314) (.686) 0.2862 (5) (.314) (.686) 0.0126
1 5
6 6(2) (.314) (.686) 0.3275 (6) (.314) (.68
2 6
P P
P P
P P 0
3 3
6) 0.0010
6(3) (.314) (.686) 0.1999
3P
(a)[1 mark] P(exactly 3) = 0.1999
(b)[1 mark] P(exactly 5)) = 0.0126
(c)[1 mark] P(at least 5) = 0.0126 + 0.0010 = = 0.0136
(d)[1 mark] P(3 or 4 or 5) = 0.1999 + 0.0686 + 0.0126 = 0.2811
(e)[6 marks]
x P(X=x)
0 0.1042
1 0.2862
2 0.3275
3 0.1999
4 0.0686
5 0.0126
6 0.0010 (f)[1 mark] The distribution is right skewed since p is less than 0.5, or by looking at the results in (e) or (g)
(g)[4 marks]

x
103.686.469.252.034.817.60.4
(h)[4 marks] The necessary calculations are
x P(X=x) xP(X=x) x2 x2P(X=x)
0 0.1042 0.0000 0 0
1 0.2862 0.2862 1 0.2862
2 0.3275 0.6550 4 1.3100
3 0.1999 0.5997 9 1.7991
4 0.0686 0.2748 16 1.0976
5 0.0126 0.0630 25 0.3150
6 0.0010 0.0060 36 0.0360
1.8843 4.8439
The mean is 1.8843
2 = 4.8439 – 1.8843
2 = 1.2933; = 1.1372
(i)[2 marks] = np = 6(0.314) = 1.884; 2 = np(1-p) = 6(.314)(.686) = 1.2924, so = 1.1368
(j)[1 mark] On average, the gestation period for 1.884 out of each 6 births will exceed 9 months.
~~~~~~~~~~~~~~~~~~~~~~~~~~~~~~~~~~~~~~~~~~~~~~~~~
6.34 [5 marks](a)
0.00
0.05
0.10
0.15
0.20
0.25
0.30
0.35
0 1 2 3 4 5 6
x
P(X
=x)

z
3210-1-2-3
0.4
0.3
0.2
0.1
0.0
z
P(z
)
43210-1-2-3-4
0.4
0.3
0.2
0.1
0.0
0.0166
(b) z = (x – 52.0)/17.2
(c) z has a standard normal distribution (µ = 0 and = 1).
(d) The percentage of adult green sea urchins with weights between 50 g
and 60 g is equal to the area under the standard normal curve
between -0.12 and 0.47.
(e) The percentage of adult green sea urchins with weights above 40 g
is equal to the area under the standard normal curve that lies to
the right of -0.70.
6.60 [4 marks](a) (b)
z
P(z
)
43210-1-2-3-4
0.4
0.3
0.2
0.1
0.0
0.7981

Area = 0.9875 – 0.1894 = 0.7981 Area = 0.0228 – 0.0062 = 0.0166
(c) (d)
Area = 0.9961 – 0.9306 = 0.0661 Area = 0.8413 – 0.0000 = 0.8413
6.64 [4 marks](a)The area to the left of z = 1.96 is 0. 9750. The area to the left of z = -1.96 is 0.0250.
The area between z = -1.96 and z = 1.96 is 0.9750 - 0.0250 = 0.9500.
(b) The area to the left of z = 2.33 is 0.9901. The area to the left of z = -2.33 is 0.0099. The
area between z = -2.33 and z = 2.33 is 0.9901 - 0.0099 = 0.9802.
(c) The area to the left of z = -1.28 is 0.1003. The area to the right of z = 1.28 is 1.0000 -
0.8997 = 0.1003. The area either to the left of z = -1.28 or to the right of z = 1.28 is 0.1003
+ 0.1003 = 0.2006.
(d) The area to the left of z = -1.64 is 0.0505. The area to the right of z = 1.64 is 1.0000 -
0.9495 = 0.0505. The area either to the left of z = -1.64 or to the right of z = 1.64 is 0.0505
+ 0.0505 = 0.1010.
6.96 (a)[4 marks] For adult green sea urchins with weights of 50 and 60 g, the z-values are
50 52 60 52
0.12 and 0.47.17.2 17.2
z z
The area to the left of z = -0.12 is 0.4522 and the area to the
left of z = 0.47 is 0.6808. Therefore the area between z = -0.12
and z = 0.47 is 0.6808 - 0.4522 = 0.2286. Thus the percentage of
adult green sea urchins with weights between 50 g and 60 g is
22.86%.
(b)[2 marks] For a weight of 40 g, the z value is
40 520.70.
17.2z
The area to the left of z = -0.70 is 0.2420. The area to the right
of z = -0.70 is 1 – 0.2420 = 0.7580. Thus the percentage of adult
green sea urchins with weights above 40 g is 75.80%.
z
P(z
)
43210-1-2-3-4
0.4
0.3
0.2
0.1
0.0
0.0661
z
P(z
)
43210-1-2-3-4
0.4
0.3
0.2
0.1
0.0
0.8413

(c)[3 marks] Using Table II, we find that an area of 0.9000 lies to
left of z = 1.28. We convert this z-value to an x-value
using x = µ + z . Thus 90% of the adult green sea urchin weights
were less than the 90th percentile, x = 52.0 + (1.28)(17.2) = 74.0
g.
(d)[3 marks]The sixth decile is the same as the 60th percentile. Using
Table II, we find that an area of 0.6000 lies to the left of z =
0.25. We convert this z-value to an x-value using x = µ + z .
Thus, 60% of the adult green sea urchin weights were less than the
60th percentile, x = 52.0 + (0.25)(17.2) = 56.3 g.
6.118 [1 mark] The variable is approximately normally distributed because the normal probability plot is approximately linear.
6.122 [1 mark]The variable is not normally distributed because the normal
probability plot is not linear and is instead curved.
6.148 For parts (a), (b), and (c), steps 1-3 are as follows:
Step 1: n = 250; p = 0.039
Step 2: np = 9.75; n(1 - p) = 240.25. Since both np and n(1 -
p) are at least 5, the normal approximation can be used.
Step 3:
xnp
np p
250 0 039 9 75
1 250 0 039 0 961 3 061
(. ) .
( ) (. )(. ) .x
(a)[1 mark] P(x = 4):
Step 4: For x = 3.5 and x = 4.5, the z-scores are
3.5 9.75 4.5 9.75
2.04 and 1.72.3.061 3.061
z z
The area to the left of z = -2.04 is 0.0207 and the area
to the left of z = -1.72 is 0.0427. Therefore, the
approximate probability that X is four is 0.0427 –
0.0207 = 0.0220.
(b)[2 marks] Step 4: For x = 3.5 and x = 10.5, the z-scores are
3.5 9.75 395 9.75
2.04 and 0.08.3.061 3.061
z z
The area to the left of z = -2.04 is 0.0207 and the area
to the left of z = -0.08 is 0.4681. Therefore, the
approximate probability that X is between 4 and 10
inclusive, is 0.4681 – 0.0207 = 0.4474.
(c)[1 mark] Step 4: For x = 9.5, the z-score is
9.5 9.75
0.08.3.061
z
The area to the left of -0.08 is 0.4681. Thus,
probability that X is at least 10 is 1.0000 – 0.4681 =
0.5319.
(d)[1 mark] In Step 2, we found that np = 9.75. This meets the
minimum requirement of at least 5, but it is close to 5. The
larger the values of np and n(1-p), the better the normal
approximation to the binomial distribution. Since 9.75 is a
smaller number, the normal approximation is acceptable, but not the
most accurate approximation.
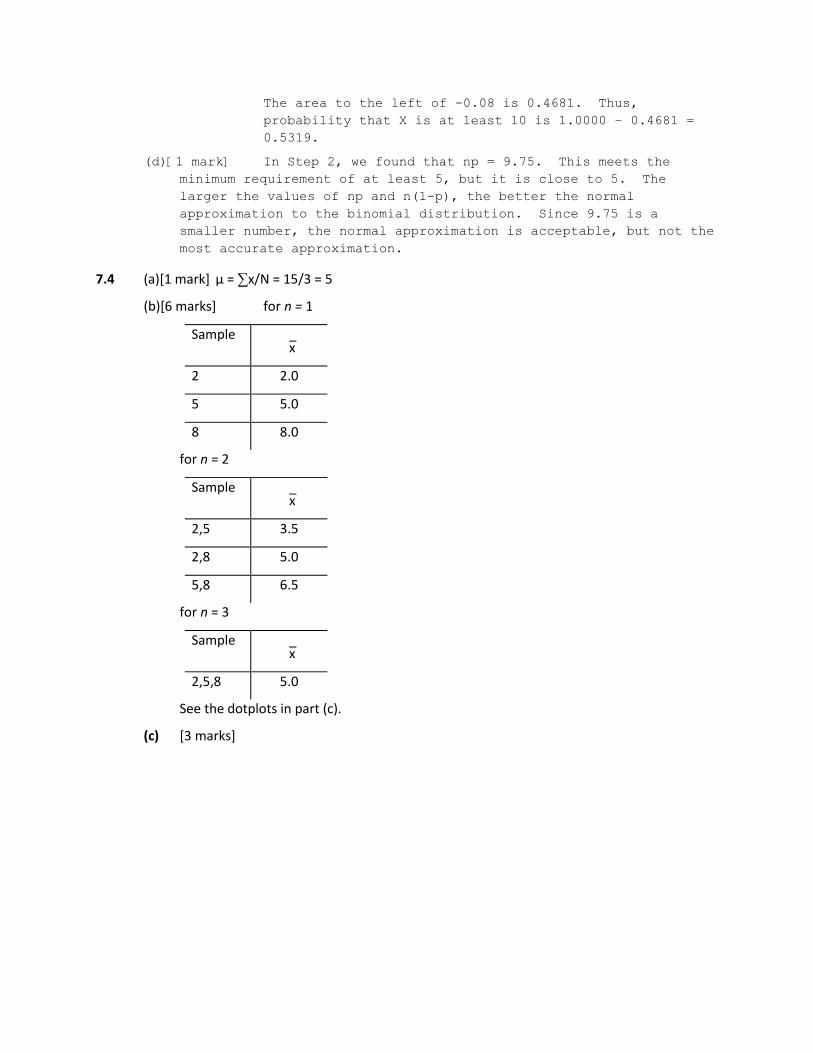
7.4 (a)[1 mark] µ = ∑x/N = 15/3 = 5
(b)[6 marks] for n = 1
Sample x_
2 2.0
5 5.0
8 8.0
for n = 2
Sample x_
2,5 3.5
2,8 5.0
5,8 6.5
for n = 3
Sample x_
2,5,8 5.0
See the dotplots in part (c).
(c) [3 marks]

8.07.57.06.56.05.55.04.54.03.53.02.52.0
n=1
n=2
n=3
The sample means cluster more closely around the population mean as the sample size
increases. Sampling error is smaller for large samples than for small samples.
(d)[3 marks] For n = 1, one out of the three sample means equaled the population mean.
Thus, the probability that the sample mean equals the population mean for n = 1 is 1/3.
For n = 2, one out of the three sample means equaled the population mean. Thus, the
probability that the sample mean equals the population mean for n = 2 is 1/3.
For n = 3, the one sample mean equals the population mean, Thus, the probability that the
sample mean equals the population mean for n = 3 is 1.0.
(e)[3 marks] If the absolute value of the difference between the sample mean and the
population mean is at most 0.5, that means that we are looking for sample means within
the range 4.5 to 5.5, inclusive.
For n = 1, one out of the three sample means is in this range. Thus, the probability that
the sampling error will be 0.5 or less for n = 1 is 1/3.
For n = 2, one of the three sample means are in this range. Thus, the probability that the
sampling error will be 0.5 or less for n = 2 is 1/3.
For n = 3, the one sample mean is in this range. Thus, the probability that the sampling
error will be 0.5 or less for n = 3 is 1.0.
7.48 (a)[2 marks] 44.8 years; / 5.87 / 40 0.928 yearsx x n
Thus, for samples of size 40, the mean and standard deviation of
all possible sample means are respectively, 44.8 years and 0.93
years.
(b)[2 marks] 44.8 years; / 5.87 / 120 0.536 yearsx x n
Thus, for samples of size 120, the mean and standard deviation of
all possible sample means are respectively, 44.8 years and 0.54
years.

7.72 (a)[2 marks] The sampling distribution of the sample mean for samples
of size 200 will be approximately normal with a mean of $6.74
million and a standard deviation of
/ 15.37 / 200 1.087 millionx n . Thus, if all possible sample
means for samples of size 200 were found, their distribution would
be approximately normal with mean $6.74 million and standard
deviation $1.087 million.
(b) [2 marks]The sampling distribution of the sample mean for samples
of size 600 will be approximately normal with a mean of $6.74
million and a standard deviation of
/ 15.37 / 600 $0.627 million.x n Thus, if all possible sample
means for samples of size 600 were found, their distribution would
be approximately normal with mean $6.74 million and standard
deviation $0.627 million.
(c)[2 marks] These results follow from the central limit theorem,
which implies that for large samples (n > 30), the distribution
of the sample mean will be approximately normal regardless of the
distribution of the original variable.
(d)[4 marks] 15.37 / 200 1.087x ; we want P(5.74 < x_ < 7.74).
z-score computations: Area less than z:
5.74 6.74
5.74 0.92 0.17881.087
x z
7.74 6.74
7.74 0.92 0.82121.087
x z x z130130 140
0 0635157.
. .
.. 0.0582
Total area = 0.8212 - 0.1788 = 0.6424
Thus, 64.24% of samples of size 200 will have a mean that is
within $1 million of the population mean, i.e., 64.24% of the
samples will have a sampling error less than $1 million for
samples of size 200.
(e)[4 marks] 15.37 / 600 0.627x ; we want P(5.74 < x_ < 7.74).
z-score computations: Area less than z:
5.74 6.74
5.74 1.59 0.05590.627
x z
7.74 6.74
7.74 1.59 0.94410.627
x z x z130130 140
0 0635157.
. .
.. 0.0582
Total area = 0.9441 - 0.0559 = 0.8882

Thus, 88.82% of samples of size 600 will have a mean that is
within $1 million of the population mean, i.e., 88.82% of the
samples will have a sampling error less than $1 million for
samples of size 600.
7.78 [4 marks]In solving this problem, we have to assume that the distribution of age at diagnosis of people with early onset dementia is
approximately normally distributed. Then, the distribution of the
sample means will be approximately normally distributed. The
distribution of the sample means have a mean 55 years and standard
deviation of / 6.8 / 21 1.484.x n We want ( 52.5) :P x
z-score computation: Area less than z:
52.5 5552.5 1.68 0.0465
1.484x z
Total area = 0.0465.
The probability is 0.0465 that samples of 21 people with early-onset
dementia will have a mean age at diagnosis less than 52.5 years.