Stats Enclosure
4
Page 1 of 4 ANNUAL STATISTICS 1 July 2009 – 30 June 2010 Thank you to all services that sent in their completed statistical returns. This information is a summary of the national totals.
Transcript of Stats Enclosure
8/8/2019 Stats Enclosure
http://slidepdf.com/reader/full/stats-enclosure 1/4
Page 1 of 4
ANNUAL STATISTICS 1 July 2009 – 30 June 2010
Thank you to all services that sent in their completed statistical returns. This information is a summary of the national totals.
8/8/2019 Stats Enclosure
http://slidepdf.com/reader/full/stats-enclosure 2/4
8/8/2019 Stats Enclosure
http://slidepdf.com/reader/full/stats-enclosure 3/4Page 3 of 4
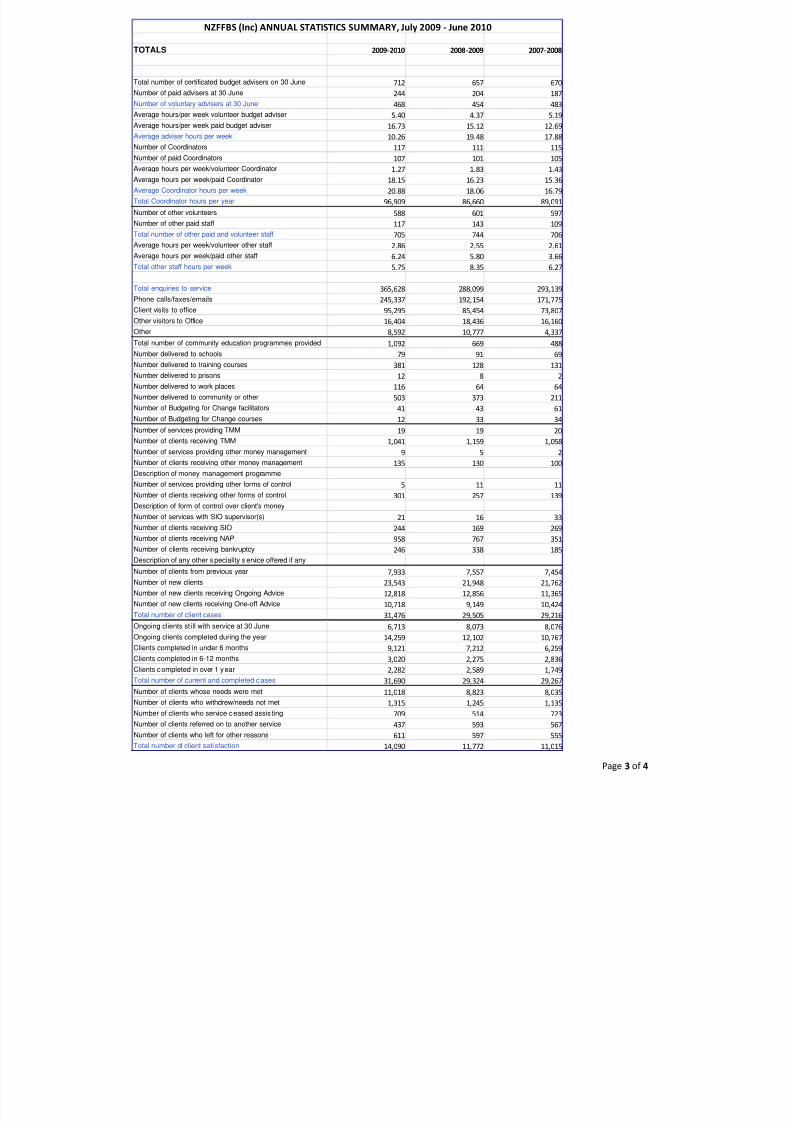
TOTALS 2009‐2010 2008‐2009 2007‐2008
Total number of certificated budget advisers on 30 June 712 657 670
Number of paid advisers at 30 June 244 204 187
Number of voluntary advisers at 30 June 468 454 483
Average hours/per week volunteer budget adviser 5.40 4.37 5.19
Average hours/per week paid budget adviser 16.73 15.12 12.69
Average adviser hours per week 10.26 19.48 17.88
Number of Coordinators 117 111 115
Number of paid Coordinators 107 101 105
Average hours per week/volunteer Coordinator 1.27 1.83 1.43
Average hours per week/paid Coordinator 18.15 16.23 15.36
Average Coordinator hours per week 20.88 18.06 16.79
Total Coordinator hours per year 96,909 86,660 89,091
Number of other volunteers 588 601 597
Number of other paid staff 117 143 109
Total number of other paid and volunteer staff 705 744 706
Average hours per week/volunteer other staff 2.86 2.55 2.61
Average hours per week/paid other staff 6.24 5.80 3.66
Total other staff hours per week 5.75 8.35 6.27
Total enquiries to service 365,628 288,099 293,139
Phone calls/faxes/emails245,337 192,154 171,775
Client visits to office 95,295 85,454 73,807
Other visitors to Office 16,404 18,436 16,160
Other 8,592 10,777 4,337
Total number of community education programmes provided 1,092 669 488
Number delivered to schools 79 91 69
Number delivered to training courses 381 128 131
Number delivered to prisons 12 8 2
Number delivered to work places 116 64 64
Number delivered to community or other 503 373 211
Number of Budgeting for Change facilitators 41 43 61
Number of Budgeting for Change courses 12 33 34
Number of services providing TMM 19 19 20
Number of clients receiving TMM 1,041 1,159 1,058
Number of services providing other money management 9 5 2Number of clients receiving other money management 135 130 100
Description of money management programme
Number of services providing other forms of control 5 11 11
Number of clients receiving other forms of control 301 257 139
Description of form of control over client's money
Number of services with SIO supervisor(s) 21 16 33
Number of clients receiving SIO 244 169 269
Number of clients receiving NAP 958 767 351
Number of clients receiving bankruptcy 246 338 185
Description of any other s peciality s ervice offered if any
Number of clients from previous year 7,933 7,557 7,454
Number of new clients 23,543 21,948 21,762
Number of new clients receiving Ongoing Advice 12,818 12,856 11,365
Number of new clients receiving One-off Advice 10,718 9,149 10,424Total number of client cases 31,476 29,505 29,216
Ongoing clients st ill with service at 30 June 6,713 8,073 8,076
Ongoing clients completed during the year 14,259 12,102 10,767
Clients completed in under 6 months 9,121 7,212 6,259
Clients completed in 6-12 months 3,020 2,275 2,836
Clients completed in over 1 year 2,282 2,589 1,749
Total number of current and completed c ases 31,690 29,324 29,267
Number of clients whose needs were met 11,018 8,823 8,035
Number of clients who withdrew/needs not met 1,315 1,245 1,135
Number of clients who service ceased assis ting 709 514 723
Number of clients referred on to another service 437 593 567
Number of clients who left for other reasons 611 597 555
Total number of client satisfaction 14,090 11,772 11,015
NZFFBS (Inc) ANNUAL STATISTICS SUMMARY, July 2009 ‐ June 2010
8/8/2019 Stats Enclosure
http://slidepdf.com/reader/full/stats-enclosure 4/4Page 4 of 4
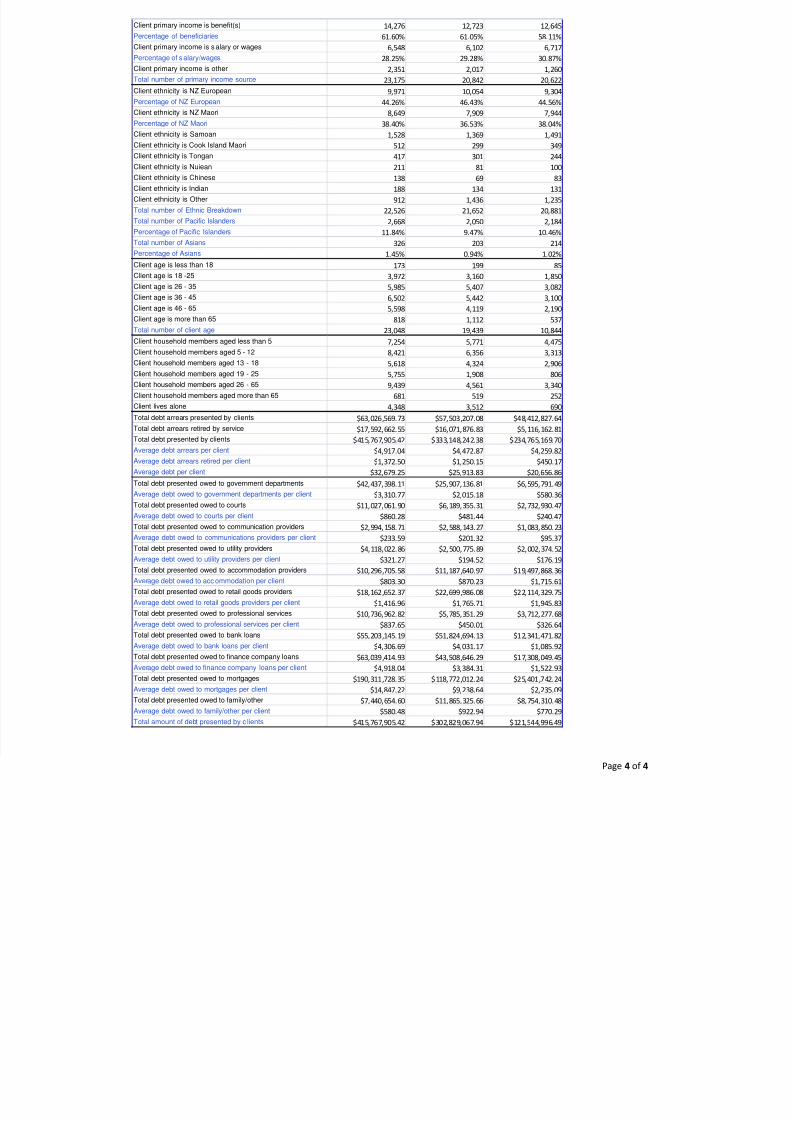
Client primary income is benefit(s) 14,276 12,723 12,645
Percentage of beneficiaries 61.60% 61.05% 58.11%
Client primary income is salary or wages 6,548 6,102 6,717
Percentage of salary/wages 28.25% 29.28% 30.87%
Client primary income is other 2,351 2,017 1,260
Total number of primary income source 23,175 20,842 20,622
Client ethnicity is NZ European 9,971 10,054 9,304
Percentage of NZ European 44.26% 46.43% 44.56%
Client ethnicity is NZ Maori 8,649 7,909 7,944
Percentage of NZ Maori 38.40% 36.53% 38.04%
Client ethnicity is Samoan 1,528 1,369 1,491
Client ethnicity is Cook Island Maori 512 299 349
Client ethnicity is Tongan 417 301 244
Client ethnicity is Nuiean 211 81 100
Client ethnicity is Chinese 138 69 83
Client ethnicity is Indian 188 134 131
Client ethnicity is Other 912 1,436 1,235
Total number of Ethnic Breakdown 22,526 21,652 20,881
Total number of Pacific Islanders 2,668 2,050 2,184
Percentage of Pacific Islanders 11.84% 9.47% 10.46%
Total number of Asians 326 203 214
Percentage of Asians 1.45% 0.94% 1.02%
Client age is less than 18 173 199 85
Client age is 18 -25 3,972 3,160 1,850
Client age is 26 - 35 5,985 5,407 3,082
Client age is 36 - 45 6,502 5,442 3,100
Client age is 46 - 65 5,598 4,119 2,190
Client age is more than 65 818 1,112 537
Total number of client age 23,048 19,439 10,844
Client household members aged less than 5 7,254 5,771 4,475
Client household members aged 5 - 12 8,421 6,356 3,313
Client household members aged 13 - 18 5,618 4,324 2,906
Client household members aged 19 - 25 5,755 1,908 806
Client household members aged 26 - 65 9,439 4,561 3,340
Client household members aged more than 65 681 519 252
Client lives alone 4,348 3,512 690
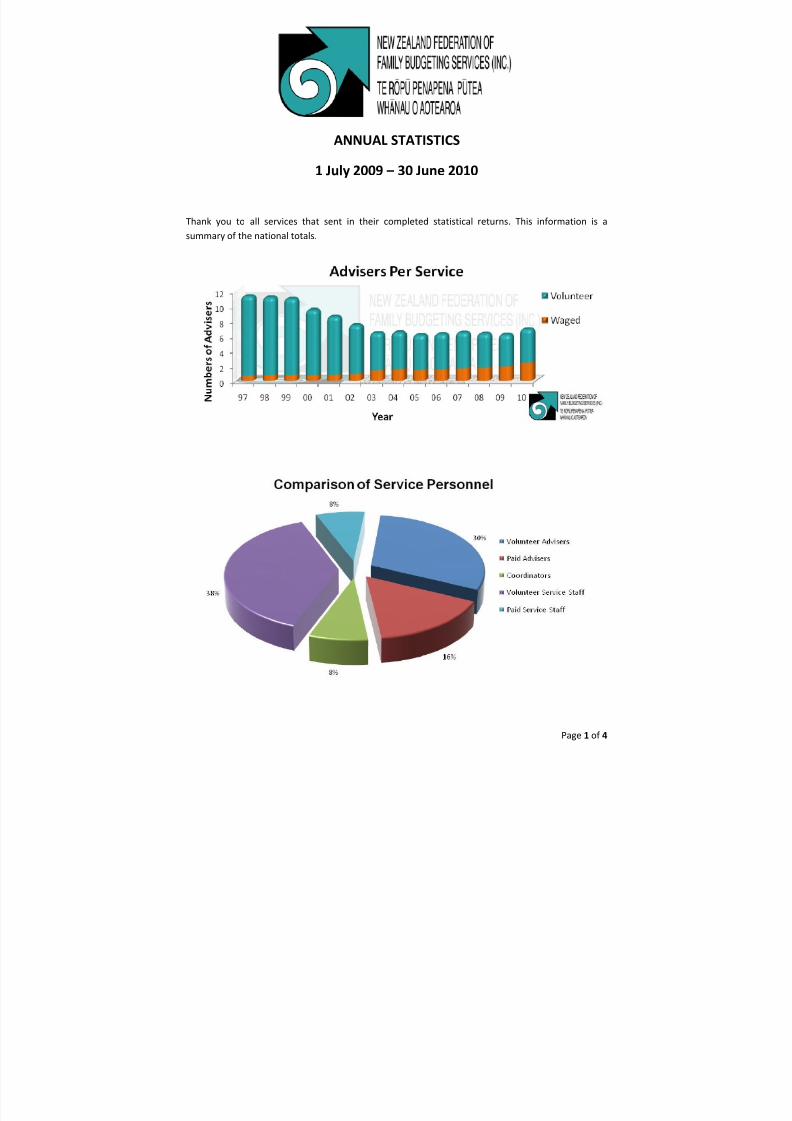
Total debt arrears presented by clients $63,026,569.73 $57,503,207.08 $48,412,827.64
Total debt arrears retired by service $17,592,662.55 $16,071,876.83 $5,116,162.81
Total debt presented by clients $415,767,905.42 $333,148,242.38 $234,765,169.70
Average debt arrears per client $4,917.04 $4,472.87 $4,259.82
Average debt arrears retired per client $1,372.50 $1,250.15 $450.17
Average debt per client $32,679.25 $25,913.83 $20,656.86
Total debt presented owed to government departments $42,437,398.11 $25,907,136.81 $6,595,791.49
Average debt owed to government departments per client $3,310.77 $2,015.18 $580.36
Total debt presented owed to courts $11,027,061.90 $6,189,355.31 $2,732,930.47
Average debt owed to courts per client $860.28 $481.44 $240.47
Total debt presented owed to communication providers $2,994,158.71 $2,588,143.27 $1,083,850.23
Average debt owed to communications providers per client $233.59 $201.32 $95.37
Total debt presented owed to utility providers $4,118,022.86 $2,500,775.89 $2,002,374.52
Average debt owed to utility providers per client $321.27 $194.52 $176.19
Total debt presented owed to accommodation providers $10,296,705.58 $11,187,640.97 $19,497,868.36
Average debt owed to acc ommodation per client $803.30 $870.23 $1,715.61
Total debt presented owed to retail goods providers $18,162,652.37 $22,699,986.08 $22,114,329.75
Average debt owed to retail goods providers per client$1,416.96 $1,765.71 $1,945.83Total debt presented owed to professional services $10,736,962.82 $5,785,351.29 $3,712,277.68
Average debt owed to professional services per client $837.65 $450.01 $326.64
Total debt presented owed to bank loans $55,203,145.19 $51,824,694.13 $12,341,471.82
Average debt owed to bank loans per client $4,306.69 $4,031.17 $1,085.92
Total debt presented owed to finance company loans $63,039,414.93 $43,508,646.29 $17,308,049.45
Average debt owed to finance company loans per client $4,918.04 $3,384.31 $1,522.93
Total debt presented owed to mortgages $190,311,728.35 $118,772,012.24 $25,401,742.24
Average debt owed to mortgages per client $14,847.22 $9,238.64 $2,235.09
Total debt presented owed to family/other $7,440,654.60 $11,865,325.66 $8,754,310.48
Average debt owed to family/other per client $580.48 $922.94 $770.29
Total amount of debt presented by c lients $415,767,905.42 $302,829,067.94 $121,544,996.49