Statoil US Onshore - Equinor · •Total well cost ~ 90% of upstream capex – margin leverage...
27
Statoil US Onshore Jefferies Global Energy Conference, November 2014 Torstein Hole, Senior Vice President
Transcript of Statoil US Onshore - Equinor · •Total well cost ~ 90% of upstream capex – margin leverage...
Statoil US Onshore Jefferies Global Energy Conference, November 2014
Torstein Hole, Senior Vice President

Marcellus
Eagle Ford
Stamford
Houston
Bakken
Austin
Williston
Statoil Office Statoil Asset
2013
2012
2011
2010
2008
1987
Eagle Ford Operator
Marcellus Operator
Bakken Operator
Eagle Ford
Marcellus
Oil trading, New York
US Onshore competitively positioned
2
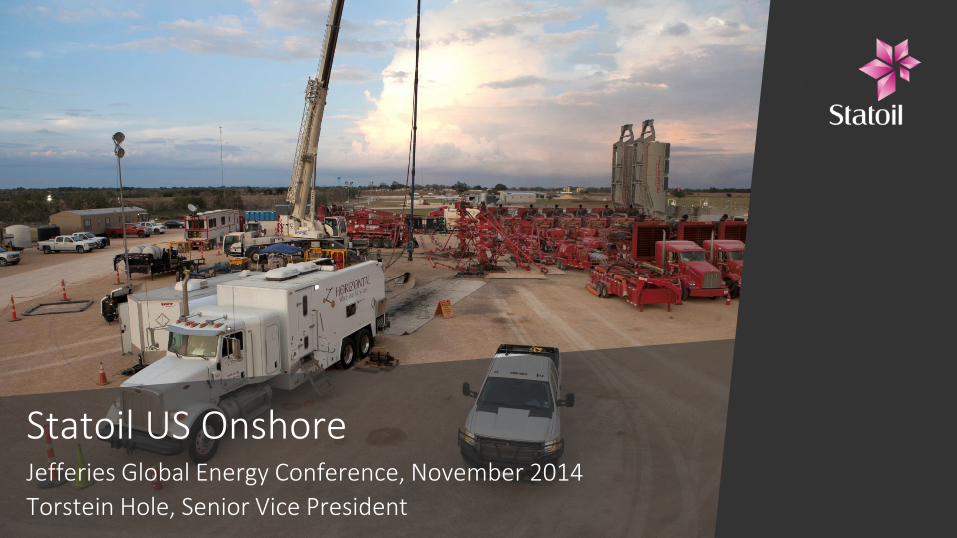
Premium portfolio in core plays
Bakken
• ~ 275 000 net acres, Light tight oil
• Concentrated liquids drilling
• Production ~ 55 kboepd
Eagle Ford
• ~ 60 000 net acres, Liquids rich
• Liquids ramp-up
• Production ~34 koepd
Marcellus
• ~ 600 000 net acres, Gas
• Production ~130 kboepd
3
Shale revolution: just the end of the beginning
• Entering mature phase – companies with sustainable, responsible development approach will be
the winners
• Statoil is taking long term view. Portfolio robust under current and forecast price assumptions.
• Continuous, purposeful improvement is key
− Technology/engineering
− Constant attention to costs
4
• Ensuring our operating model is fit for Onshore Operations
• Doing our part to maintain the company’s capex commitments
• Leading the way to reduce flaring in Bakken
• Not just reducing costs – increasing free cash flow
5
Statoil taking operations to the next level

Fast-track identification, development & implementation of short-term technology upsides
• Choke management • Refracturing • Emissions, water and waste
Management
Prioritised development of potential game-changing technologies
• Non-aqueous fracturing systems
• Cost-effective gas injection EOR technologies
• Advanced proppants
The application of technology
6
Continuous focus on cost, efficiency and optimisation of operations
• Stage Length Optimization • Slickwater Fracs • CNG in a Box
– MEDIUM – SHORT TERM LONG TERM
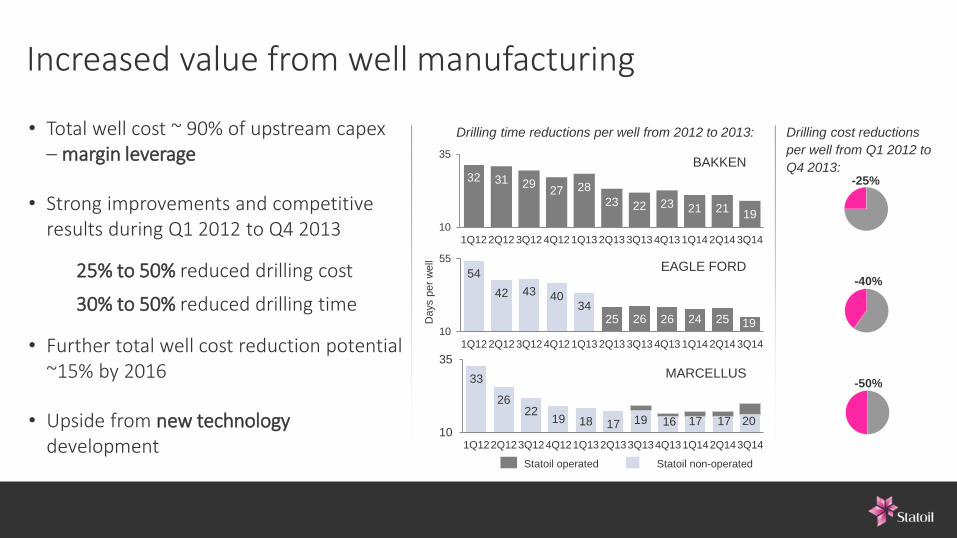
• Total well cost ~ 90% of upstream capex – margin leverage
• Strong improvements and competitive results during Q1 2012 to Q4 2013
25% to 50% reduced drilling cost
30% to 50% reduced drilling time
• Further total well cost reduction potential ~15% by 2016
• Upside from new technology development
Increased value from well manufacturing
Statoil operated Statoil non-operated
Drilling cost reductions
per well from Q1 2012 to
Q4 2013:
-25%
-40%
-50%
32 31 29 27 28
23 22 23 21 21 19
10
35
1Q12 2Q12 3Q12 4Q12 1Q13 2Q13 3Q13 4Q13 1Q14 2Q14 3Q14
54
42 43 40 34
25 26 26 24 25 19 10
55
1Q12 2Q12 3Q12 4Q12 1Q13 2Q13 3Q13 4Q13 1Q14 2Q14 3Q14
33
26 22
19 18 17 19 16 17 17 20 10
35
1Q122Q123Q124Q121Q132Q133Q134Q131Q142Q143Q14
BAKKEN
EAGLE FORD
MARCELLUS
Days p
er
well
Drilling time reductions per well from 2012 to 2013:
Sometimes, you have to spend more to make more
8
• In Bakken and Eagle Ford we have intentionally increased our D&C spending to
implement techniques that increase recovery
• Bakken: increasing our D&C costs by 10% - and increasing our recovery by 25% in 2015
• Eagle Ford: increasing our D&C costs by 19% - and increasing our recovery by 21% in 2015
• Cycle times continue to fall
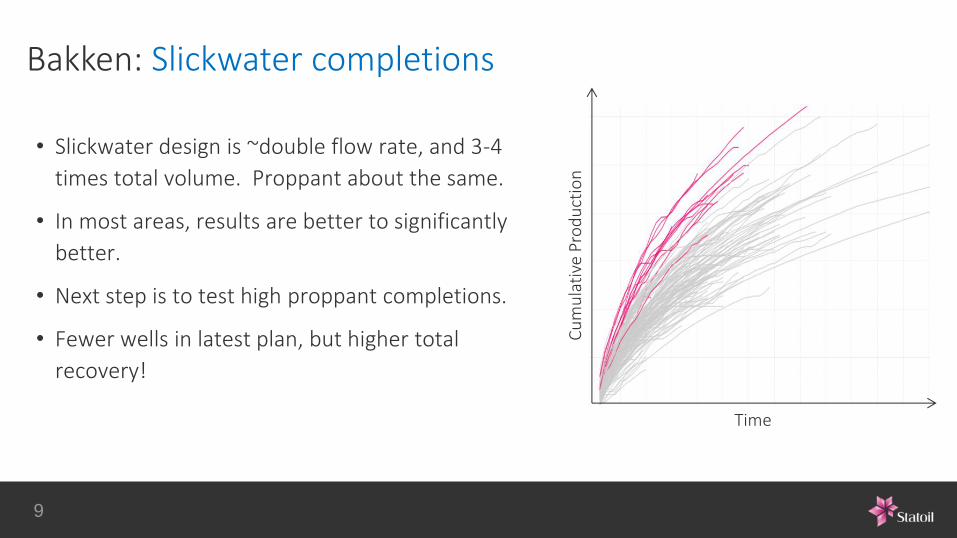
Bakken: Slickwater completions
9
• Slickwater design is ~double flow rate, and 3-4
times total volume. Proppant about the same.
• In most areas, results are better to significantly
better.
• Next step is to test high proppant completions.
• Fewer wells in latest plan, but higher total
recovery!
Time
Cu
mu
lati
ve P
rod
uct
ion
Eagle Ford: Rapid Improvement Injection
10
• Shift to Rotary Steerable tools = more precise well placement = increased EUR
− STO with RSS ~90% in zone, vs 60% previously
• Decrease in Stage spacing = 25% increase in stages = 20% increase in EUR
• Manage chokes to maximize liquids yield
• Adding additional horizons to extend drilling program. = > 150 new Net wells in plan =
>$400M additional value
− Downspacing, vertical staggering and upper EF

Eagle Ford: Step Change in Drilling Efficiency
11
Continued improvements in cycle time
• Best well drilled in 15 days: thought to be
our theoretical “perfect” well
• The next well was even shorter (12.7
days)
• Very close to 2 rigs delivering the same
wells as 3 used to
Rig Release Date
Feet
per
Day
n Talisman t Statoil
Summary
12
• Relentless focus on efficiency and improvement
− YOY reduction of 10% in Capex for the same activity
• Increasing recovery within corporate CAPEX frame
• Evolving operating model to continue improvements in our operations.

Forward looking statements
13
This report contains certain forward-looking statements that involve risks and uncertainties. In some cases, we use
words such as "ambition", "continue", "could", "estimate", "expect", "focus", "likely", "may", "outlook", "plan",
"strategy", "will", "guidance" and similar expressions to identify forward-looking statements. All statements other
than statements of historical fact, including, among others, statements regarding future financial position, results of
operations and cash flows; changes in the fair value of derivatives; future financial ratios and information; future
financial or operational portfolio or performance; future market position and conditions; business strategy; growth
strategy; future impact of accounting policy judgments; sales, trading and market strategies; research and
development initiatives and strategy; market outlook and future economic projections and assumptions; competitive
position; projected regularity and performance levels; expectations related to our recent transactions and projects,
such as the discovery in Tanzania, the Rosneft cooperation, developments at Johan Sverdrup, the Wintershall
agreement, the Ormen Lange redetermination, the farming down of interests in Mozambique and the sale of
producing assets in the Gulf of Mexico; completion and results of acquisitions, disposals and other contractual
arrangements; reserve information; future margins; projected returns; future levels, timing or development of
capacity, reserves or resources; future decline of mature fields; planned maintenance (and the effects thereof); oil
and gas production forecasts and reporting; domestic and international growth, expectations and development of
production, projects, pipelines or resources; estimates related to production and development levels and dates;
operational expectations, estimates, schedules and costs; exploration and development activities, plans and
expectations; projections and expectations for upstream and downstream activities; oil, gas, alternative fuel and
energy prices; oil, gas, alternative fuel and energy supply and demand; natural gas contract prices; timing of gas
off-take; technological innovation, implementation, position and expectations; projected operational costs or
savings; projected unit of production cost; our ability to create or improve value; future sources of financing;
exploration and project development expenditure; effectiveness of our internal policies and plans; our ability to
manage our risk exposure; our liquidity levels and management; estimated or future liabilities, obligations or
expenses and how such liabilities, obligations and expenses are structured; expected impact of currency and
interest rate fluctuations; expectations related to contractual or financial counterparties; capital expenditure
estimates and expectations; projected outcome, objectives of management for future operations; impact of PSA
effects; projected impact or timing of administrative or governmental rules, standards, decisions, standards or laws
(including taxation laws); estimated costs of removal and abandonment; estimated lease payments, gas transport
commitments and future impact of legal proceedings are forward-looking statements. You should not place undue
reliance on these forward-looking statements. Our actual results could differ materially from those anticipated in the
forward-looking statements for many reasons.
These forward-looking statements reflect current views about future events and are, by their nature, subject to
significant risks and uncertainties because they relate to events and depend on circumstances that will occur in the
future. There are a number of factors that could cause actual results and developments to differ materially from
those expressed or implied by these forward-looking statements, including levels of industry product supply,
demand and pricing; price and availability of alternative fuels; currency exchange rate and interest rate
fluctuations; the political and economic policies of Norway and other oil-producing countries; EU directives; general
economic conditions; political and social stability and economic growth in relevant areas of the world; the sovereign
debt situation in Europe; global political events and actions, including war, terrorism and sanctions; security
breaches; situation in Ukraine; changes or uncertainty in or non-compliance with laws and governmental
regulations; the timing of bringing new fields on stream; an inability to exploit growth or investment opportunities;
material differences from reserves estimates; unsuccessful drilling; an inability to find and develop reserves;
ineffectiveness of crisis management systems; adverse changes in tax regimes; the development and use of new
technology; geological or technical difficulties; operational problems; operator error; inadequate insurance
coverage; the lack of necessary transportation infrastructure when a field is in a remote location and other
transportation problems; the actions of competitors; the actions of field partners; the actions of governments
(including the Norwegian state as majority shareholder); counterparty defaults; natural disasters and adverse
weather conditions, climate change, and other changes to business conditions; an inability to attract and retain
personnel; relevant governmental approvals (including in relation to the agreement with Wintershall); industrial
actions by workers and other factors discussed elsewhere in this report. Additional information, including
information on factors that may affect Statoil's business, is contained in Statoil's Annual Report on Form 20-F for
the year ended December 31, 2013, filed with the U.S. Securities and Exchange Commission, which can be found
on Statoil's website at www.statoil.com.
Although we believe that the expectations reflected in the forward-looking statements are reasonable, we cannot
assure you that our future results, level of activity, performance or achievements will meet these expectations.
Moreover, neither we nor any other person assumes responsibility for the accuracy and completeness of the
forward-looking statements. Unless we are required by law to update these statements, we will not necessarily
update any of these statements after the date of this report, either to make them conform to actual results or
changes in our expectations.

2012-10-24 Classification: Internal
©Statoil ASA
Statoil update: Bank of America Global Energy Conference Jason Nye, Senior Vice President, U.S. Offshore

Forward looking statements
2
This report contains certain forward-looking statements that involve risks and uncertainties. In some cases, we use
words such as "ambition", "continue", "could", "estimate", "expect", "focus", "likely", "may", "outlook", "plan",
"strategy", "will", "guidance" and similar expressions to identify forward-looking statements. All statements other
than statements of historical fact, including, among others, statements regarding future financial position, results of
operations and cash flows; changes in the fair value of derivatives; future financial ratios and information; future
financial or operational portfolio or performance; future market position and conditions; business strategy; growth
strategy; future impact of accounting policy judgments; sales, trading and market strategies; research and
development initiatives and strategy; market outlook and future economic projections and assumptions; competitive
position; projected regularity and performance levels; expectations related to our recent transactions and projects,
such as the discovery in Tanzania, the Rosneft cooperation, developments at Johan Sverdrup, the Wintershall
agreement, the Ormen Lange redetermination, the farming down of interests in Mozambique and the sale of
producing assets in the Gulf of Mexico; completion and results of acquisitions, disposals and other contractual
arrangements; reserve information; future margins; projected returns; future levels, timing or development of
capacity, reserves or resources; future decline of mature fields; planned maintenance (and the effects thereof); oil
and gas production forecasts and reporting; domestic and international growth, expectations and development of
production, projects, pipelines or resources; estimates related to production and development levels and dates;
operational expectations, estimates, schedules and costs; exploration and development activities, plans and
expectations; projections and expectations for upstream and downstream activities; oil, gas, alternative fuel and
energy prices; oil, gas, alternative fuel and energy supply and demand; natural gas contract prices; timing of gas
off-take; technological innovation, implementation, position and expectations; projected operational costs or
savings; projected unit of production cost; our ability to create or improve value; future sources of financing;
exploration and project development expenditure; effectiveness of our internal policies and plans; our ability to
manage our risk exposure; our liquidity levels and management; estimated or future liabilities, obligations or
expenses and how such liabilities, obligations and expenses are structured; expected impact of currency and
interest rate fluctuations; expectations related to contractual or financial counterparties; capital expenditure
estimates and expectations; projected outcome, objectives of management for future operations; impact of PSA
effects; projected impact or timing of administrative or governmental rules, standards, decisions, standards or laws
(including taxation laws); estimated costs of removal and abandonment; estimated lease payments, gas transport
commitments and future impact of legal proceedings are forward-looking statements. You should not place undue
reliance on these forward-looking statements. Our actual results could differ materially from those anticipated in the
forward-looking statements for many reasons.
These forward-looking statements reflect current views about future events and are, by their nature, subject to
significant risks and uncertainties because they relate to events and depend on circumstances that will occur in the
future. There are a number of factors that could cause actual results and developments to differ materially from
those expressed or implied by these forward-looking statements, including levels of industry product supply,
demand and pricing; price and availability of alternative fuels; currency exchange rate and interest rate
fluctuations; the political and economic policies of Norway and other oil-producing countries; EU directives; general
economic conditions; political and social stability and economic growth in relevant areas of the world; the sovereign
debt situation in Europe; global political events and actions, including war, terrorism and sanctions; security
breaches; situation in Ukraine; changes or uncertainty in or non-compliance with laws and governmental
regulations; the timing of bringing new fields on stream; an inability to exploit growth or investment opportunities;
material differences from reserves estimates; unsuccessful drilling; an inability to find and develop reserves;
ineffectiveness of crisis management systems; adverse changes in tax regimes; the development and use of new
technology; geological or technical difficulties; operational problems; operator error; inadequate insurance
coverage; the lack of necessary transportation infrastructure when a field is in a remote location and other
transportation problems; the actions of competitors; the actions of field partners; the actions of governments
(including the Norwegian state as majority shareholder); counterparty defaults; natural disasters and adverse
weather conditions, climate change, and other changes to business conditions; an inability to attract and retain
personnel; relevant governmental approvals (including in relation to the agreement with Wintershall); industrial
actions by workers and other factors discussed elsewhere in this report. Additional information, including
information on factors that may affect Statoil's business, is contained in Statoil's Annual Report on Form 20-F for
the year ended December 31, 2013, filed with the U.S. Securities and Exchange Commission, which can be found
on Statoil's website at www.statoil.com.
Although we believe that the expectations reflected in the forward-looking statements are reasonable, we cannot
assure you that our future results, level of activity, performance or achievements will meet these expectations.
Moreover, neither we nor any other person assumes responsibility for the accuracy and completeness of the
forward-looking statements. Unless we are required by law to update these statements, we will not necessarily
update any of these statements after the date of this report, either to make them conform to actual results or
changes in our expectations.

Our growing international presence
Norway
North America
International
Production by
region (estimate)
3
3

Statoil’s portfolio
3. US onshore
4. Canadian oil sands
6. Midstream value adding positions
5. New exploration opportunities
Leismer and Corner
St. Johns
Marcellus
Eagle Ford Gulf of Mexico
Stamford
Washington D.C.
Anchorage
Houston
Mexico City
South Riding Point Terminal Grand Bahamas
Calgary
Bakken Williston
Chukchi Sea
Austin
Offshore Newfoundland 2. Deepwater Gulf of Mexico
Statoil office
Statoil asset
NORTH AMERICA
Competitively positioned in key petroleum plays
1. East Coast Canada
4
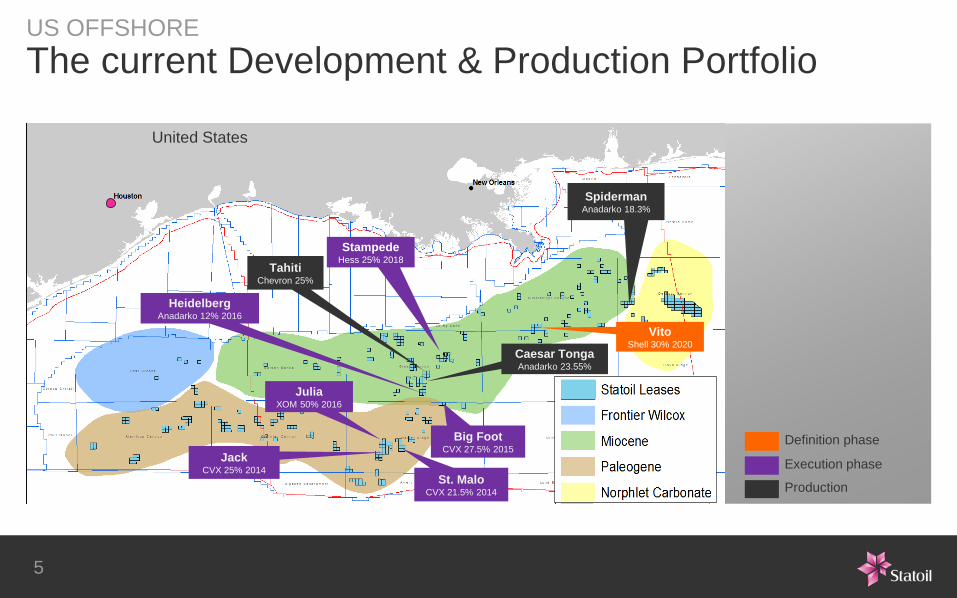
US OFFSHORE
The current Development & Production Portfolio
United States
Production
Execution phase
Definition phase
St. Malo CVX 21.5% 2014
Jack CVX 25% 2014
Julia XOM 50% 2016
Big Foot CVX 27.5% 2015
Spiderman Anadarko 18.3%
Tahiti Chevron 25%
Heidelberg Anadarko 12% 2016
Stampede Hess 25% 2018
Vito Shell 30% 2020
Caesar Tonga Anadarko 23.55%
5
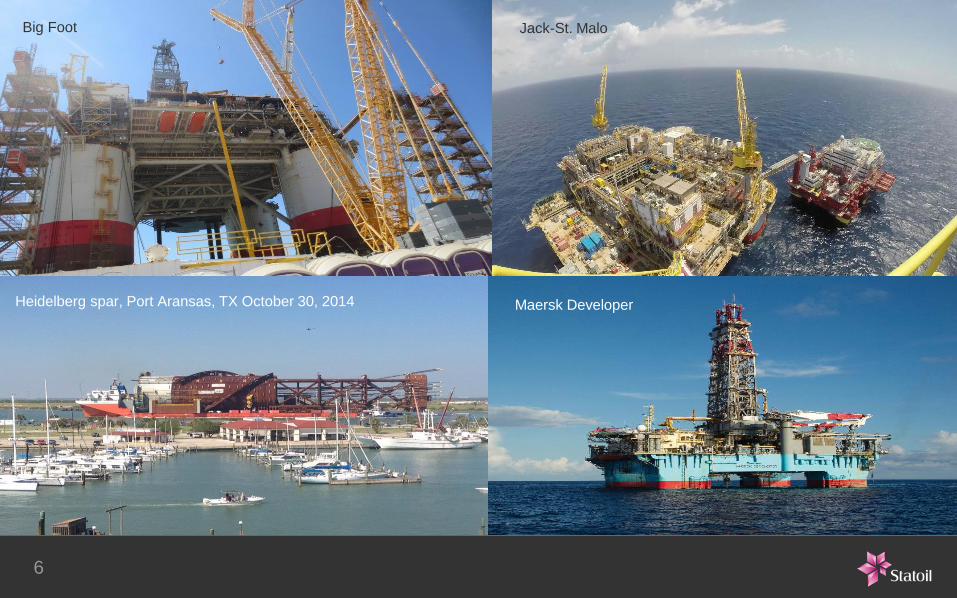
Big Foot Heidelberg
Maersk Developer Jack – St. Malo
6
Jack-St. Malo
Heidelberg spar, Port Aransas, TX October 30, 2014
Big Foot
6

Important technology for deepwater GOM
Drilling safer, faster wells
Water and gas injection
Reduced cost per well
drainage point
Electronic submersible pumps (ESPs)
Reduced
drilling
costs
Higher oil
recovery
7
ESP image
7
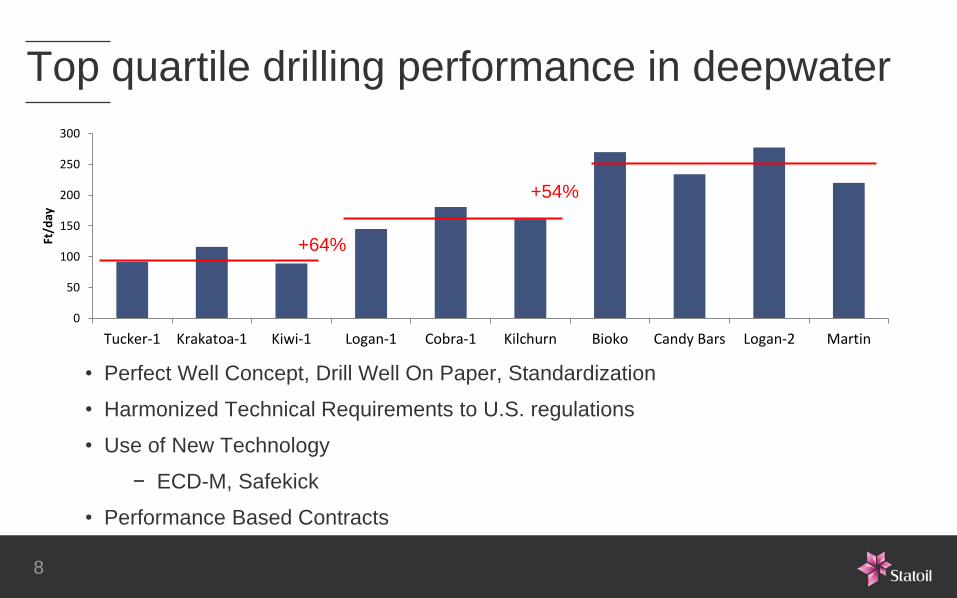
Top quartile drilling performance in deepwater
• Perfect Well Concept, Drill Well On Paper, Standardization
• Harmonized Technical Requirements to U.S. regulations
• Use of New Technology
− ECD-M, Safekick
• Performance Based Contracts
0
50
100
150
200
250
300
Tucker-1 Krakatoa-1 Kiwi-1 Logan-1 Cobra-1 Kilchurn Bioko Candy Bars Logan-2 Martin
Ft/d
ay
+64%
+54%
8
8
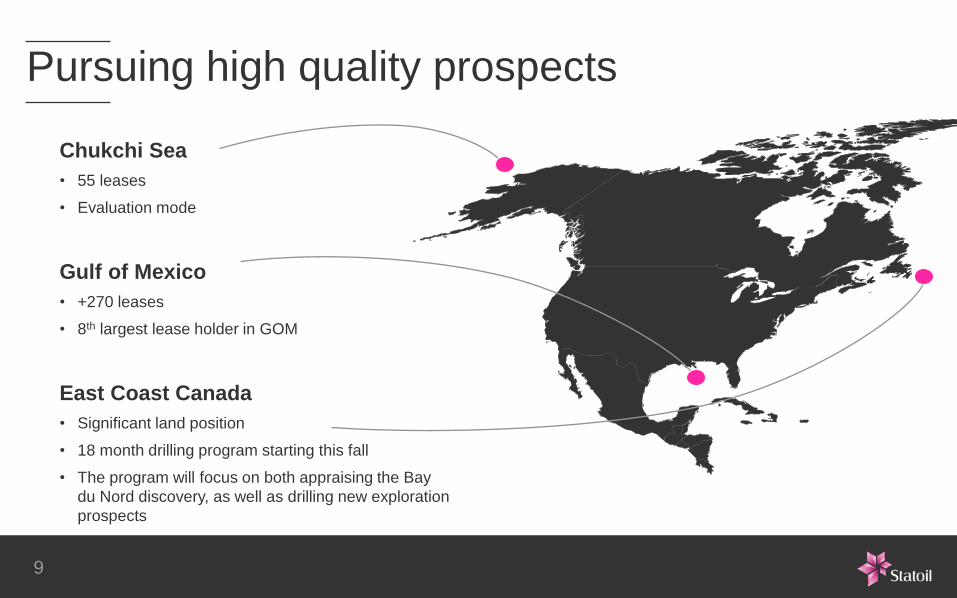
Pursuing high quality prospects
Chukchi Sea
• 55 leases
• Evaluation mode
Gulf of Mexico
• +270 leases
• 8th largest lease holder in GOM
East Coast Canada
• Significant land position
• 18 month drilling program starting this fall
• The program will focus on both appraising the Bay
du Nord discovery, as well as drilling new exploration
prospects
9
9

• Broad-based portfolio
• Testing a range of plays
• Hunting for elephants --
deepwater impact discoveries
• 8th largest lease holder in
GoM
• Leveraging experience
through play-based approach
Gulf of Mexico – drilling top tier opportunities
10
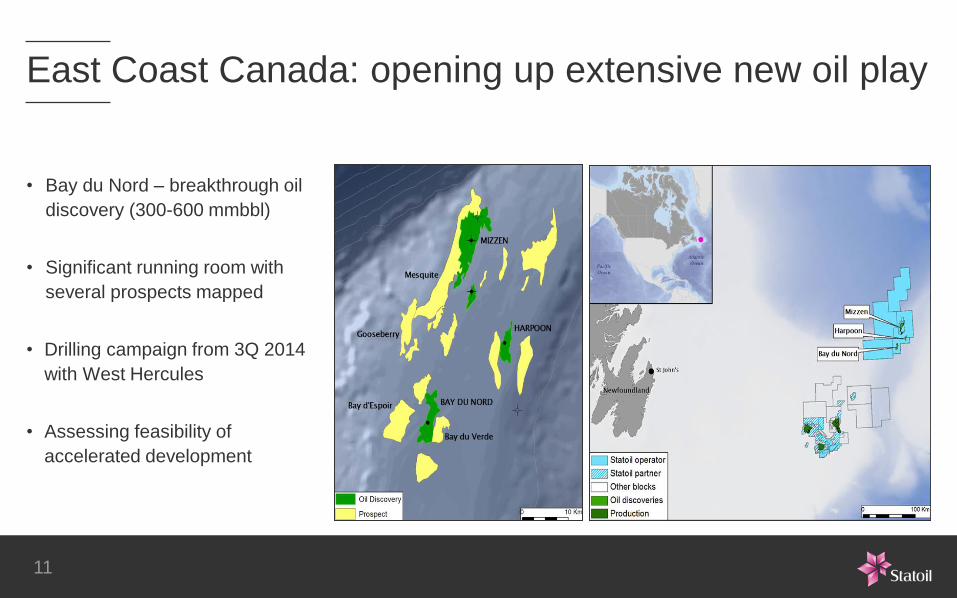
East Coast Canada: opening up extensive new oil play
• Bay du Nord – breakthrough oil
discovery (300-600 mmbbl)
• Significant running room with
several prospects mapped
• Drilling campaign from 3Q 2014
with West Hercules
• Assessing feasibility of
accelerated development
11
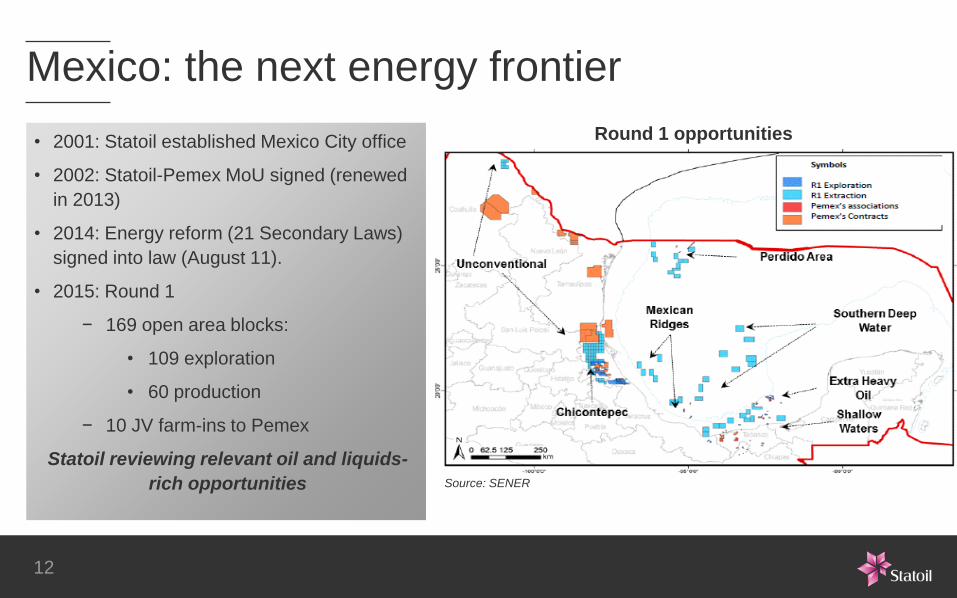
Round 1 opportunities
12
Source: SENER
Mexico: the next energy frontier
• 2001: Statoil established Mexico City office
• 2002: Statoil-Pemex MoU signed (renewed
in 2013)
• 2014: Energy reform (21 Secondary Laws)
signed into law (August 11).
• 2015: Round 1
− 169 open area blocks:
• 109 exploration
• 60 production
− 10 JV farm-ins to Pemex
Statoil reviewing relevant oil and liquids-
rich opportunities
• Large presence across North America
• Attractive offshore portfolio – high value barrels growth
• Applying technology to save costs, improve efficiency
• Substantial exploration potential
• Mexico – the next energy frontier
Summary

Q A