Statoil Business Update - Jefferies Group › CMSFiles › Jefferies.com › files ›...
26
2012-10-24 Classification: Internal Statoil Business Update November 2016
Transcript of Statoil Business Update - Jefferies Group › CMSFiles › Jefferies.com › files ›...
2012-10-24Classification: Internal
Statoil Business UpdateNovember 2016

Forward-looking statements
These forward-looking statements reflect current views about future events and are, by their nature, subject
to significant risks and uncertainties because they relate to events and depend on circumstances that will
occur in the future. There are a number of factors that could cause actual results and developments to differ
materially from those expressed or implied by these forward-looking statements, including levels of industry
product supply, demand and pricing; price and availability of alternative fuels; currency exchange rate and
interest rate fluctuations; the political and economic policies of Norway and other oil-producing countries;
EU developments; general economic conditions; political and social stability and economic growth in
relevant areas of the world; global political events and actions, including war, political hostilities and
terrorism; economic sanctions, security breaches; changes or uncertainty in or non-compliance with laws
and governmental regulations; the timing of bringing new fields on stream; an inability to exploit growth or
investment opportunities; material differences from reserves estimates; unsuccessful drilling; an inability to
find and develop reserves; ineffectiveness of crisis management systems; adverse changes in tax regimes;
the development and use of new technology; geological or technical difficulties; operational problems;
operator error; inadequate insurance coverage; the lack of necessary transportation infrastructure when a
field is in a remote location and other transportation problems; the actions of competitors; the actions of
field partners; the actions of governments (including the Norwegian state as majority shareholder);
counterparty defaults; natural disasters and adverse weather conditions, climate change, and other
changes to business conditions; an inability to attract and retain personnel; relevant governmental
approvals; industrial actions by workers and other factors discussed elsewhere in this report. Additional
information, including information on factors that may affect Statoil's business, is contained in Statoil's
Annual Report on Form 20-F for the year ended December 31, 2015, filed with the U.S. Securities and
Exchange Commission, which can be found on Statoil's website at www.statoil.com.
Although we believe that the expectations reflected in the forward-looking statements are reasonable, we
cannot assure you that our future results, level of activity, performance or achievements will meet these
expectations. Moreover, neither we nor any other person assumes responsibility for the accuracy and
completeness of the forward-looking statements. Unless we are required by law to update these
statements, we will not necessarily update any of these statements after the date of this report, either to
make them conform to actual results or changes in our expectations.
2
This report contains certain forward-looking statements that involve risks and uncertainties. In some cases,
we use words such as "ambition", "continue", "could", "estimate", "expect", "focus", "likely", "may", "outlook",
"plan", "strategy", "will", "guidance" and similar expressions to identify forward-looking statements. All
statements other than statements of historical fact, including, among others, statements regarding plans and
expectations with respect to market outlook and future economic projections and assumptions; Statoil’s
focus on capital discipline; expected annual organic production through 2017; projections and future impact
related to efficiency programmes; capital expenditure and exploration guidance for 2016; production
guidance; Statoil’s value over volume strategy; Statoil’s plans with regard to its acquisition of 66% operated
interest in the BM-S-8 offshore license in the Santos basin; Statoil’s expected report on helicopter safety on
the Norwegian continental shelf; organic capital expenditure for 2016; Statoil’s intention to mature its
portfolio; exploration and development activities, plans and expectations, including estimates regarding
exploration activity levels; projected unit of production cost; equity production; planned maintenance and the
effects thereof; impact of PSA effects; risks related to Statoil’s production guidance; accounting decisions
and policy judgments and the impact thereof; expected dividend payments, the scrip dividend programme
and the timing thereof; estimated provisions and liabilities; the projected impact or timing of administrative or
governmental rules, standards, decisions, standards or laws, including with respect to the deviation notice
issued by the Norwegian tax authorities and future impact of legal proceedings are forward-looking
statements. You should not place undue reliance on these forward- looking statements. Our actual results
could differ materially from those anticipated in the forward-looking statements for many reasons.

Firm strategy to capture value in the upturn
3
Efficiency
improvements and
market effects
Strict financial discipline
Faster and deeper cost
reductionsPreparing to invest in next-
generation portfolio
Radically improved
break-evens
Maintaining dividend,
introducing scrip option
Sustained efficiency
gains
Significant new volumes
2018-2022
Capturing the upturn in oil
and gas prices
Johan Castberg Johan Sverdrup
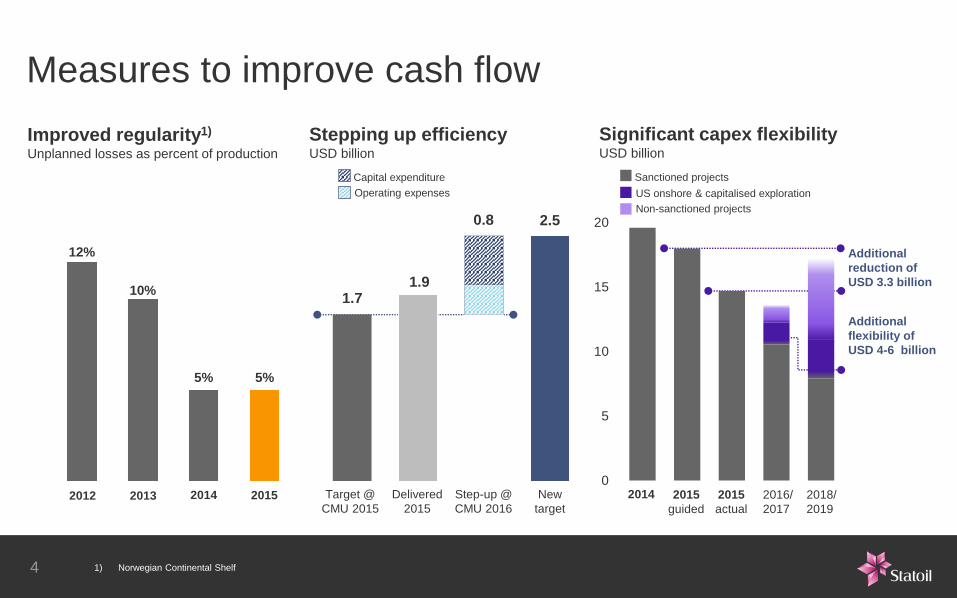
Additional
reduction of
USD 3.3 billion
Measures to improve cash flow
Stepping up efficiencyUSD billion
1.7
0.8 2.5
1.9
Capital expenditure
Operating expenses
Improved regularity1)
Unplanned losses as percent of production
12%
10%
5% 5%
2012 20142013 2015
4
0
5
10
15
20
2016/
2017
2018/
2019
2015
guided
2015
actual
Sanctioned projects
Non-sanctioned projects
US onshore & capitalised exploration
Additional
flexibility of
USD 4-6 billion
Significant capex flexibilityUSD billion
2014Target @
CMU 2015
Delivered
2015
Step-up @
CMU 2016
New
target
1) Norwegian Continental Shelf

Capturing value from next-generation portfolio
2013 2016
Production potential to 2022Production from non-sanctioned1) projects2), mboe/d
29%below
$50/boe
82%below
$50/boe
Break-even
per barrel
Capex
Optimised portfolioOperated non-sanctioned projects starting up by 2022, weighted by volume
5
70USD
41USD
0
50
100
150
200
250
300
2017/18 2019/20 2021/22
1) Non-sanctioned projects exclude exploration
2) Includes partner-operated projects
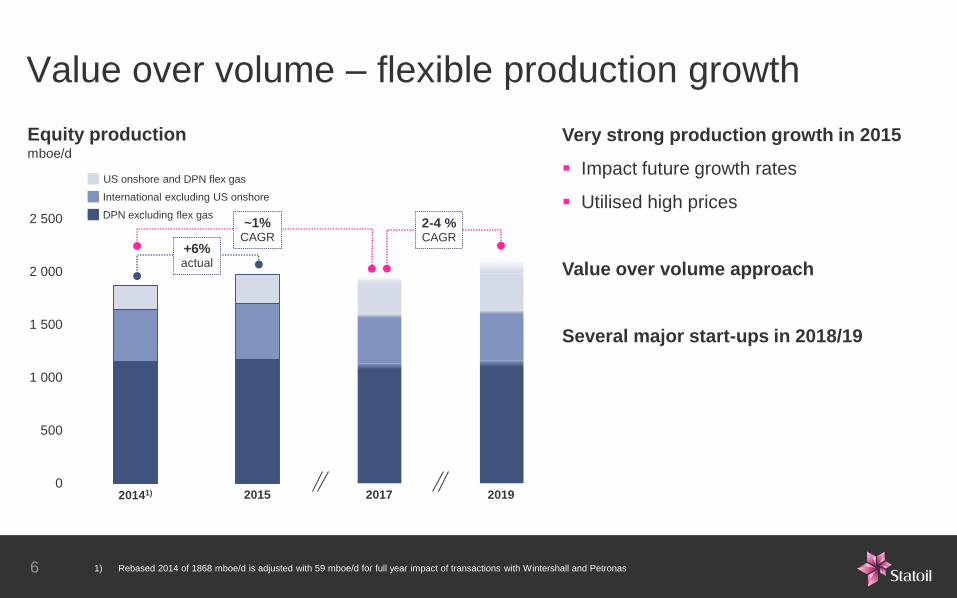
Value over volume – flexible production growth
Very strong production growth in 2015
Impact future growth rates
Utilised high prices
Value over volume approach
Several major start-ups in 2018/19
Equity productionmboe/d
0
500
1 000
1 500
2 000
2 500
20141) 2015 2017 2019
DPN excluding flex gas
International excluding US onshore
US onshore and DPN flex gas
+6% actual
~1% CAGR
2-4 % CAGR
6 1) Rebased 2014 of 1868 mboe/d is adjusted with 59 mboe/d for full year impact of transactions with Wintershall and Petronas
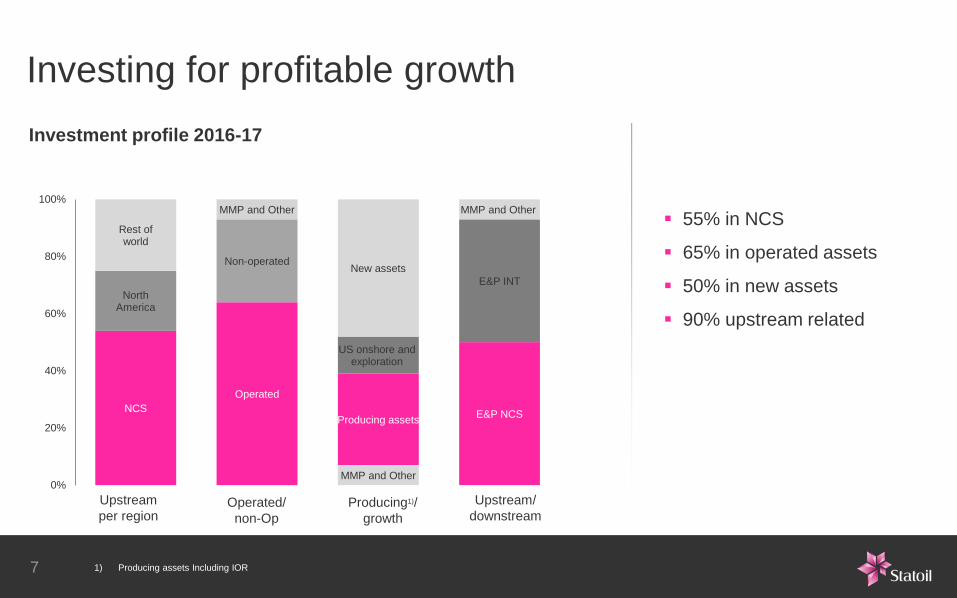
Investing for profitable growth
55% in NCS
65% in operated assets
50% in new assets
90% upstream related
Investment profile 2016-17
NCS
NorthAmerica
Rest of world
Operated
Non-operated
MMP and Other
MMP and Other
Producing assets
US onshore and exploration
New assets
E&P NCS
E&P INT
MMP and Other
0%
20%
40%
60%
80%
100%
Upstream
per regionProducing1)/
growth
Upstream/
downstream
7
Operated/
non-Op
1) Producing assets Including IOR

Phase 1 break-even price
Current below
25USD/bbl
Phase 1 production capacity
Increased to
440 000Boepd
Phase 1 capex reductions1)
123.2
108.5
99
50
60
70
80
90
100
110
120
130
PDO Simplification Strategy andmarket
CMU Drilling andWell
Executionquality
Currentforecast
NO
K b
illi
on
20%
8
Johan Sverdrup
1) Capex numbers in NOK nominal terms based on project currency
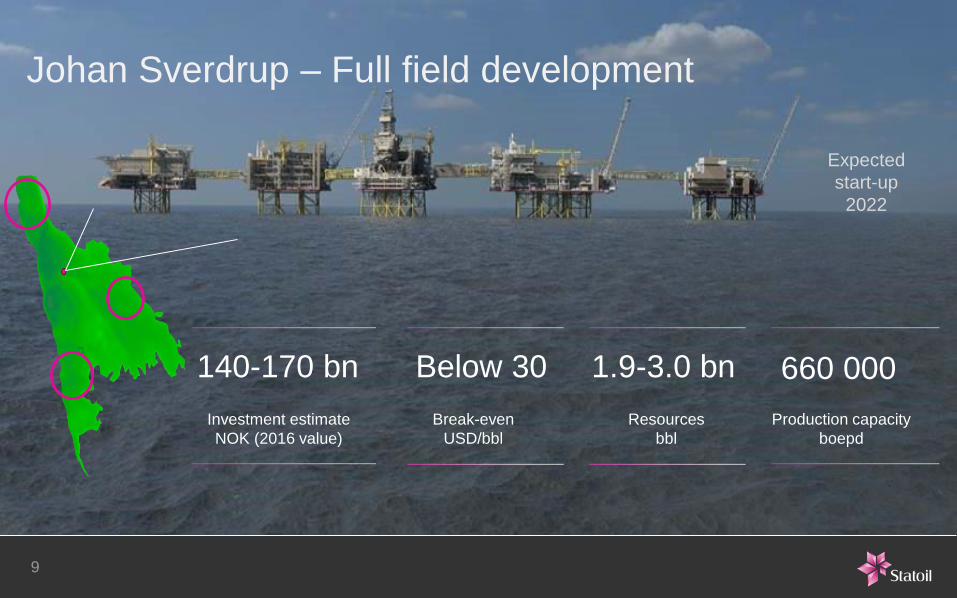
Johan Sverdrup – Full field development
Production capacity
boepd
140-170 bn
Investment estimate
NOK (2016 value)
Below 30
Break-even
USD/bbl
1.9-3.0 bn
Resources
bbl
660 000
Expected
start-up
2022
9

Johan Castberg
100
50-60
0
20
40
60
80
100
120
2013 Conceptchange
Drillingand well
Subsea Floater Market CurrentFC
NO
K b
illio
n
40-50%
Capex reductions 1)
Changes in break-even price
2013
above
80USD/bbl
Current
below
45USD/bbl
10 1) Capex numbers in real term NOK 2016

World class drilling performance
Meter per day Days per well Spend per well1)
70% 40% 30%
Continued improvements production drilling
"More for less"
2015: 95 wells planned | 117 wells delivered
2016: 113 wells planned | 120-125 wells forcasted
Rushmore benchmark: Meter per day 2006-2015 (2Q)
0
20
40
60
80
100
120
140
160
2006 2007 2008 2009 2010 2011 2012 2013 2014 2015
Brazil Canada Offshore DenmarkNetherlands Norway UKUS GoM Deep Grand total Statoil
1) Nominal currency adjusted 11
0
5
10
15
20
25
0%
10%
20%
30%
40%
2015 2016/17 2018/19
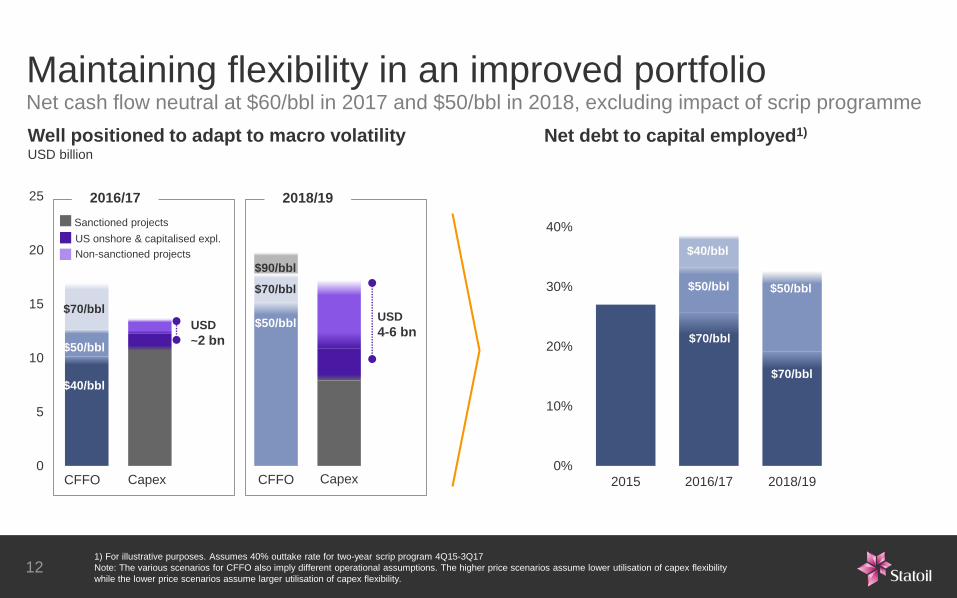
Maintaining flexibility in an improved portfolio
Well positioned to adapt to macro volatilityUSD billion
$70/bbl
$50/bbl
$40/bbl
$50/bbl
$70/bbl
CFFO CFFOCapex Capex
2016/17 2018/19
USD
~2 bn
USD
4-6 bn
Net cash flow neutral at $60/bbl in 2017 and $50/bbl in 2018, excluding impact of scrip programme
Sanctioned projects
Non-sanctioned projects
US onshore & capitalised expl.
Net debt to capital employed1)
$70/bbl
$50/bbl
$40/bbl
$50/bbl
$70/bbl
$90/bbl
121) For illustrative purposes. Assumes 40% outtake rate for two-year scrip program 4Q15-3Q17
Note: The various scenarios for CFFO also imply different operational assumptions. The higher price scenarios assume lower utilisation of capex flexibility
while the lower price scenarios assume larger utilisation of capex flexibility.

13
DPUSA: a diverse and high-potential portfolio
US Offshore
Producing ~40 mboe/d 1)
Several project start-ups
High-value barrels
2005
Statoil & Norsk Hydro merger
Marcellus
Eagle Ford
Bakken operatorship
Marcellus operatorship
2015 Eagle Ford full operatorship
Eagle Ford partial
operatorship
Encana GoM portfolio
US Onshore
Producing ~210 mboe/d 1)
Premium portfolio in core plays
Proven operator
1) Average daily equity production in 2015

14
DPUSA three-year plan: Transform the US business
Grow with qualityMake money Improve
Profitable investments
>50% production growth potential
Double EBITDA/boe
Reduce price needed to achieve
NOI=0
From $90/bbl to $50/bbl1)
Step up improvements
Reduce costs
One onshore organisation
~ $5
2014 2018
>100%
240
2014 2018
>50%
Production potential
mboe/d
EBITDA $/boe
@ $50 WTI
- 25%
- 25%
- 20%
Onshore capex
$/boe
Onshore opex
$/boe
SG&A costs
$/boe
2015
baseline
90
50
2014 2015 2016 2017 2018
$/b
bl(W
TI)
100
80
60
40
1) Adjusted NOI; figures exclude exploration and downstream.
Assumes product and gas prices correlate to changes in the WTI price.
Realised price in the US portfolio is significantly lower than WTI due to the mix of gas / oil / products and local market conditions

European gas price drivers – more than oil
Forward prices*
The price fall for gas is less severe than for oil
European gas market drivers
Demand
Temperature
Competing fuels and CO2
Politics
Supply
Long-term contracts
LNG supply
Domestic production
0
5
10
15
20
25
2010 2011 2012 2013 2014 2015 2016 2017 2018
Japan - Korea Spot LNG NBP spot (UK)
Henry Hub (US) Brent
FW market1)
Brent and global gas prices USD/MMBtu
Sources: Platts, ICE, NYMEX, Statoil ASA
1) Forward prices as of 3 Jun 2016, NYMEX Henry Hub Forward 3 Jun 2016 (USD5/MMBtu = 157 Øre/Scm) Conversion 40MJ/Sm3 (GCV)15
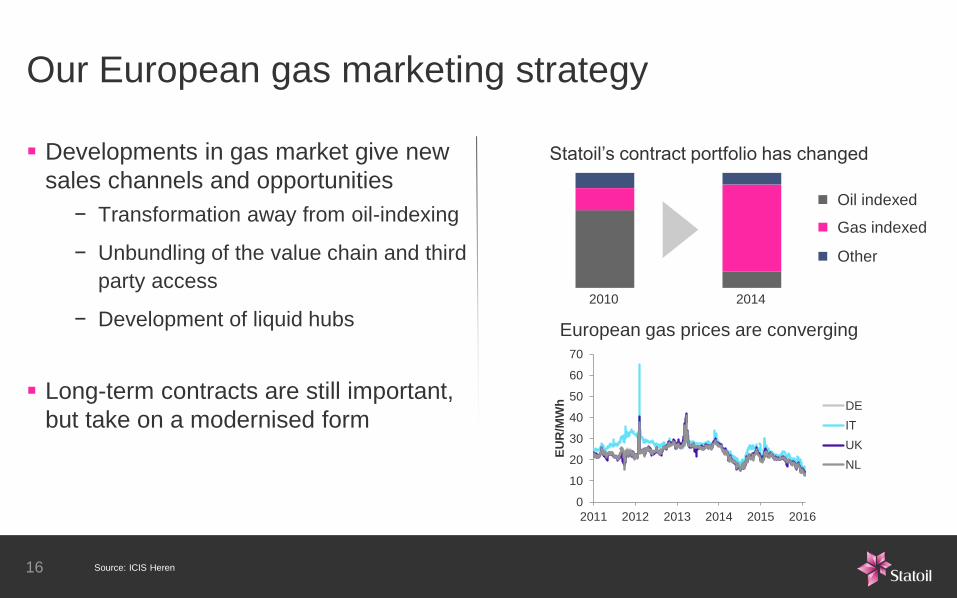
Our European gas marketing strategy
Developments in gas market give new
sales channels and opportunities
− Transformation away from oil-indexing
− Unbundling of the value chain and third
party access
− Development of liquid hubs
Long-term contracts are still important,
but take on a modernised form
European gas prices are converging
Statoil’s contract portfolio has changed
2010 2014
Oil indexed
Gas indexed
Other
0
10
20
30
40
50
60
70
2011 2012 2013 2014 2015 2016
EU
R/M
Wh DE
IT
UK
NL
16 Source: ICIS Heren

JKM Shipping HH Shipping/Regas NBP
Asia USD/MMBtu
Europe USD/MMBtu
North America USD/MMBtu
3.0*
0.5
5.0 - 5.7 4.3 - 4.7
Currently in “the money” in Europe
0.8 - 1.21.5 – 2.2
Short-run marginal cost ranges for US 2017 LNG supply to Asia and Europe
5.4**
US LNG will flow according to price signals
* NYMEX Henry Hub Forward curve for Calendar 2017 22 Aug 2016
** ICE NBP Forward curve for Calendar 2017 22 Aug 2016
Source: NYMEX, ICE, Platts, Pira, Statoil ASA17

Brazil’s Santos basin
Accessing an excellent resource base
One of the most prolific
petroleum systems in the world
53 billion bbl already discovered*
Estimated 36 billion bbl YTF*
Excellent reservoir properties
Very high producibility
* Source: IHS18

The BM-S-8 licence
Accessing an excellent resource base
Carcará discovery:
More than 300m
hydrocarbon column
High net/gross reservoir
High porosity and permeability
High resource density
1 remaining drill stem test
Contract signature
3D seismic acquisition
Carcará-1 high impact oil discovery
Two Carcará appraisal wells and
one DST
Statoil farm-in/operatorship
Declaration of commerciality
2000 2002 2012 2015 2016 2018
19
BM-S-8 licence:
Considerable exploration upside
Remaining commitments: 1 well
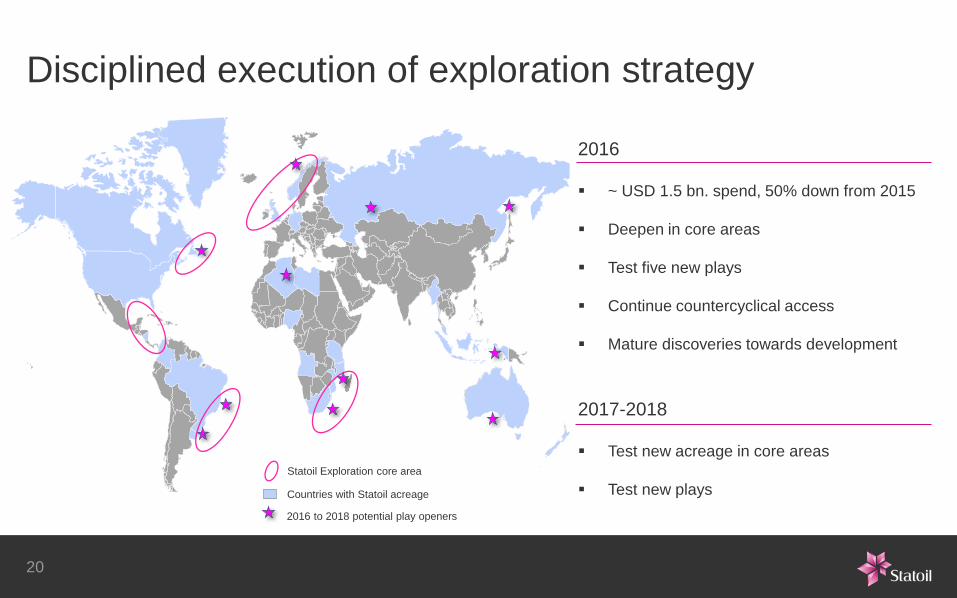
Statoil Exploration core area
Countries with Statoil acreage
2016 to 2018 potential play openers
2016
~ USD 1.5 bn. spend, 50% down from 2015
Deepen in core areas
Test five new plays
Continue countercyclical access
Mature discoveries towards development
2017-2018
Test new acreage in core areas
Test new plays
Disciplined execution of exploration strategy
20

Outlook 2016
Capex USD ~11 bn1)
Production ~1% organic CAGR (2014-17)
Maintenance60 mboe per day
40 mboe per day in 4Q
Exploration USD ~1.5 bn1)
Dividend 3Q16USD 0.2201 per share, with 5%
discounted scrip dividend option
21 1) Assuming NOK/USD of 8.50

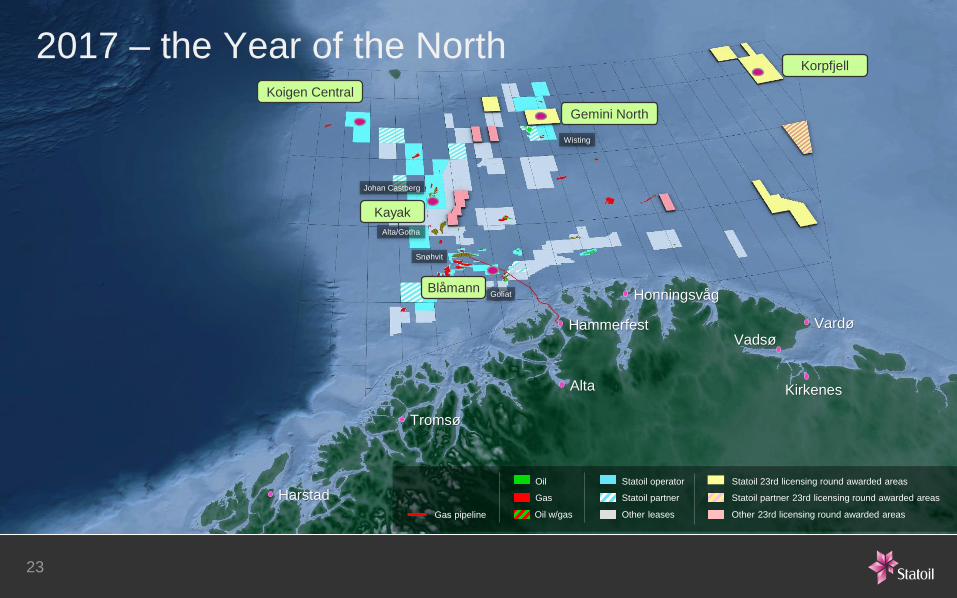
Johan Castberg
Alta/Gotha
Snøhvit
Goliat
Wisting
Honningsvåg
Alta
Tromsø
Vardø
Kirkenes
VadsøHammerfest
Harstad
Gas pipeline
Statoil operator
Other leases
Statoil partner
Oil
Gas
Oil w/gas Other 23rd licensing round awarded areas
Statoil partner 23rd licensing round awarded areas
Statoil 23rd licensing round awarded areas
Kayak
Korpfjell
Gemini North
Koigen Central
Blåmann
2017 – the Year of the North
23

Opportunities in European gas markets
Europe has a large and growing supply gap
Norwegian gas is well placed as a cost-efficient supply source for the long term
Due to its cleanness and versatility, gas will remain a key part of European energy supply
Outlook for Norwegian gas productionOutlook for EU demand and indigenous supply
0
100
200
300
400
500
600
2012 2020 2025 2030
Norway
Indigenous
EC reference
EC 2030 policies
IEA WEO 2015
Import needs
24 Sources: IEA, European Commission, Norwegian Petroleum Directorate
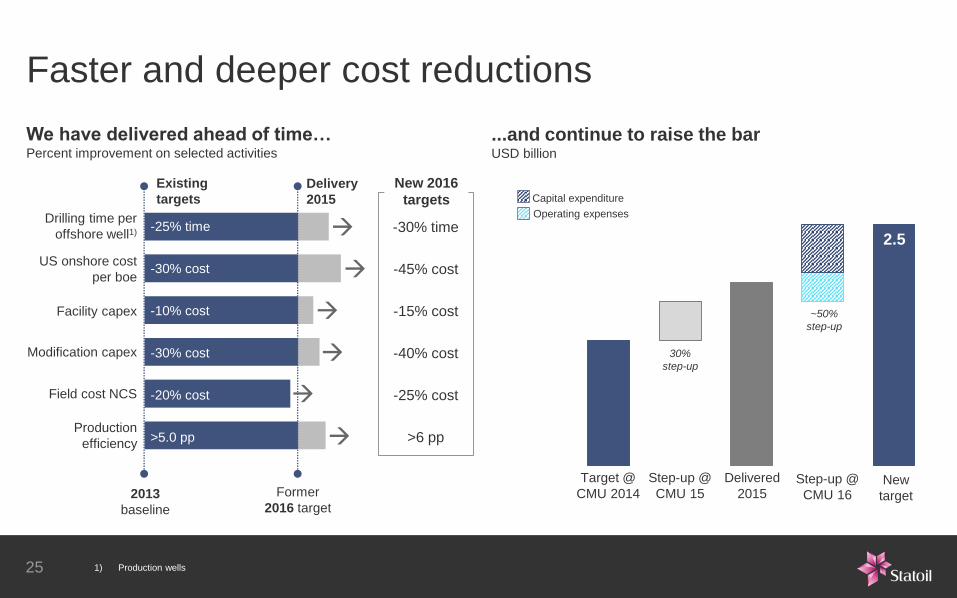
Faster and deeper cost reductions
...and continue to raise the barUSD billion
We have delivered ahead of time…Percent improvement on selected activities
-25% time
-30% cost
-10% cost
-30% cost
-20% cost
>5.0 pp
Drilling time per
offshore well1)
US onshore cost
per boe
Facility capex
Modification capex
Field cost NCS
Production
efficiency
Existing
targets
Delivery
2015
2013
baseline
Former
2016 target
-30% time
-45% cost
-15% cost
-40% cost
-25% cost
>6 pp
New 2016
targets
2.51.9
Capital expenditure
Operating expenses
1.3
Target @
CMU 2014
Step-up @
CMU 15
Delivered
2015New
target
~50%
step-up
Step-up @
CMU 16
30%
step-up
25 1) Production wells

Capitalising on market opportunities
Examples of achieved
rate reductions in contracts 1)
Expected reduction in capex and opex
due to market effects 2) (USD billion)
0% 10% 20% 30%
Equipment
Subsea
Marine installation
Engineering
Steel/Raw materials
Operations & maintenance
Drilling & well services
0.0
0.5
1.0
2015 2016 2017
26 1) Reduction measured in USD (includes currency effects)
2) Excludes currency impact. Statoil share, Statoil operated spend only.