Statkey handout 03 Fall 2017 How to Get Data into …people.umass.edu/biep540w/pdf/Statkey handout...
12
BIOSTATS 540 - Fall 2017 StatKey Handout 03 How to Get Data into StatKey StatKey handout 03 Fall 2017 How to Get Data into StatKey.docx Page 1 of 12 Introduction to StatKey 2017 - 18 03. How to Get Data Into StatKey Introduction This handout assumes that you do not want to type in the data “by hand.” This handout shows you how to use Excel and “cut and paste” to get your data into StatKey. . 1. One Variable ………………………………..………………..…….. 2. One Categorical and One Quantitative Variable ..………...…….… 3. Two Quantitative Variables ………………………………………….. 2 5 9
Transcript of Statkey handout 03 Fall 2017 How to Get Data into …people.umass.edu/biep540w/pdf/Statkey handout...

BIOSTATS 540 - Fall 2017 StatKey Handout 03 How to Get Data into StatKey
StatKey handout 03 Fall 2017 How to Get Data into StatKey.docx Page 1 of 12
Introduction to StatKey 2017 - 18
03.
How to Get Data Into StatKey
Introduction This handout assumes that you do not want to type in the data “by hand.” This handout shows you how to use Excel and “cut and paste” to get your data into StatKey. .
1. One Variable ………………………………..………………..…….. 2. One Categorical and One Quantitative Variable ..………...…….… 3. Two Quantitative Variables …………………………………………..
2
5
9

BIOSTATS 540 - Fall 2017 StatKey Handout 03 How to Get Data into StatKey
StatKey handout 03 Fall 2017 How to Get Data into StatKey.docx Page 2 of 12
1. One Variable
Before You Begin – Note the layout that StatKey requires: __#1. The first row contains the variable name __#2. Each data value is in its own row __#3. At the bottom, “Data has header row” is be checked

BIOSTATS 540 - Fall 2017 StatKey Handout 03 How to Get Data into StatKey
StatKey handout 03 Fall 2017 How to Get Data into StatKey.docx Page 3 of 12
Illustration
One Variable (age) 44 16 37 Step 1 Launch Excel. Into Column A Row 1, enter the name of your variable (age). Next, beginning with Row 2, enter the values of your variable. Still in Excel, use FORMAT > CELLS to format the data in column A as text (for categorical variable) or as number, (for quantitative variable) as appropriate. When you are finished, your column A should look like the following:
Step 2 Still in Excel, select the data rows in Column A. From the menu bar, click EDIT > COPY (cntrl-C) Step 3 Launch StatKey. > From the main menu, under “Descriptive Statistics and Graphs”, choose One Quantitative or One Categorical > Click on the tab at top, Edit Data

BIOSTATS 540 - Fall 2017 StatKey Handout 03 How to Get Data into StatKey
StatKey handout 03 Fall 2017 How to Get Data into StatKey.docx Page 4 of 12
> Delete the data that StatKey has supplied (so that you can insert yours here!)
> Paste your Excel Data (cntrl-V) and edit the data header. Check that: __i) “First column in identifier” is NOT checked __ii) “Data has header row” is checked.
> Click OK

BIOSTATS 540 - Fall 2017 StatKey Handout 03 How to Get Data into StatKey
StatKey handout 03 Fall 2017 How to Get Data into StatKey.docx Page 5 of 12
2. One Categorical and One Quantitative Variable
Before You Begin – Note the layout that StatKey requires: __#1. The first row contains the variable names, separated by a comma, in order: categorical, quantitative __#2. Each data value is in its own row __#3. At the bottom, “Data has header row” is checked
BIOSTATS 540 - Fall 2017 StatKey Handout 03 How to Get Data into StatKey
StatKey handout 03 Fall 2017 How to Get Data into StatKey.docx Page 6 of 12
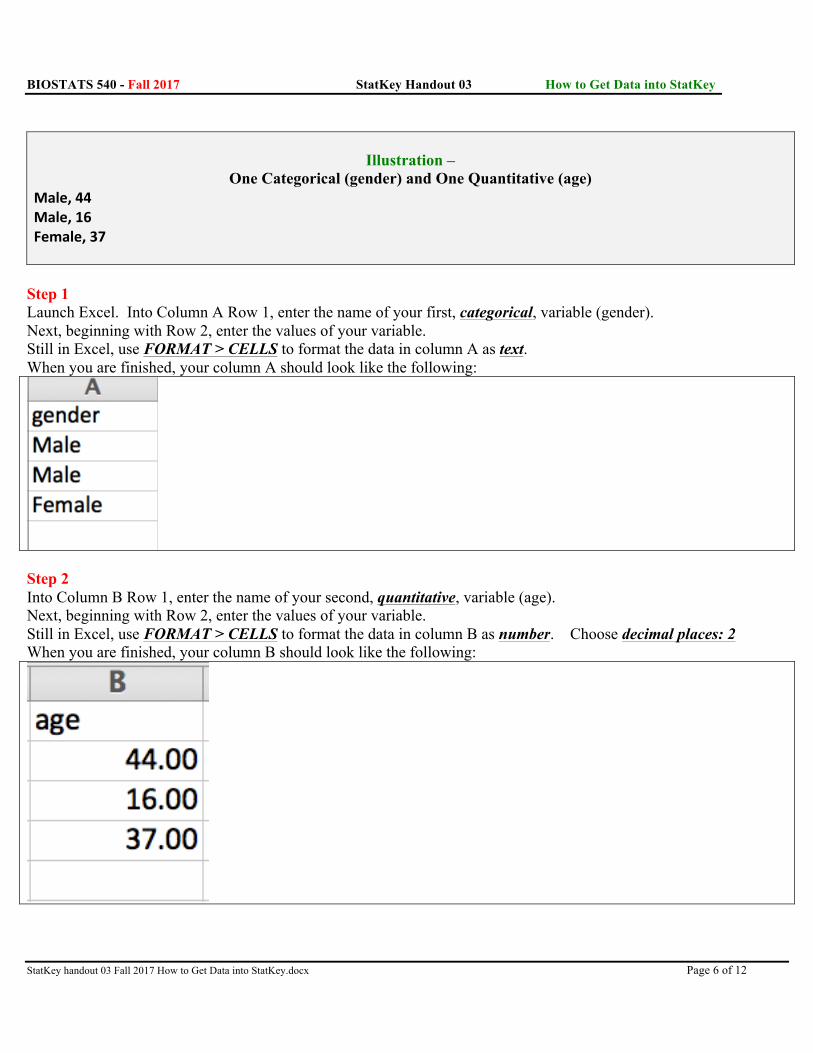
Illustration –
One Categorical (gender) and One Quantitative (age) Male, 44 Male, 16 Female, 37 Step 1 Launch Excel. Into Column A Row 1, enter the name of your first, categorical, variable (gender). Next, beginning with Row 2, enter the values of your variable. Still in Excel, use FORMAT > CELLS to format the data in column A as text. When you are finished, your column A should look like the following:
Step 2 Into Column B Row 1, enter the name of your second, quantitative, variable (age). Next, beginning with Row 2, enter the values of your variable. Still in Excel, use FORMAT > CELLS to format the data in column B as number. Choose decimal places: 2 When you are finished, your column B should look like the following:

BIOSTATS 540 - Fall 2017 StatKey Handout 03 How to Get Data into StatKey
StatKey handout 03 Fall 2017 How to Get Data into StatKey.docx Page 7 of 12
Step 3 Concatenate. Now position your cursor in COLUMN C, row 2. Into the formula box, type = concatenate(A2,”,”,B2) You should now see in Column C, row 1:
Step 4 Using EDIT > COPY > PASTE, repeat for the remaining rows of data. You should now see in Column C:
Step 5 Copy. Still in Excel, select the data rows in Column C ONLY, beginning with ROW 2. From the menu bar, click EDIT > COPY (cntrl-C)

BIOSTATS 540 - Fall 2017 StatKey Handout 03 How to Get Data into StatKey
StatKey handout 03 Fall 2017 How to Get Data into StatKey.docx Page 8 of 12
Step 6 Launch StatKey. > From the main menu, under “Descriptive Statistics and Graphs”, choose One Quantitative and One Categorical > Click on the tab at top, Edit Data
> Delete the data that StatKey has supplied. TIP – This time around KEEP the data header (which you will edit later)
> Paste your Excel Data (cntrl-V) and edit the data header. Check that the “Data has header row” is checked.
Ø Click OK

BIOSTATS 540 - Fall 2017 StatKey Handout 03 How to Get Data into StatKey
StatKey handout 03 Fall 2017 How to Get Data into StatKey.docx Page 9 of 12
3. Two Quantitative Variables
Before You Begin – Note the layout that StatKey requires: __#1. The first row contains the variable names, separated by a comma, in order: quantitative, quantitative __#2. Each data value is in its own row __#3. At the bottom, “Data has header row” is checked

BIOSTATS 540 - Fall 2017 StatKey Handout 03 How to Get Data into StatKey
StatKey handout 03 Fall 2017 How to Get Data into StatKey.docx Page 10 of 12
Illustration –
Two Quantitative Variables (age, weight) 44, 120.5 16, 75.6 37, 94.2 Step 1 Launch Excel. Into Column A Row 1, enter the name of your first, quantitative, variable (age). Next, beginning with Row 2, enter the values of your variable. Still in Excel, use FORMAT > CELLS to format the data in column B as number. Choose decimal places: 0 When you are finished, your column A should look like the following:
Step 2 Into Column B Row 1, enter the name of your second, quantitative, variable (weight). Next, beginning with Row 2, enter the values of your variable. Still in Excel, use FORMAT > CELLS to format the data in column B as number. Choose decimal places: 2 When you are finished, your column B should look like the following:

BIOSTATS 540 - Fall 2017 StatKey Handout 03 How to Get Data into StatKey
StatKey handout 03 Fall 2017 How to Get Data into StatKey.docx Page 11 of 12
Step 3 Concatenate. Now position your cursor in COLUMN C, row 2. Into the formula box, type = concatenate(A2,”,”,B2) You should now see in Column C, row 1:
Step 4 Using EDIT > COPY > PASTE, repeat for the remaining rows of data. You should now see in Column C:
Step 5 Copy. Still in Excel, select the data rows in Column C ONLY, beginning with ROW 2. From the menu bar, click EDIT > COPY (cntrl-C)

BIOSTATS 540 - Fall 2017 StatKey Handout 03 How to Get Data into StatKey
StatKey handout 03 Fall 2017 How to Get Data into StatKey.docx Page 12 of 12
Step 6 Launch StatKey. > From the main menu, under “Descriptive Statistics and Graphs”, choose Two Quantitative Variables > Click on the tab at top, Edit Data
> Delete the data that StatKey has supplied. TIP – This time around KEEP the data header (which you will edit later)
> Paste your Excel Data (cntrl-V) and edit the data header. Check that the “Data has header row” is checked.
Ø Click OK