CURRICULUM VITAE BRATTICH ERIKA - unibo.it · CURRICULUM VITAE BRATTICH ERIKA - unibo.it
Upload
earl-holmesCategory
view
215download
1
STATISTICSSTATISTICS
Silvia CagnoneSilvia Cagnone
Department of Statistics Department of Statistics University of BolognaUniversity of Bologna
MIREES MIREES AAcademic year 2008/2009cademic year 2008/2009

ReadingsReadings
Mann P., “Introductory Statistics”, 6Mann P., “Introductory Statistics”, 6thth edition, John Wiley & Sons, edition, John Wiley & Sons, INC., 2007. Chapters 1, 2, 3, 4.4, 4.5, 4.6, 11.3, 11.4.1, 13.1, 13.2.1-INC., 2007. Chapters 1, 2, 3, 4.4, 4.5, 4.6, 11.3, 11.4.1, 13.1, 13.2.1-13.2.3, 13.4, 13.6 13.2.3, 13.4, 13.6
HyperStat Online Textbook (HyperStat Online Textbook (http://davidmlane.com/hyperstat/))
Handouts and exercises download from Handouts and exercises download from http://campus.cib.unibo.it/6033http://campus.cib.unibo.it/6033
Office hoursOffice hoursby e-mail [email protected] e-mail [email protected]
ExamExamProject work and oral examProject work and oral exam

Aim of the courseAim of the course
Basic concepts of the statistical method for the Basic concepts of the statistical method for the analysis and the interpretation of economic and analysis and the interpretation of economic and social data. social data.
a.a.Univariate statistical analysis (one character)Univariate statistical analysis (one character)
b.b.Bivariate statistical analysis (two characters)Bivariate statistical analysis (two characters)
c.c.Brief introduction to the statistical inferenceBrief introduction to the statistical inference
Exercises in laboratory software ExcelExercises in laboratory software Excel

INTRODUCTION TOINTRODUCTION TO
STATISTICSSTATISTICS

What is statistics?What is statistics?
Two meanings:Two meanings:
1.1. Common usage Common usage Numerical factsNumerical facts
(e.g the age of a student, the income of a (e.g the age of a student, the income of a family, family, the starting salary of a typical the starting salary of a typical college graduate, etc.).college graduate, etc.).
2.2. Field or discipline of studyField or discipline of study
Statistics is a group of methods Statistics is a group of methods used to collect, analyze, present, used to collect, analyze, present, and interpret data and to make and interpret data and to make decisionsdecisions.

What is statistics?What is statistics?
Statistics has two aspects:Statistics has two aspects:
1.1. theoretical or mathematical statisticstheoretical or mathematical statistics deals with the deals with the development, derivation and proof of statistical theorems, development, derivation and proof of statistical theorems, formulas, rules and laws;formulas, rules and laws;
2.2. applied statisticsapplied statistics involves the applications of those involves the applications of those theorems, formulas, rules and laws to solve real-world theorems, formulas, rules and laws to solve real-world problems.problems.

Why statistics?Why statistics?
We use statistics when we need methods forWe use statistics when we need methods for extracting information from observed or collected dataextracting information from observed or collected data
to obtain a deeper understanding from numbers about to obtain a deeper understanding from numbers about the situations they represent.the situations they represent.
Even professional statisticians have trouble Even professional statisticians have trouble understanding a data set (= a collection of numerical understanding a data set (= a collection of numerical information) by merely looking at it.information) by merely looking at it.
Statistics and data analysis provide methods that can Statistics and data analysis provide methods that can help in the understanding of nearly every field of human help in the understanding of nearly every field of human experience.experience.

Why statistics?Why statistics?
What we can say about this data set by merely looking What we can say about this data set by merely looking at it????at it????
Data set of 22.385 individuals of Cambridge.Data set of 22.385 individuals of Cambridge.Information on Sex, Height, Weight, Age and Smoking Information on Sex, Height, Weight, Age and Smoking status.status.

Types of statisticsTypes of statistics
Descriptive statistics: Descriptive statistics: consists of methods for organizing, consists of methods for organizing, displaying, and describing data by using tables, graphs, displaying, and describing data by using tables, graphs, and summary measures.and summary measures.
Inferential Statistics: Inferential Statistics: consists of methods that use consists of methods that use samplesample results to help make decisions or predictions about a results to help make decisions or predictions about a populationpopulation..
Population (target)Population (target): the collection of all elements of interest: the collection of all elements of interest
SampleSample: the selection of a few elements from this population: the selection of a few elements from this population
ProbabilityProbability acts as a link between descriptive and inferential acts as a link between descriptive and inferential statisticsstatistics..
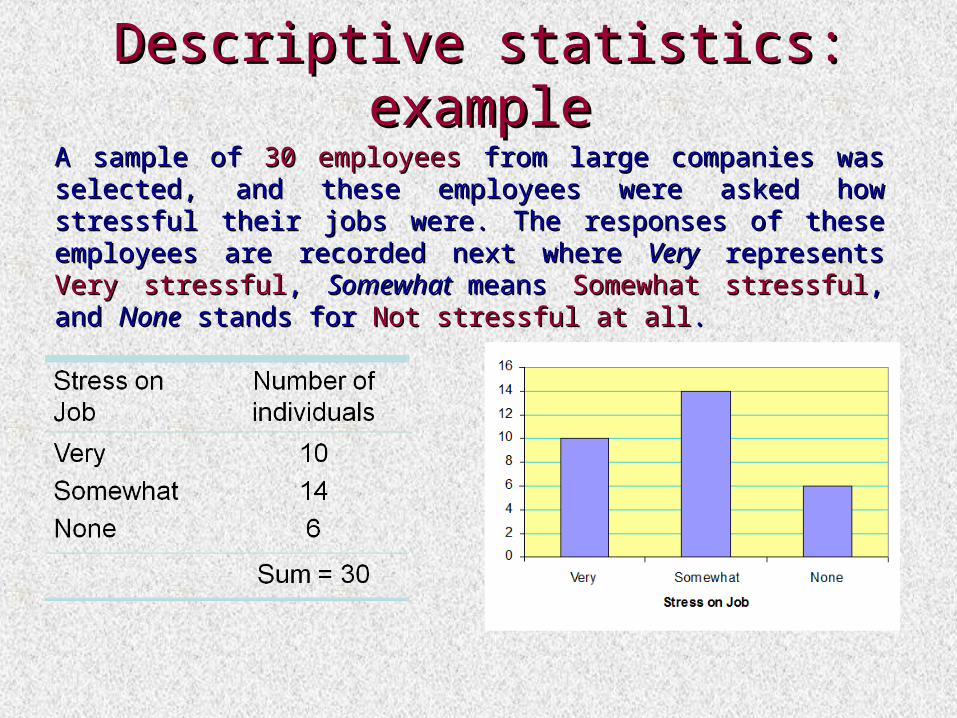
Descriptive statistics: exampleDescriptive statistics: exampleA sample of A sample of 30 employees 30 employees from large companies was from large companies was selected, and these employees were asked how stressful selected, and these employees were asked how stressful their jobs were. The responses of these employees are their jobs were. The responses of these employees are recorded next where recorded next where VeryVery represents represents Very stressfulVery stressful, , Somewhat Somewhat means means Somewhat stressfulSomewhat stressful, and , and NoneNone stands for stands for Not stressful at allNot stressful at all..

Inferential statistics: exampleInferential statistics: example
1.1. We may make some decisions about the political We may make some decisions about the political views of a college and university students based views of a college and university students based on political views of 1000 students selected from on political views of 1000 students selected from a few colleges and universitiesa few colleges and universities..
2.2. We may want to find the starting salary of a We may want to find the starting salary of a typical college graduate. To do so, we may select typical college graduate. To do so, we may select 2000 recent college graduates, find their starting 2000 recent college graduates, find their starting salaries, and make a decision based on this salaries, and make a decision based on this information.information.
DESCRIPTIVE STATISTICSDESCRIPTIVE STATISTICS

Basic termsBasic terms
1.1. ELEMENT or MEMBER or UNITELEMENT or MEMBER or UNIT
Specific subject or object (for example, a person, firm, Specific subject or object (for example, a person, firm, item, state, or country) about which the information is item, state, or country) about which the information is collectedcollected
2.2. VARIABLEVARIABLE
Characteristic under study that assumes different values Characteristic under study that assumes different values for different elements. In contrast to a variable, the value for different elements. In contrast to a variable, the value of a of a CONSTANTCONSTANT is fixed. is fixed.
3.3. OBSERVATION or MEASUREMENTOBSERVATION or MEASUREMENT
The value of a variable for an element.The value of a variable for an element.
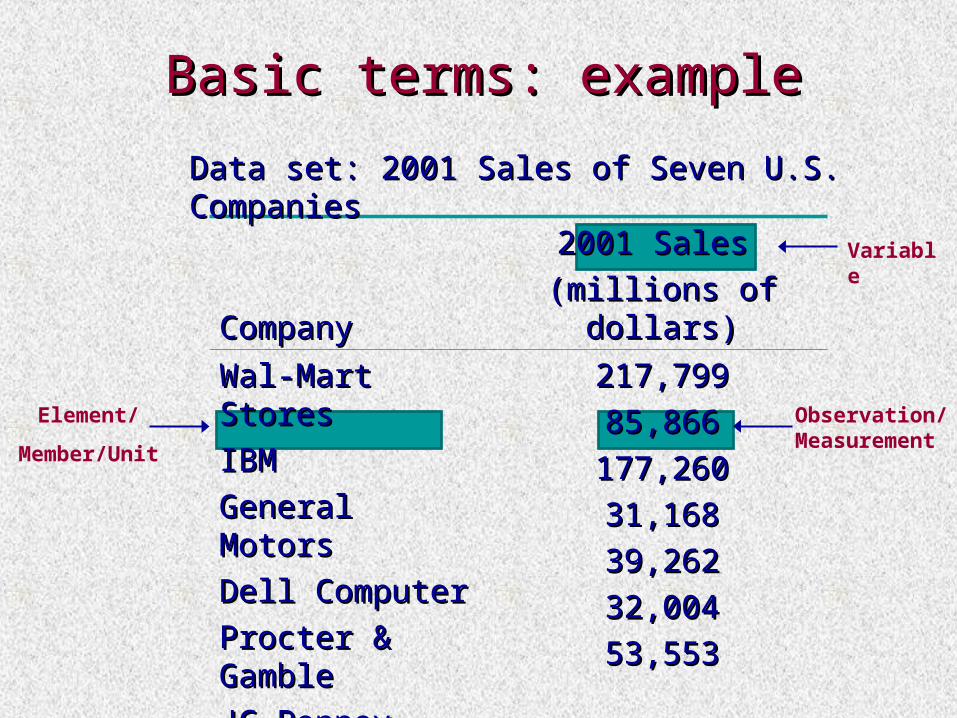
Basic terms: exampleBasic terms: example
CompanyCompany2001 Sales 2001 Sales
(millions of dollars)(millions of dollars)
Wal-Mart StoresWal-Mart Stores
IBMIBM
General MotorsGeneral Motors
Dell ComputerDell Computer
Procter & Procter & GambleGamble
JC PenneyJC Penney
Home DepotHome Depot
217,799217,799
85,86685,866
177,260177,260
31,16831,168
39,26239,262
32,00432,004
53,55353,553
Element/
Member/Unit
Variable
Observation/Measurement
Data set: 2001 Sales of Seven U.S. Data set: 2001 Sales of Seven U.S. CompaniesCompanies

Types of variablesTypes of variables1.1. QUANTITATIVE VARIABLEQUANTITATIVE VARIABLE
A variable that can be measured numerically. The data collected on a A variable that can be measured numerically. The data collected on a quantitative variable are called quantitative variable are called quantitative dataquantitative data..
Examples: Incomes, heights, prices of homes, etc.Examples: Incomes, heights, prices of homes, etc.
DISCRETE VARIABLEDISCRETE VARIABLE
A variable whose values are countable. A discrete variable can A variable whose values are countable. A discrete variable can assume only certain values with no intermediate values. assume only certain values with no intermediate values. (e.g. nr (e.g. nr students in a class, nr components of a family, births in Forlì in 2007, etc.) students in a class, nr components of a family, births in Forlì in 2007, etc.)
CONTINUOUS VARIABLECONTINUOUS VARIABLE
A variable that can assume any numerical value over a certain A variable that can assume any numerical value over a certain interval or intervals. interval or intervals. (e.g. age, weight, height, time to get to the school, etc.)(e.g. age, weight, height, time to get to the school, etc.)
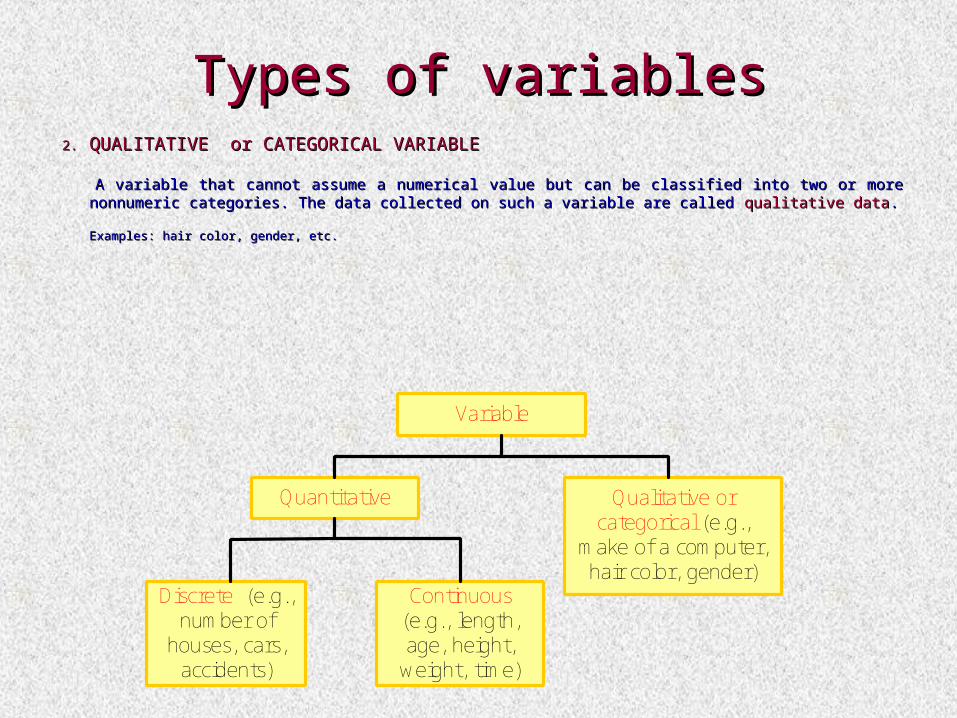
Types of variablesTypes of variables2.2. QUALITATIVE or CATEGORICAL VARIABLEQUALITATIVE or CATEGORICAL VARIABLE
A variable that cannot assume a numerical value but can be classified into two or more nonnumeric A variable that cannot assume a numerical value but can be classified into two or more nonnumeric categories. The data collected on such a variable are called categories. The data collected on such a variable are called qualitative dataqualitative data..
Examples: hair color, gender, etc.Examples: hair color, gender, etc.
Variable
Quantitative Qualitative orcategorical (e.g.,
make of a computer,hair color, gender)
Continuous(e.g., length,age, height,weight, time)
Discrete (e.g.,number of
houses, cars,accidents)

Summation notationSummation notationThe summation operator The summation operator is a mathematical notation used to is a mathematical notation used to
denote the sum of values.denote the sum of values.
For example, suppose a sample consists of 5 books and their prices are $25, For example, suppose a sample consists of 5 books and their prices are $25, $60, $37, $53 and $16. If we denote the variable price of a book by X, we $60, $37, $53 and $16. If we denote the variable price of a book by X, we have:have:
xx1 1 (price of the first book) = $25;(price of the first book) = $25;
xx22 (price of the second book) = $60; (price of the second book) = $60;
……xx5 5 (price of the fifth book) = $16;(price of the fifth book) = $16;
Now, suppose we want to add the prices of all five books:Now, suppose we want to add the prices of all five books:
xx11 + x + x22 + x + x33 + x + x44 + x + x55 = 25 + 60 + 37 + 53 + 16 = $191 or, briefly, = 25 + 60 + 37 + 53 + 16 = $191 or, briefly,
xxi i = x= x11 + x+ x22 + x + x33 + x + x44 + x + x55 =25 + 60 + 37 + =25 + 60 + 37 + 53 + 16 53 + 16 = $191= $191
5
1iix

Summation notationSummation notationExampleExample
Annual salaries (in thousands of dollars) of four Annual salaries (in thousands of dollars) of four workers are 75, 42, 125, and 61. Find workers are 75, 42, 125, and 61. Find
a)a) ∑x
b) (∑x)²
c) ∑x²
Solutiona) ∑x = x1 + x2 + x3 + x4 = 75 + 42 + 125 + 61 = 303 b) (∑x)² = (75 + 42 + 125 + 61)² =(303)² = 91.809c)∑x² = (75)² + (42)² + (125)² + (61)² = 5625 + 1764+
+ 15,625 + 721 = 26.735

ORGANIZING DATAORGANIZING DATA
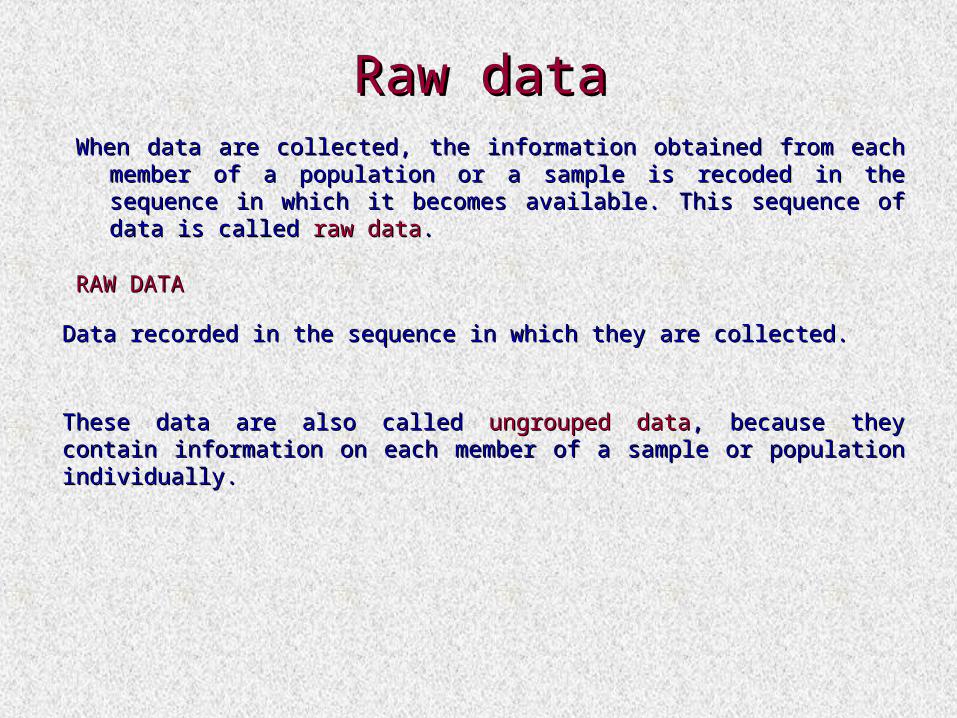
Raw dataRaw dataWhen data are collected, the information obtained from each When data are collected, the information obtained from each
member of a population or a sample is recoded in the sequence member of a population or a sample is recoded in the sequence in which it becomes available. This sequence of data is called in which it becomes available. This sequence of data is called raw dataraw data..
RAW DATARAW DATA
Data recorded in the sequence in which they are collected.Data recorded in the sequence in which they are collected.
These data are also called These data are also called ungrouped dataungrouped data, because they contain , because they contain information on each member of a sample or population individually.information on each member of a sample or population individually.
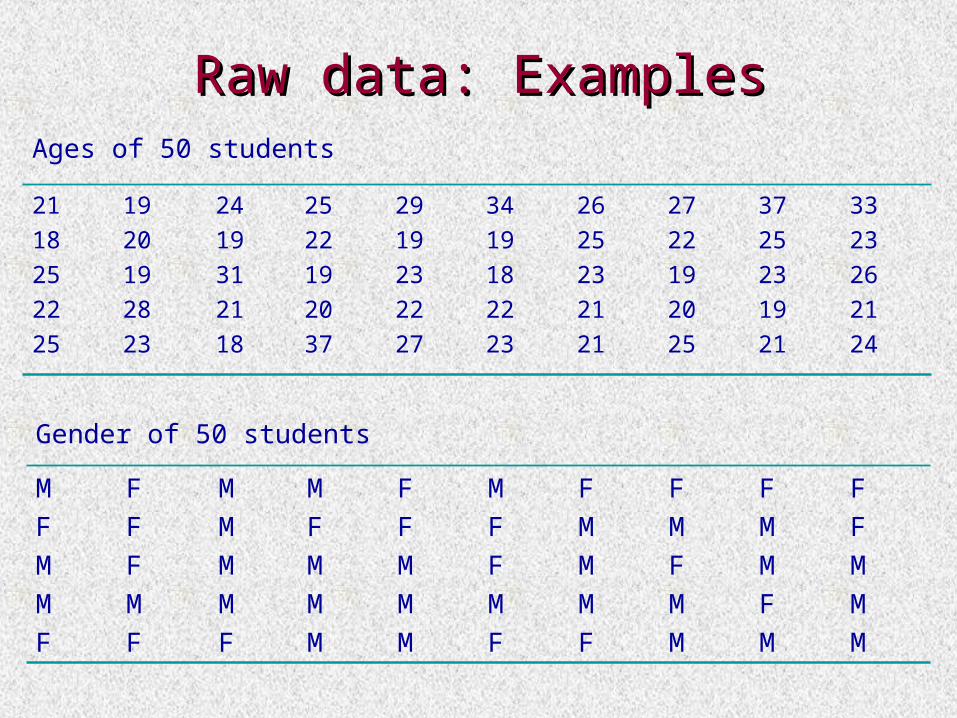
Raw data: ExamplesRaw data: Examples
Ages of 50 students
21
18
25
22
25
19
20
19
28
23
24
19
31
21
18
25
22
19
20
37
29
19
23
22
27
34
19
18
22
23
26
25
23
21
21
27
22
19
20
25
37
25
23
19
21
33
23
26
21
24
Gender of 50 students
M
F
M
M
F
F
F
F
M
F
M
M
M
M
F
M
F
M
M
M
F
F
M
M
M
M
F
F
M
F
F
M
M
M
F
F
M
F
M
M
F
M
M
F
M
F
F
M
M
M
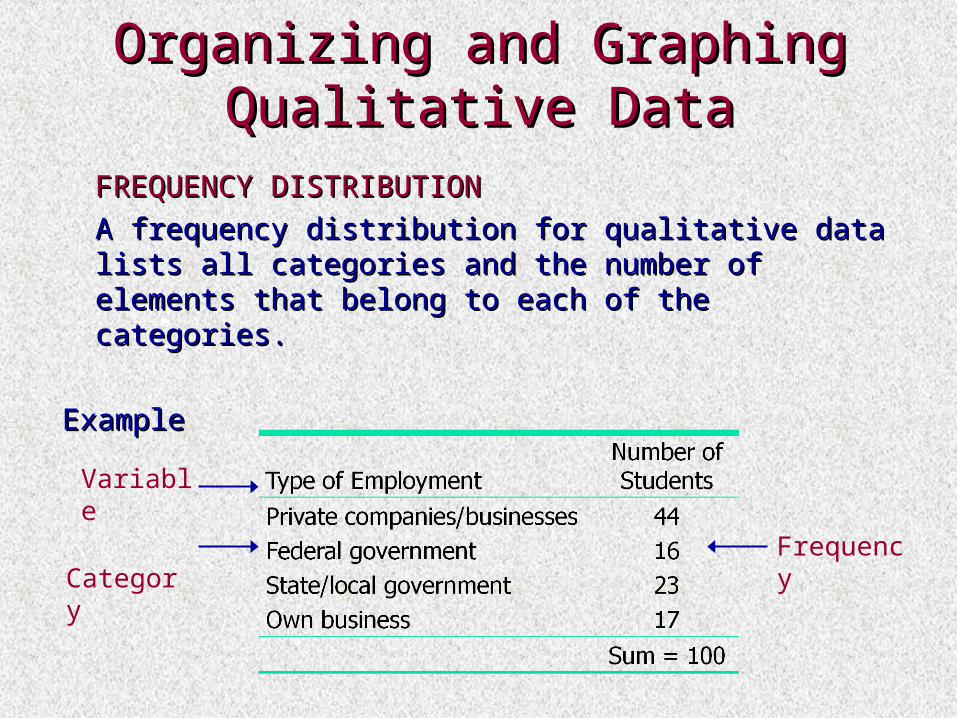
Organizing and Graphing Organizing and Graphing Qualitative DataQualitative Data
FREQUENCY DISTRIBUTIONFREQUENCY DISTRIBUTION A frequency distribution for qualitative data lists A frequency distribution for qualitative data lists
all categories and the number of elements that all categories and the number of elements that belong to each of the categories.belong to each of the categories.
ExampleExample
Frequency
Variable
Category

Frequency distributionFrequency distributionHow can we obtain a frequency distribution?How can we obtain a frequency distribution?
ExampleExample
A sample of A sample of 30 employees 30 employees from large companies was from large companies was selected, and these employees were asked how stressful selected, and these employees were asked how stressful their jobs were. The responses of these employees are their jobs were. The responses of these employees are recorded next where recorded next where VeryVery represents represents Very stressfulVery stressful, , Somewhat Somewhat means means Somewhat stressfulSomewhat stressful, and , and NoneNone stands for stands for Not stressful at allNot stressful at all..
Raw dataRaw data

Frequency distributionFrequency distribution
Stress on JobStress on Job TallyTally Frequency (Frequency (nnii))
Very Very
Somewhat Somewhat
None None
||||| |||||||||| |||||
||||| ||||| ||||||||| ||||| ||||
||||| |||||| |
1010
1414
66
Sum =Sum = nni i = 30 = 30

Relative frequency and Relative frequency and percentage distributionspercentage distributions
Relative frequencyRelative frequency of a category: it is obtained by of a category: it is obtained by dividing the frequency of the category by the sum dividing the frequency of the category by the sum of all frequenciesof all frequencies
sfrequencie all of Sum
category that ofFrequency frequency Relative
n
nf ii
Percentage Percentage of a category: it is obtained by of a category: it is obtained by multiplying the relative frequency of the multiplying the relative frequency of the category by 100category by 100
Percentage = (Relative frequency) * 100 = fi * 100
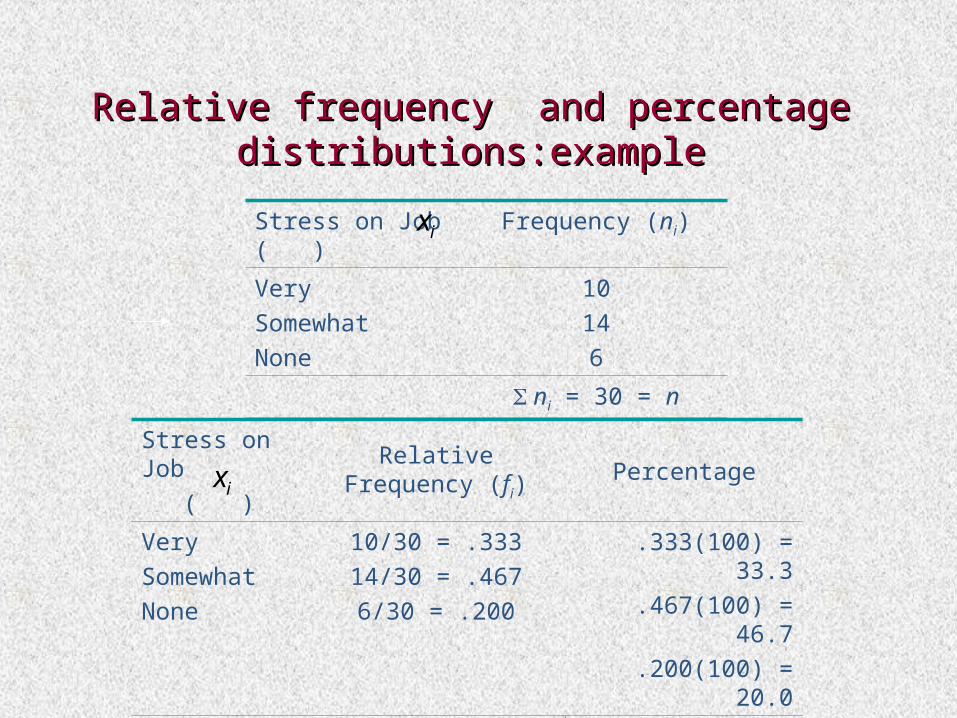
Relative frequency and percentage Relative frequency and percentage distributions:exampledistributions:example
Stress on Job ( )
Frequency (ni)
Very Somewhat None
10146
ni = 30 = n
Stress on Job
( )
Relative Frequency (fi)
Percentage
VerySomewhatNone
10/30 = .33314/30 = .4676/30 = .200
.333(100) = 33.3
.467(100) = 46.7
.200(100) = 20.0
fi = 1.00 Sum = 100
ix
ix

Graphical presentation of qualitative dataGraphical presentation of qualitative data
A graphic display can reveal at a glance the main A graphic display can reveal at a glance the main characteristics of a data set.characteristics of a data set.
The The bar graphbar graph and the and the pie chartpie chart are two are two types of graphs used to display qualitative types of graphs used to display qualitative data.data.
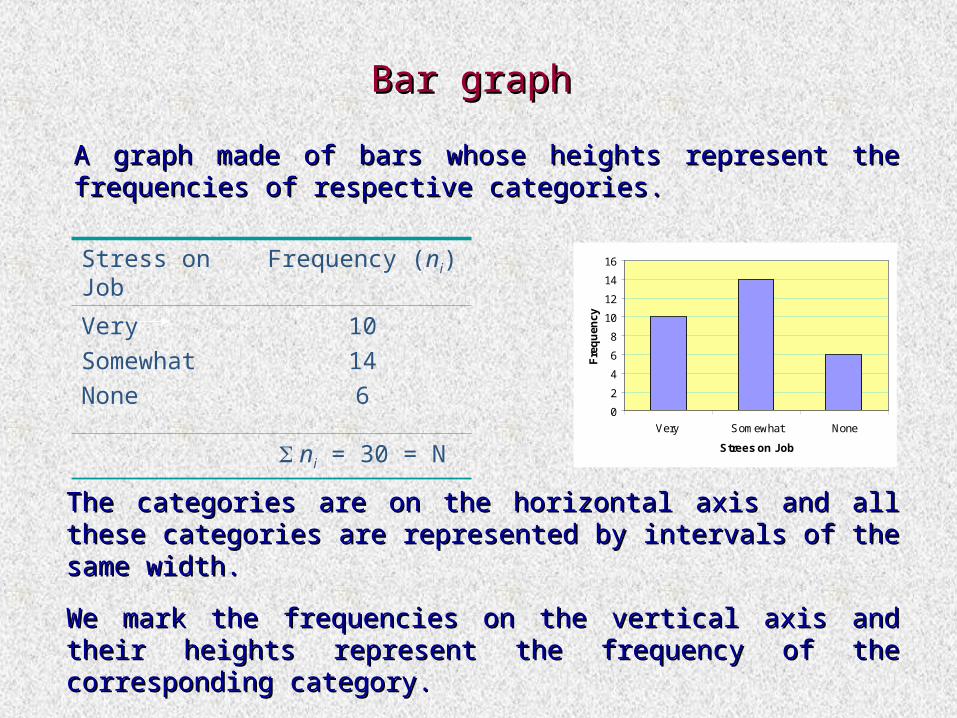
Bar graphBar graph
A graph made of bars whose heights represent the A graph made of bars whose heights represent the frequencies of respective categories.frequencies of respective categories.
Stress on Job Frequency (ni)
Very Somewhat None
10146
ni = 30 = N0
2
4
6
8
10
12
14
16
Very Somewhat None
Strees on Job
Fre
qu
ency
The categories are on the horizontal axis and all these The categories are on the horizontal axis and all these categories are represented by intervals of the same width.categories are represented by intervals of the same width.
We mark the frequencies on the vertical axis and their We mark the frequencies on the vertical axis and their heights represent the frequency of the corresponding heights represent the frequency of the corresponding category.category.
We leave a small gap between adjacent bars.We leave a small gap between adjacent bars.

Bar graph for percentages Bar graph for percentages
The bar graphs for relative frequency and percentage The bar graphs for relative frequency and percentage distributions can be drawn simply by marking the relative distributions can be drawn simply by marking the relative frequencies or percentages, instead of the frequencies, on frequencies or percentages, instead of the frequencies, on the vertical axis.the vertical axis.
Stress on Job
Percentage
VerySomewhatNone
33.346.720.0
0
10
20
30
40
50
Very Somewhat None
Stress on Job
Pe
rce
nta
ge

Pie charts Pie charts
A circle divided into portions that represent the relative A circle divided into portions that represent the relative frequencies or percentages of a population or a sample frequencies or percentages of a population or a sample belonging to different categories.belonging to different categories.
33%
47%
20%
Very
Somewhat
None
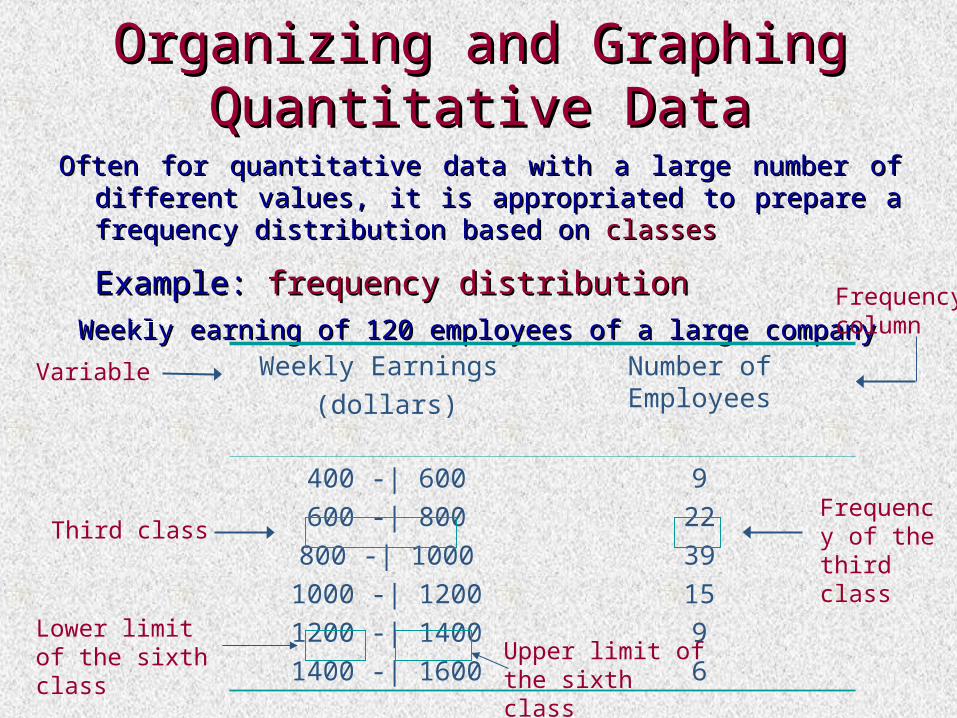
Organizing and Graphing Organizing and Graphing Quantitative DataQuantitative Data
Often for quantitative data with a large number of different Often for quantitative data with a large number of different values, it is appropriated to prepare a frequency values, it is appropriated to prepare a frequency distribution based on distribution based on classesclasses.
Example: Example: frequency distributionfrequency distribution Weekly earning of 120 employees of a large companyWeekly earning of 120 employees of a large company
Weekly Earnings (dollars)
Number of Employees
400 -| 600600 -| 800
800 -| 10001000 -| 12001200 -| 14001400 -| 1600
922391596
Variable
Third class
Frequency column
Frequency of the third class
Lower limit of the sixth class Upper limit of
the sixth class

Relative frequency and Relative frequency and percentage distributionpercentage distribution
Weekly Earnings (dollars)
Number of Employees
n
Relative frequency
f
Percentage
400 -| 600600 -| 800
800 -| 10001000 -| 12001200 -| 14001400 -| 1600
1422492096
14/120 = 0.11722/120 = 0.18349/120 = 0.40820/120 = 0.1679/120 = 0.0756/120 = 0.050
0.117*100 = 11.7
0.183*100 = 18.3
0.408*100 = 40.8
0.167*100 = 16.7
0.075*100 = 7.5 0.050*100 = 5.0
n = 120 f = 1 100

Cumulative frequencyCumulative frequencyA cumulative frequency is the total number of values that fall A cumulative frequency is the total number of values that fall
below a certain value.below a certain value.
To obtain the cumulative frequency of a class, we add the To obtain the cumulative frequency of a class, we add the frequency of that class to the frequencies of all preceding frequency of that class to the frequencies of all preceding classes.classes.
Weekly Earnings (dollars)
Number of Employees
n
Cumulative frequency
400 -| 600600 -| 800800 -| 10001000 -| 12001200 -| 14001400 -| 1600
1422492096
1414 + 22 = 36
14 +22 + 49 = 8614 + 22 + 49 + 20 = 10514 + 22 + 49 + 20 + 9 =
11414 + 22 + 49 + 20 + 9 + 6
= 120
n = 120

Graphical presentation of quantitative Graphical presentation of quantitative datadata
Quantitative data can be displayed mainly in a Quantitative data can be displayed mainly in a histogramhistogram..
Actually, we can also draw a Actually, we can also draw a pie chartpie chart to display to display the percentage distribution for a quantitative data the percentage distribution for a quantitative data set. The procedure to construct a pie chart is set. The procedure to construct a pie chart is similar to the one for qualitative data.similar to the one for qualitative data.

HistogramHistogram
A graph in which classes are marked on the A graph in which classes are marked on the horizontal axis and the frequencies, relative horizontal axis and the frequencies, relative frequencies, or percentages are marked on the frequencies, or percentages are marked on the vertical axis. The frequencies, relative frequencies, vertical axis. The frequencies, relative frequencies, or percentages are represented by the heights of or percentages are represented by the heights of the bars. In a histogram, the bars are drawn the bars. In a histogram, the bars are drawn adjacent to each other, to underline the continuity adjacent to each other, to underline the continuity of the quantitative data.of the quantitative data.

Example histogramExample histogram
Weekly Earnings (dollars)
Number of Employees
Percentage
400 -| 600600 -| 800800 -| 10001000 -| 12001200 -| 14001400 -| 1600
1422492096
11.718.340.816.77.5 5.0
0
10
20
30
40
50
60
400-600 600-800 800-1000 1000-1200 1200-1400 1400-1600
Classes
Fre
qu
en
cy
0
10
20
30
40
50
400-600 600-800 800-1000 1000-1200 1200-1400 1400-1600
Classi
Pe
rce
nta
ge