Statistics Project Final
24
Velen Garcia Statistics 151O AM Survey Data Project Phase 2 Abstract: In gathering information from random people, specifically about their political affiliation, socioeconomic status, bills being passed, and about their daily life habits, we could get an idea of a larger population. The present study was conducted to determine if the participating adults showed any correlation or difference when comparing data, and contrasting the questions that were asked in this analysis. My sample size for my project included 28 males and 22 females. The participant’s information were analyzed using statistical techniques to make inferences toward the true population of random peoples believes and choices. Some of the test included: Goodness of Fit test, Test of Independence, Odds Ratio test, Wilcoxon-rank-sum test, and Kruskal-Wallis test. It was hypothesized that these participating people would either show a correlation or difference when comparing the collective survey information. The results indicate that there correlation which exists, as well as differences; depending on the data compared. Overall, there was not much statistical evidence to suggest there is a correlation in the variables. Introduction: In this analysis, a survey was taken by various students. There were a total of 2268 surveys (these survey questions were entered at http://tinyurl.com/2v3tkur ) in our population. I am looking to see Page | 1
-
Upload
velengarciaprojects -
Category
Documents
-
view
171 -
download
3
Transcript of Statistics Project Final
Velen Garcia
Statistics 151O AM
Survey Data Project
Phase 2
Abstract: In gathering information from random people, specifically about their political affiliation, socioeconomic status, bills being passed, and about their daily life habits, we could get an idea of a larger population. The present study was conducted to determine if the participating adults showed any correlation or difference when comparing data, and contrasting the questions that were asked in this analysis. My sample size for my project included 28 males and 22 females. The participant’s information were analyzed using statistical techniques to make inferences toward the true population of random peoples believes and choices. Some of the test included: Goodness of Fit test, Test of Independence, Odds Ratio test, Wilcoxon-rank-sum test, and Kruskal-Wallis test. It was hypothesized that these participating people would either show a correlation or difference when comparing the collective survey information. The results indicate that there correlation which exists, as well as differences; depending on the data compared. Overall, there was not much statistical evidence to suggest there is a correlation in the variables.
Introduction: In this analysis, a survey was taken by various students. There were a total of 2268 surveys (these survey questions were entered at http://tinyurl.com/2v3tkur) in our population. I am looking to see if there is any correlation in a given survey, and within a particular question and answer. The 23 questions that were asked consisted of: Gender, Ethnicity, Age, Height, Weight, Hours worked per week, If they are a student, Education Level, Annual Gross Income, Eye Color, Natural Hair Color, Number of ounces of water per day, In favor of death penalty, political party, registered to vote, knows anyone with HIV, favor of Health Bill, Left or Right Hand, If they believe President Obama will be reelected, Party Affiliation, Consider Prop 8 (regarding same sex marriage), Shoe size and Ring size. I believe that men’s height, weight, ring, and shoe size is bigger than woman, Men make more that Woman, as well as the taller you are the more you weigh. So I should see the a strong correlation between these two variables, and in regards to the rings and shoe size, commonly we would think that someone who has big feet has big hands, so I expect to see a strong correlation
Page | 1
between these two variables, as far as the annual gross income, it’s a tradition that men make more money, this has been shown in past studies of annual income studies. I expect to observe a significant amount in the income of men compared to women. Furthermore into the project, Republicans don't believe Obama will be re-elected, but Democrats will, since Party affiliations usually agree on what was chosen before. Democrats do not want the health bill passed, Republicans are in favor of the death penalty, Right hands are in favor of death and Left handed people are not, Left hands drink more water than Rights, people who support Obama agree on supporting the death penalty, and I believe Whites make more annual income since previous data shows that the majority of college degrees earned are by whites.
The particular questions asked in this analysis are as followed:
1. Is there a relation between an appropriate combination of a person's height, weight, ring, or shoe size?2. Is there a difference in gross income based on gender?3. Is there a relationship between political party anda. If the respondent feels President Obama will be re-elected?b. if the respondent is in favor of the health care bill as passed?c. If the respondent is in favor of the death penalty.4. Is there a relationship between handedness anda. In favor of the death penaltyb. Amount of water consumed5. Is there a relationship between people who believe Obama will be re-elected and in favor of the death penalty?6. Which ethnicity from my sample size makes has a higher Annual Income?7. The higher the degree someone has the more they make annually?
Methods: Many students were assigned to a task, to conduct a survey to 10 random people. A total of 2268 were in my population. Out of there I took a sample size of 50 random samples doing a simple random sample from TC Stats. I had to clear up some of the data but, I was able to get my sample size information. First, I highlighted all the Men and took their information pertaining to the questions, and then I started to make graphs and calculate the difference in numbers. I had a total of 28 Men in my sample size and 22 in Women. After I collected all the data I wrote everything down on a few sheets to reference back on some graphs.Materials supplied with: TC Stats program offered on I pads
Page | 2
2268 Surveys (Consisting of the same 23 questions)
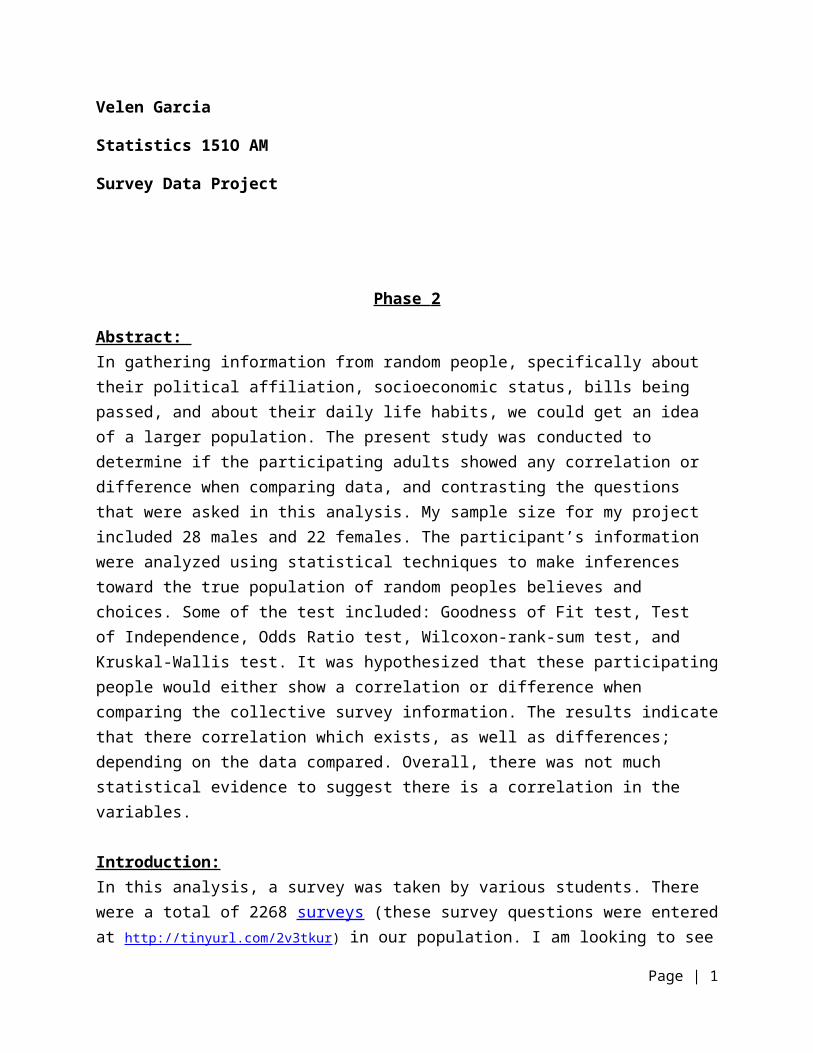
Table 1: Summary Statistics for my sample size of height and weight
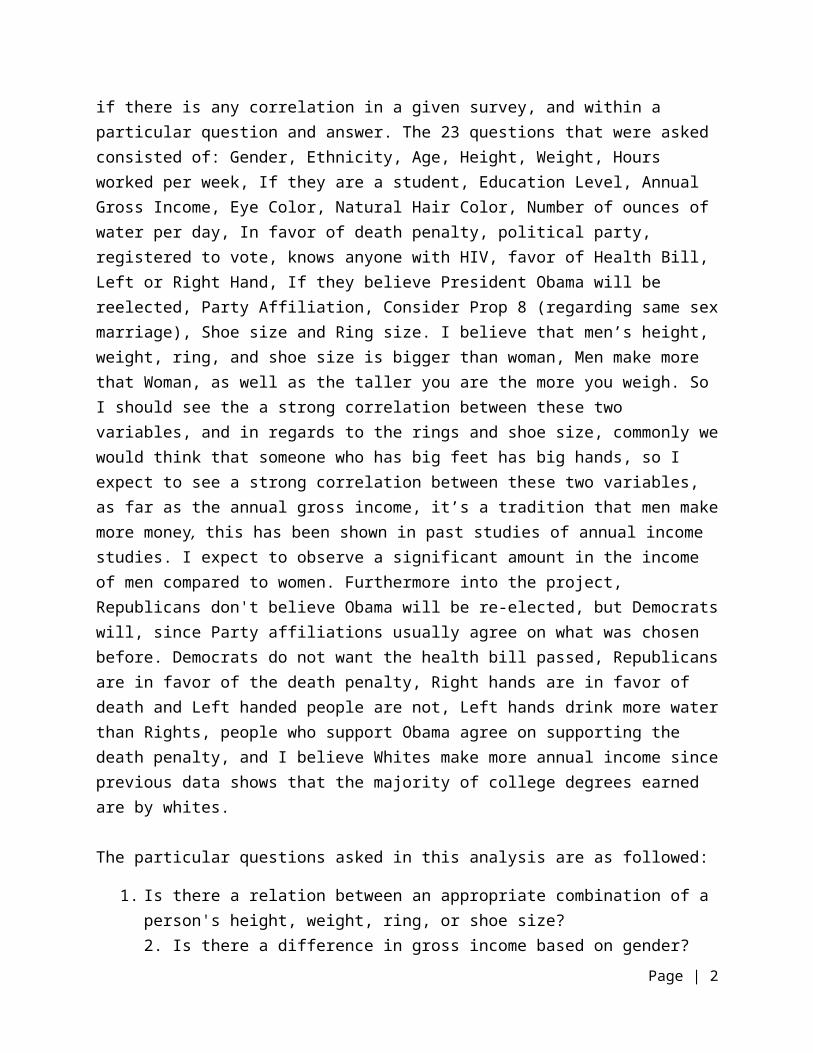
Table 2: Summary Statistics for people weighing less than or equal to 140lbs
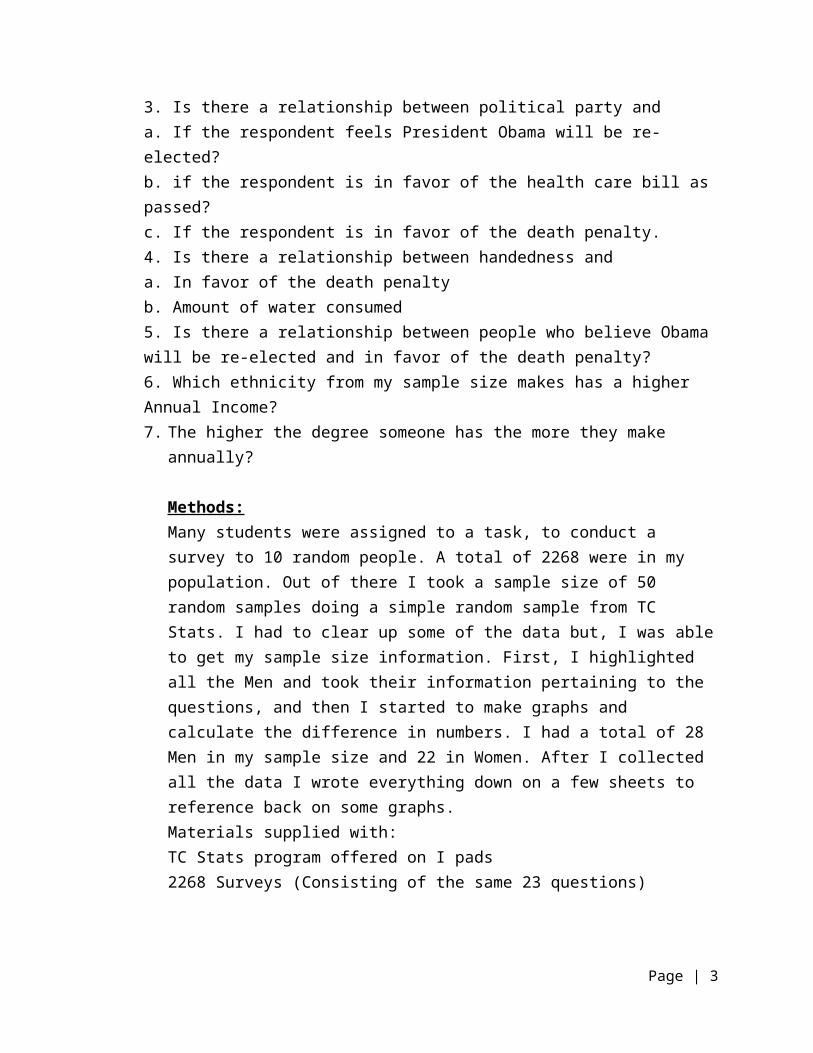
Figure 1: Box and Whisker Plot for height of people weighing less than or equal to 140 lbs.
Page | 3
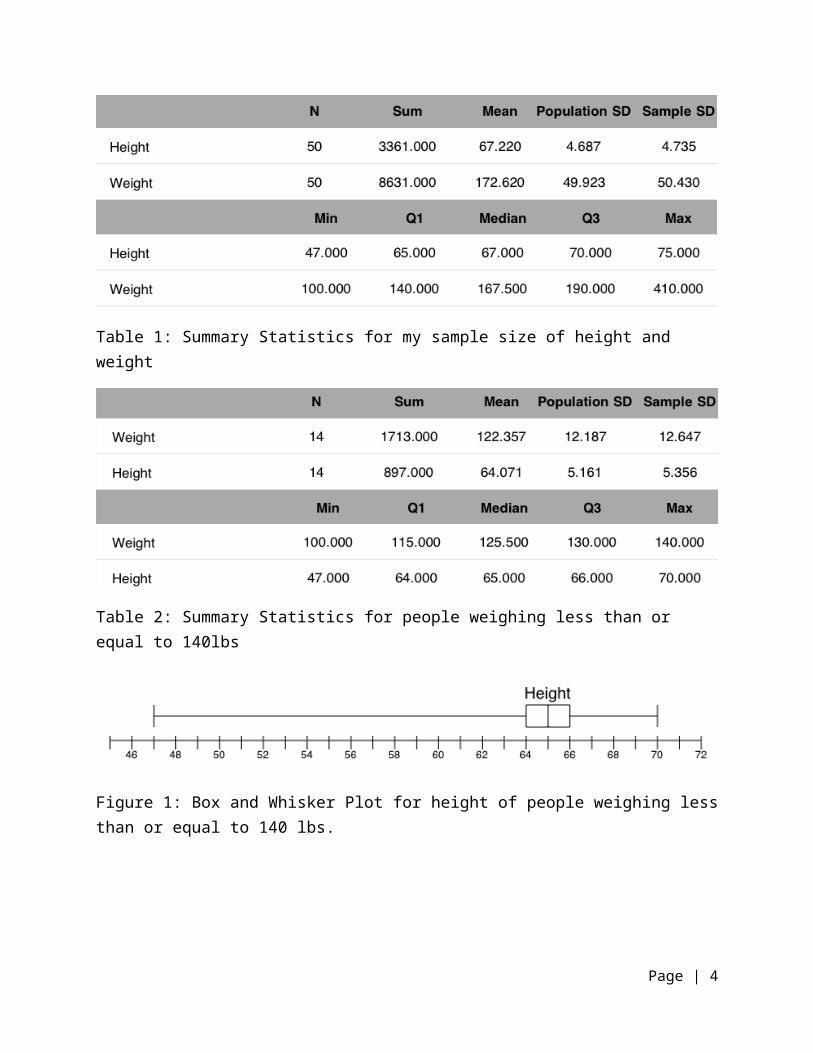
Table 3: Summary Statistics for height of people weighing more than 140 lbs.
Figure 2: Box and Whisker Plot for height of people weighing more than 140 lbs.
CORRELATION BETWEEN RING AND SHOE SIZE
Table 4: Summary Statistics for ring and shoe size in my sample size
Table 5: Summary Statistics for ring and shoe size of people with shoe size less than 8
Page | 4
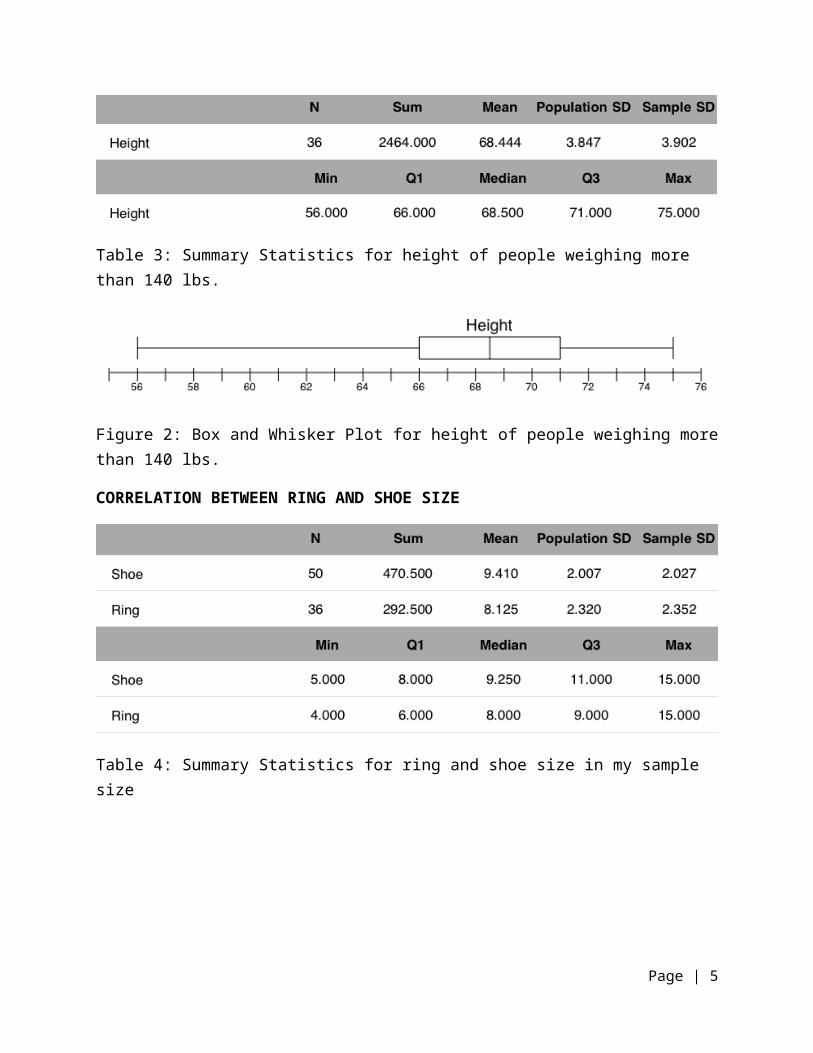
Figure 3: Box and Whisker Plot for shoes size and ring size of people with greater than a size 8 shoe
DIFFERENCE IN GROSS INCOME BASED ON GENDER
Table 6: Summary Statistics of women for Annual Gross Income
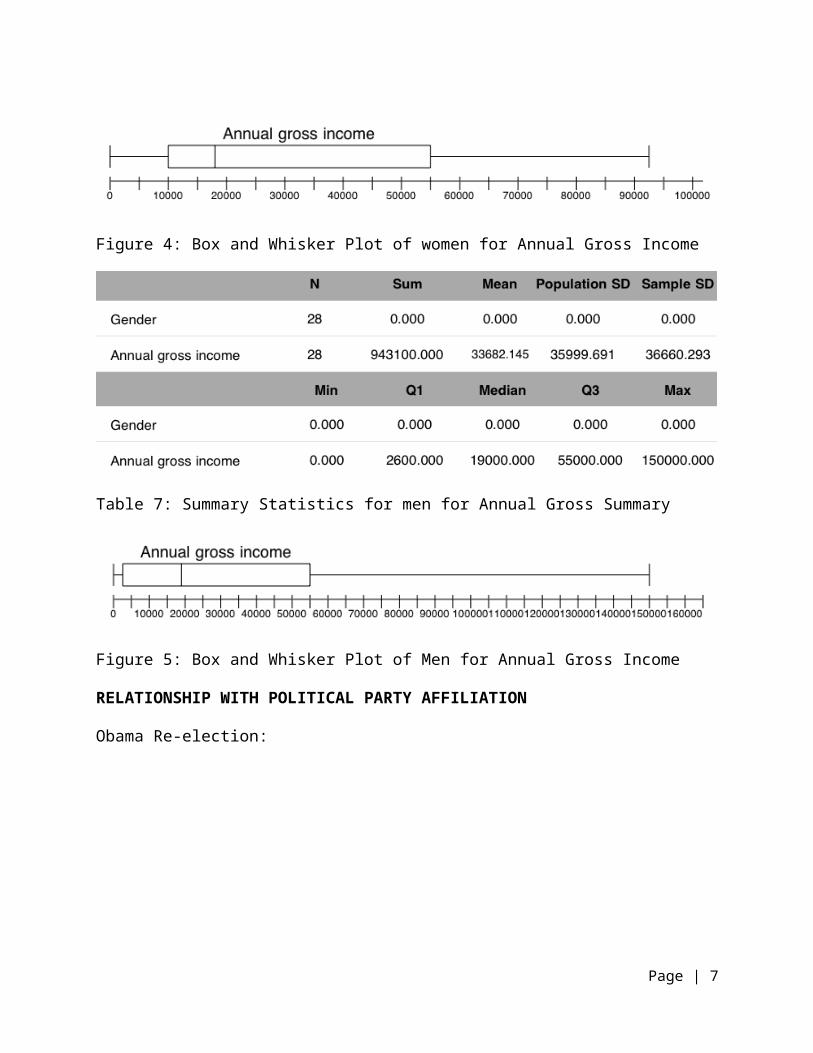
Figure 4: Box and Whisker Plot of women for Annual Gross Income
Page | 5
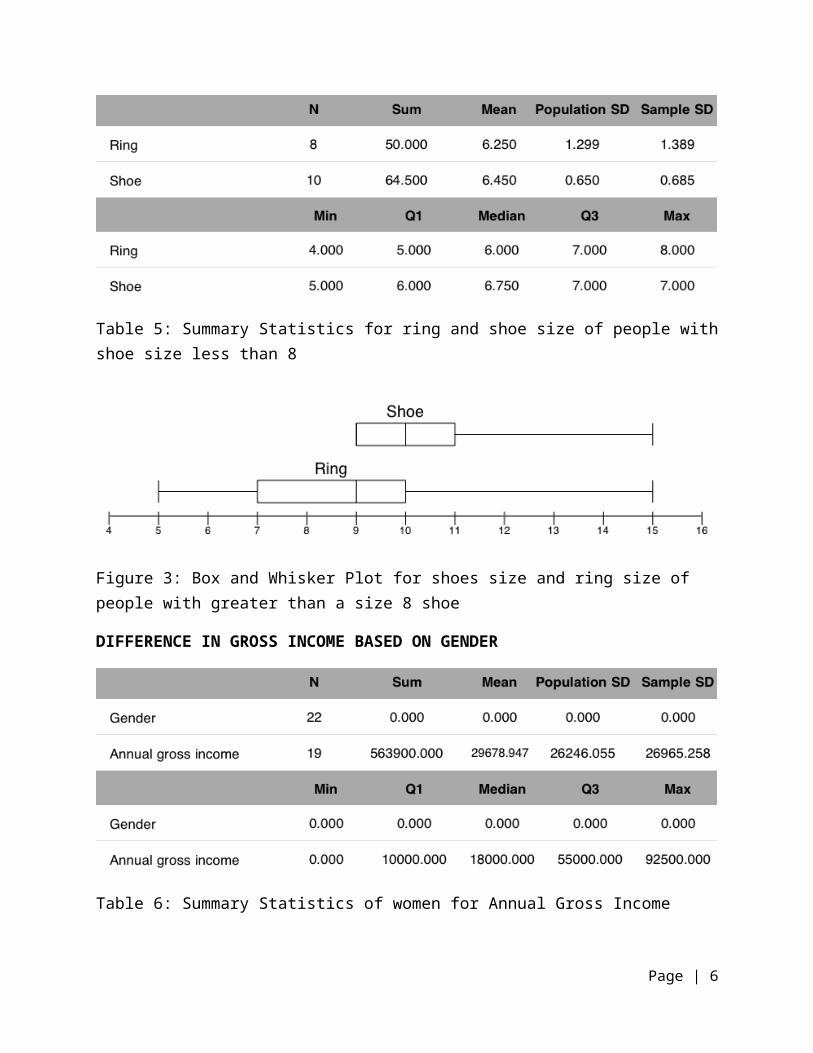
Table 7: Summary Statistics for men for Annual Gross Summary
Figure 5: Box and Whisker Plot of Men for Annual Gross Income
RELATIONSHIP WITH POLITICAL PARTY AFFILIATION
Obama Re-election:
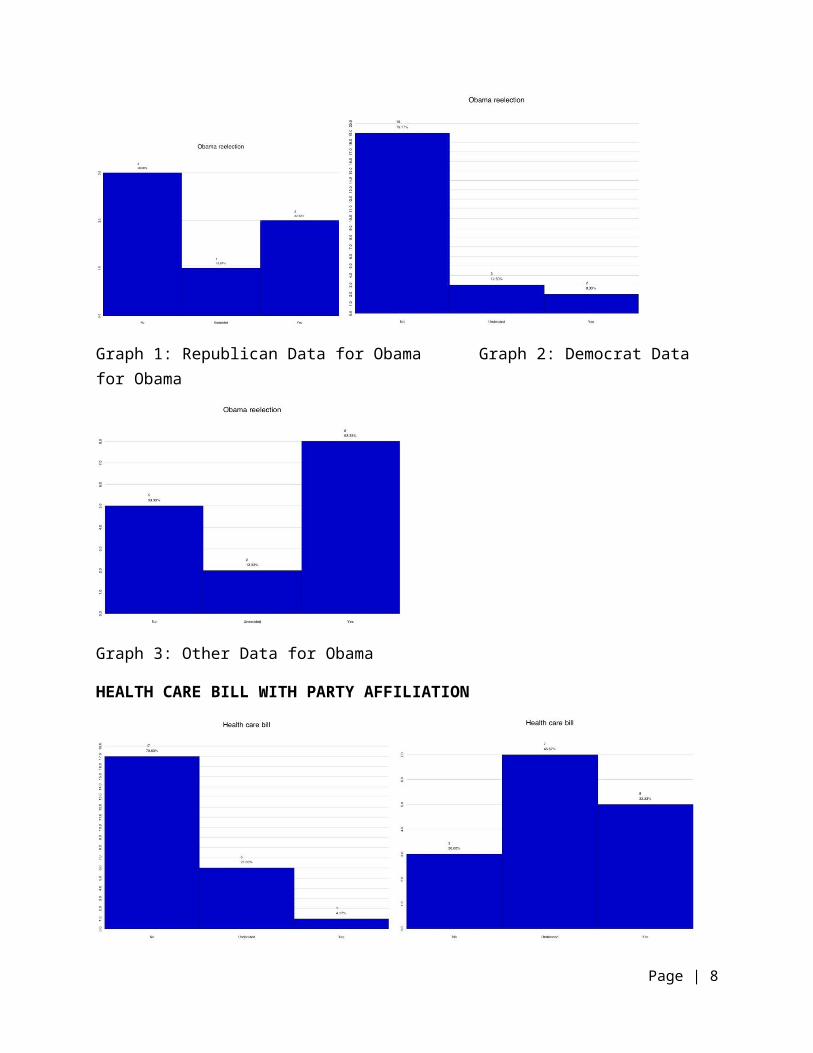
Graph 1: Republican Data for Obama Graph 2: Democrat Data for Obama
Page | 6
Graph 3: Other Data for Obama
HEALTH CARE BILL WITH PARTY AFFILIATION
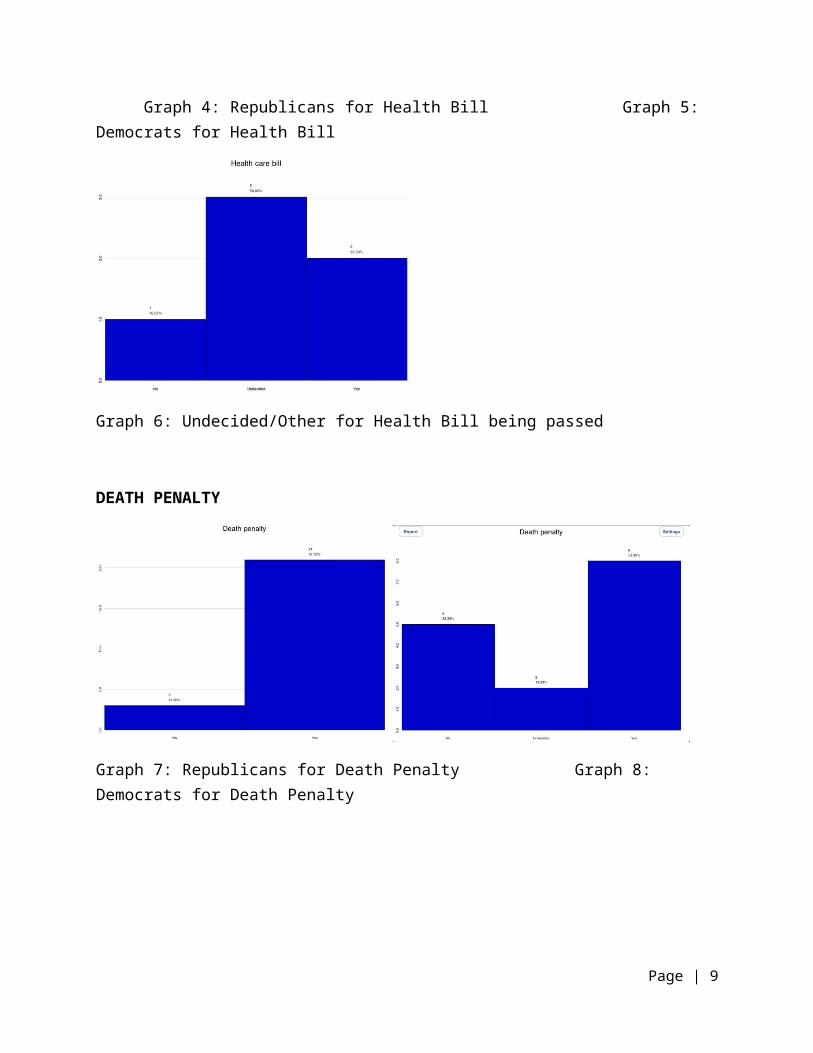
Graph 4: Republicans for Health Bill Graph 5: Democrats for Health Bill
Page | 7
Graph 6: Undecided/Other for Health Bill being passed
DEATH PENALTY
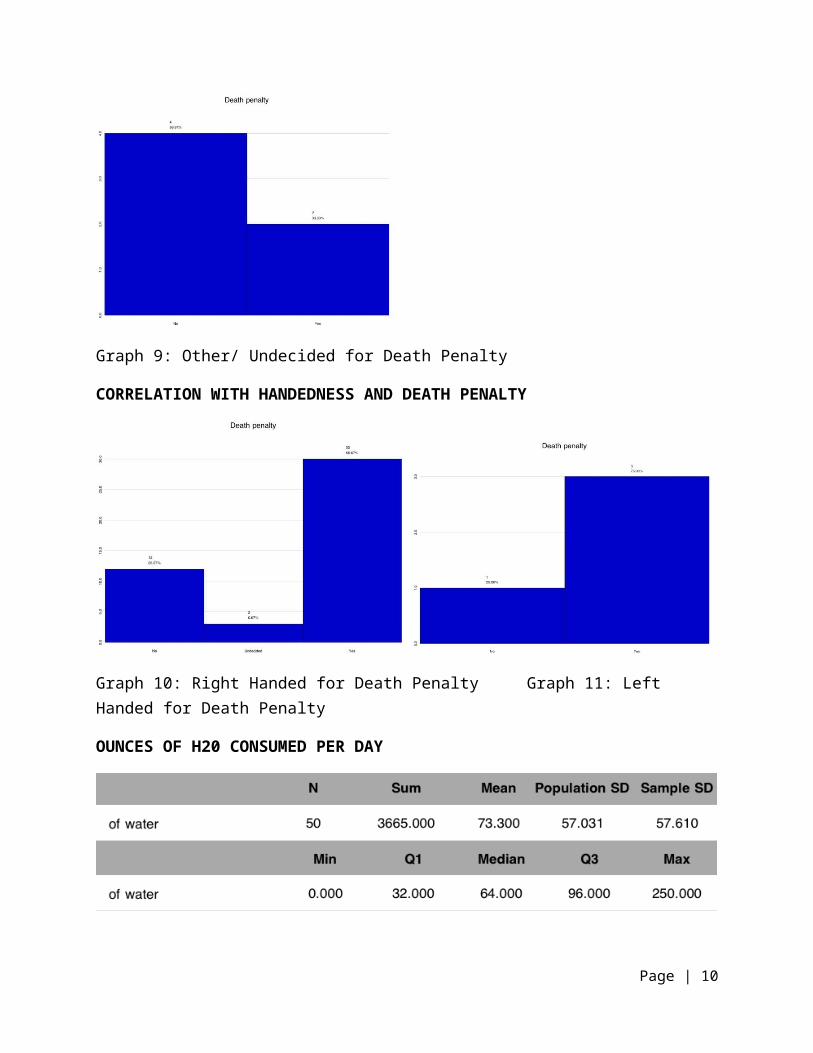
Graph 7: Republicans for Death Penalty Graph 8: Democrats for Death Penalty
Graph 9: Other/ Undecided for Death Penalty
CORRELATION WITH HANDEDNESS AND DEATH PENALTY
Page | 8
Graph 10: Right Handed for Death PenaltyGraph 11: Left Handed for Death Penalty
OUNCES OF H20 CONSUMED PER DAY
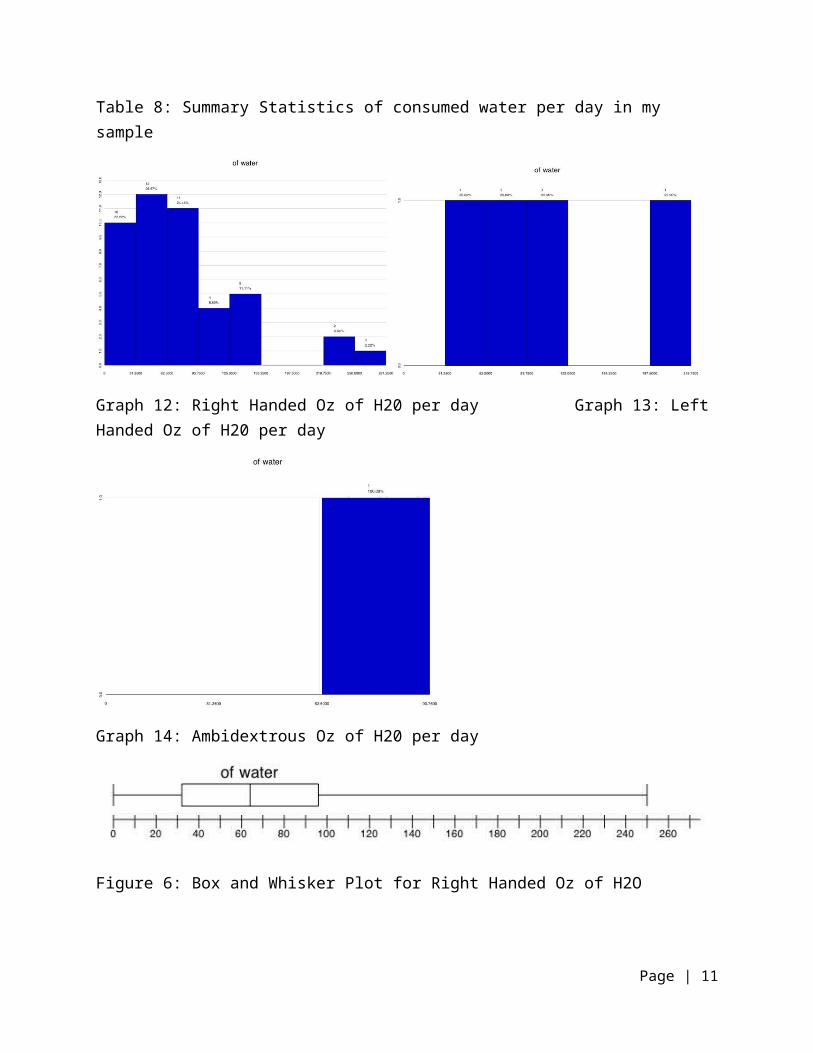
Table 8: Summary Statistics of consumed water per day in my sample
Graph 12: Right Handed Oz of H20 per day Graph 13: Left Handed Oz of H20 per day
Page | 9
Graph 14: Ambidextrous Oz of H20 per day
Figure 6: Box and Whisker Plot for Right Handed Oz of H2O
Figure 7: Box and Whisker Plot for Left Handed Oz of H2O
CORRELATION BETWEEN OBAMA SUPPORTERS AND SUPPORTERS FOR DEATH PENALTY
Page | 10
Graph 14: In favor of Obama and Death Penalty
Annual Gross Income of Ethnics
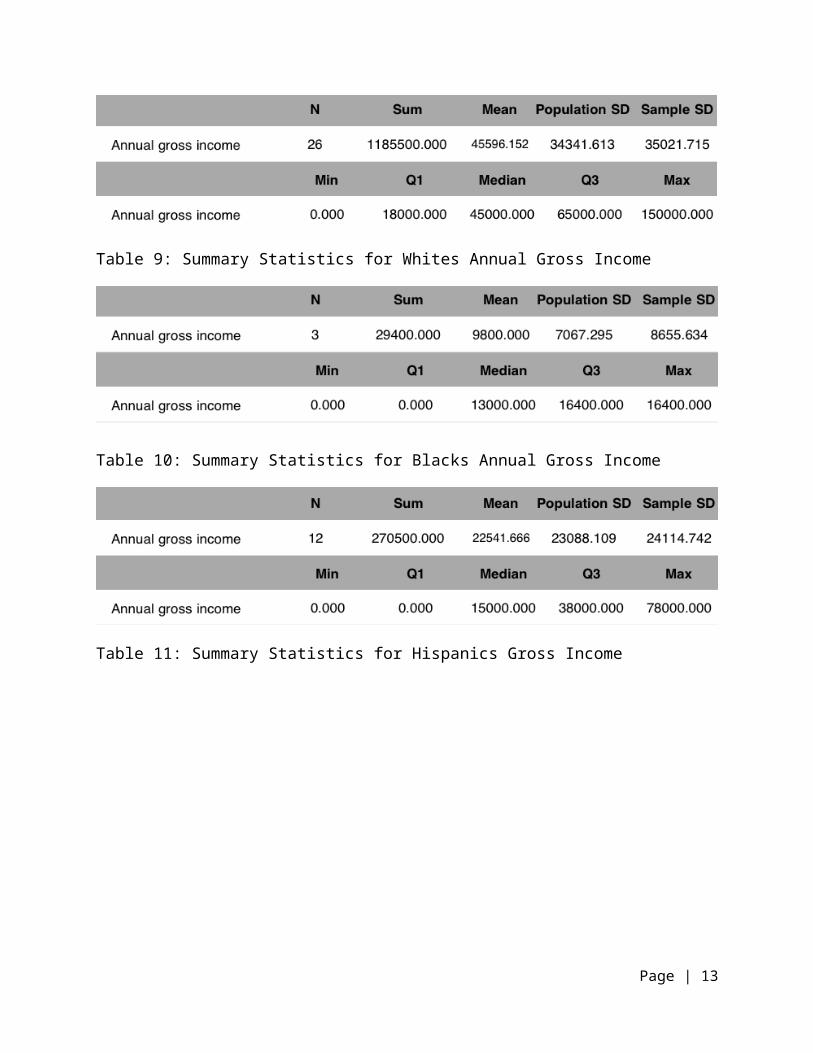
Table 9: Summary Statistics for Whites Annual Gross Income
Page | 11
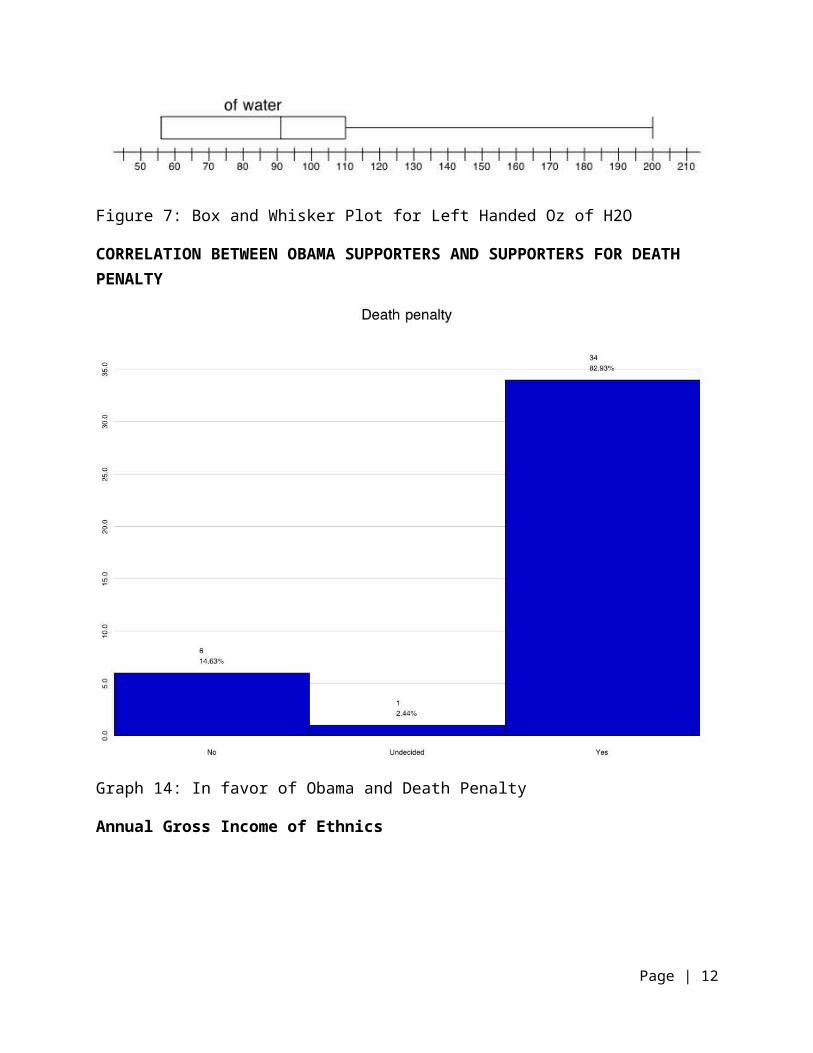
Table 10: Summary Statistics for Blacks Annual Gross Income
Table 11: Summary Statistics for Hispanics Gross Income
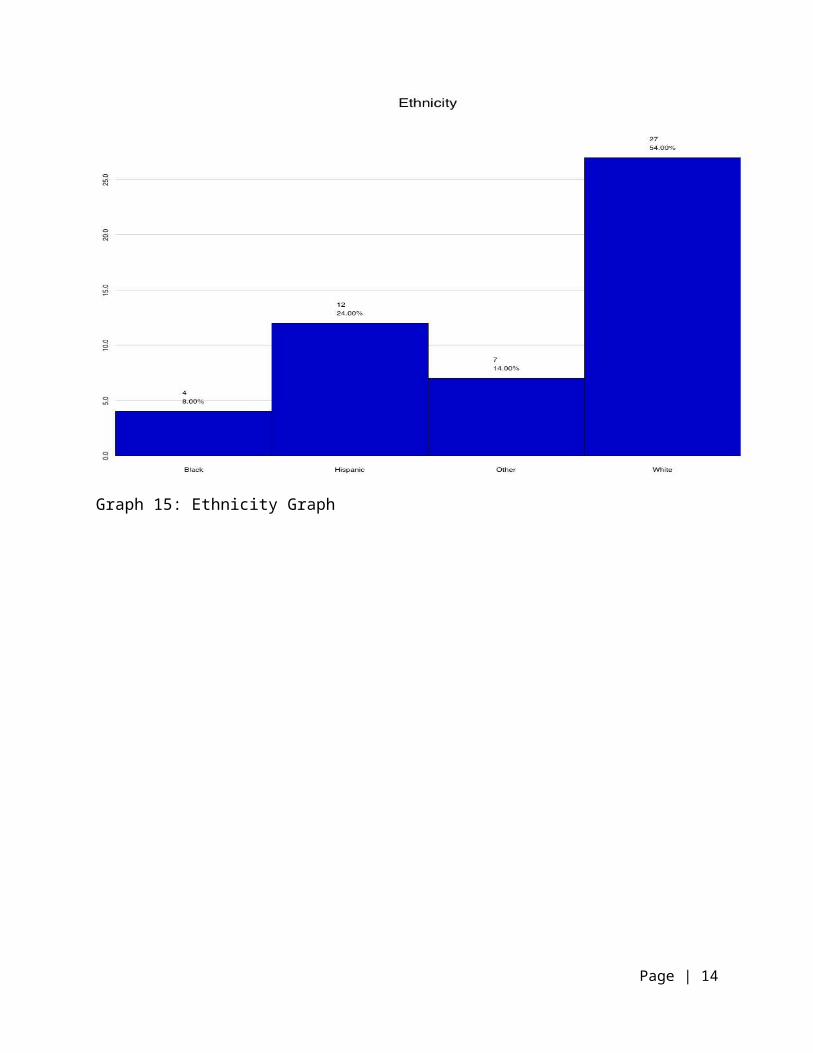
Graph 15: Ethnicity Graph
Page | 12
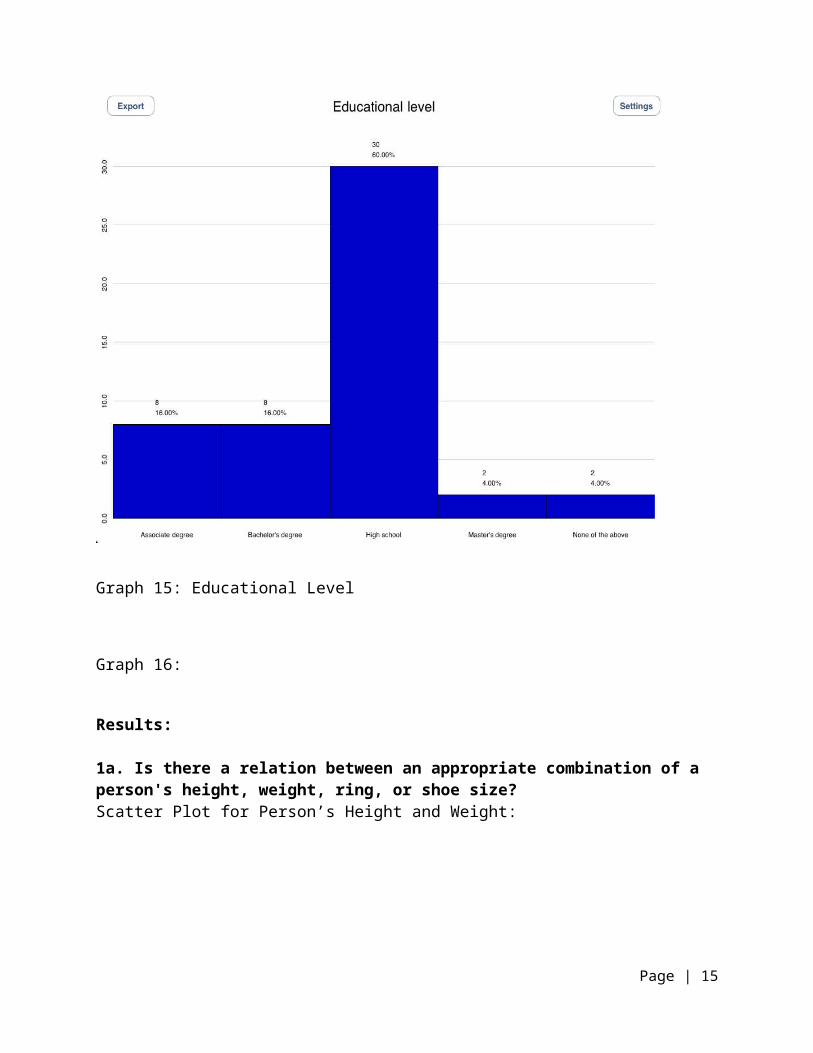
Graph 15: Educational Level
Graph 16:
Results:
1a. Is there a relation between an appropriate combination of a person's height, weight, ring, or shoe size?Scatter Plot for Person’s Height and Weight:
Page | 13
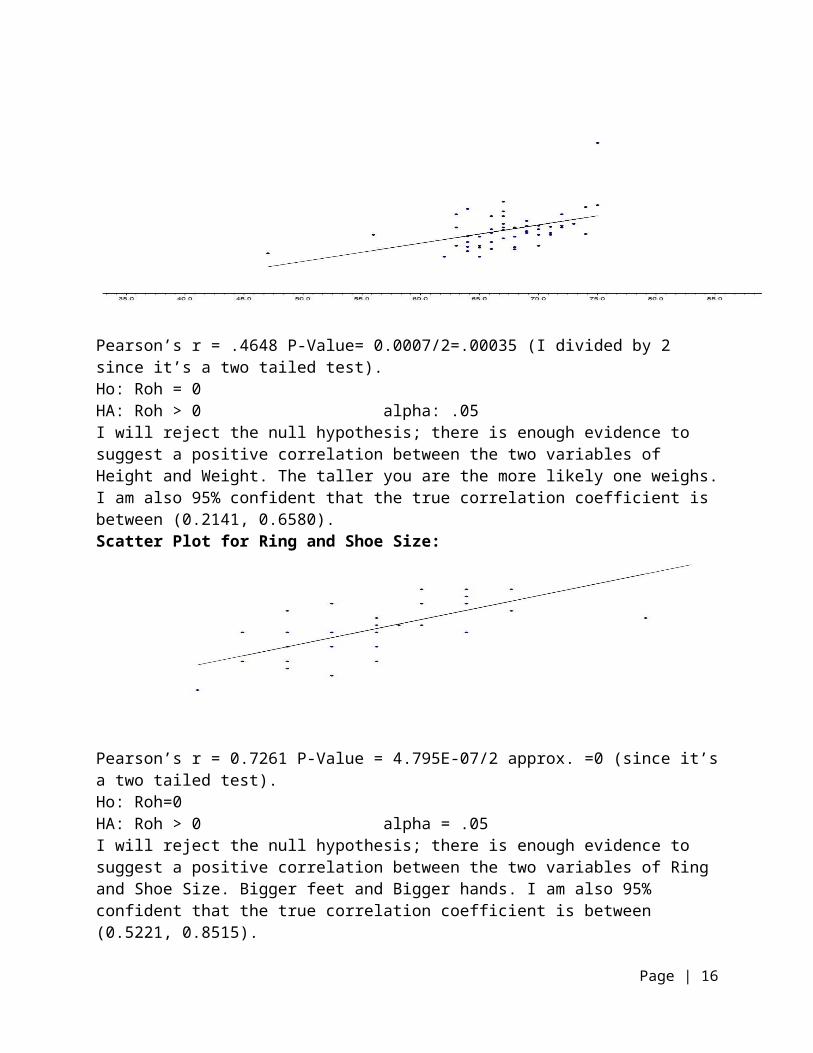
Pearson’s r = .4648 P-Value= 0.0007/2=.00035 (I divided by 2 since it’s a two tailed test).Ho: Roh = 0HA: Roh > 0 alpha: .05I will reject the null hypothesis; there is enough evidence to suggest a positive correlation between the two variables of Height and Weight. The taller you are the more likely one weighs. I am also 95% confident that the true correlation coefficient is between (0.2141, 0.6580).Scatter Plot for Ring and Shoe Size:
Pearson’s r = 0.7261 P-Value = 4.795E-07/2 approx. =0 (since it’s a two tailed test).Ho: Roh=0HA: Roh > 0 alpha = .05I will reject the null hypothesis; there is enough evidence to suggest a positive correlation between the two variables of Ring and Shoe Size. Bigger feet and Bigger hands. I am also 95% confident that the true correlation coefficient is between (0.5221, 0.8515).
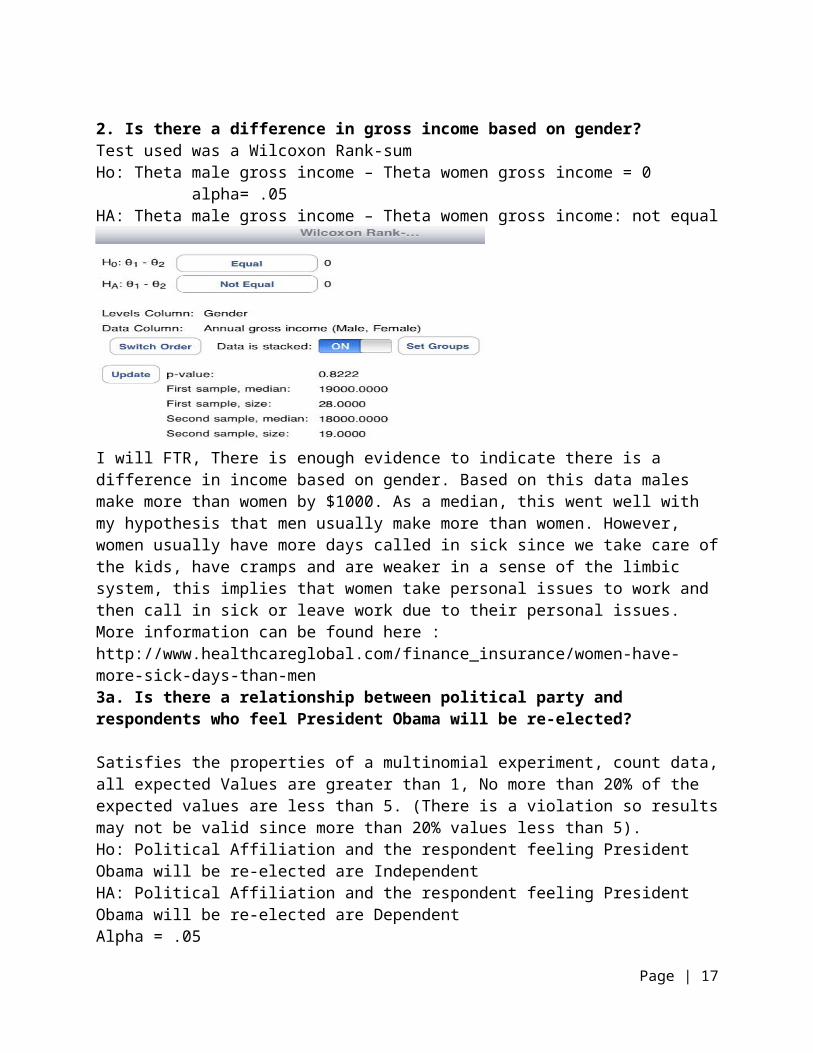
2. Is there a difference in gross income based on gender? Test used was a Wilcoxon Rank-sumHo: Theta male gross income – Theta women gross income = 0 alpha= .05HA: Theta male gross income – Theta women gross income: not equal
Page | 14
I will FTR, There is enough evidence to indicate there is a difference in income based on gender. Based on this data males make more than women by $1000. As a median, this went well with my hypothesis that men usually make more than women. However, women usually have more days called in sick since we take care of the kids, have cramps and are weaker in a sense of the limbic system, this implies that women take personal issues to work and then call in sick or leave work due to their personal issues. More information can be found here : http://www.healthcareglobal.com/finance_insurance/women-have-more-sick-days-than-men3a. Is there a relationship between political party and respondents who feel President Obama will be re-elected?
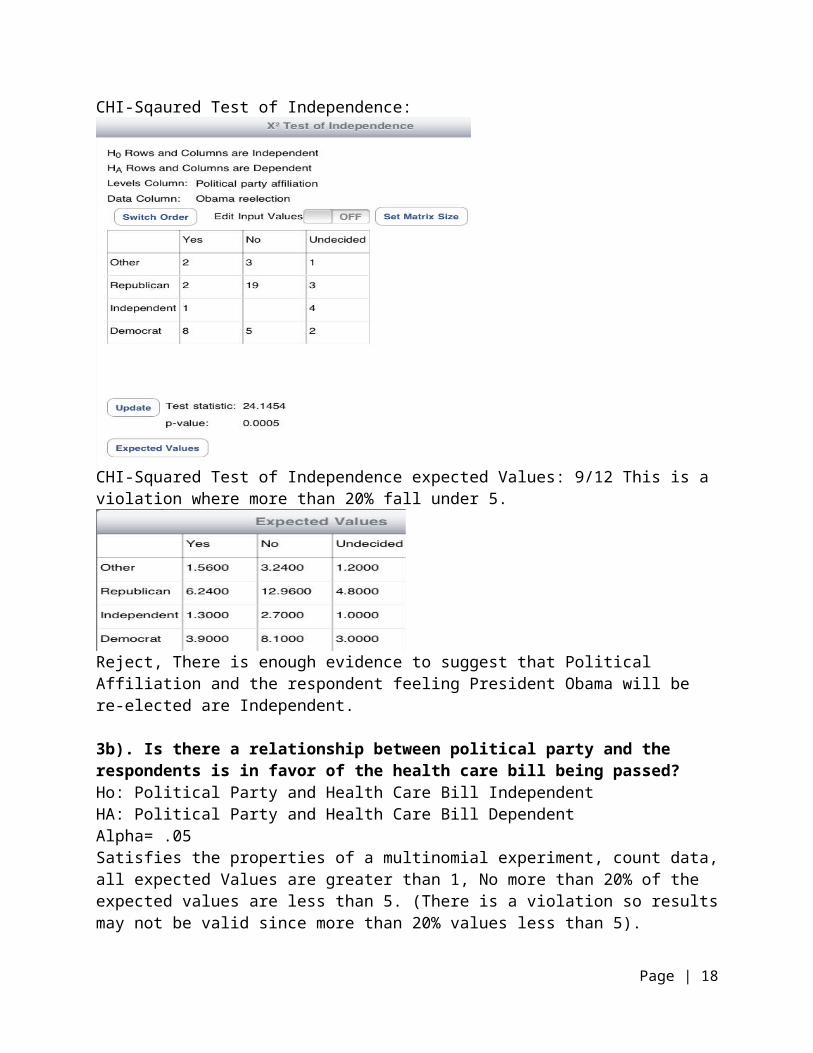
Satisfies the properties of a multinomial experiment, count data, all expected Values are greater than 1, No more than 20% of the expected values are less than 5. (There is a violation so results may not be valid since more than 20% values less than 5).Ho: Political Affiliation and the respondent feeling President Obama will be re-elected are IndependentHA: Political Affiliation and the respondent feeling President Obama will be re-elected are DependentAlpha = .05CHI-Sqaured Test of Independence:
Page | 15
CHI-Squared Test of Independence expected Values: 9/12 This is a violation where more than 20% fall under 5.
Reject, There is enough evidence to suggest that Political Affiliation and the respondent feeling President Obama will be re-elected are Independent.
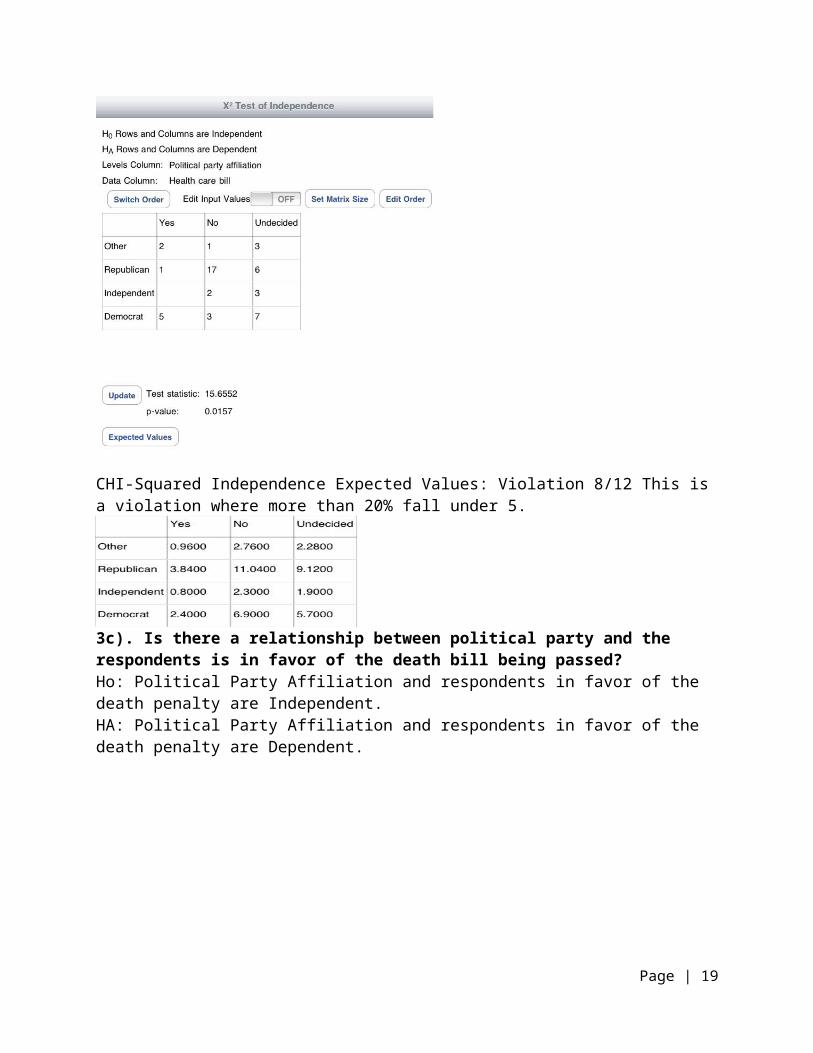
3b). Is there a relationship between political party and the respondents is in favor of the health care bill being passed?Ho: Political Party and Health Care Bill IndependentHA: Political Party and Health Care Bill DependentAlpha= .05Satisfies the properties of a multinomial experiment, count data, all expected Values are greater than 1, No more than 20% of the expected values are less than 5. (There is a violation so results may not be valid since more than 20% values less than 5).
Page | 16
CHI-Squared Independence Expected Values: Violation 8/12 This is a violation where more than 20% fall under 5.
3c). Is there a relationship between political party and the respondents is in favor of the death bill being passed?Ho: Political Party Affiliation and respondents in favor of the death penalty are Independent.HA: Political Party Affiliation and respondents in favor of the death penalty are Dependent.
Page | 17
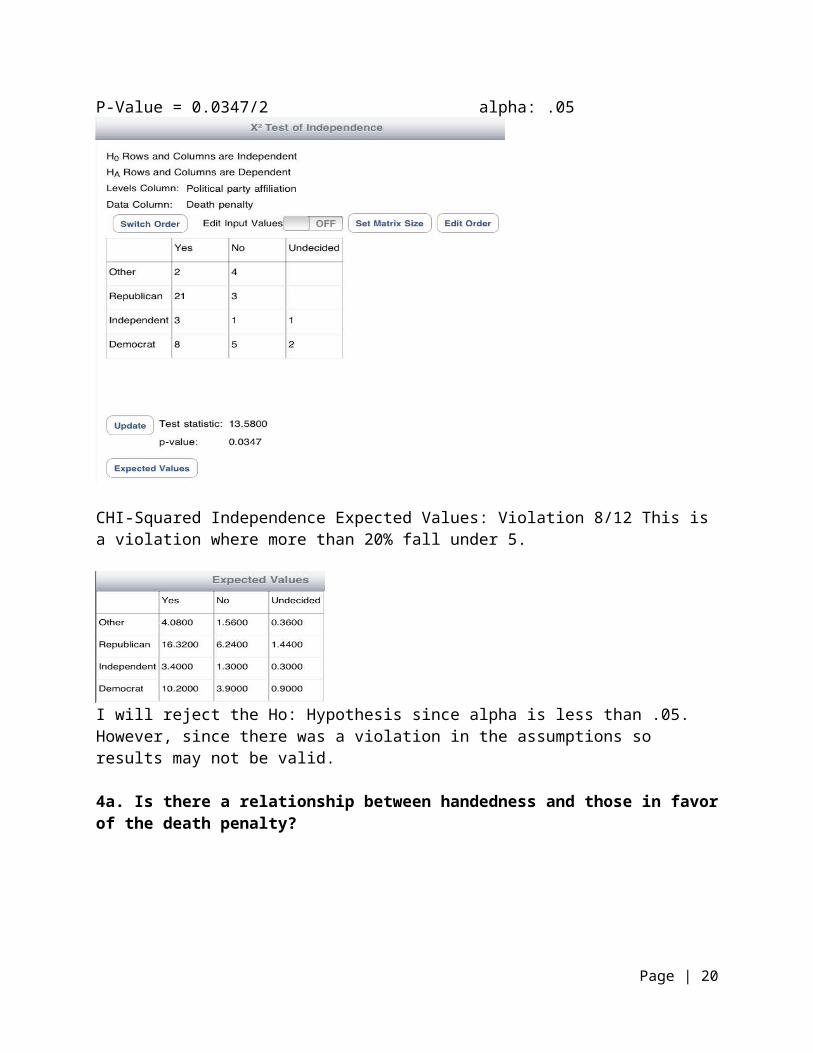
P-Value = 0.0347/2 alpha: .05
CHI-Squared Independence Expected Values: Violation 8/12 This is a violation where more than 20% fall under 5.
I will reject the Ho: Hypothesis since alpha is less than .05. However, since there was a violation in the assumptions so results may not be valid.
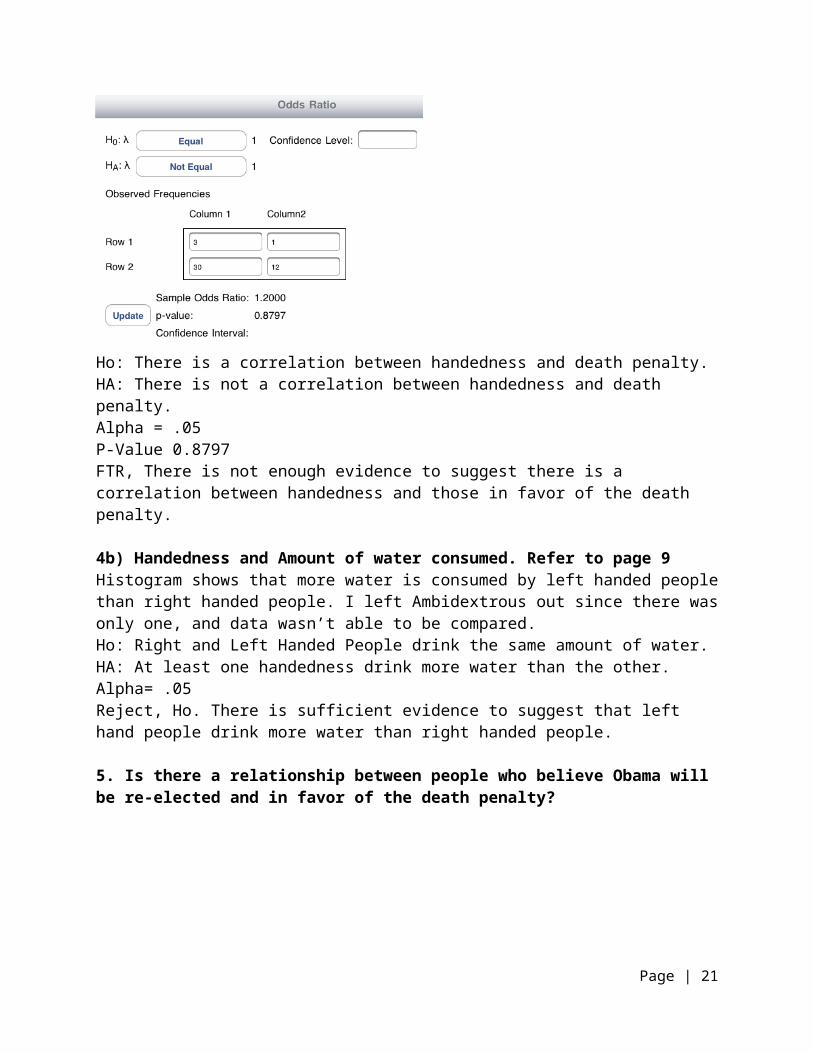
4a. Is there a relationship between handedness and those in favor of the death penalty?
Page | 18
Ho: There is a correlation between handedness and death penalty.HA: There is not a correlation between handedness and death penalty. Alpha = .05P-Value 0.8797FTR, There is not enough evidence to suggest there is a correlation between handedness and those in favor of the death penalty.
4b) Handedness and Amount of water consumed. Refer to page 9Histogram shows that more water is consumed by left handed people than right handed people. I left Ambidextrous out since there was only one, and data wasn’t able to be compared.Ho: Right and Left Handed People drink the same amount of water.HA: At least one handedness drink more water than the other.Alpha= .05Reject, Ho. There is sufficient evidence to suggest that left hand people drink more water than right handed people.
5. Is there a relationship between people who believe Obama will be re-elected and in favor of the death penalty?
Page | 19
Violation of assumption where more than 20% fall under 5. (5/12)=.4166
Ho: People who believe Obama will be reelected and those in favor of the death penalty are IndependentHA: People who believe Obama will be reelected and those in favor of the death penalty are DependentAlpha= .05FTR, there enough evidence to suggest People who believe Obama will be reelected and those in favor of the death penalty are Independent. However, a violation in the assumptions since more than 20% fall under 5 in the expected values. This implies that results may not be valid.
6. Which ethnicity from my sample size makes has a higher Annual Income?
Ho: Theta Whites=Theta Blacks=Theta Hispanics=Theta Other
Page | 20
HA: at least one is not equalAlpha: .05Reject, There is evidence to suggest that one ethnicity makes more than the other ethnicities.
Discussion: I have learned that many of my hypotheses were not accurate; Many of the assumptions were violated also the data collected may not be accurate as far as honesty answers. Although participants were randomly selected the major variable is the participants were most likely persons who were convenient to contact. Further the answers may be biased based on the participant’s level of conformability with giving truthful answers when their identity is known to the person asking the questions. In the future a questionnaire it will have less bias information acquired if we used a more anonymous tactic, rather asking personal questions that a person might not want to discuss openly. On the other hand, a person being biased toward certain believes, might also be racist. Much information was based on sources regarding an African decent president. http://abcnews.go.com/WN/Obama/racism-obamas-america-year/story?id=9638178
Appendix:I was able to photo paste and crop all my statistical data. Question 1: Scatter plots were a linear graph so I chose the Pearson’s Values. This concludes that there is a positive correlation between a person’s height and weight, and in ring size and shoe size. Question 2: Wilcoxon Rank-sum test was used since there was a violation in the normal plot. This indicated the difference in Annual Gross Income based on gender. Question 3: CHI-Squared Test of Independence for the variables in the question. I have rejected most of the Null Hypothesis, however due to some violations in the assumptions results may not be accurate. Question 4: I decided to use an odds ratio test since I only had one ambidextrous person in my sample, so my results turned out to be FTR, There is not enough evidence to suggest there is a correlation between handedness and those in favor of the death penalty. Question 5: People whom believe Obama will be relected and those in favor of the death penalty. In this analysis I found that 23 people of my 50 where both in favor. So there is a not that much of a correlation between the two.Question 6: This was reasonably easy to figure, however since the majority of my sample were whites and more complex and different tactic experiment might show otherwise. Whites had more people employed and more of the ethnicity had a higher education which would solve why they make more.
Page | 21