statistics on company winding up and bankruptcy petition ...
18
Statistics on company winding up and bankruptcy petitions issued in the High Court and county courts of England and Wales – third quarter 2010 Ministry of Justice Statistics bulletin Published: 11 November 2010
Transcript of statistics on company winding up and bankruptcy petition ...

Statistics on company winding up and bankruptcy petitions issued in the High Court and county courts of England and Wales – third quarter 2010 Ministry of Justice Statistics bulletin
Published: 11 November 2010

Contents
Introduction 1
Findings 4
Recent developments 6
Tables 7
Explanatory notes 14
Introduction
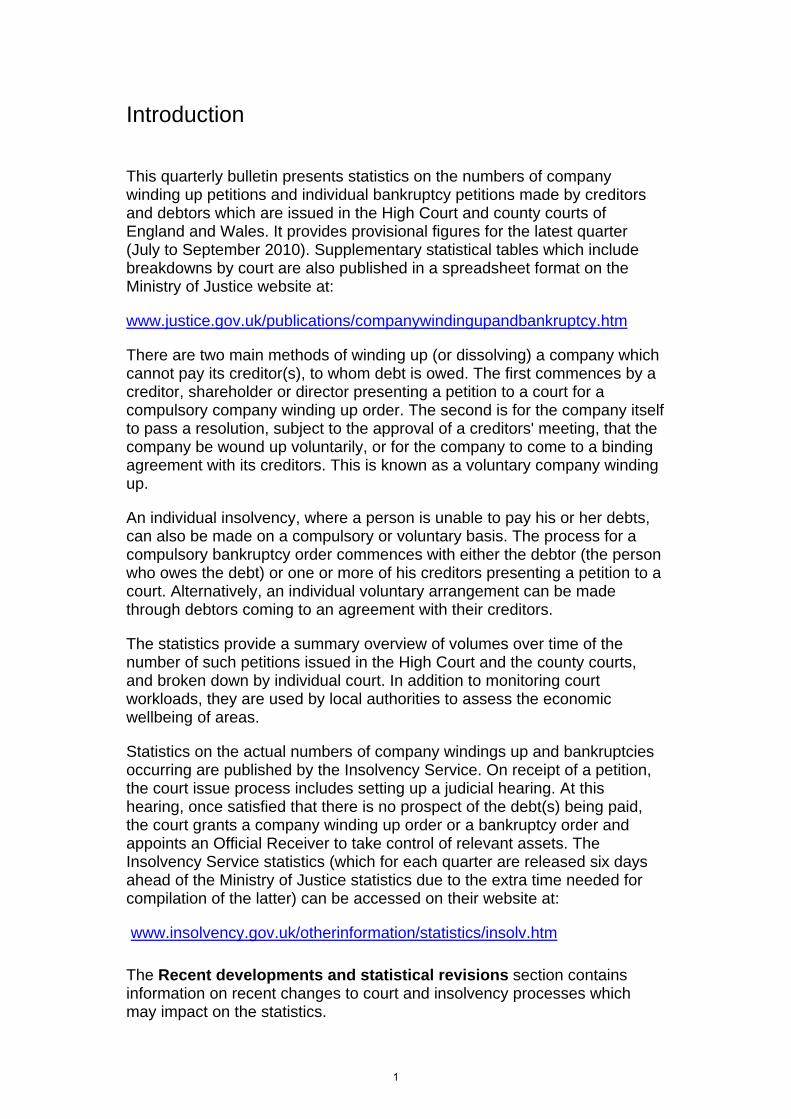
This quarterly bulletin presents statistics on the numbers of company winding up petitions and individual bankruptcy petitions made by creditors and debtors which are issued in the High Court and county courts of England and Wales. It provides provisional figures for the latest quarter (July to September 2010). Supplementary statistical tables which include breakdowns by court are also published in a spreadsheet format on the Ministry of Justice website at:
www.justice.gov.uk/publications/companywindingupandbankruptcy.htm
There are two main methods of winding up (or dissolving) a company which cannot pay its creditor(s), to whom debt is owed. The first commences by a creditor, shareholder or director presenting a petition to a court for a compulsory company winding up order. The second is for the company itself to pass a resolution, subject to the approval of a creditors' meeting, that the company be wound up voluntarily, or for the company to come to a binding agreement with its creditors. This is known as a voluntary company winding up.
An individual insolvency, where a person is unable to pay his or her debts, can also be made on a compulsory or voluntary basis. The process for a compulsory bankruptcy order commences with either the debtor (the person who owes the debt) or one or more of his creditors presenting a petition to a court. Alternatively, an individual voluntary arrangement can be made through debtors coming to an agreement with their creditors.
The statistics provide a summary overview of volumes over time of the number of such petitions issued in the High Court and the county courts, and broken down by individual court. In addition to monitoring court workloads, they are used by local authorities to assess the economic wellbeing of areas.
Statistics on the actual numbers of company windings up and bankruptcies occurring are published by the Insolvency Service. On receipt of a petition, the court issue process includes setting up a judicial hearing. At this hearing, once satisfied that there is no prospect of the debt(s) being paid, the court grants a company winding up order or a bankruptcy order and appoints an Official Receiver to take control of relevant assets. The Insolvency Service statistics (which for each quarter are released six days ahead of the Ministry of Justice statistics due to the extra time needed for compilation of the latter) can be accessed on their website at:
www.insolvency.gov.uk/otherinformation/statistics/insolv.htm
The Recent developments and statistical revisions section contains information on recent changes to court and insolvency processes which may impact on the statistics.
1

The Explanatory notes section provides further information about the statistics, how they were compiled, and the symbols and conventions used in the bulletin. If you have any feedback or questions about this statistical bulletin, or requests for further information, please direct them to the appropriate contact provided at the end of this report.
The High Court and county courts of England and Wales also process many other types of cases. These include other types of civil law matters such as those relating to debt, personal injury and possession, as well as those relating to family matters such as divorce, parental disputes and the protection of children. The Ministry of Justice also publishes several other related statistical publications which include statistics on activity in the courts:
The quarterly bulletin “Mortgage and landlord possession statistics” provides detailed data on the number of such county court cases and is published at the same time as this bulletin:
www.justice.gov.uk/publications/mortgatelandlordpossession.htm
The statistical bulletins “Court Statistics Quarterly” and “Judicial and Court Statistics” provide data on all civil and family law cases dealt with in the county courts on a quarterly basis and in the High Court and county courts on a calendar year basis respectively:
www.justice.gov.uk/publications/courtstatisticsquarterly.htm
www.justice.gov.uk/publications/judicialandcourtstatistics.htm
2

Findings
The analysis in this report mainly consists of comparisons made between the latest quarter with the previous quarter and with the equivalent quarter of the previous year. Seasonal variations affecting the workload of the courts may impact on comparisons between periods; however the statistics are not seasonally adjusted.
The main findings (figures available in Tables 1, 2 and 3) are as follows:
The number of company winding up petitions issued for dissolving a company that cannot pay its debts has averaged around 3,000 per quarter in each of the last five years. In the third quarter of 2010, 2,801 were issued, a decrease of 10 per cent on the same quarter of 2009 and an increase of 6 per cent on the previous quarter.
The number of individual bankruptcy petitions made by creditors (the person to whom the debt is owed) has generally fallen since 2006. In the third quarter of 2010, 4,455 were issued, a decrease of 15 per cent on the same quarter of 2009 and a fall of 1 per cent compared to the previous quarter.
The number of individual bankruptcy petitions made by debtors (the person who owes the debt) has generally been on an upward trend between 2000 and 2009, rising five fold over this time. However there were 11,959 such petitions in the third quarter of 2010, a decrease of 26 per cent on the same quarter of 2009 and an 8 per cent decrease on the previous quarter.
Figure 1: Company winding up and individual bankruptcy petitions issued – England & Wales, 1990 to 2010 Q3 (Jul-Sep)
0
2,000
4,000
6,000
8,000
10,000
12,000
14,000
16,000
18,000
1990 1992 1994 1996 1998 2000 2002 2004 2006 2008 2010
Company Winding Up Creditors Bankruptcies Debtors Bankruptcies
3

The 10 per cent fall in company winding up petitions compared to the same quarter in 2009 reflected at HMCS region level:
falls in North East England (31 per cent), the Midlands (19 per cent) and London (13 per cent)
rises in South East England excluding London (58 per cent), Wales (46 per cent), North West England (23 per cent) and South West England (19 per cent).
Although the percentage rises in South East England (excluding London) and Wales were particularly large, they still only accounted for 6 per cent of company winding up petitions
The 15 per cent decrease in bankruptcy petitions made by creditors compared with the second quarter of 2009 reflected at HMCS region level:
falls in London (30 per cent), South East England excluding London (12 percent), North East (11 per cent), Wales (11 per cent), and South West England (5 per cent),
rises in North West England (14 per cent) and the Midlands (13 per cent).
The 26 per cent fall in bankruptcy petitions made by debtors compared with the same quarter of 2009 reflected fairly similar decreases across all HMCS regions. The greatest fall was in South West England (33 per cent) followed by London (32 per cent), the Midlands (26 per cent), South East England excluding London (25 per cent), North East England (24 per cent), Wales (24 per cent) and North West England (21 per cent).
4

Recent developments
Increase in fees
Fees relating to The Official Receiver’s Deposit towards the costs of administering insolvency cases increased on 6th April 2010; for debtors’ bankruptcy petitions from £360 to £450, creditors’ bankruptcy petitions from £430 to £600, and company winding up petitions from £715 to £1,000. This created an incentive for companies and individuals to present petitions to the courts before 6th April and may therefore have resulted in an increased number of petitions being made in Q1 of 2010 and a decreased number of petitions being made in Q2 and Q3.
Introduction of Debt Relief Orders
Debt Relief Orders (DROs) were introduced on 6 April 2009 through the Tribunals, Courts and Enforcement Act 2007. DROs provide debt relief, subject to some restrictions, and are suitable for people domiciled in England and Wales who do not own their own home, have little surplus income (no more than £50 a month), assets (other than possibly a car) not exceeding £300, and less than £15,000 of debt. As DROs offer an alternative route into personal insolvency, they are likely to have had a downward impact on the number of bankruptcies
5

Table 1: Company winding up and individual bankruptcy petitions issued in the High Court and county courts of England and Wales, 1995-2010 Q3 (Jul-Sep)
c
Year Quarter
Companies winding-up
petitions
Creditors bankruptcy
petitions
Debtors bankruptcy
petitions1995 12,757 23,765 10,1391996 11,980 21,268 10,6891997 11,158 19,543 9,6361998 11,771 17,755 10,3801999 11,315 17,496 12,3932000 11,028 17,220 12,7572001 10,265 15,571 14,9842002 12,634 16,330 16,5072003 10,146 17,258 19,3232004 10,006 17,459 26,7762005 12,099 20,777 36,8972006 12,108 20,891 52,6782007 11,676 19,987 53,0802008 12,559 20,678 55,6632009 12,419 18,852 62,864 2006 Q1 3,151 5,615 13,843 Q2 2,775 4,966 12,811 Q3 2,878 5,107 12,950 Q4 3,304 5,203 13,074
2007 Q1 3,302 5,712 15,127 Q2 2,643 4,770 13,502 Q3 2,859 4,938 12,772 Q4 2,872 4,567 11,679
2008 Q1 3,054 4,771 12,985Q2 2,927 5,655 13,565Q3 3,196 5,539 13,749
Q4 3,382 4,713 15,364
2009 Q1 3,461 4,535 16,775Q2 3,187 4,955 16,145Q3 3,101 5,214 16,266Q4 2,670 4,148 13,678
2010 Q1 2,777 4,510 16,383Q2 2,635 4,494 13,004Q3 2,801 (p) 4,455 (p) 11,959 (p)
Notes:
Figures denoted by (p) are provisional data
Figures in this table are not seasonally adjusted. Care should be taken when drawing comparisons between periods that do not
over the same parts of the year, as any difference may in part be a result of seasonal effects
6

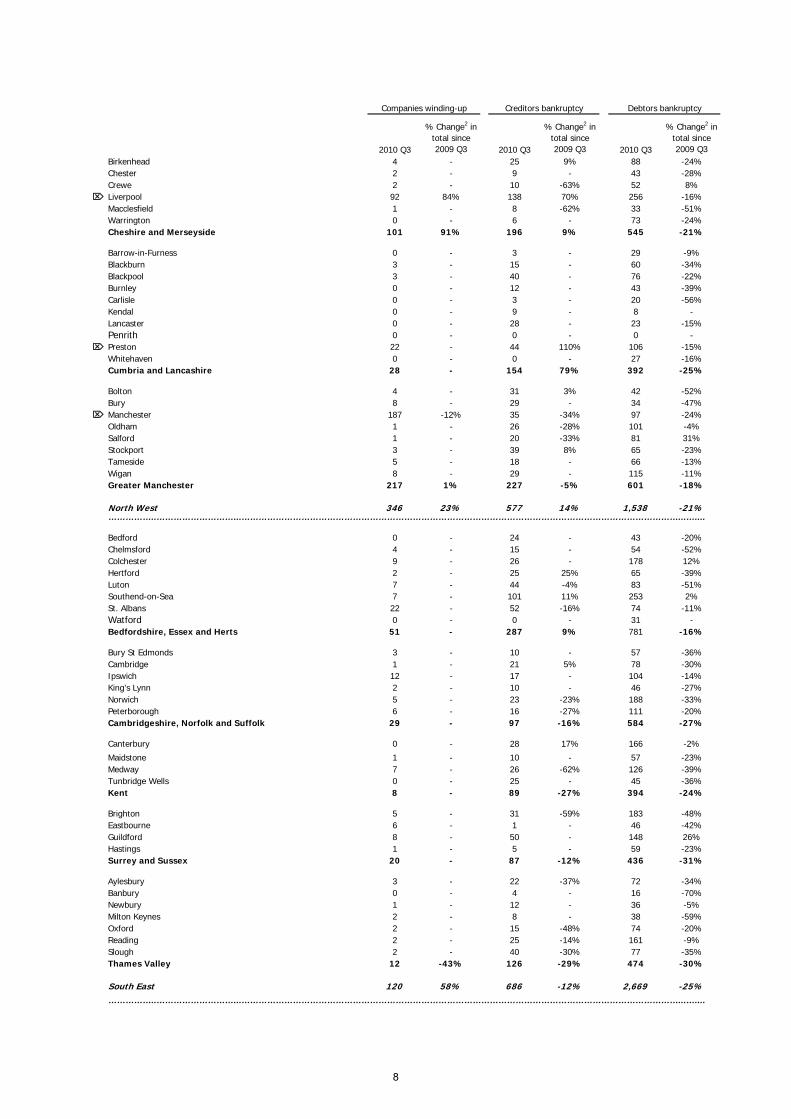
Table 2: Company winding up and individual bankruptcy petitions issued in the High Court and county courts of England and Wales, HMCS regions and HMCS areas, 2010 Q3 (Jul-Sep)
2010 Q3
% Change2 in total since 2009 Q3 2010 Q3
% Change2 in total since 2009 Q3 2010 Q3
% Chtotal s20
Croydon 11 - 160 86% 236 -Kingston-upon-Thames 9 - 71 103% 109 -Romford 9 - 64 -21% 91 -London County Court Group 29 - 295 46% 436 -
Royal Courts of Justice
ange2 in ince
09 Q3
32%10%33%28%
1 1,488 -15% 1,374 -37% 621 -
London 1,517 -13% 1,669 -30% 1,057 -……………..………………………...………………………………………………………………………………………………………………………………………...
Birmingham 234 -32% 94 -33% 291 -Coventry 3 - 25 -19% 143 -Warwick 3 - 6 - 41 -Birmingham, Coventry, Solihull and Warwickshire 240 -32% 125 -30% 475 -
Burton-on-Trent 0 - 10 - 53 -Dudley 0 - 13 - 51 -Hereford 3 - 10 - 52 -Kidderminster 1 - 15 - 37 -Shrewsbury 2 - 15 - 79 -Stafford 2 - 8 - 27 -Stoke-on-Trent 6 - 53 - 122 -Stourbridge 2 - 12 - 36 -Walsall 5 - 29 -29% 132 -Wolverhampton 2 - 11 -50% 66 -Worcester 5 - 20 -20% 71 -Black Country, Staffordshire and West Mercia 28 - 196 9% 726 -
Chesterfield 1 - 26 - 68 -Derby 11 - 28 -13% 120 -Nottingham 11 - 92 163% 349Derbyshire and Nottinghamshire 23 - 146 80% 537 -
Boston 2 - 13 -46% 90 -Leicester 16 - 79 119% 175 -Lincoln 0 - 31 35% 153 -
Northampton 17 -19% 48 12% 169 -
Lincolnshire, Leicestershire, Rutland and Northamptonshire 35 21% 171 36% 587 -
Midlands 326 -19% 638 13% 2,325 -……………..………………………...………………………………………………………………………………………………………………………………………...Darlington 0 - 10 - 59 -
Durham 5 - 11 - 109 -Middlesborough 10 - 68 70% 123 -
Newcastle-upon-Tyne 29 -29% 66 20% 322 -Sunderland 0 - 13 - 87 -Cleveland, Durham and Northumbria 44 -4% 168 30% 700 -
Barnsley 0 - 4 - 46 -
Doncaster 3 - 9 -61% 79 -Gt Grimsby 2 - 5 - 66 -2Kingston-upon-Hull 5 - 14 - 143 -Scunthorpe 2 - 6 - 41
Sheffield 2 - 29 -46% 242 23
Humber and South Yorkshire 14 - 67 -46% 617 -
Bradford 2 - 14 -61% 111 -Dewsbury 2 - 21 - 64 -Halifax 2 - 12 -43% 59 44Harrogate 0 - 4 - 28 -Huddersfield 1 - 13 - 52 -
Leeds 221 -41% 17 -60% 106 -Scarborough 1 - 10 - 31 -Wakefield 3 - 32 28% 116 -York 5 - 28 - 82 -North and West Yorkshire 237 -37% 151 -16% 649 -
North East 295 -31% 386 -11% 1,966 -2……………..………………………...………………………………………………………………………………………………………………………………………...
Companies winding-up Creditors bankruptcy Debtors bankrupt
35%
32%…....
39%21%31%34%
58%9%17%31%25%36%19%29%31%35%58%35%
28%34%1%14%
2%3%6%
32%
14%
26%…....9%
22%26%38%33%31%
25%
35%4%
31%-9%
%
14%
31%31%
%48%39%12%62%2%10%23%
4%…....
cy
7
2010 Q3
% Change2 in total since 2009 Q3 2010 Q3
% Change2 in total since 2009 Q3 2010 Q3
% Change2 in total since 2009 Q3
Birkenhead 4 - 25 9% 88 -24%Chester 2 - 9 - 43 -28%Crewe 2 - 10 -63% 52 8%
Liverpool 92 84% 138 70% 256 -16%Macclesfield 1 - 8 -62% 33 -51%Warrington 0 - 6 - 73 -24%Cheshire and Merseyside 101 91% 196 9% 545 -21%
Barrow-in-Furness 0 - 3 - 29 -9%Blackburn 3 - 15 - 60 -34%Blackpool 3 - 40 - 76 -22%Burnley 0 - 12 - 43 -39%Carlisle 0 - 3 - 20 -56%Kendal 0 - 9 - 8 -Lancaster 0 - 28 - 23 -15%Penrith 0 - 0 - 0 -
Preston 22 - 44 110% 106 -15%Whitehaven 0 - 0 - 27 -16%Cumbria and Lancashire 28 - 154 79% 392 -25%
Bolton 4 - 31 3% 42 -52%Bury 8 - 29 - 34 -47%
Manchester 187 -12% 35 -34% 97 -24%Oldham 1 - 26 -28% 101 -4%Salford 1 - 20 -33% 81 31%Stockport 3 - 39 8% 65 -23%Tameside 5 - 18 - 66 -13%Wigan 8 - 29 - 115 -11%Greater Manchester 217 1% 227 -5% 601 -18%
North West 346 23% 577 14% 1,538 -21%……………..………………………...………………………………………………………………………………………………………………………………………...…....
Bedford 0 - 24 - 43 -20%Chelmsford 4 - 15 - 54 -52%Colchester 9 - 26 - 178 12%Hertford 2 - 25 25% 65 -39%Luton 7 - 44 -4% 83 -51%Southend-on-Sea 7 - 101 11% 253 2%St. Albans 22 - 52 -16% 74 -11%Watford 0 - 0 - 31 -Bedfordshire, Essex and Herts 51 - 287 9% 781 -16%
Bury St Edmonds 3 - 10 - 57 -36%Cambridge 1 - 21 5% 78 -30%Ipswich 12 - 17 - 104 -14%King's Lynn 2 - 10 - 46 -27%Norwich 5 - 23 -23% 188 -33%Peterborough 6 - 16 -27% 111 -20%Cambridgeshire, Norfolk and Suffolk 29 - 97 -16% 584 -27%
Canterbury 0 - 28 17% 166 -2%
Maidstone 1 - 10 - 57 -23%Medway 7 - 26 -62% 126 -39%Tunbridge Wells 0 - 25 - 45 -36%Kent 8 - 89 -27% 394 -24%
Brighton 5 - 31 -59% 183 -48%Eastbourne 6 - 1 - 46 -42%Guildford 8 - 50 - 148 26%Hastings 1 - 5 - 59 -23%Surrey and Sussex 20 - 87 -12% 436 -31%
Aylesbury 3 - 22 -37% 72 -34%Banbury 0 - 4 - 16 -70%Newbury 1 - 12 - 36 -5%Milton Keynes 2 - 8 - 38 -59%Oxford 2 - 15 -48% 74 -20%Reading 2 - 25 -14% 161 -9%Slough 2 - 40 -30% 77 -35%Thames Valley 12 -43% 126 -29% 474 -30%
South East 120 58% 686 -12% 2,669 -25%……………..………………………...………………………………………………………………………………………………………………………………………...…....
Companies winding-up Creditors bankruptcy Debtors bankruptcy
8

2010 Q3
% Change2 in total since 2009 Q3 2010 Q3
% Change2 in total since 2009 Q3 2010 Q3
% Change2 in total since 2009 Q3
Bath 8 - 17 - 101 -19% Bristol 76 -31% 29 -55% 260 -40%
Taunton 6 - 15 - 81 25%
Yeovil 2 - 13 - 72 -24%Avon & Somerset 92 -19% 74 -30% 514 -28%
Barnstaple 3 - 10 - 51 -32%Exeter 0 - 9 -63% 84 -34%Plymouth 12 - 28 - 97 -49%Torquay 1 - 5 - 80 -38%Truro 6 - 16 -33% 146 -31%Devon & Cornwall 22 - 68 -14% 458 -38%
Bournemouth 17 - 32 -27% 139 -41%Cheltenham 0 - 0 - 0 -100%Gloucester 1 - 20 - 119 13%Salisbury 0 - 4 - 33 -34%Swindon 4 - 17 - 91 -29%Weymouth 1 - 6 - 44 -41%Dorset, Gloucestershire and Wiltshire 23 - 79 -8% 426 -35%
Newport (I.O.W.) 2 - 7 - 39 -30%Portsmouth 9 - 44 57% 128 -24%Southampton 8 - 34 70% 104 -38%Winchester 0 - 6 - 12 -60%Hampshire & Isle of Wight 19 - 91 60% 283 -33%
South West 156 19% 312 -5% 1,681 -33%……………..………………………...………………………………………………………………………………………………………………………………………...…....
Aberystwyth 0 - 2 - 6 -
Carmarthen 0 - 4 - 20 -Haverfordwest 0 - 8 - 30 -3%Neath & Port Talbot 0 - 3 - 33 -41%Swansea 4 - 28 0% 67 -26%Welshpool & Newton 0 - 8 - 22 0%Mid and West Wales 4 - 53 10% 178 -19%
-Caernarfon 0 - 10 - 35 -5%Llangefni 0 - 0 - 4 -Mold 0 - 6 - 33 -35%Rhyl 0 - 16 - 47 -11%Wrexham 3 - 25 - 67 43%North Wales 3 - 57 104% 186 -8%
Aberdare 1 - 4 - 17 -78%
Blackwood 0 - 6 - 35 -Bridgend 1 - 7 - 46 -28%
Cardiff 31 - 42 -52% 97 -8%Merthyr Tydfil 0 - 3 - 22 10%Newport (Gwent) 1 - 8 -65% 85 -56%Pontypridd 0 - 7 - 57 0%South East Wales 34 - 77 -43% 359 -32%
Wales 41 46% 187 -11% 723 -24%
……………..………………………...………………………………………………………………………………………………………………………………………...…....
England & Wales 2,801 -10% 4,455 -15% 11,959 -26%
Provincial High Court Centre1 The Royal Courts of Justice located in Central London, is the headquarters of the High Court. The Court has nationwide jurisdiction but handles a
particularly large proportion of the insolvency work originating in London, and is therefore included in the London regional total.2 The percentage change figures shown in this table reflect, where necessary, revised data for earlier years. They may therefore not be consistent
ago is fewer than 20.3 Figures in this table are not seasonally adjusted
with previously published data for these earlier time periods. Percentages are not shown where the number of petitions in the same quarter a year
Companies winding-up Creditors bankruptcy Debtors bankruptcy
9
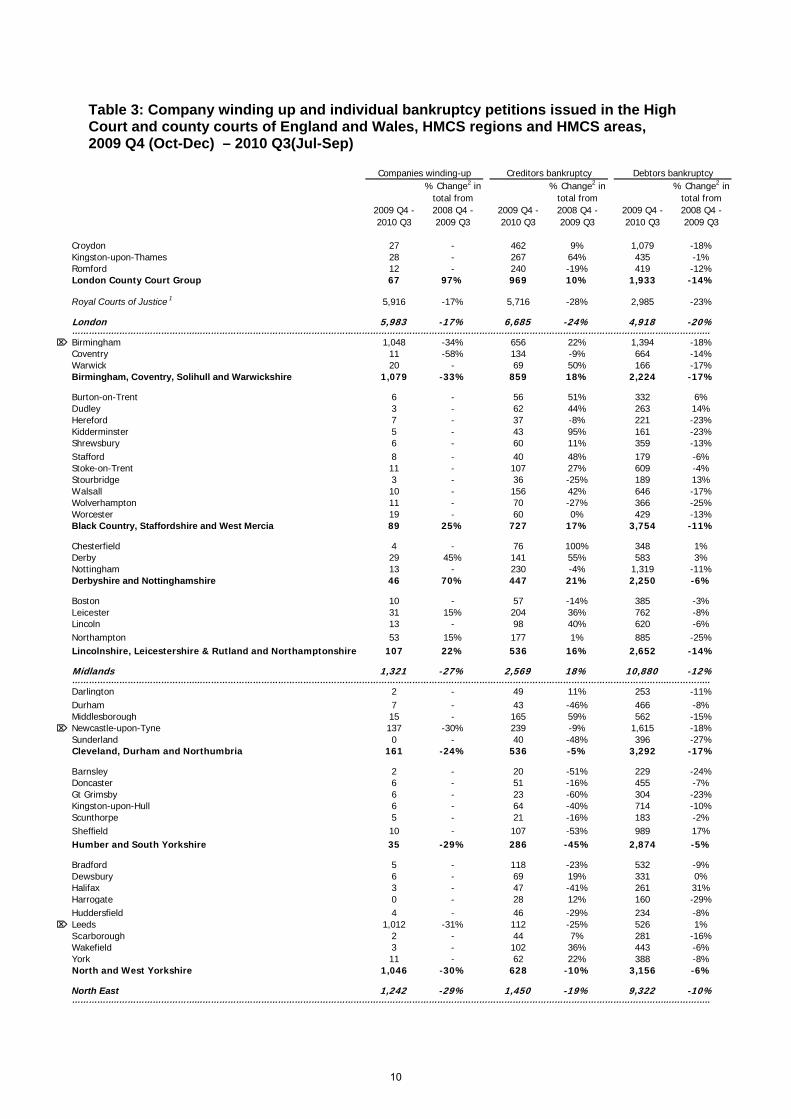
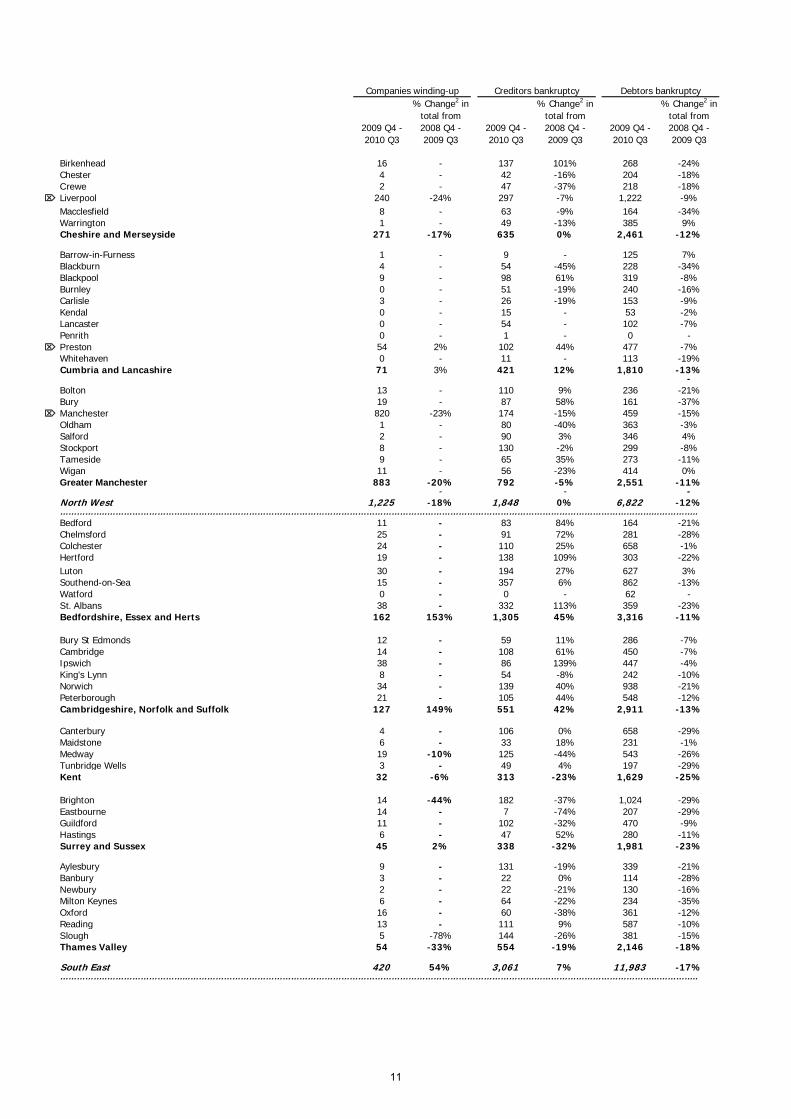
Table 3: Company winding up and individual bankruptcy petitions issued in the High Court and county courts of England and Wales, HMCS regions and HMCS areas, 2009 Q4 (Oct-Dec) – 2010 Q3(Jul-Sep)
2009 Q4 - 2010 Q3
% Change2 in total from 2008 Q4 - 2009 Q3
2009 Q4 - 2010 Q3
% Change2 in total from 2008 Q4 - 2009 Q3
2009 Q4 - 2010 Q3
% Change2 in total from 2008 Q4 - 2009 Q3
oydon 27 - 462 9% 1,079 -18%CrKingston-upon-Thames 28 - 267 64% 435 -1%
mford 12 - 240 -19% 419 -12%London County Court Group 67 97% 969 10% 1,933 -14%
yal Courts of Justice 1 5,916 -17% 5,716 -28% 2,985 -23%
do
Ro
Ro
Lon n 5,983 -17% 6,685 -24% 4,918 -20%……
Birmi………..………………………...…………………………………………………………………………………………………………………………………………………...…………..ngham 1,048 -34% 656 22% 1,394 -18%
ventry 11 -58% 134 -9% 664 -14%rwic
CoWa k 20 - 69 50% 166 -17%
rmingham, Coventry, Solihull and Warwickshire 1,079 -33% 859 18% 2,224 -17%
rton-on-Trent 6 - 56 51% 332 6%dley 3 - 62 44% 263 14%reford 7 - 37 -8% 221 -23%
dderminster 5 - 43 95% 161 -23%rewsbury 6 - 60 11% 359 -13%afford 8 - 40 48% 179 -6%oke-on-Trent 11 - 107 27% 609 -4%
Stourbrid
Bi
BuDuHeKiShStSt
ge 3 - 36 -25% 189 13%lsall 10 - 156 42% 646 -17%lverhampton 11 - 70 -27% 366 -25%rcester 19 - 60 0% 429 -13%
ack Country, Staffordshire and West Mercia 89 25% 727 17% 3,754 -11%
esterfield 4 - 76 100% 348 1%rby 29 45% 141 55% 583 3%ttin
WaWoWoBl
ChDeNo gham 13 - 230 -4% 1,319 -11%Derbyshire and Nottinghamshire 46 70% 447 21% 2,250 -6%
ston 10 - 57 -14% 385 -3%icester 31 15% 204 36% 762 -8%coln 13 - 98 40% 620 -6%rthampton 53 15% 177 1% 885 -25%
ncolnshire, Leicestershire & Rutland and Northamptonshire 107 22% 536 16% 2,652 -14%
Midland
BoLeLinNoLi
s 1,321 -27% 2,569 18% 10,880 -12%……Da
………..………………………...…………………………………………………………………………………………………………………………………………………...…………..rlington 2 - 49 11% 253 -11%ham 7 - 43 -46% 466 -8%dlesborou
DurMid gh 15 - 165 59% 562 -15%
wcastle-upon-Tyne 137 -30% 239 -9% 1,615 -18%nderland 0 - 40 -48% 396 -27%eveland, Durham and Northumbria 161 -24% 536 -5% 3,292 -17%
arnsley 2 - 20 -51% 229 -24%aster 6 - 51 -16% 455 -7%
Grimsby 6 - 23 -60% 304 -23%
NeSuCl
BDoncGtKingston-upon-Hull 6 - 64 -40% 714 -10%
unthorpe 5 - 21 -16% 183 -2%effield 10 - 107 -53% 989 17%mber and South Yorkshire 35 -29% 286 -45% 2,874 -5%
adford 5 - 118 -23% 532 -9%wsbury 6 - 69 19% 331 0%lifax 3 - 47 -41% 261 31%rro
ScSh
Hu
BrDeHaHa gate 0 - 28 12% 160 -29%
ddersfield 4 - 46 -29% 234 -8%eds 1,012 -31% 112 -25% 526 1%arborough 2 - 44 7% 281 -16%kefield 3 - 102 36% 443 -6%r
Hu Le
ScWaYo k 11 - 62 22% 388 -8%
rth and West Yorkshire 1,046 -30% 628 -10% 3,156 -6%
rth East 1,24
No
No 2 -29% 1,450 -19% 9,322 -10%……………..………………………...…………………………………………………………………………………………………………………………………………………...…………..
Companies winding-up Creditors bankruptcy Debtors bankruptcy
10
Companies winding-up Creditors bankruptcy Debtors bankruptcy
2009 Q4 - 2010 Q3
% Change2 in total from 2008 Q4 - 2009 Q3
2009 Q4 - 2010 Q3
% Change2 in total from 2008 Q4 - 2009 Q3
2009 Q4 - 2010 Q3
% Change2 in total from 2008 Q4 - 2009 Q3
Birkenhead 16 - 137 101% 268 -24%Chester 4 - 42 -16% 204 -18%Crewe 2 - 47 -37% 218 -18%
Liverpool 240 -24% 297 -7% 1,222 -9%Macclesfield 8 - 63 -9% 164 -34%Warrington 1 - 49 -13% 385 9%Cheshire and Merseyside 271 -17% 635 0% 2,461 -12%
Barrow-in-Furness 1 - 9 - 125 7%Blackburn 4 - 54 -45% 228 -34%Blackpool 9 - 98 61% 319 -8%Burnley 0 - 51 -19% 240 -16%Carlisle 3 - 26 -19% 153 -9%Kendal 0 - 15 - 53 -2%Lancaster 0 - 54 - 102 -7%Penrith 0 - 1 - 0 -
Preston 54 2% 102 44% 477 -7%Whitehaven 0 - 11 - 113 -19%Cumbria and Lancashire 71 3% 421 12% 1,810 -13%
-Bolton 13 - 110 9% 236 -21%Bury 19 - 87 58% 161 -37%
Manchester 820 -23% 174 -15% 459 -15%Oldham 1 - 80 -40% 363 -3%Salford 2 - 90 3% 346 4%Stockport 8 - 130 -2% 299 -8%Tameside 9 - 65 35% 273 -11%Wigan 11 - 56 -23% 414 0%Greater Manchester 883 -20% 792 -5% 2,551 -11%
- - -North West 1,225 -18% 1,848 0% 6,822 -12%……………..………………………...…………………………………………………………………………………………………………………………………………………...…………..Bedford 11 - 83 84% 164 -21%Chelmsford 25 - 91 72% 281 -28%Colchester 24 - 110 25% 658 -1%Hertford 19 - 138 109% 303 -22%Luton 30 - 194 27% 627 3%Southend-on-Sea 15 - 357 6% 862 -13%Watford 0 - 0 - 62 -St. Albans 38 - 332 113% 359 -23%Bedfordshire, Essex and Herts 162 153% 1,305 45% 3,316 -11%
Bury St Edmonds 12 - 59 11% 286 -7%Cambridge 14 - 108 61% 450 -7%Ipswich 38 - 86 139% 447 -4%King's Lynn 8 - 54 -8% 242 -10%Norwich 34 - 139 40% 938 -21%Peterborough 21 - 105 44% 548 -12%Cambridgeshire, Norfolk and Suffolk 127 149% 551 42% 2,911 -13%
Canterbury 4 - 106 0% 658 -29%Maidstone 6 - 33 18% 231 -1%Medway 19 -10% 125 -44% 543 -26%Tunbridge Wells 3 - 49 4% 197 -29%Kent 32 -6% 313 -23% 1,629 -25%
Brighton 14 -44% 182 -37% 1,024 -29%Eastbourne 14 - 7 -74% 207 -29%Guildford 11 - 102 -32% 470 -9%Hastings 6 - 47 52% 280 -11%Surrey and Sussex 45 2% 338 -32% 1,981 -23%
Aylesbury 9 - 131 -19% 339 -21%Banbury 3 - 22 0% 114 -28%Newbury 2 - 22 -21% 130 -16%Milton Keynes 6 - 64 -22% 234 -35%Oxford 16 - 60 -38% 361 -12%Reading 13 - 111 9% 587 -10%Slough 5 -78% 144 -26% 381 -15%Thames Valley 54 -33% 554 -19% 2,146 -18%
South East 420 54% 3,061 7% 11,983 -17%……………..………………………...…………………………………………………………………………………………………………………………………………………...…………..
11

2009 Q4 - 2010 Q3
% Change2 in total from 2008 Q4 - 2009 Q3
2009 Q4 - 2010 Q3
% Change2 in total from 2008 Q4 - 2009 Q3
2009 Q4 - 2010 Q3
% Change2 in total from 2008 Q4 - 2009 Q3
Bath 24 - 73 -8% 479 -7% Bristol 290 -23% 187 -2% 1,167 -11%
Taunton 19 - 102 127% 323 -2%Yeovil 10 - 70 67% 320 -26%Avon & Somerset 343 -12% 432 21% 2,289 -12%
Barnstaple 12 - 28 -13% 203 -35%Exeter 4 - 40 -44% 381 -35%Plymouth 26 - 65 12% 659 -23%Torquay 9 - 38 -31% 375 -38%Truro 17 -19% 82 -2% 643 -30%Devon & Cornwall 68 15% 253 -16% 2,261 -31%
Bournemouth 64 191% 139 -9% 746 -20%Cheltenham 1 - 12 -65% 40 -84%Gloucester 14 - 105 94% 527 16%Salisbury 0 - 15 - 126 -15%Swindon 19 - 61 11% 400 -14%Weymouth 8 - 15 -46% 201 -26%Dorset, Gloucestershire and Wiltshire 106 152% 347 5% 2,040 -19%
Newport (I.O.W.) 6 - 19 -17% 154 -28%Portsmouth 21 - 118 23% 589 -13%Southampton 12 - 83 -6% 549 -18%Winchester 0 - 18 - 103 -11%Hampshire & Isle of Wight 39 70% 238 8% 1,395 -17%
South West 556 8% 1,270 5% 7,985 -21%……………..………………………...…………………………………………………………………………………………………………………………………………………...…………..Aberystwyth 0 - 3 - 29 -26%Carmarthen 0 - 20 - 90 -6%Haverfordwest 1 - 27 0% 137 -4%Neath & Port Talbot 0 - 24 - 161 -25%Swansea 11 - 86 -3% 354 2%Welshpool & Newton 1 - 13 - 63 -29%Mid and West Wales 13 - 173 1% 834 -10%
Caernarfon 0 - 46 70% 163 -26%Llangefni 0 - 12 - 45 -22%Mold 4 - 14 - 119 -10%Rhyl 1 - 33 -28% 224 6%Wrexham 3 - 51 42% 206 -19%North Wales 8 - 156 11% 757 -14%
Aberdare 4 - 21 - 63 -20%Blackwood 0 - 31 - 184 -21%Bridgend 5 - 27 -21% 185 -23%
Cardiff 95 94% 192 -4% 389 0%Merthyr Tydfil 0 - 18 - 89 48%Newport (Gwent) 10 - 82 1% 428 -16%Pontypridd 1 - 24 -8% 185 -17%South East Wales 115 51% 395 4% 1,523 -12%
Wales 136 25% 724 4% 3,114 -12%……………..………………………...…………………………………………………………………………………………………………………………………………………...………….....
England & Wales 10,883 -17% 17,607 -9% 55,024 -15%
Provincial High Court Centre1 The Royal Courts of Justice located in Central London, is the headquarters of the High Court. The Court has nationwide jurisdiction but handles a particularly
large proportion of the insolvency work originating in London, and is therefore included in the London regional total.2 The percentage change figures shown in this table reflect, where necessary, revised data for earlier years. They may therefore not be consistent with
previously published data for these earlier time periods. Percentages are not shown where the number of petitions in the same period a year ago is fewerthan 20.
Debtors bankruptcy Companies winding-up Creditors bankruptcy
12

Explanatory notes
Introduction
1. The United Kingdom Statistics Authority has designated these statistics as National Statistics, in accordance with the Statistics and Registration Service Act 2007 and signifying compliance with the Code of Practise for Official Statistics.
Designation can be broadly interpreted to mean that the statistics:
meet identified user needs; are well explained and readily accessible; are produced accordingly to sounds methods, and are managed impartially and objectively in the public interest.
Once statistics have been designated as National Statistics it is a statutory requirement that the Code of Practice shall continue to be observed
2. Figures on the numbers of company winding up petitions and individual
bankruptcy petitions issued in the High Court and county courts of England and Wales are published on a quarterly basis.
3. Insolvency: A company or individual with debts that they are unable to pay is said to be 'insolvent'. Insolvencies can either be made on a compulsory basis through court orders being made, or on a voluntary basis through an agreement between the company or individual debtor (who owes the debt) and creditor(s) (to whom the debt is owed).
4. Company winding up: When a company's existence is terminated because it is unable to pay its’ creditor(s), to whom debt is owed. To obtain a compulsory company winding up order, a creditor, shareholder or director must first present a petition to a court. Company winding up proceedings will normally be commenced at the court centre local to the registered office of the company, which will not necessarily be situated in the same geographical area as the company's base or operational area. The relative regional levels of winding-up activity do not therefore necessarily reflect the geographical distribution of the companies involved.
5. There is a restriction on proceedings commenced in county courts based on the paid-up capital of the company. Well over half of winding up proceedings are commenced and handled in the Chancery Division of the High Court at the Royal Courts of Justice in London and at the eight provincial High Court centres. These centres are flagged [] in Tables 2 and 3.
13

6. Individual bankruptcy: Where a person is unable to pay his or her debts. To obtain an individual bankruptcy order, the debtor or one or more of his creditors must first present a petition to a court. Proceedings for bankruptcy can be commenced at county courts with the appropriate jurisdiction, or in the Chancery Division of the High Court.
Presentation
7. Percentage changes are not provided where there are fewer than 20 observations in the past period.
Revisions
8. The 2010 Q3 figures are provisional, and are therefore liable to revision to take account of any late amendments to the databases from which these statistics are sourced. The standard process for revising the published statistics to account for these late amendments is as follows. An initial revision to the statistics for the latest quarter may be made when the next edition of this bulletin is published. Final figures for this quarter, and for other quarters in the same calendar year, will be published in the bulletin presenting the statistics for the second quarter of the following year.
Production process and quality assurance procedures
9. The statistics in this bulletin are sourced from manual counts made by court staff on weekly basis. These are aggregated for each period of 13 weeks to produce the quarterly figures. As such they represent quarterly periods which are not exactly the same as traditional calendar quarters (covering January to March, April to June, July to September and October to December).
10. Since April 2009 the manual counts have been recorded in the One Performance Truth (OPT) database, a web-based data monitoring system allowing direct inputting of performance data by court staff. Prior to April 2009 they were input into the Business Management System, designed for the purpose of monitoring and assessing court workloads. Quality assurance measures are in place to ensure that data are of sufficient quality. These measures include querying with the courts where counts look unusually high or low and obtaining corrected figures if errors are identified.
Insolvency Service data
11. Statistics on the actual numbers of company compulsory liquidations (winding up orders) and individual bankruptcy orders are published by the Insolvency Service. On receipt of a petition, the court issue process includes setting up a judicial hearing. At this hearing, once satisfied that there is no prospect of the debt(s) being paid, the court grants a company winding up order or a bankruptcy order and appoints an Official Receiver to take control of relevant assets. The Insolvency Service data are derived from administrative records of the Insolvency Service and
14
Companies House, two executive agencies of the Department for Business, Innovation and Skills (BIS). These statistics (released six days before the Ministry of Justice data for the same quarter due to the extra preparation time needed for the latter) can be accessed on their website at:
www.insolvency.gov.uk/otherinformation/statistics/insolv.htm
12. The Insolvency Service also releases statistics showing the numbers of voluntary insolvencies. A voluntary company winding up can occur by the company passing a resolution, subject to the approval of a creditors' meeting that it be wound up voluntarily, or by the company coming to a binding agreement with its creditors. An individual voluntary arrangement can be made through debtors coming to an agreement with their creditors.
Symbols and conventions
The following symbol has been used in the tables of this bulletin:
(p) = Provisional data
Contact points for further information
Current and previous editions of this publication are available for download at: www.justice.gov.uk/publications/companywindingupandbankruptcy.htm
Press enquiries should be directed to the Ministry of Justice press office:
Peter Morris Tel: 020 3334 3531 Email: [email protected]
Other enquiries about these statistics should be directed to Everald Mclennon Justice Statistics Analytical Services Ministry of Justice 7th Floor 102 Petty France London SW1H 9AJ Tel: 020 3334 3737 Email: [email protected]
General enquiries about the statistical work of the Ministry of Justice can be e-mailed to: [email protected]
Other National Statistics publications, and general information about the official statistics system of the UK, are available from www.statistics.gov.uk
15

© Crown copyright Produced by the Ministry of Justice
Alternative formats are available on request from [email protected]
16