STATISTICS Measures of Center. Mean…… The mean is the average of a set of numbers.
24
STATISTICS Measures of Center
-
Upload
august-cunningham -
Category
Documents
-
view
220 -
download
0
Transcript of STATISTICS Measures of Center. Mean…… The mean is the average of a set of numbers.

STATISTICSMeasures of Center

Mean……• The mean is the average of a set of numbers.
valuesofnumbertotal
numberstheofsummean
)(

Example……
• Roy compared the prices of a cd player at 5 stores. The prices at each store were $80, $95, $60, $90, and $85.
• What was the mean price of the cd players?
• Answer:
825
4105
)8590609580(
mean
mean

Example……
• George’s scores on 3 math tests were 70, 80, and 86.
• What score does he need to make on the 4th test to have a final average of 84?
• Answer:
100
236336
236)4)(84(4
)236(84
4
)868070(84
x
x
x
x
x

Median……• Definition: The number in the center of the data.
a. Odd # in set – median is middle number.
b. Even # in set – median is the
average of the 2 numbers in the center.
c. The numbers must be in order from smallest to largest.

Example……
• Consider the following scores:
• 95, 30, 100, 100, and 95.
• Find the median.
• Arrange in Order:
30, 95, 95, 100, 100
• Odd # in set – median is the middle number.
30, 95, 95, 100 100

Example……
• Use the following numbers:
• 8, 9, 9, 10, 11, 11
• Find the median.
• Even # in set:• Average the 2 middle numbers:
8, 9, 9, 10, 11, 11
5.92
19
2
)109(
median
median
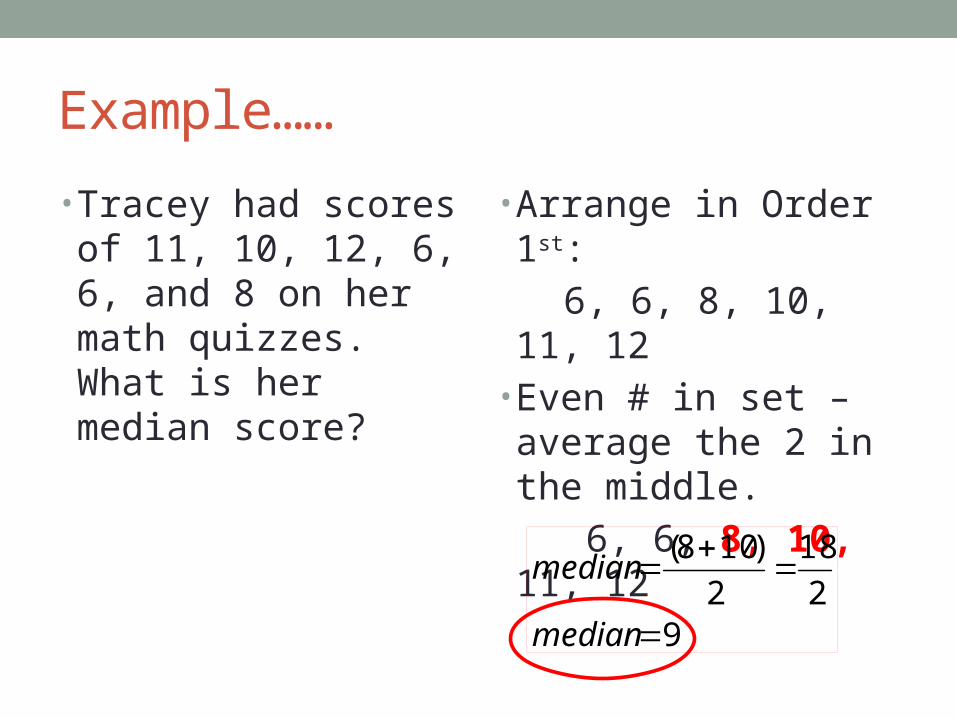
Example……
• Tracey had scores of 11, 10, 12, 6, 6, and 8 on her math quizzes. What is her median score?
• Arrange in Order 1st:
6, 6, 8, 10, 11, 12• Even # in set – average the 2 in the middle.
6, 6, 8, 10, 11, 12
92
18
2
)108(
median
median
Mode……• The number that appears the most often.
• There can be more than one mode.
• There can also be no mode if each item appears only once.

Example……
• Tony had scores of 12, 11, 10, 9, 10, 11, 12, 10, 11, 11.
• What is the mode of his scores?
• Answer:• It helps to put them in order to see the grouping:
9, 10,10,10, 11,11,11,11,12,12
• The mode is 11.
Example……
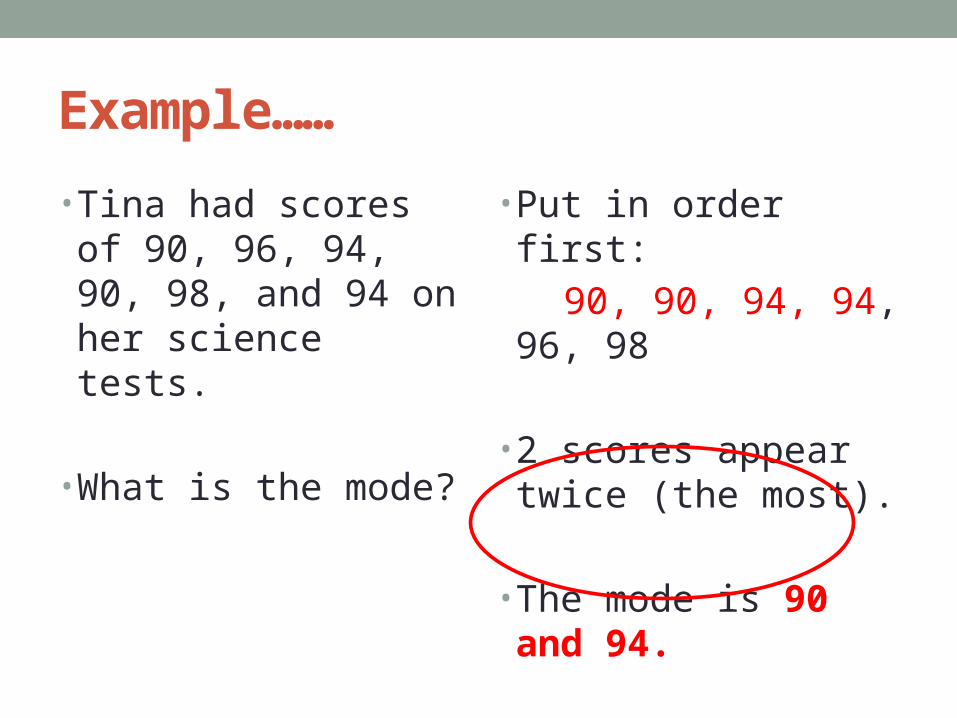
• Tina had scores of 90, 96, 94, 90, 98, and 94 on her science tests.
• What is the mode?
• Put in order first:
90, 90, 94, 94, 96, 98
• 2 scores appear twice (the most).
• The mode is 90 and 94.

Example……
• Find the mode for the high temperatures for the week.
• 97, 92, 88, 99, 90, 91, and 94.
• Put in order first:
88, 90, 91, 92, 94, 97, 99
• Each number occurs only once, therefore there is no mode.

Range……• Definition:
The range is the difference between the greatest and least values of the data set.

Example……
• Joyce’s bowling scores are 148, 195, 193, 145, 186, and 149.
• What is the range of her scores?
• Find the highest number and the lowest number in the set.
148, 195, 193, 145, 186, 149
• Subtract 195 and 145.
50145195 range

Which is the best to use?• Mean, median, and mode are called measures of central
tendency. They tell something about where the data tends to cluster, or where the center of the data is located.
• When the range is small, the mean is most likely to be the best measure of central tendency.

Example……• Ted’s earnings for 5 weeks were $84, $76, $86, $300, and
$76.
• Which measure of central tendency best describes her typical wage?
• Why?

$76, $76, $84, $86, $300• Mode = 76. It is too low because it is less than 3 other
measures. NO• Mean = 124.4. It is too high because it is greater than 4
of the 5 salaries. NO• Range = 224. Very Big. Mean is probably not good to
use. • Median = 84. It is the most representative of the data.
YES.

BOX PLOTS(BOX AND WHISKERS)
Boxplot• A graph of a set of data obtained by drawing a horizontal
line from the minimum to maximum values with quartiles labeled in between.
• It is a graphical plot of 5 specific values called the 5-number summary.
5-number summary…..Minimum – lowest number in set
Q1- middle number of the lower half
Median – middle number of entire set
Q3 – middle number of upper half
Maximum – highest number in set

Steps……• 1. Find the 5-number summary.
• 2. Draw and label a scale of equal intervals.
• 3. Place dots above the 5 numbers
• 4. Put a box around Q1 and Q3.
• 5. Draw a vertical line through the median.
• 6. Draw “whiskers” from the minimum to Q1 and maximum to Q3.

Example……• Draw a box plot of the following data.
33, 38, 43, 30, 29, 40, 51, 27, 42, 23, 31

Example……• Draw a box plot of the following data.
59, 60, 65, 52, 51, 64, 71, 48, 47, 40, 50

Assignment……• Worksheet.