Statistics from Data to Decision, Second Edition - Kentoana/math30011/ChapterV.pdfStatistics from...
50
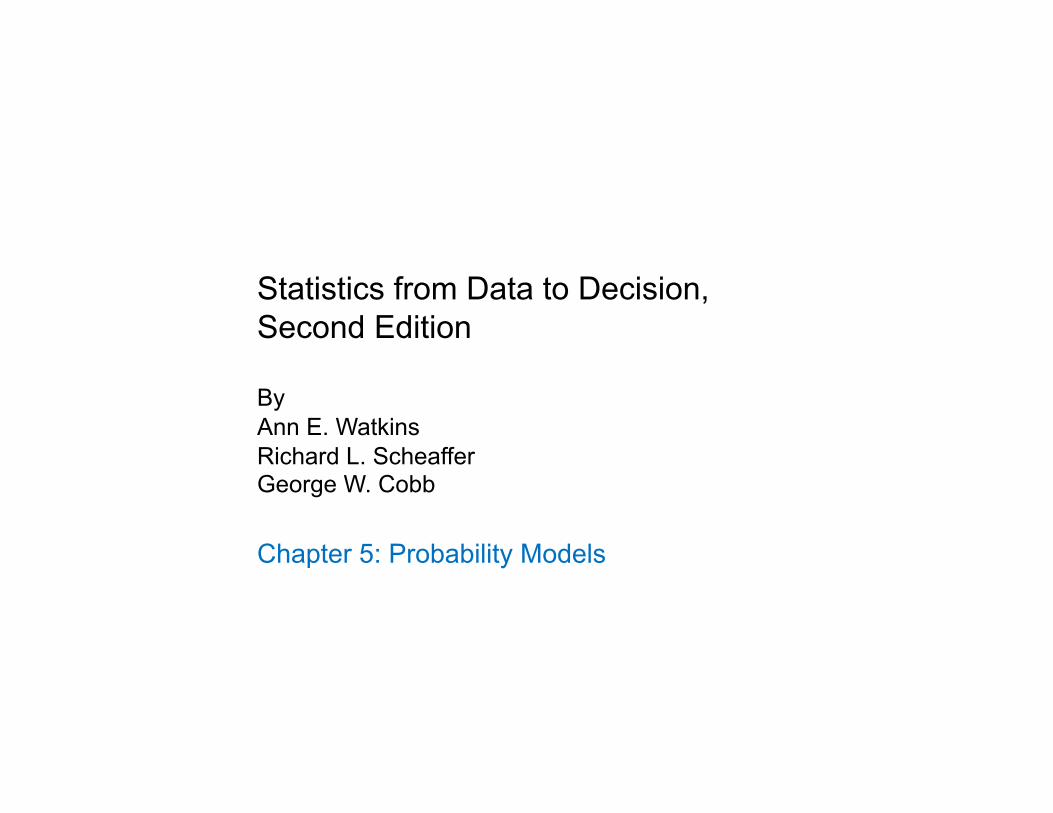
Statistics from Data to Decision, Second Edition By Ann E. Watkins Richard L. Scheaffer George W. Cobb Chapter 5: Probability Models
Transcript of Statistics from Data to Decision, Second Edition - Kentoana/math30011/ChapterV.pdfStatistics from...
Statistics from Data to Decision, Second Edition
By Ann E. Watkins Richard L. Scheaffer George W. Cobb
Chapter 5: Probability Models

Models of Random Behavior
The Probability of an outcome is the long term proportion of times the outcome occurs.
Building Blocks of Probability
An experiment is any activity for which the outcome is uncertain.
An outcome is the result of a single performance of an experiment.
The collection of all possible outcomes is called the sample space.
An event is a collection of outcomes from the sample space.
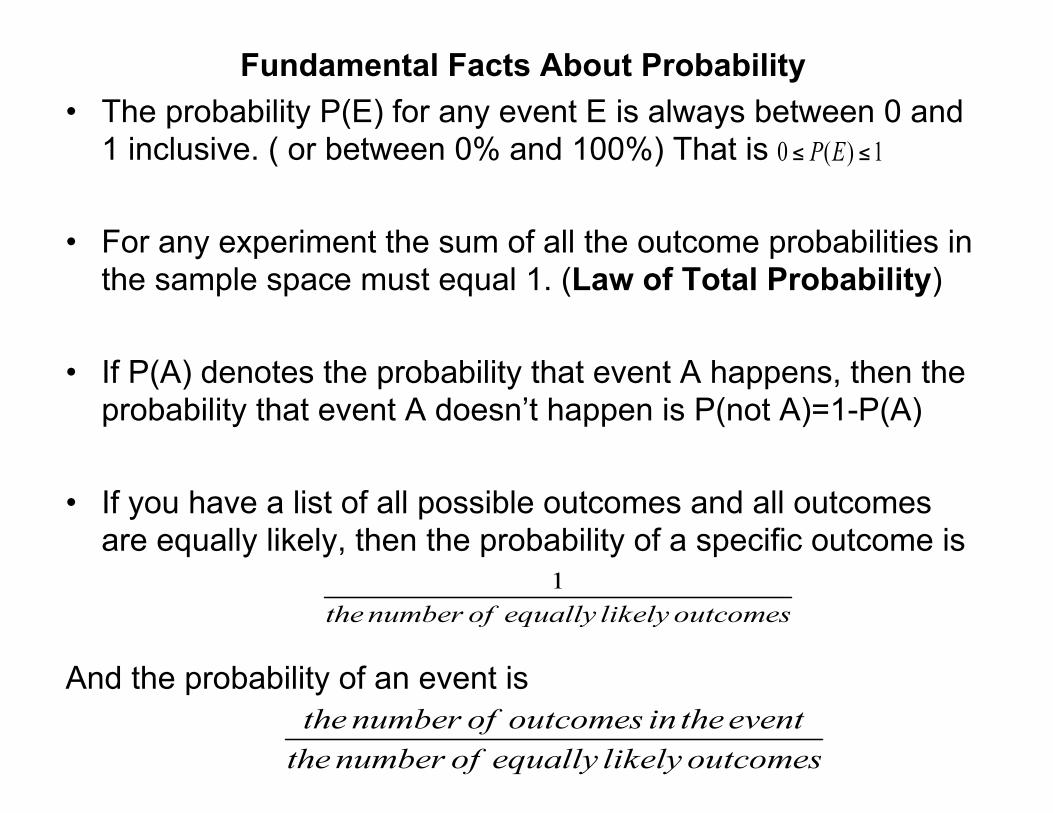
Fundamental Facts About Probability • The probability P(E) for any event E is always between 0 and
1 inclusive. ( or between 0% and 100%) That is
• For any experiment the sum of all the outcome probabilities in the sample space must equal 1. (Law of Total Probability)
• If P(A) denotes the probability that event A happens, then the probability that event A doesn’t happen is P(not A)=1-P(A)
• If you have a list of all possible outcomes and all outcomes are equally likely, then the probability of a specific outcome is
And the probability of an event is

Example Determine whether each table is a probability model.

Methods for Assigning Probabilities • Classical Method: Used when the experiment has equally likely
outcomes
• Relative Frequency Method: Used when previous information is available about the relative frequency of an event
• Subjective Method: Assignment of a probability value to an outcome based on personal judgment. Used when event is not repeatable

Example, Classical Probability Find the probability of drawing an ace when drawing a single card
at random from a deck of cards
Above is the sample space for drawing a card at random from a deck of cards.
52 outcomes in sample space; N(S)=52 E:event an ace is drawn; N(E)=4
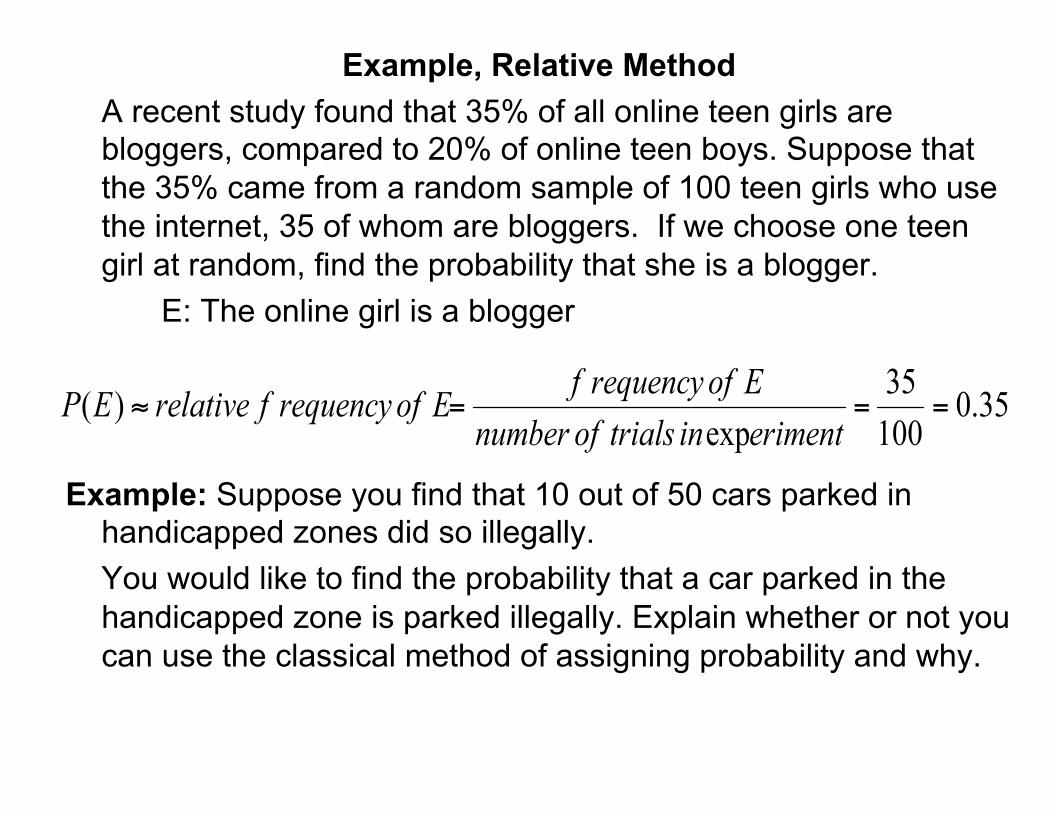
Example, Relative Method A recent study found that 35% of all online teen girls are bloggers, compared to 20% of online teen boys. Suppose that the 35% came from a random sample of 100 teen girls who use the internet, 35 of whom are bloggers. If we choose one teen girl at random, find the probability that she is a blogger. E: The online girl is a blogger
Example: Suppose you find that 10 out of 50 cars parked in handicapped zones did so illegally. You would like to find the probability that a car parked in the handicapped zone is parked illegally. Explain whether or not you can use the classical method of assigning probability and why.
Example, Subjective Probability What is the probability that the Cleveland Browns will win the next Super Bowl?

The Law of Large Numbers In a random sampling, the larger the sample, the closer the proportion of successes in the sample tends to be to the proportion of successes in the population.
As the number of times that an experiment is repeated increases, the relative frequency (proportion) of a particular outcome tends to approach the probability of the outcome.
As the number of times that an experiment is repeated increases, the mean of the outcome tends to approach the population mean

DISCUSSION The Law of Large Numbers
D6. An opinion pollster says, “All I need to do to ensure the accuracy of the results of my polls is to make sure I have a large sample.”
A casino operator says, “All I need to do to ensure that the house will win most of the time is to keep a large number of people flocking into my casino.”
A manufacturer says, “All I need to do to keep my proportion of defective light bulbs low is to manufacture a lot of light bulbs.”
Comment on the correctness of each of these statements. In particular, do the people speaking understand the Law of Large Numbers?
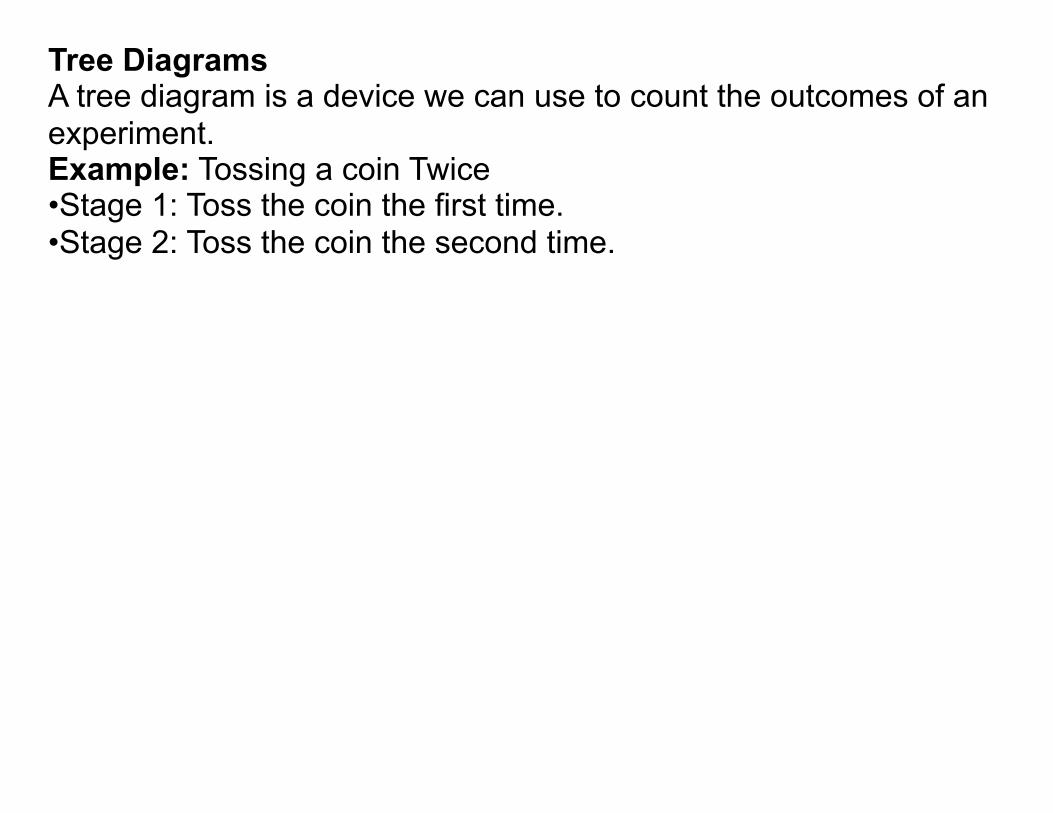
Tree Diagrams A tree diagram is a device we can use to count the outcomes of an experiment. Example: Tossing a coin Twice • Stage 1: Toss the coin the first time. • Stage 2: Toss the coin the second time.
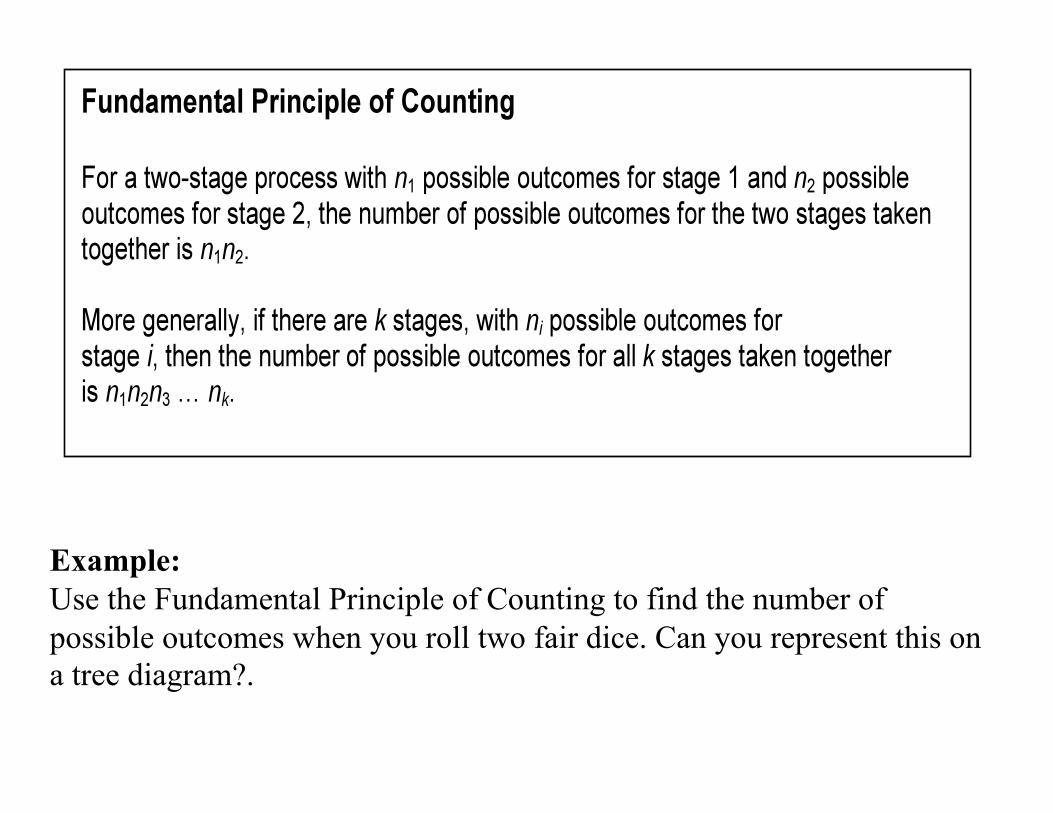
Example: Use the Fundamental Principle of Counting to find the number of possible outcomes when you roll two fair dice. Can you represent this on a tree diagram?.

The 36 possible outcomes when rolling two dice.
DISCUSSION The Fundamental Principle of Counting
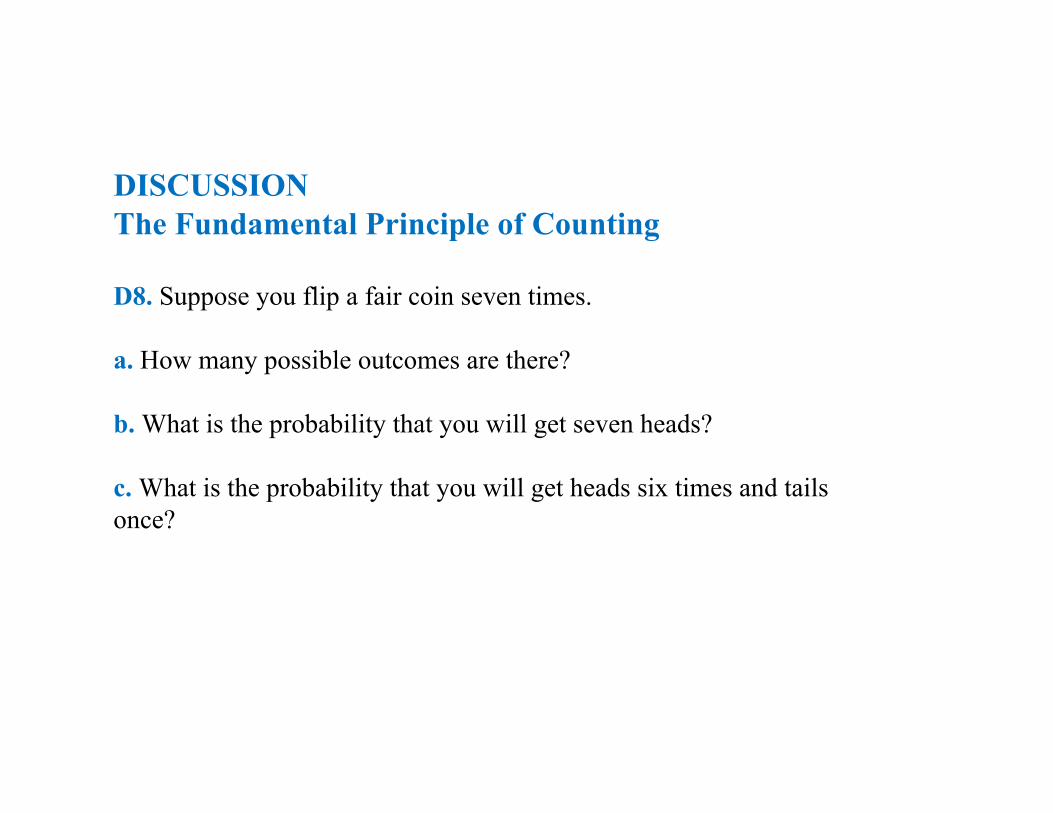
D8. Suppose you flip a fair coin seven times.
a. How many possible outcomes are there?
b. What is the probability that you will get seven heads?
c. What is the probability that you will get heads six times and tails once?

Example You have 27 songs on your MP3 player and randomly select one to play. It’s your favorite. When it finishes, you again randomly select a song to play, and it’s the same one! 1. What is the chance of this happening? 2. What is the chance that both random selections will be the same song?

The Addition Rule and Disjoint Events Analyze situations like the following: Ann and Bill are planning their engagement party. The room will hold 200 people; so they agree that Ann will invite 100 of her nearest and dearest friends and Bill will invite 100 of his nearest and dearest friends. Everyone invited shows up to the party, but there were only 140 guests there! Ann and Bill are mystified. How could this happen? Union and Intersection of Events The union of two events A and B is the event representing all the outcomes that belong to A or B or both.
The intersection of two events A and B is the event representing all the outcomes that belong to both A and B
Show union and intersection on a Venn diagram.

Mutually Exclusive Events (Disjoint) Two events that can’t happen on the same opportunity Example: When drawing a card at random from a deck of 52 cards, the events “a heart is drawn” and “ a diamond is drawn”. Selecting a student at random and getting a junior and a senior.
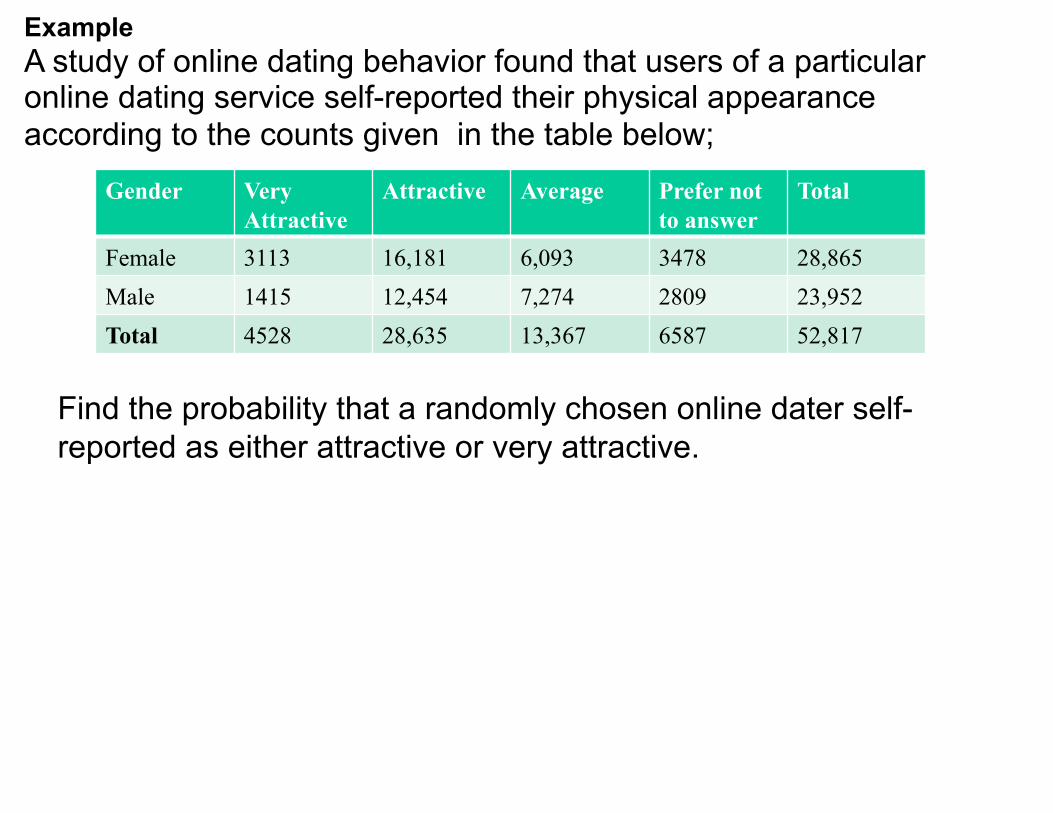
Example A study of online dating behavior found that users of a particular online dating service self-reported their physical appearance according to the counts given in the table below;
Gender Very Attractive
Attractive Average Prefer not to answer
Total
Female 3113 16,181 6,093 3478 28,865 Male 1415 12,454 7,274 2809 23,952 Total 4528 28,635 13,367 6587 52,817
Find the probability that a randomly chosen online dater self-reported as either attractive or very attractive.

Discussion (pp. 240-241) The Addition Rule for Disjoint (Mutually Exclusive) Events
DISCUSSION The Addition Rule for Disjoint (Mutually Exclusive) Events
D10. Statistical data often are presented in tables like the ones below. For each table, decide whether the categories are disjoint. How do you know?
a. Display 5.12 gives the status of all noninstitutionalized adults in the United States who were employed or seeking employment. For each person, only the principal source of employment was counted.
b. Display 5.13 lists some common leisure activities and the percentage of the 221 million U.S. adults who participated in the activity at least once in the prior 12 months.

Display 5.12 (p. 240) The U.S. labor force as of January 2008. Institutional includes military, colleges and universities, medical facilities, prisons, and so on.
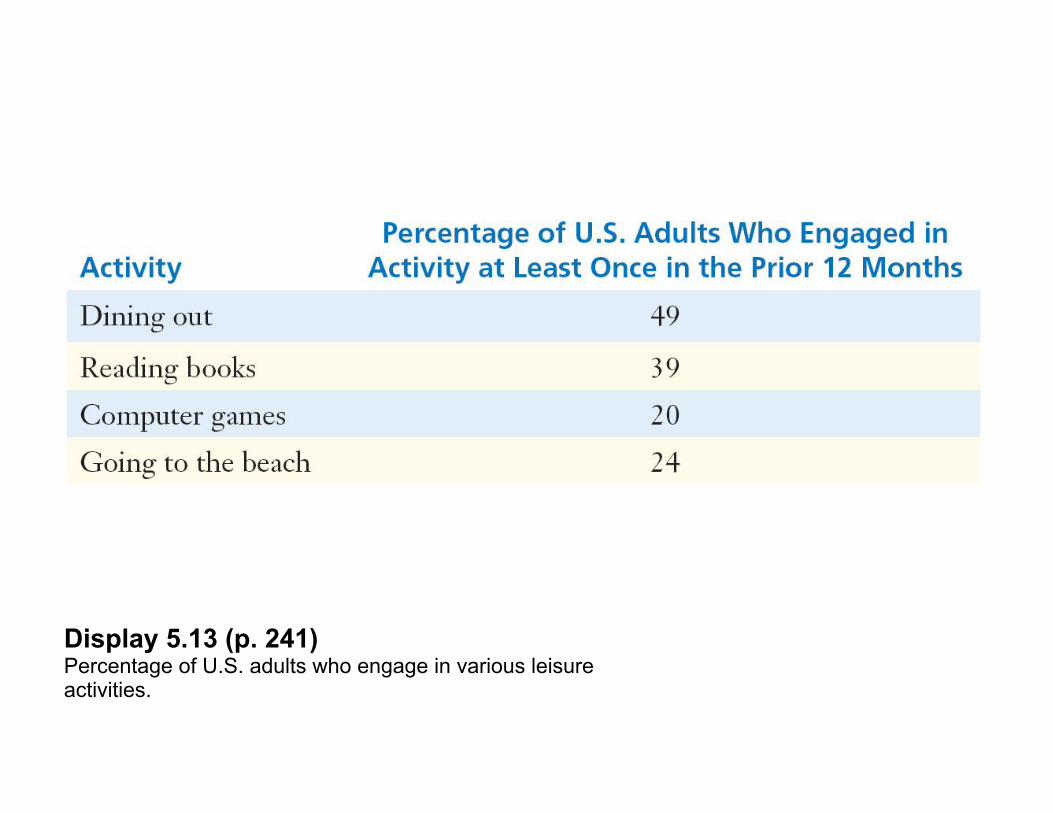
Display 5.13 (p. 241) Percentage of U.S. adults who engage in various leisure activities.

DISCUSSION The Addition Rule for Disjoint (Mutually Exclusive) Events
D11. Suppose you select a person at random from your campus. Are these pairs of events mutually exclusive?
a. has ridden a roller coaster; has ridden a Ferris wheel b. owns a classical music CD; owns a jazz CD c. is a senior; is a junior d. has brown hair; has brown eyes e. is left-handed; is right-handed f. has shoulder-length hair; is male

DISCUSSION The Addition Rule for Disjoint (Mutually Exclusive) Events
D12. Suppose there is a 20% chance of getting a mosquito bite each summer evening that you go outside. Can you use the Addition Rule for Disjoint Events to compute the probability that you will get bitten if you go outside on three summer evenings? If you go outside on six summer evenings?

The Addition Rule Used for finding the probability that either one event or another event may occur Remember

Example The percentages of U.S. adults in various weight categories, as defined and estimated by the Behavioral Risk Factor Surveillance System of the Centers for Disease Control and Prevention are shown in the table below;
Percentages by weight and gender category. BMI is body mass index.
Suppose that you pick a U.S. adult at random. a. What is the probability that the person is overweight or obese? b. What is the probability that the person is overweight or male?

Example Suppose you pay $1 to play the following game. You choose one card at random from a deck of 52 cards, and you will win $3 if the card is either an ace or a heart. Find the probability of winning this game.
Example You will be assigned to do a case study of the insurance history of one small business in your community. In your community, 80% of the small businesses carry liability insurance (L) or worker's compensation insurance (W). 40% carry liability insurance and 50% carry worker's compensation insurance. If your small business is to be chosen at random from those in your community, find the probability that the selected business carries both types of insurance.

DISCUSSION The Addition Rule
D13. The diagrams in Display 5.15 are called Venn diagrams. They can be used to illustrate the two forms of the Addition Rule.
Display 5.15 Venn diagrams illustrating the two forms of the Addition Rule.
DISCUSSION The Addition Rule
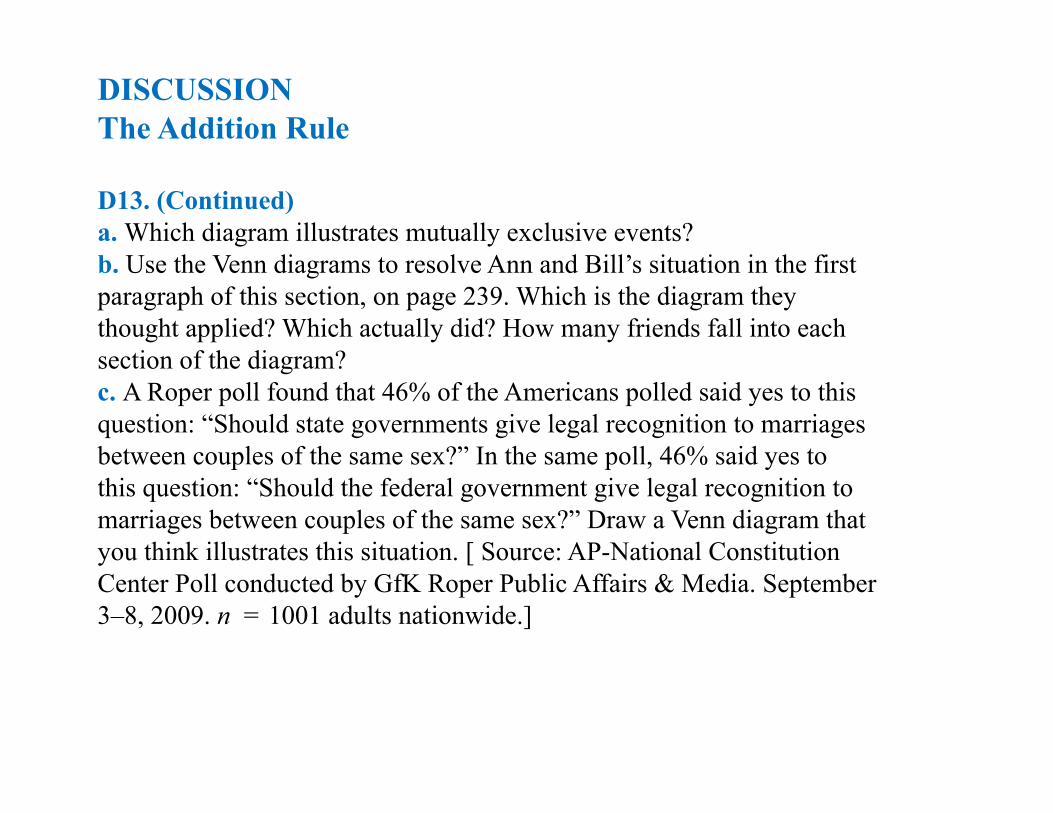
D13. (Continued) a. Which diagram illustrates mutually exclusive events? b. Use the Venn diagrams to resolve Ann and Bill’s situation in the first paragraph of this section, on page 239. Which is the diagram they thought applied? Which actually did? How many friends fall into each section of the diagram? c. A Roper poll found that 46% of the Americans polled said yes to this question: “Should state governments give legal recognition to marriages between couples of the same sex?” In the same poll, 46% said yes to this question: “Should the federal government give legal recognition to marriages between couples of the same sex?” Draw a Venn diagram that you think illustrates this situation. [ Source: AP-National Constitution Center Poll conducted by GfK Roper Public Affairs & Media. September 3–8, 2009. n = 1001 adults nationwide.]

DISCUSSION The Addition Rule
D14. In a situation where A and B are mutually exclusive, what happens if you use the general form of the Addition Rule? P(A or B ) = P(A ) + P(B ) - P(A and B )
In sampling with replacement, the randomly selected unit is returned to the population after being selected. When sampling with replacement, it is possible for the same unit to be sample more than once.
In sampling without replacement, the randomly selected unit is not returned to the population after being selected. When sampling without replacement, it is not possible for the same unit to be sampled more than once.

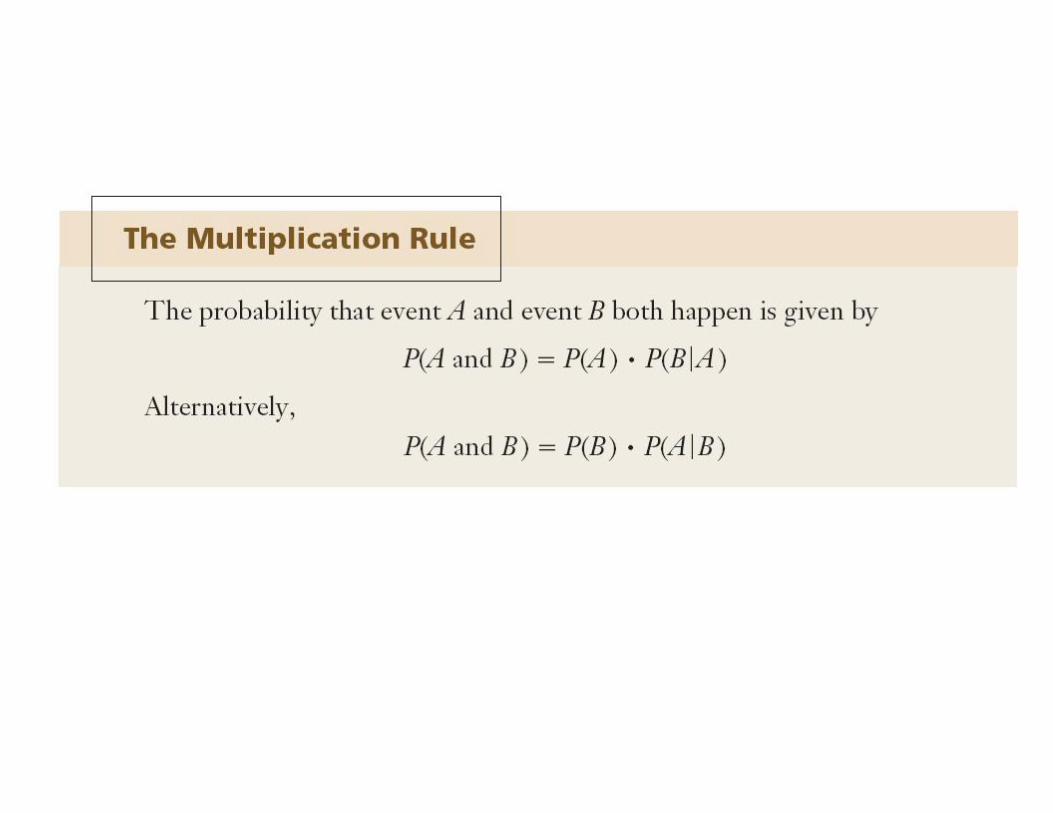
Conditional Probability and the Multiplication Rule The more information available, the better. If event A and B are related, then the occurrence of event B often influences the probability that event A will occur.
For two related events A and B, the probability of B given A is called a conditional probability and denoted
Example Sampling Without Replacement When you sample without replacement from a small population, the probabilities for the second selection depend on what happens on the first selection. For example, imagine a population of four recent graduates (that is, N = 4), two from the west (W) and two from the east (E). Suppose you randomly choose one person from the population and he or she is from the west. What is the probability that the second person selected is also from the west? In symbols, find
DISCUSSION Conditional Probability from the Sample Space
D15. When you compare sampling with and without replacement, how does the size of the population affect the comparison? Conditional probability lets you answer the question quantitatively. Imagine two populations of students, one large (N = 100) and one small (N = 4), with half the students in each population male (M ). Select random samples of size n = 2 from each population.
a. First, consider the small population. Find P(2nd is M |1st is M ), assuming you sample without replacement. Then find the probability again, this time assuming you sample with replacement.
b. Do the same for the larger population.
c. Based on these calculations, how would you describe the effect of population size on the difference between the two sampling methods?
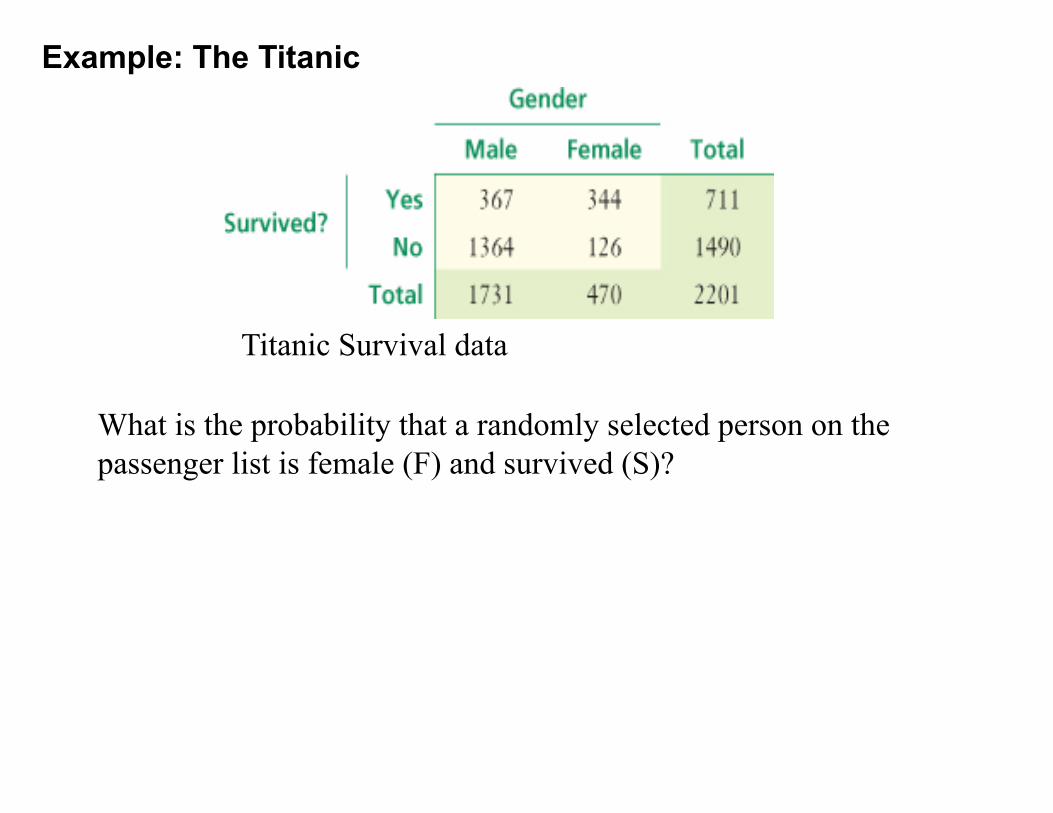
Titanic Survival data
What is the probability that a randomly selected person on the passenger list is female (F) and survived (S)?
Example: The Titanic


DISCUSSION The Multiplication Rule for P(A and B)
D16. Use the tree diagram for the Titanic data in Display 5.23 on page 249 to find P(male and survived ) and P(male and died ).
Discussion (pp. 250-251) The Multiplication Rule for P(A and B)

Discussion (pp. 250-251) The Multiplication Rule for P(A and B)
DISCUSSION The Multiplication Rule for P(A and B)
D17. Use the Titanic data in Display 5.22 on page 247 to show that P(M and S) = P(S) · P(M |S) = P(M ) · P(S |M )

DISCUSSION The Multiplication Rule for P(A and B)
D18. Use the frequencies in the table below to show that
P(A and B ) = P(A ) · P(B | A ) = P(B ) · P(A | B )
is true in general.

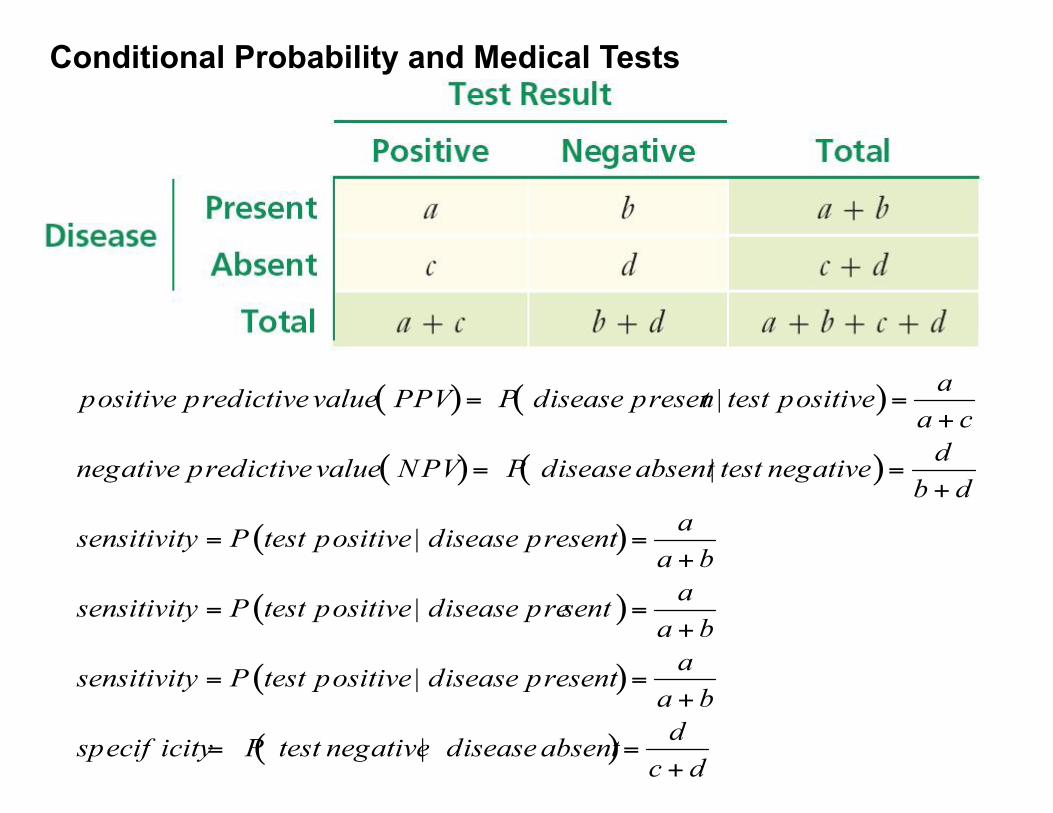
Conditional Probability and Medical Tests

Relatively Rare Disease Relatively rare diseases have tables similar to this below . This test has 50 false positives; that is, 50 people who don't have the disease tested positive. It has only 1 false negative—a person with the disease who tested negative. Find the sensitivity, specificity, PPV, and NPV for this test. .

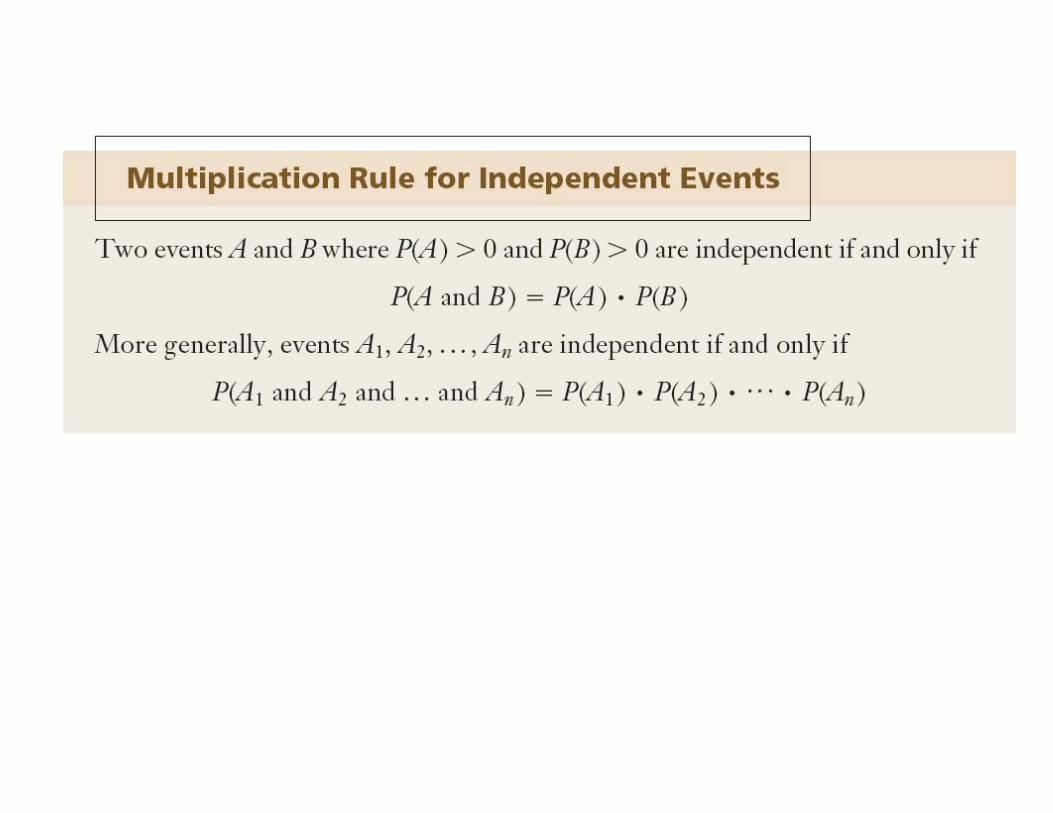
Independent Events Two events are independent if the occurrence of one does not affect the probability of the occurrence of the other.
Strategy for Determining Whether Two Events Are Independent 1. Find P(B). 2. Find P(B|A). 3. Compare the two probabilities. If they are equal then A and B
are independent events. Otherwise, A and B are dependent events
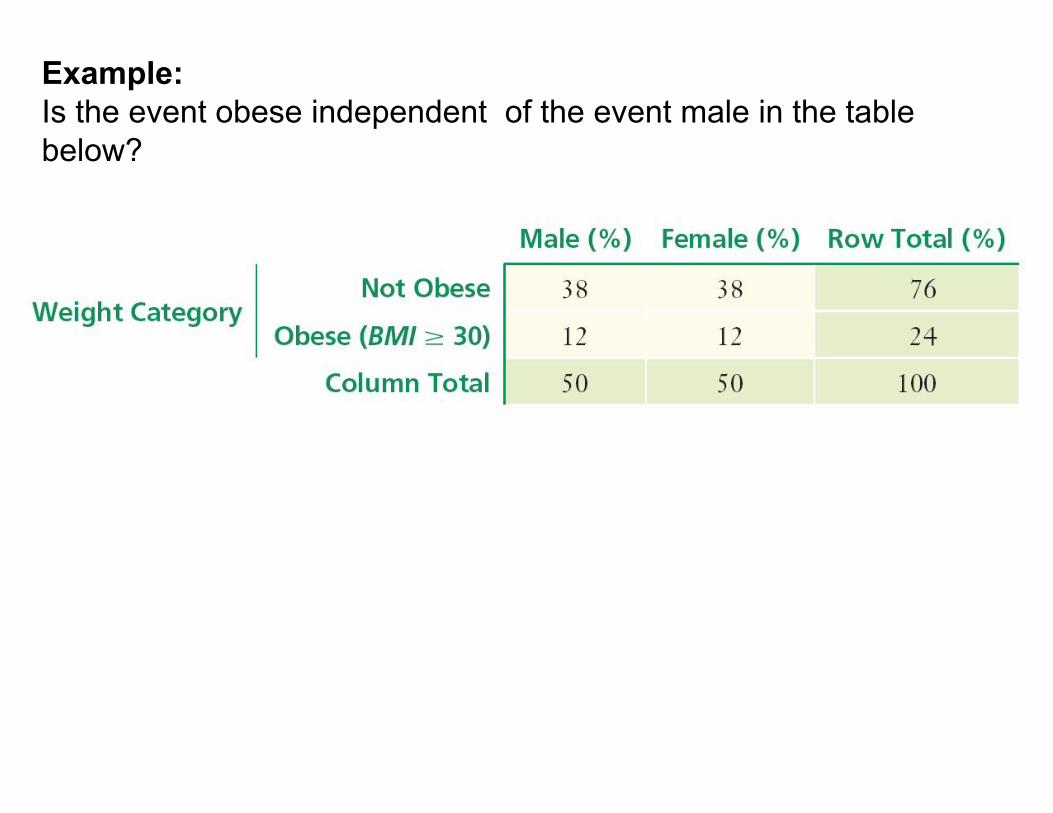
Example: Is the event obese independent of the event male in the table below?
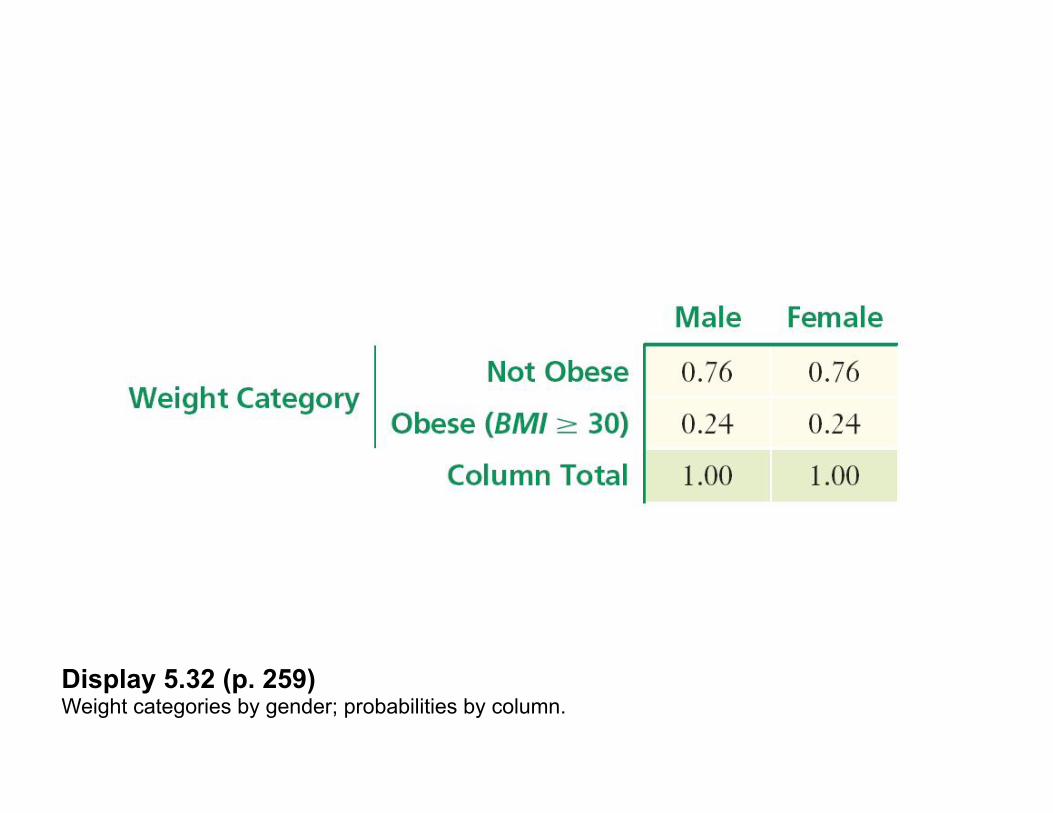
Display 5.32 (p. 259) Weight categories by gender; probabilities by column.
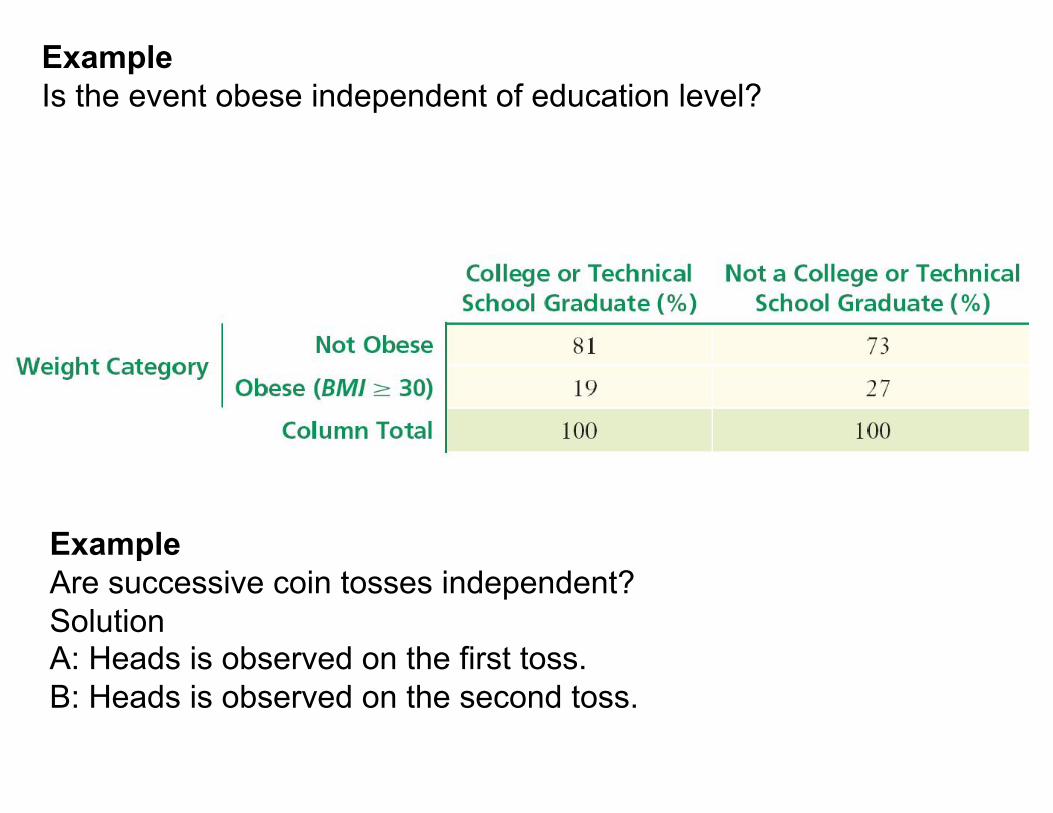
Example Is the event obese independent of education level?
Example Are successive coin tosses independent? Solution A: Heads is observed on the first toss. B: Heads is observed on the second toss.

DISCUSSION Independent Events
D22. Suppose you choose a student at random from your college. In each case, does knowing that event A happened increase the probability of event B, decrease the probability of event B, or leave the probability of event B unchanged?
a. A: The student is a football player; B: The student weighs less than 120 lb. b. A: The student has long fingernails; B: The student is female. c. A: The student is a freshman; B: The student is male. d. A: The student is a freshman; B: The student is a senior.

Example; Multiplication Rule and Health Insurance According to Health Highlights, published by the U.S. Department of Health and Human Services, about 30% of young American adults ages 18 to 24 don't have health insurance. [Source: www.healthfinder.gov, May 2007.] What is the chance that if you choose two American adults from this age group at random, the first has health insurance and the second doesn't?
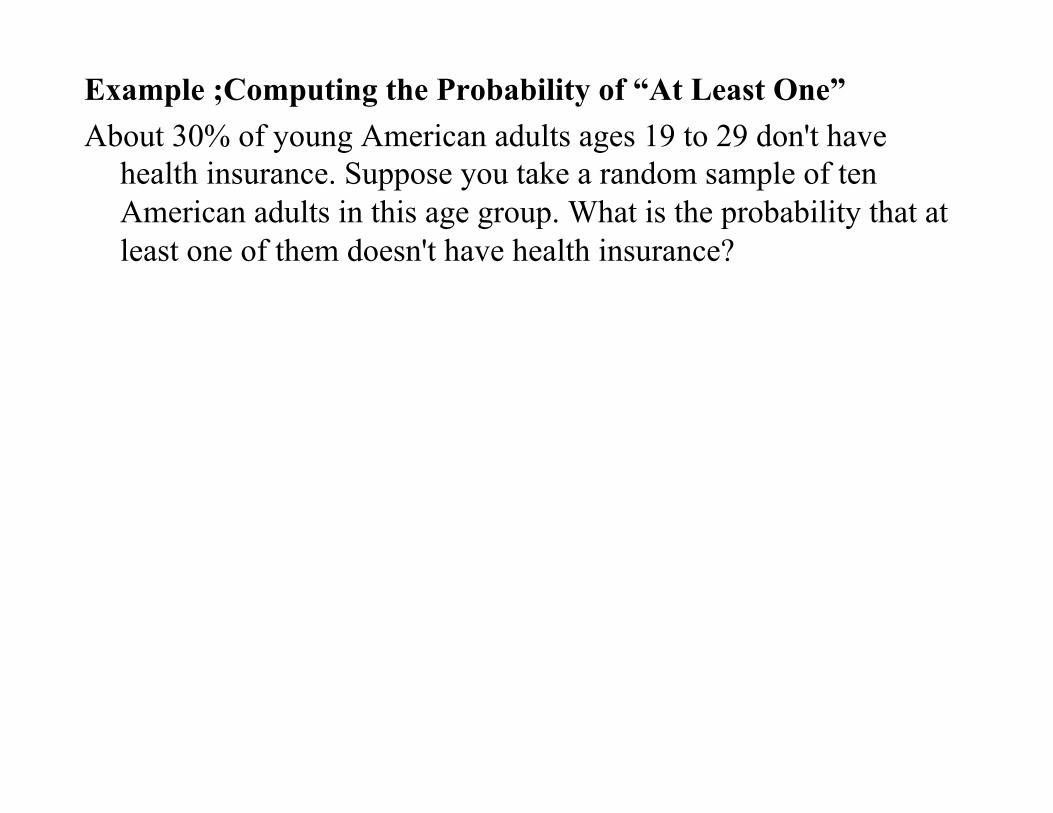
Example ;Computing the Probability of “At Least One” About 30% of young American adults ages 19 to 29 don't have
health insurance. Suppose you take a random sample of ten American adults in this age group. What is the probability that at least one of them doesn't have health insurance?

DISCUSSION Multiplication Rule
D23. Are these situations possible? Explain your answers.
a. Events A and B are disjoint and independent.
b. Events A and B are not disjoint and are independent.
c. Events A and B are disjoint and dependent.
d. Events A and B are not disjoint and are dependent.