Physics 2113 Lecture: 17 WED 25 FEB Capacitance II Physics 2113 Jonathan Dowling.
date post
19-Dec-2015Category
view
216download
0
Statistics for Decision Making
Descriptive Statistics
QM 2113 -- Fall 2003
Instructor: John Seydel, Ph.D.

Student Objectives
Locate course materialsSummarize course conceptsDistinguish between the two primary types of dataSummarize typical descriptive measures used for the different data typesPerform basic descriptive statistics calculationsCreate visual summaries of univariate data

Let’s Start With a Case
Read the Web Analytics caseLet’s look at the revenue figuresHow much revenue does a website earn?Hard question to answer: there’s variability!But not all is lost; what’s a reasonable to answer the first question?Yes, the average!But . . .

Dealing With the VariationWe can’t (or at least shouldn’t) ignore that there are differences among those valuesLook at a different set of data: Same average (almost) But there’s a lot of difference!
So, what can we say about the variation among the values?How about summarizing it with the range?A better figure: the standard deviation Essentially, it’s the average difference among
the values Not so easy to calculate That’s why we have computers!

Boiling Down Many Numbers to a Few
Thus we can typically use two values to summarize a set of data The average (i.e., the mean) The standard deviation
Easy to calculate with Excel =AVERAGE() =STDEV()
Can we do this with all data?Consider another collection of observations, different from but related to the first . . .

Let’s Look at the Business Models
How are these data different than the revenue data?Yes, these aren’t numbersInstead, they’re categoriesOK, so how would we describe the business model used by these firms?Again, yes, percentagesNow, can we summarize the variation?No . . . !

We Now Need to Summarize What We’ve Experienced
There will always be variation, but we can still concisely describe large amounts of information
What the values tend to be The variation among the values
Two types of data Numeric (e.g., revenues) Categorical (e.g., business models)
We can summarize numeric data according to General tendency (e.g., the average) How different they are (e.g., the standard deviation)
But the best we can do with categorical data is to list the percentages by categoryThe difference: information content

What is statistics? Description (Data analysis) ---> Stage 1 Inference (Applying results) ---> Stage 2
Data types Numeric (aka “quantitative”) Categorical (aka “qualitative”)
Descriptive analysis Informal (tables & charts) Summary measures
Inference: we’ll get there in a few weeks
Now, Let’s Do an Overview

Type of analysis depends upon data: Numeric; you’ll also see these terms
Ratio Interval Ordinal
Categorical; you’ll also see these terms Ordinal Nominal
Other examples?
Very Important
Three general forms Informal
Tables Charts
Formal: numeric (i.e., statistics)
Forms basis for performing inferential analyses
Descriptive Analysis

Categorical data Percentages Analysis of proportions
Numeric data Single numbers that summarize
Location (i.e., general tendencies) Variation (i.e., how different the values are)
Primary importance Mean Standard deviation
Descriptive Statistics (Formal)

Mean -- just a simple average Add the values and divide by number of
observations
Standard deviation Average difference among the values Process:
Subtract the average from each value Square each result “Average” the squared results Take the square root of that result
Primary Measures

Less important but need to be familiar with: Location
Median Mode Quantiles
Variation Range Min and Max
Both (?) Z-score Empirical Rule
We’ll revisit these in a week or so
Miscellaneous Statistics

Getting organized: Ordered array Frequency distribution
Absolute frequencies Relative frequencies (%) Cumulative frequencies
Cumulative relative frequencies
Histogram (frequencies)Other Stem-leaf display Ogive (cumulative frequencies)
Numeric Data: Charts & Tables
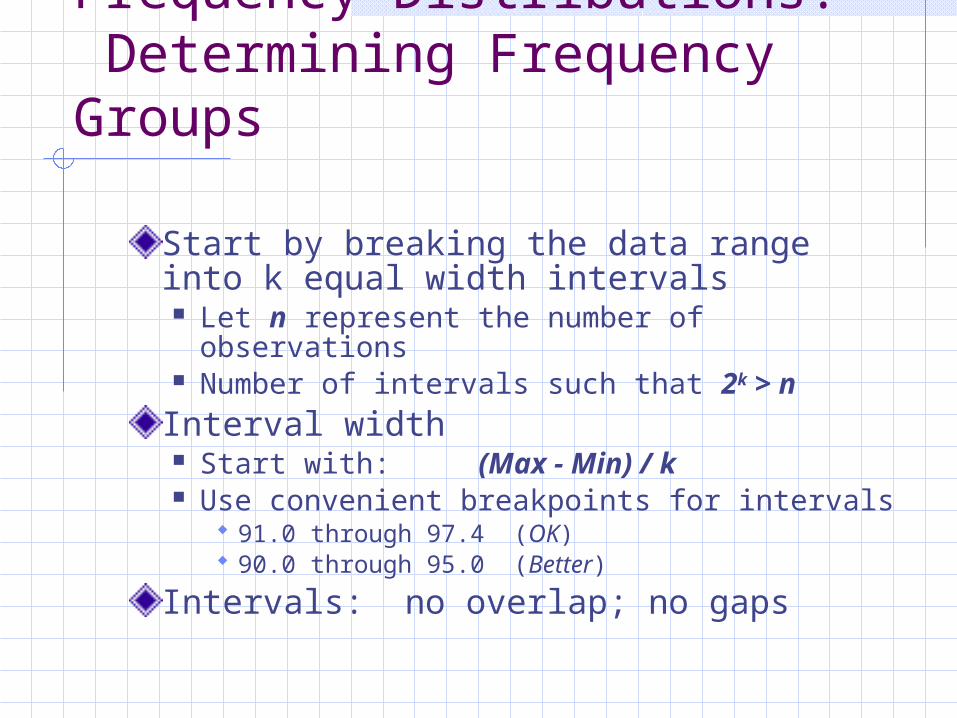
Start by breaking the data range into k equal width intervals Let n represent the number of observations Number of intervals such that 2k > n
Interval width Start with: (Max - Min) / k Use convenient breakpoints for intervals
91.0 through 97.4 (OK) 90.0 through 95.0 (Better)
Intervals: no overlap; no gaps
Frequency Distributions: Determining Frequency Groups

“Absolute” frequenciesCount number of observations in each interval
Relative frequenciesDivide absolute frequency by total number of observations
Cumulative frequenciesAdd frequencies for all previous intervals (note difference from manner done in text)
Cumulative relative frequenciesAdd relative frequencies for all previous intervals
Frequency Distributions: Determining Frequencies

What are they? Just graphical displays of frequency
distributions: absolute, relative, cumulative Provide “picture” of the variation in the
dataWhat they are not: Bar charts But they do for numeric data what bar
charts do for categorical dataBasics Horizontal axis: values for variable of
concern Vertical axis: indicates corresponding
frequencies
Histograms

What is statistics all about?It’s about dealing with variation Summarizing information (description) Making decisions based upon that
summarizationType of analysis depends on data type Numeric Categorical
Description Formal
Numeric data: average and standard deviaiton Categorical data: percentages
Informal: frequency tables and charts data
Summary

Appendix

Sampling
Population
Sample
Parameter
Statistic

Schematic View
Probability is w hat a llow s the linkage betw een descriptive and inferentialanalyses
Inform al
Inferential Analyses
Sum m ary M easures
Num eric Data
Inform al
Inferential Analyses
Sum m ary M easures
Categorical Data
Statistics