Statistics For Class X
27
E.C.S. BAGLESS SCHOOL
-
Upload
somil-jain -
Category
Education
-
view
122 -
download
2
Transcript of Statistics For Class X

E.C.S. BAGLESS SCHOOL

List of Group MembersSomil JainShivangi KushwahAnshul RajputRishi RajputShikha AgrawalAnkit SharmaKashfi Khan
Maths Project Work
MathsF.A. activity
"There are three kinds of lies: lies, damned lies and statistics."— by Benjamin Disraeli
Statistics
Statistics is the study of the collection, analysis, interpretation, presentation, and organization of data. In applying statistics to, e.g., a scientific, industrial, or social problem, it is conventional to begin with astatistical population or a statistical model process to be studied.
Introduction
MEASURE OF CENTRAL TENDENCYThe Study Of Certain Numerical Representatives of the ungrouped data is called measures of central tendency
There are three measures of central tendency
€ Mean € Median € Mode
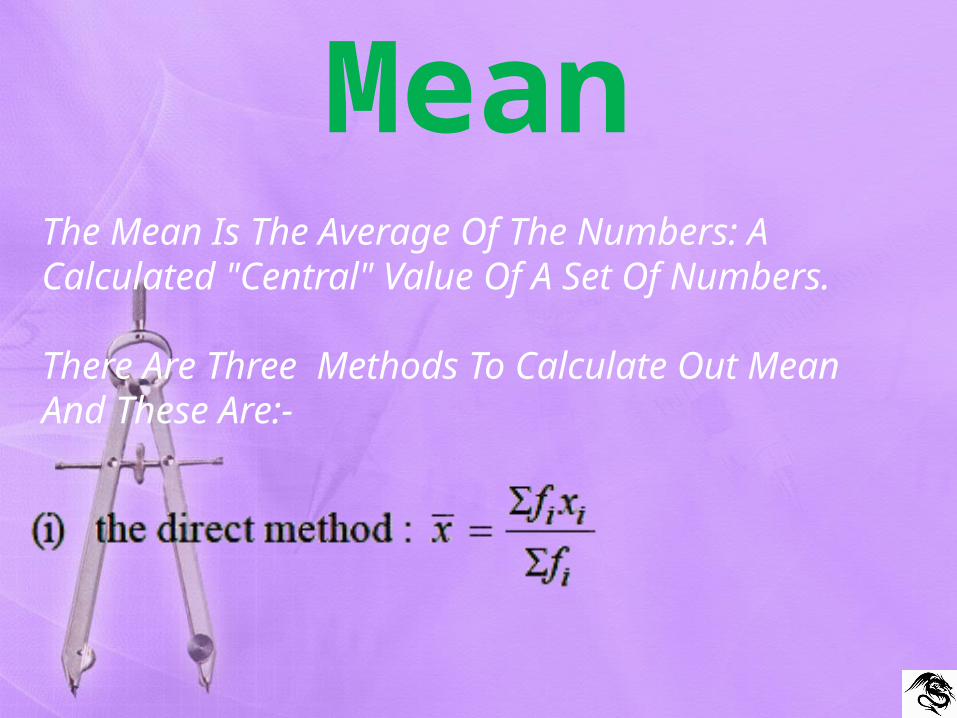
MeanThe Mean Is The Average Of The Numbers: A Calculated "Central" Value Of A Set Of Numbers.
There Are Three Methods To Calculate Out Mean And These Are:-

In Which :- a = assumed mean d = x - a
In Which :- a = assumed mean h = class size u = x - a h
ModeThe "Mode" Is The Value That Occurs Most Often. If No Number Is Repeated, Then There Is No Mode For The List.For Ungrouped DataThe Observation Which Occurs Maximum Number Of Time

For Grouped Data
Where :- l = lower limit of mode class h = class size F1 = frequency of mode class
F0 = frequency of the class just before modal class F2 = frequency of the class successding the
modal class

MedianThe "median" is the "middle" value in the list of numbers. To find the median, your numbers have to be listed in numerical order, so you may have to rewrite your list first.
For Ungrouped DataIf No. Of Observations , n = Odd
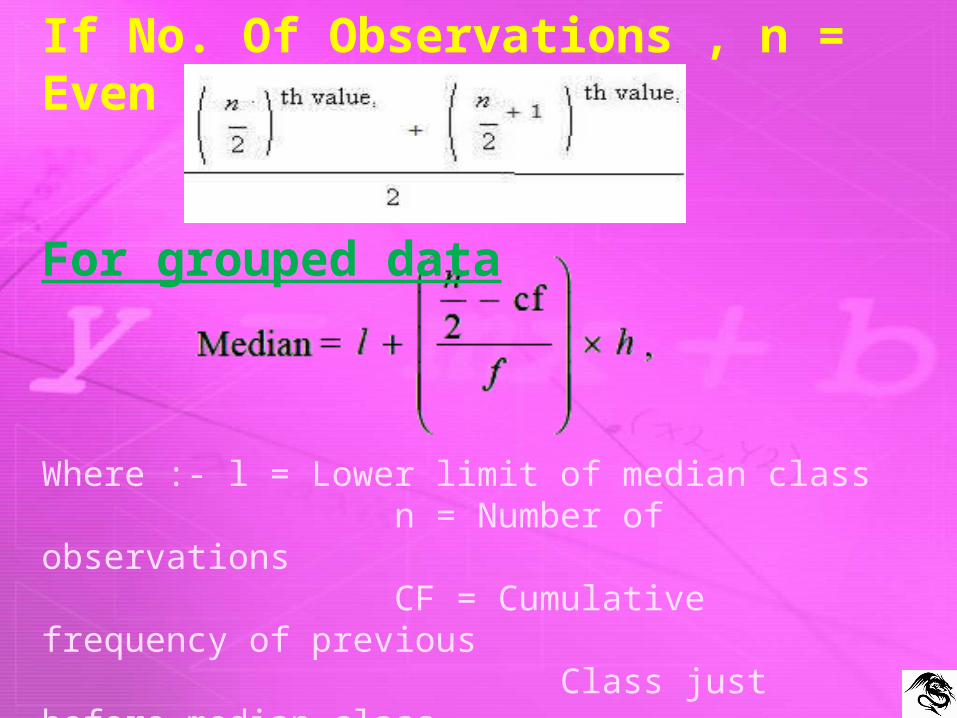
If No. Of Observations , n = Even
For grouped data
Where :- l = Lower limit of median class n = Number of observations CF = Cumulative frequency of previous Class just before median class F = Frequency of median class h = Class size

RELATION AMONG MEAN, MEDIAN &
MODE
3 Median = Mode + 2Mean
Also known as an OGIVE, this is a curve drawn by plotting the value of the first class on a graph. The next plot is the sum of the first and second values, the third plot is the sum of the first, second, and third values, and so on.
Cumulative Frequency Curve

Example:-
During the medical check-up of 35 students of a class, their weights were recorded as follows:
Weight (in kg) Number of students
Less than 38 0
Less than 40 3
Less than 42 5
Less than 44 9
Less than 46 14
Less than 48 28
Less than 50 32
Less than 52 35
Draw a less than type ogive for the given data. Hence obtain the median weight from the graph verify the result by using the formula.
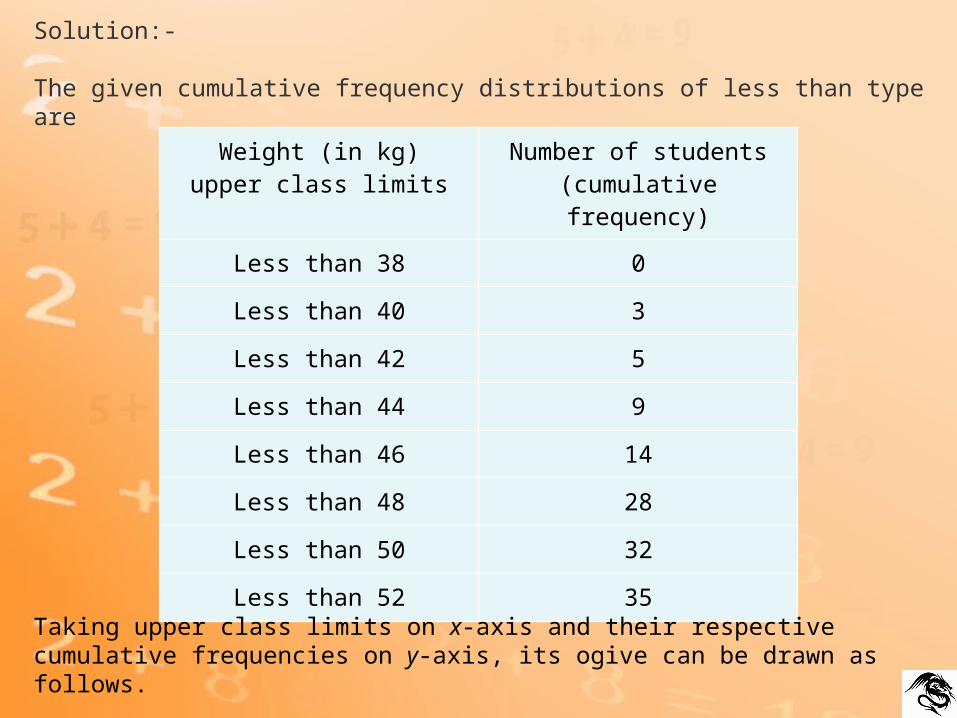
Weight (in kg)upper class limits
Number of students(cumulative frequency)
Less than 38 0
Less than 40 3
Less than 42 5
Less than 44 9
Less than 46 14
Less than 48 28
Less than 50 32
Less than 52 35
Solution:-
The given cumulative frequency distributions of less than type are
Taking upper class limits on x-axis and their respective cumulative frequencies on y-axis, its ogive can be drawn as follows.
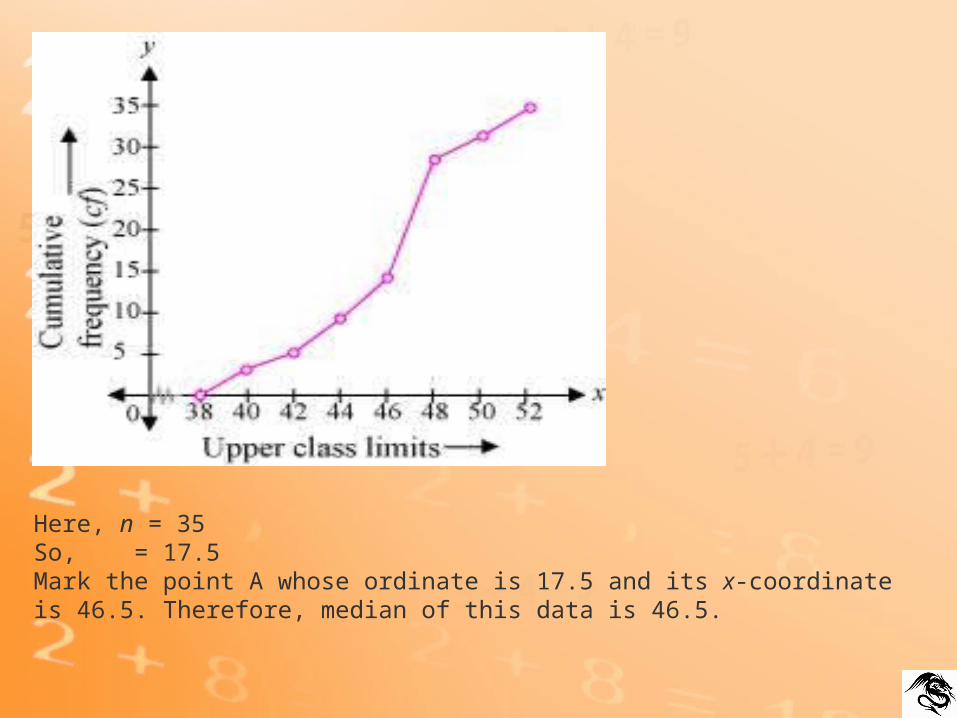
Here, n = 35So, = 17.5Mark the point A whose ordinate is 17.5 and its x-coordinate is 46.5. Therefore, median of this data is 46.5.
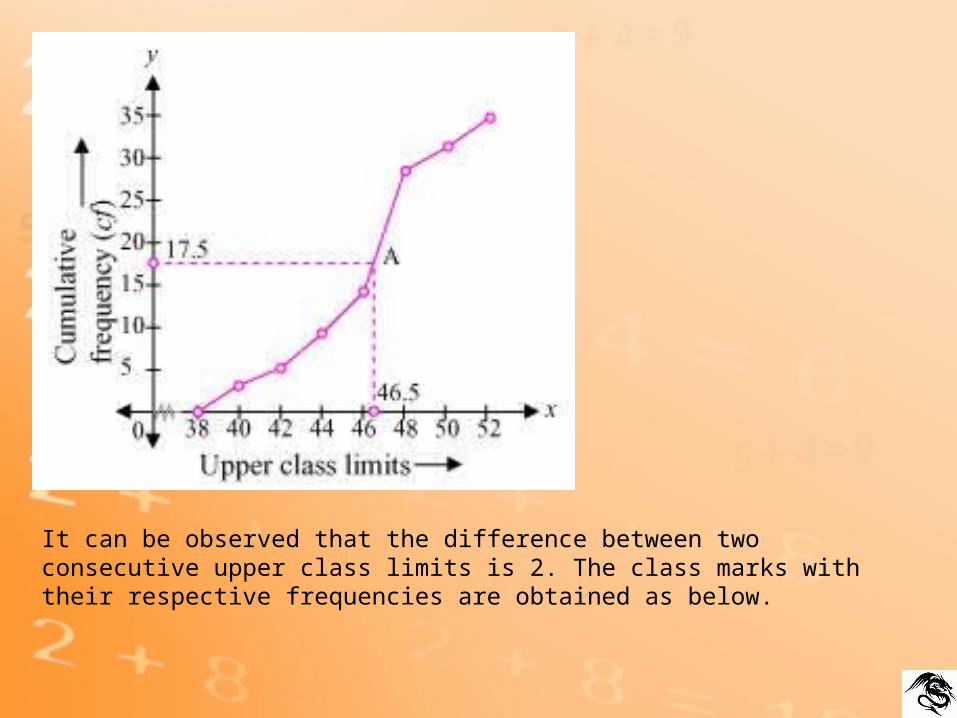
It can be observed that the difference between two consecutive upper class limits is 2. The class marks with their respective frequencies are obtained as below.
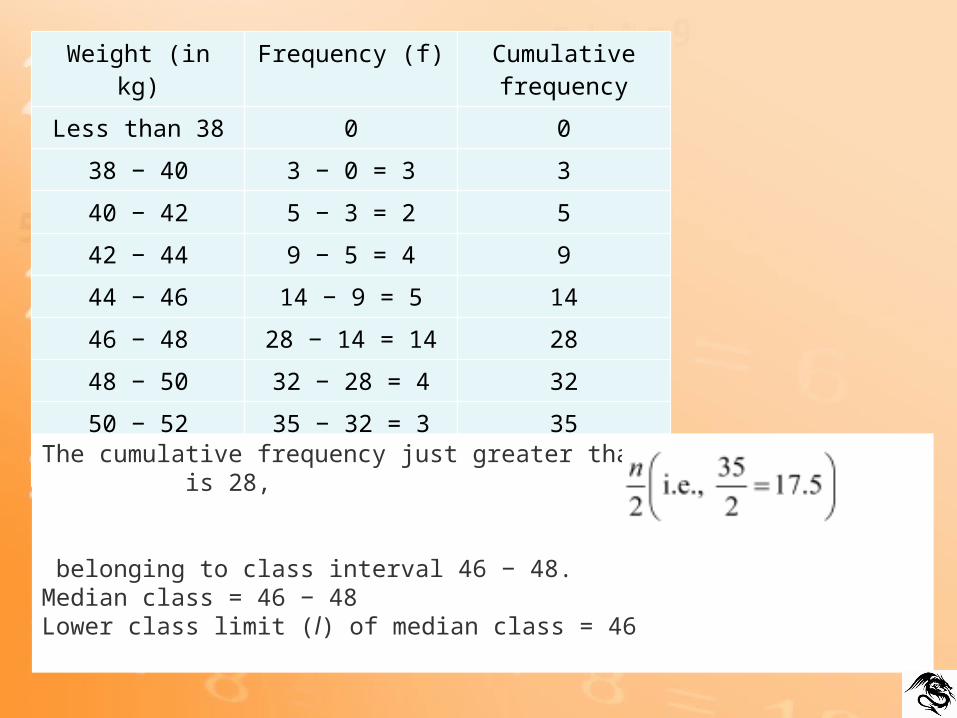
Weight (in kg) Frequency (f) Cumulative frequency
Less than 38 0 038 − 40 3 − 0 = 3 340 − 42 5 − 3 = 2 542 − 44 9 − 5 = 4 944 − 46 14 − 9 = 5 1446 − 48 28 − 14 = 14 2848 − 50 32 − 28 = 4 3250 − 52 35 − 32 = 3 35Total (n) 35
The cumulative frequency just greater than is 28,
belonging to class interval 46 − 48.Median class = 46 − 48Lower class limit (l) of median class = 46
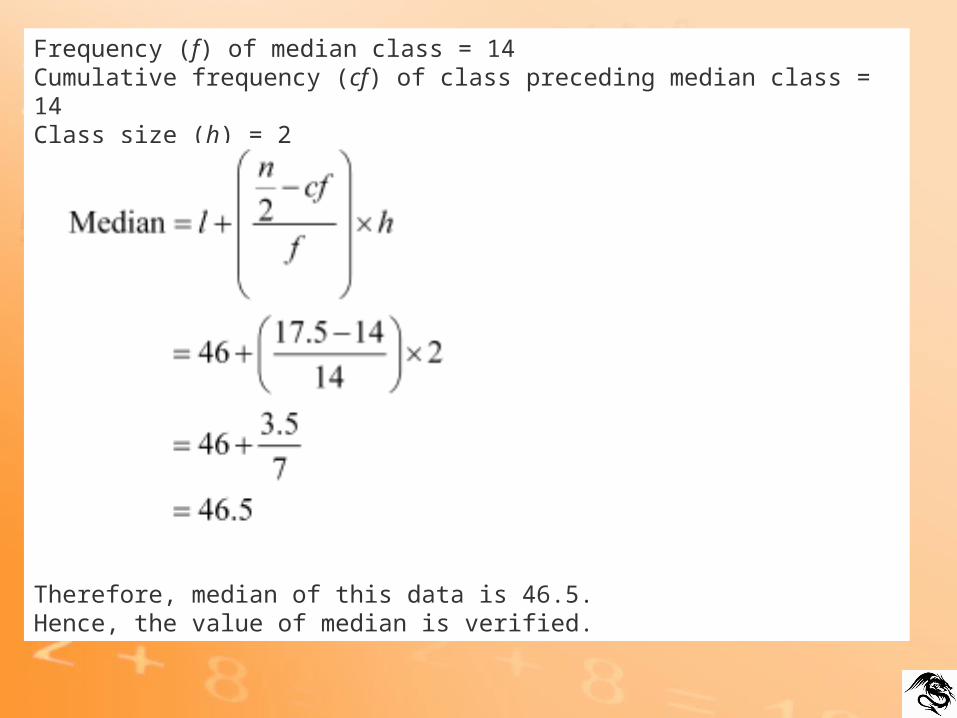
Frequency (f) of median class = 14Cumulative frequency (cf) of class preceding median class = 14Class size (h) = 2
Therefore, median of this data is 46.5.Hence, the value of median is verified.
Graphs Of Statistics There Are 5 Types Of Graph Commonly Used In Representing Statistical DataThe Graphs which are used are :- Bar GraphDouble Bar GraphFrequency Distribution Table Frequency Polygon Histogram
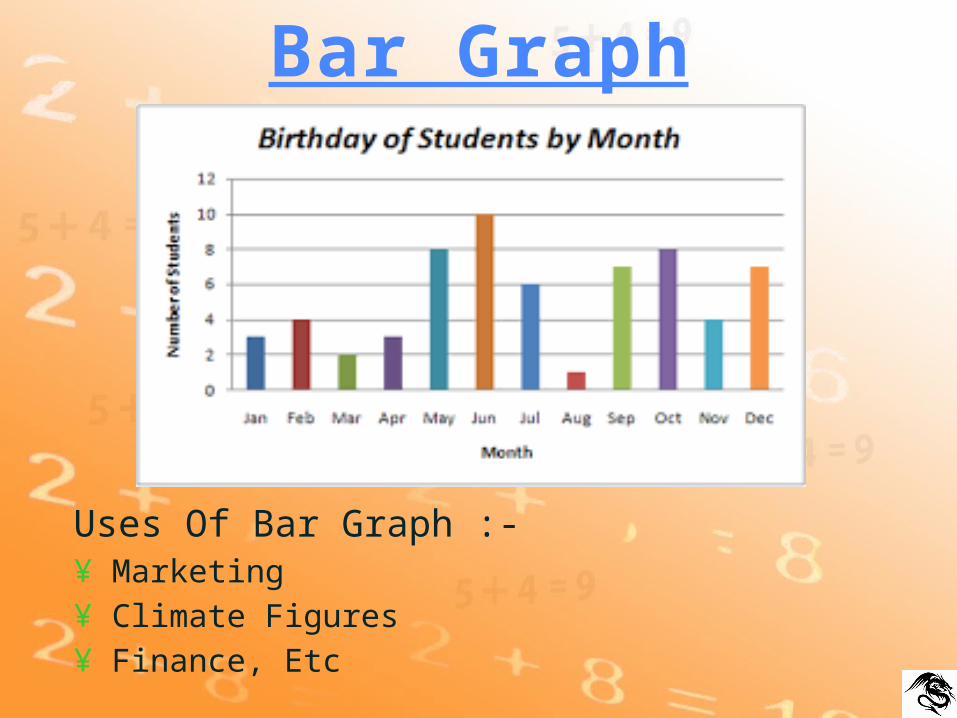
Bar Graph
Uses Of Bar Graph :-¥ Marketing¥ Climate Figures¥ Finance, Etc

Double Bar Graph
Uses Of Double Bar Graph :- € Comparing Result € Comparing Score Of 2 Different Teams€Comparing Data Of This Year With Previous Year, etc
Category 1 Category 2 Category 3 Category 40
0.51
1.52
2.53
3.54
4.55
Series 1Series 2
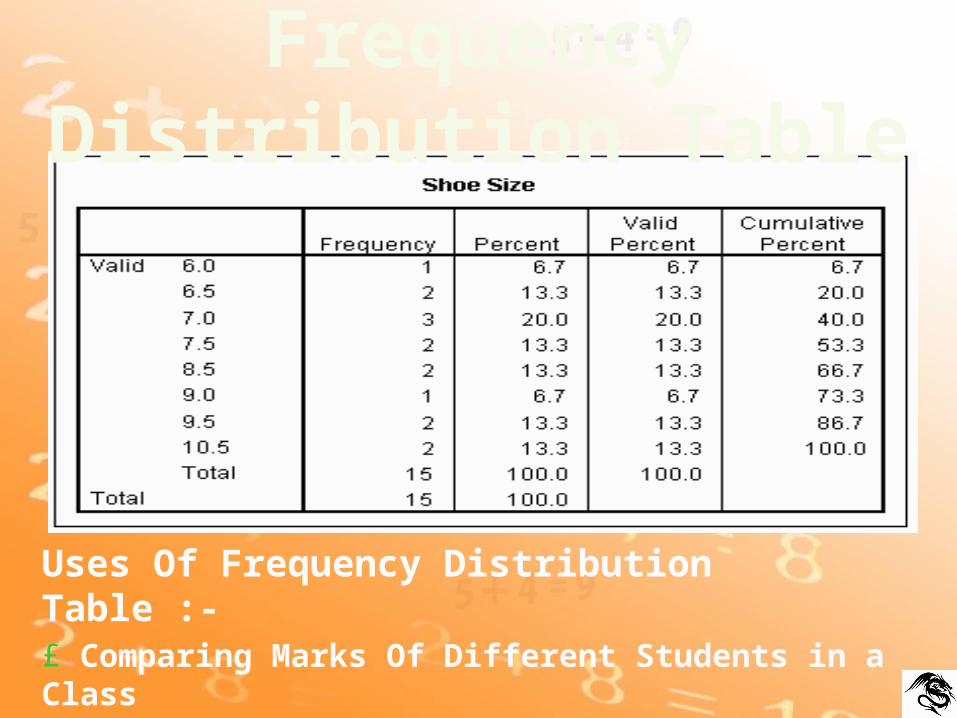
Frequency Distribution Table
Uses Of Frequency Distribution Table :-£ Comparing Marks Of Different Students in a Class£ Comparing Different Information Such as Height of Students, Weight, etc
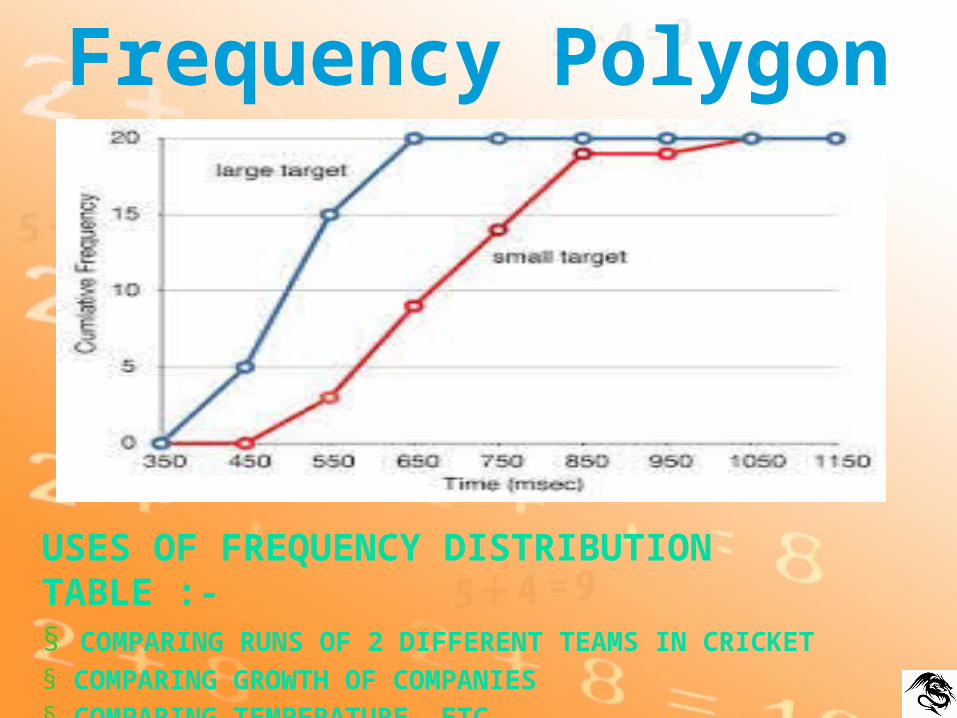
Frequency Polygon
USES OF FREQUENCY DISTRIBUTION TABLE :-§ COMPARING RUNS OF 2 DIFFERENT TEAMS IN CRICKET§ COMPARING GROWTH OF COMPANIES § COMPARING TEMPERATURE, ETC

histogram
Uses Of Bar Graph :-¢ to tell relative frequency of occurrence¢ to easily see the distribution of the data¢ to make future predictions based on the data, etc