Statistics for - Çankaya Üniversitesipsy116.cankaya.edu.tr/uploads/files/ASLI GONCU_PSY... ·...
26
Statistics for Psychology CHAPTER SIXTH EDITION Statistics for Psychology, Sixth Edition Arthur Aron | Elliot J. Coups | Elaine N. Aron Copyright © 2013 by Pearson Education, Inc. All Rights Reserved Chi-Square Tests 13
-
Upload
truongdieu -
Category
Documents
-
view
220 -
download
4
Transcript of Statistics for - Çankaya Üniversitesipsy116.cankaya.edu.tr/uploads/files/ASLI GONCU_PSY... ·...

Statistics for Psychology
CHAPTER
SIXTH EDITION
Statistics for Psychology, Sixth EditionArthur Aron | Elliot J. Coups | Elaine N. AronCopyright © 2013 by Pearson Education, Inc. All Rights Reserved
Chi-Square Tests
13
Statistics for Psychology, Sixth EditionArthur Aron | Elliot J. Coups | Elaine N. AronCopyright © 2013 by Pearson Education, Inc. All Rights Reserved
Chi-Square Tests
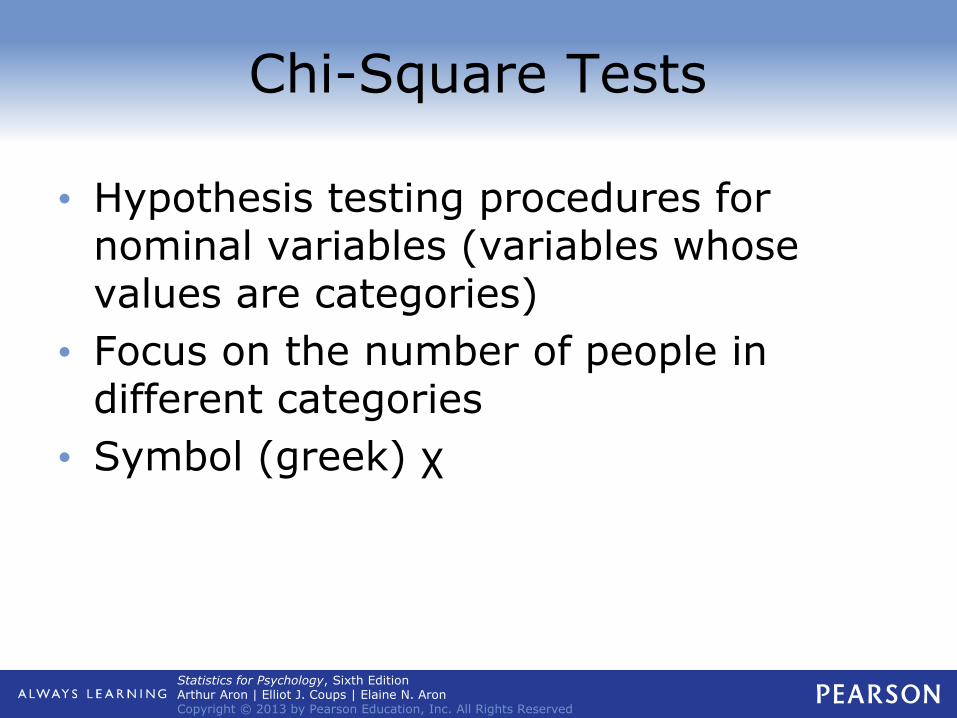
• Hypothesis testing procedures for nominal variables (variables whose values are categories)
• Focus on the number of people in different categories
• Symbol (greek) χ

Statistics for Psychology, Sixth EditionArthur Aron | Elliot J. Coups | Elaine N. AronCopyright © 2013 by Pearson Education, Inc. All Rights Reserved
Chi-Square Statistic
• Key idea is the comparison of observed and expected frequencies in each category
• Observed frequency
# of people actually found in the study to be in a category or cell
• Expected frequency
# of people in the category expected if the null hypothesis were true

Statistics for Psychology, Sixth EditionArthur Aron | Elliot J. Coups | Elaine N. AronCopyright © 2013 by Pearson Education, Inc. All Rights Reserved
Chi square statistics
• Example
• Harter et al. (1997)
• Three styles of relating to romantic partners: self focused autonomy style, an other-focused connection style, a mutuality style
• Respondents’ style and their partners’ style were gathered
• Self focused autonomy style would be likely to match with partners with other focused style?
• 101 self focused men: 50 had other-focused partners, 26 had self focused partners, 25 had mutuality style partners
• Lets make a table for them

Statistics for Psychology, Sixth EditionArthur Aron | Elliot J. Coups | Elaine N. AronCopyright © 2013 by Pearson Education, Inc. All Rights Reserved
Chi square statistics
Partner
style
Observed
frequency
Expected
frequency
Difference
(O-E)
Difference
squared
(O-E)2
Other
focused
50 33,67 16,33 266,67
Self-
focused
26 33,67 -7,67 58,83
Mutuality 25 33,67 -8,67 75,17

Statistics for Psychology, Sixth EditionArthur Aron | Elliot J. Coups | Elaine N. AronCopyright © 2013 by Pearson Education, Inc. All Rights Reserved
Chi-Square Statistic
• Observed frequency distribution
• Expected frequency distribution
• Chi-square statistic (χ2)

Statistics for Psychology, Sixth EditionArthur Aron | Elliot J. Coups | Elaine N. AronCopyright © 2013 by Pearson Education, Inc. All Rights Reserved
Chi square statistics
Partner
style
Observed
frequency
Expected
frequency
Difference
(O-E)
Difference
squared
(O-E)2
Difference
squared
weighted
by
expected
frequency
(O-E)2/E
Other
focused
50 33,67 16,33 266,67 7,92
Self-
focused
26 33,67 -7,67 58,83 1,75
Mutuality 25 33,67 -8,67 75,17 2,23

Statistics for Psychology, Sixth EditionArthur Aron | Elliot J. Coups | Elaine N. AronCopyright © 2013 by Pearson Education, Inc. All Rights Reserved
Chi-Square Statistic
• Chi-square distributions

Statistics for Psychology, Sixth EditionArthur Aron | Elliot J. Coups | Elaine N. AronCopyright © 2013 by Pearson Education, Inc. All Rights Reserved
Chi-Square Statistic
• Chi-square table
• It is included in the tables you get from the photocopy room
• Degrees of freedom (df)
df = Ncategories-1
The things which are free to vary
Seçme/değişme özgürlüğünün olması

Statistics for Psychology, Sixth EditionArthur Aron | Elliot J. Coups | Elaine N. AronCopyright © 2013 by Pearson Education, Inc. All Rights Reserved
Table 13-2 Portion of a Chi-Square Table (with Cutoff Value Highlighted for the Black et al. Example)

Statistics for Psychology, Sixth EditionArthur Aron | Elliot J. Coups | Elaine N. AronCopyright © 2013 by Pearson Education, Inc. All Rights Reserved
Two types of Chi Square
• 1. chi square test for goodness of fit
• 2. chi square test for independence

Statistics for Psychology, Sixth EditionArthur Aron | Elliot J. Coups | Elaine N. AronCopyright © 2013 by Pearson Education, Inc. All Rights Reserved
1) Chi-Square Test for Goodness of Fit
• Levels of a single nominal variable

Statistics for Psychology, Sixth EditionArthur Aron | Elliot J. Coups | Elaine N. AronCopyright © 2013 by Pearson Education, Inc. All Rights Reserved
2) Chi-Square Test for Independence
• Two nominal variables, each with several categories
• Contingency table

Statistics for Psychology, Sixth EditionArthur Aron | Elliot J. Coups | Elaine N. AronCopyright © 2013 by Pearson Education, Inc. All Rights Reserved
Table 13-4 Contingency Table of Observed Frequencies of Gender and Age of Characters on Cereal Boxes (Data from Black et al., 2009)
Statistics for Psychology, Sixth EditionArthur Aron | Elliot J. Coups | Elaine N. AronCopyright © 2013 by Pearson Education, Inc. All Rights Reserved
Chi-Square Test for Independence
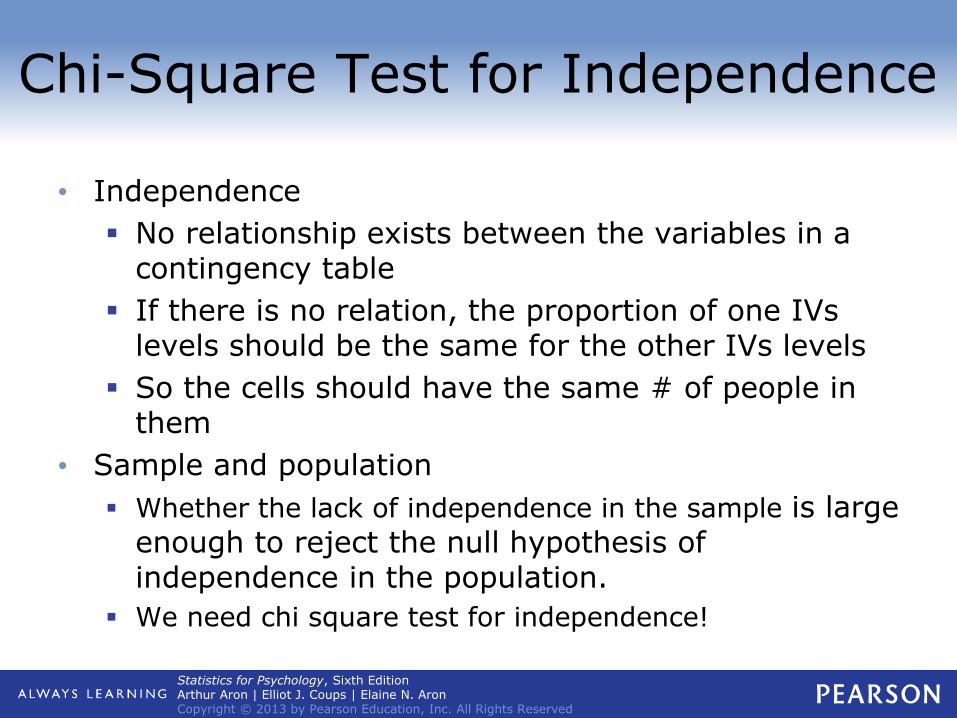
• Independence
No relationship exists between the variables in a contingency table
If there is no relation, the proportion of one IVs levels should be the same for the other IVs levels
So the cells should have the same # of people in them
• Sample and population
Whether the lack of independence in the sample is large enough to reject the null hypothesis of independence in the population.
We need chi square test for independence!
Statistics for Psychology, Sixth EditionArthur Aron | Elliot J. Coups | Elaine N. AronCopyright © 2013 by Pearson Education, Inc. All Rights Reserved
Chi-Square Test for Independence
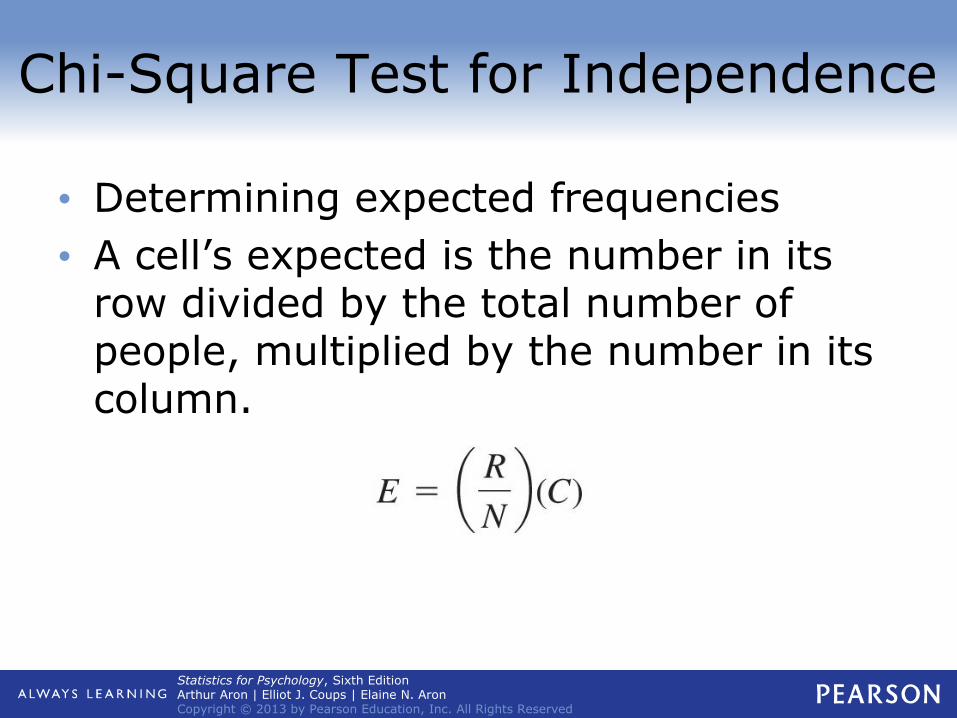
• Determining expected frequencies
• A cell’s expected is the number in its row divided by the total number of people, multiplied by the number in its column.
Statistics for Psychology, Sixth EditionArthur Aron | Elliot J. Coups | Elaine N. AronCopyright © 2013 by Pearson Education, Inc. All Rights Reserved
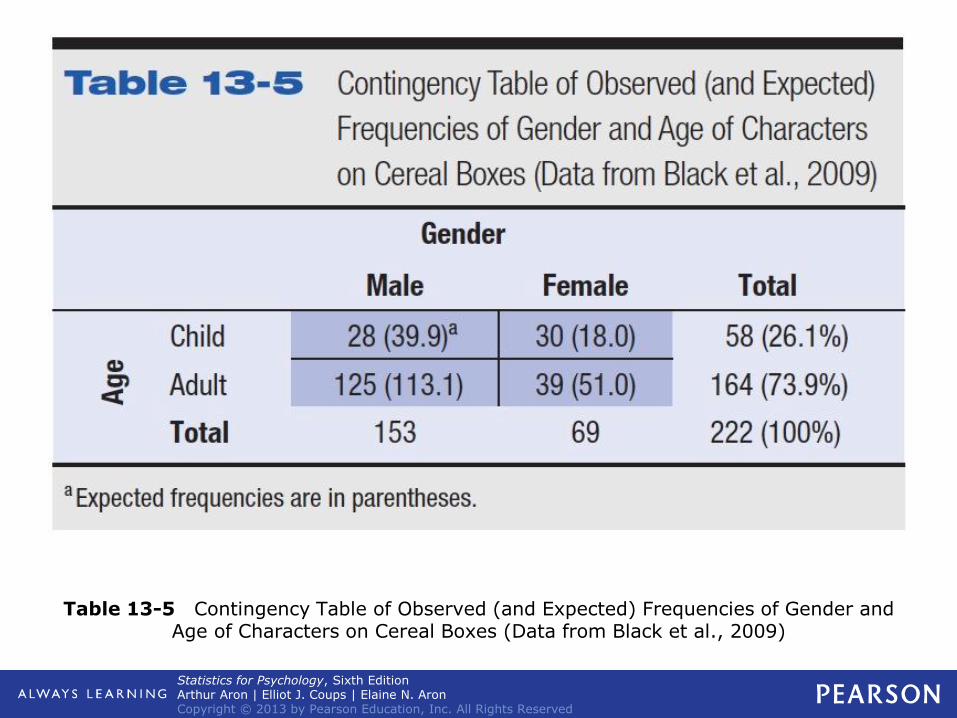
Table 13-5 Contingency Table of Observed (and Expected) Frequencies of Gender and Age of Characters on Cereal Boxes (Data from Black et al., 2009)

Statistics for Psychology, Sixth EditionArthur Aron | Elliot J. Coups | Elaine N. AronCopyright © 2013 by Pearson Education, Inc. All Rights Reserved
Chi-Square Test forIndependence
• Figuring chi-square
• Degrees of freedom

Statistics for Psychology, Sixth EditionArthur Aron | Elliot J. Coups | Elaine N. AronCopyright © 2013 by Pearson Education, Inc. All Rights Reserved
Chi-Square Test forIndependence
• Please check the cutoff (baraj) chi square from the table
• Then compare the cutoff score you calculated
• If your calculated cutoff score is bigger/larger than the cutoff score, it means that your results are significantly different from the expected case.

Statistics for Psychology, Sixth EditionArthur Aron | Elliot J. Coups | Elaine N. AronCopyright © 2013 by Pearson Education, Inc. All Rights Reserved
Assumptions for Chi-Square Tests
• No individual can be counted in more than one category or cell

Statistics for Psychology, Sixth EditionArthur Aron | Elliot J. Coups | Elaine N. AronCopyright © 2013 by Pearson Education, Inc. All Rights Reserved
Effect Size for the Chi-Square Test for Independence -1
• 2 X 2 contingency table
Phi coefficient (φ)
small φ = .10
medium φ = .30
large φ = .50

Statistics for Psychology, Sixth EditionArthur Aron | Elliot J. Coups | Elaine N. AronCopyright © 2013 by Pearson Education, Inc. All Rights Reserved
An example
Riehl (1994) studied the college experience of students who were the first generation in their family to attend college.
These students were compared to other students who were not the first generation in their family to go to college.
All students in the study were from Indiana University.
One of the variables Riehl (1994) measured was whether or not students dropped out during their first semester.
What are the variables?

Statistics for Psychology, Sixth EditionArthur Aron | Elliot J. Coups | Elaine N. AronCopyright © 2013 by Pearson Education, Inc. All Rights Reserved
An example
First generation Other generation Total
Dropped out 73 89 162
Did not dropped
out
657 1226 1883
Total 730 1315 2045

Statistics for Psychology, Sixth EditionArthur Aron | Elliot J. Coups | Elaine N. AronCopyright © 2013 by Pearson Education, Inc. All Rights Reserved
An example
First generation Other generation Total
Dropped out 73 (57,83) 89 (104,17) 162
Did not dropped
out
657 (672,17) 1226 (1210,83) 1883
Total 730 1315 2045
73 (162/2045)x 730 = 57,83
89 (162/2045)x 1315 = 104,17
657 (1883/2045)x 730 = 672,17
1226 (1883/2045)x 1315 = 1210,83
df = (2-1). (2-1) = 1
Statistics for Psychology, Sixth EditionArthur Aron | Elliot J. Coups | Elaine N. AronCopyright © 2013 by Pearson Education, Inc. All Rights Reserved
An example
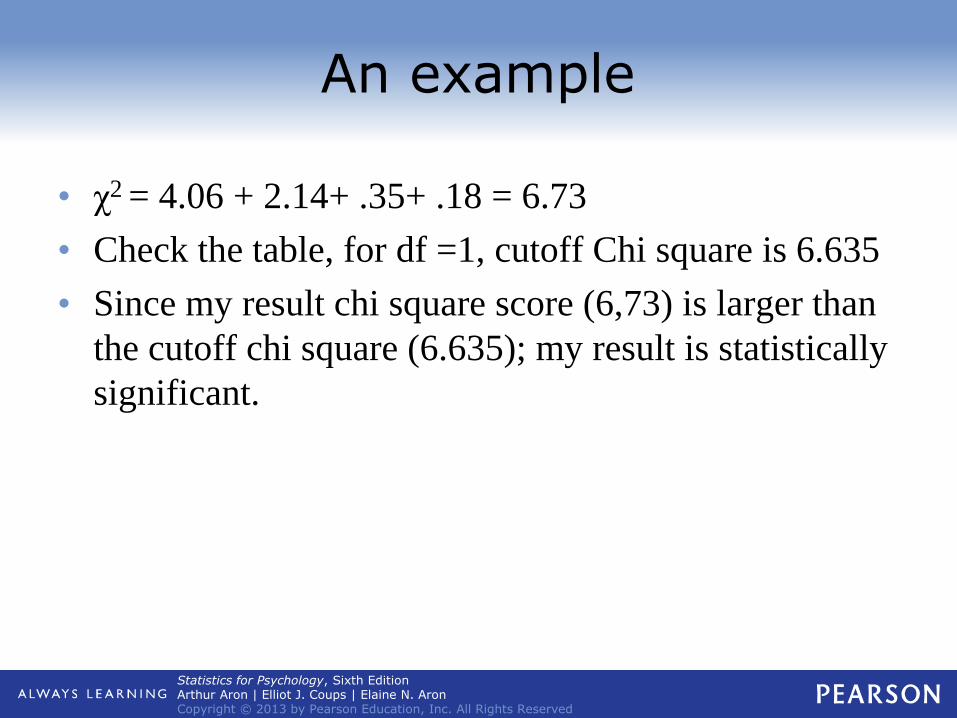
• χ2 = 4.06 + 2.14+ .35+ .18 = 6.73
• Check the table, for df =1, cutoff Chi square is 6.635
• Since my result chi square score (6,73) is larger than
the cutoff chi square (6.635); my result is statistically
significant.

Statistics for Psychology, Sixth EditionArthur Aron | Elliot J. Coups | Elaine N. AronCopyright © 2013 by Pearson Education, Inc. All Rights Reserved
End of Chapter 13