Statistics and Information TechnologyStatistics and Information Technology. Werner Stuetzle...
30
9/24/2009 1 Statistics and Information Technology Werner Stuetzle Professor and Chair, Statistics Adjunct Professor, Computer Science and Engineering University of Washington Prepared for NSF Workshop on Statistics: Challenges and Opportunities for the 21st Century.
Transcript of Statistics and Information TechnologyStatistics and Information Technology. Werner Stuetzle...

9/24/2009 1
Statistics and Information Technology
Werner StuetzleProfessor and Chair, StatisticsAdjunct Professor, Computer Science and EngineeringUniversity of Washington
Prepared for NSF Workshop on Statistics: Challenges and Opportunities for the 21st Century.

9/24/2009 2
Introduction
So far, have heard about
• Statistics and the Biological Sciences
• Statistics and the Geophysical and Environmental Sciences
• Statistics and the Social and Economic Sciences
• Engineering and Industrial Statistics
What other --- technology related --- research areas are there, in which statistical ideas are playing an important role?
Note: “Statistical ideas”, not “Statisticians”
9/24/2009 3
What other --- technology related --- research areas are there, in which statistical ideas are playing an important role?
(Incomplete and unordered list)
• Computer vision
• Medical imaging
• Speech recognition
• Computer graphics
• Genomics (“Biology is an Information Science”)
• Document organization and retrieval
• Analysis and monitoring of networks
• Customer modeling and transaction analysis
• Finance (Comment on data mining and machine learning)
9/24/2009 4
Outline of talk• 3D photography: a case study in the application of ideas fromMathematics and Statistics to problems in computer graphics / computer vision
• Selected examples for use of statistical ideas in other technologyrelated research areas
• Positioning Statistics to take advantage of opportunities
9/24/2009 5
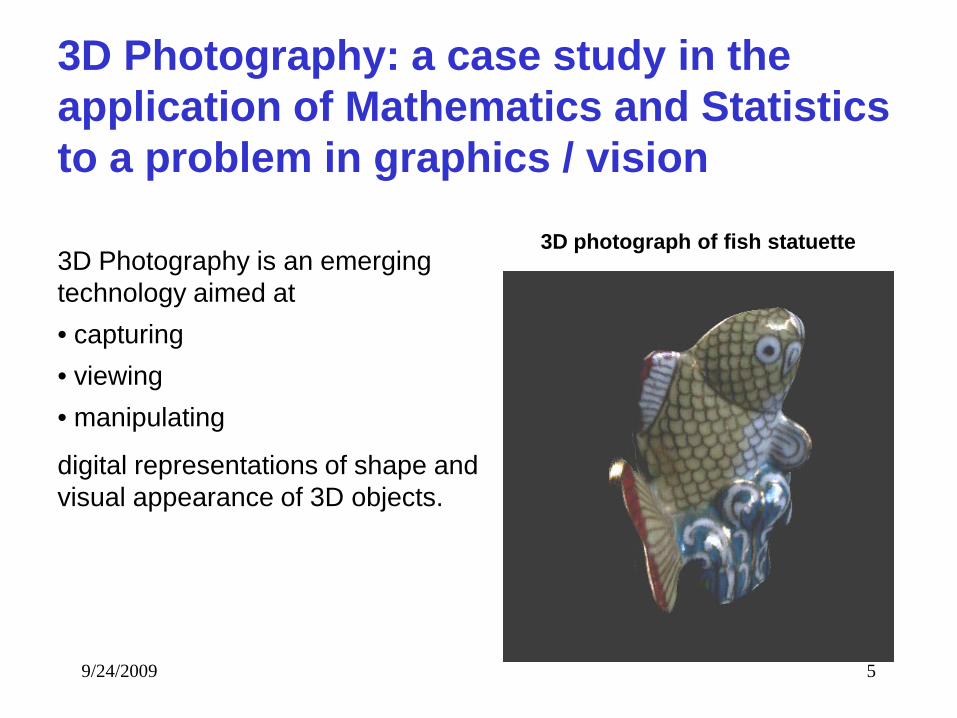
3D Photography: a case study in the application of Mathematics and Statisticsto a problem in graphics / vision
3D Photography is an emerging technology aimed at• capturing• viewing• manipulating
digital representations of shape and visual appearance of 3D objects.
3D photograph of fish statuette
9/24/2009 6
3D Photography has potential for large impact because 3D photographs can be
• stored and transmitted digitally
• viewed on CRTs
• used in computer simulations,
• manipulated and edited in software, and
• used as templates for making electronic or physical copies
Will now present some illustrations.
9/24/2009 7
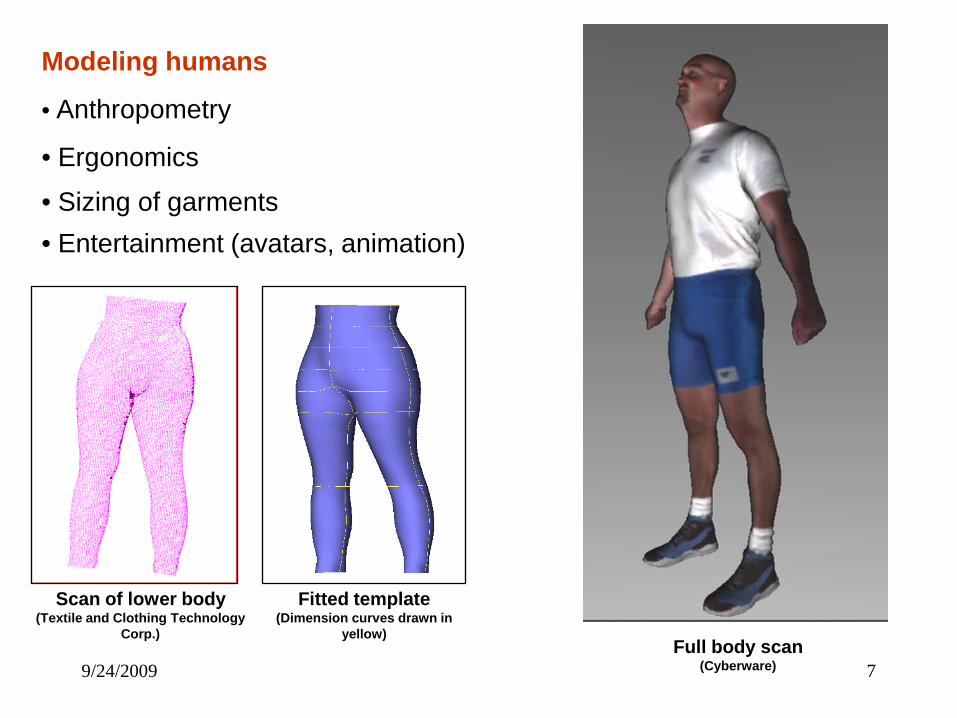
Modeling humans
• Anthropometry
• Ergonomics
• Sizing of garments• Entertainment (avatars, animation)
Scan of lower body(Textile and Clothing Technology
Corp.)
Fitted template(Dimension curves drawn in
yellow)Full body scan
(Cyberware)
9/24/2009 8
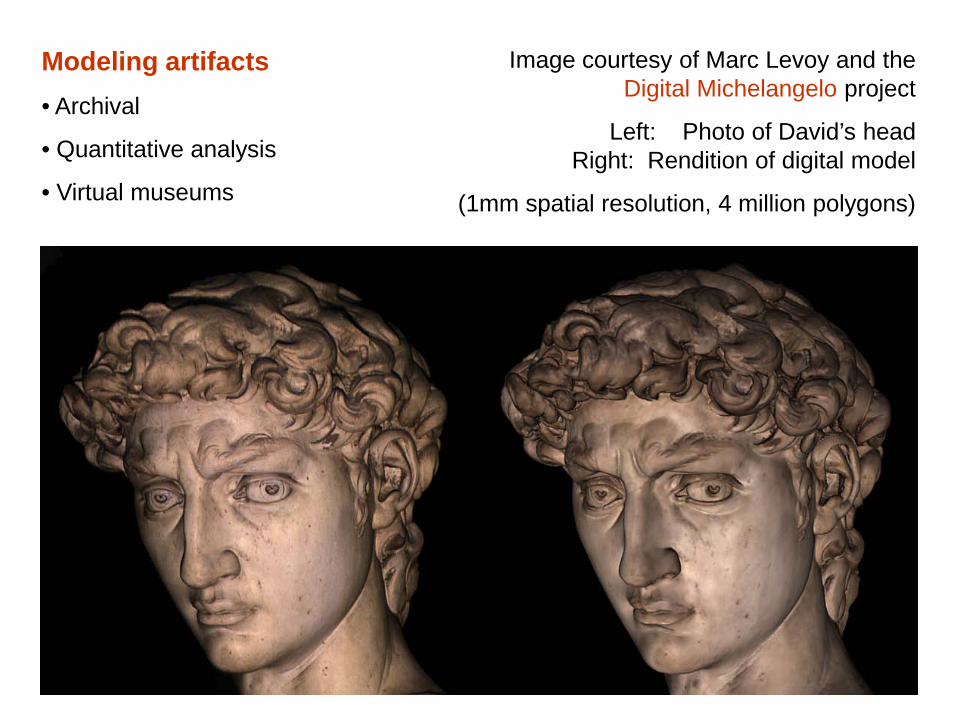
Modeling artifacts• Archival
• Quantitative analysis
• Virtual museums
Image courtesy of Marc Levoy and the Digital Michelangelo project
Left: Photo of David’s headRight: Rendition of digital model
(1mm spatial resolution, 4 million polygons)

9/24/2009 9
Modeling artifacts Images courtesy of Marc Rioux and the Canadian National Research Council
Nicaraguan stone figurine Painted Mallard duck
9/24/2009 10
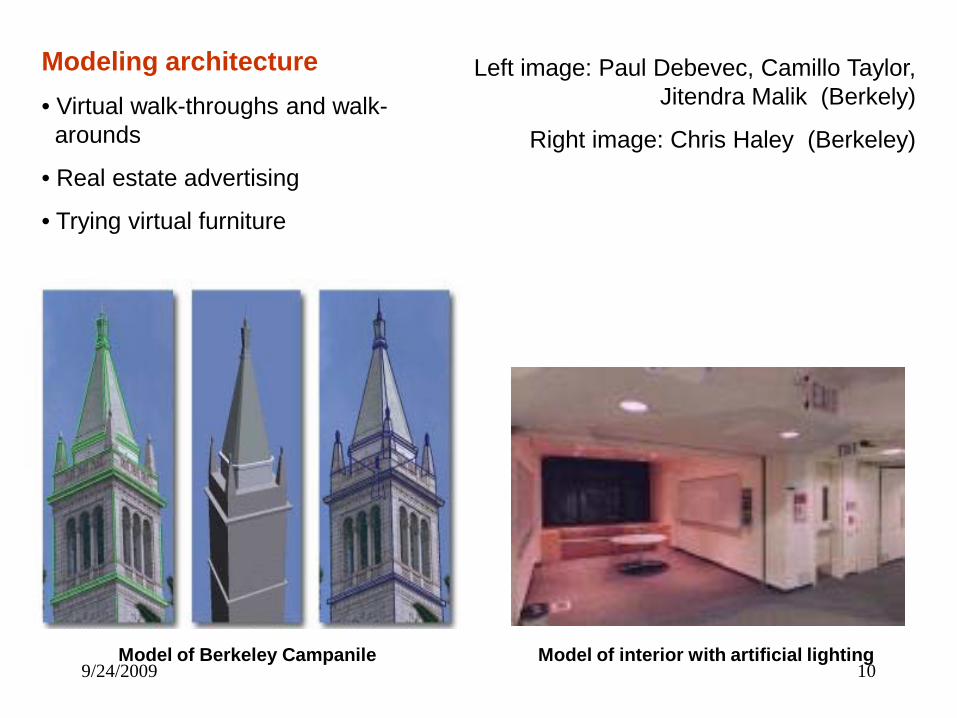
Modeling architecture• Virtual walk-throughs and walk-arounds
• Real estate advertising
• Trying virtual furniture
Left image: Paul Debevec, Camillo Taylor, Jitendra Malik (Berkely)
Right image: Chris Haley (Berkeley)
Model of Berkeley Campanile Model of interior with artificial lighting

9/24/2009 11
Modeling environments• Virtual walk-throughs and walkarounds
• Urban planning
Two renditions of model of MIT campus(Seth Teller, MIT)
9/24/2009 12
What does 3D Photography have to do with Statistics?
We have data:
• 3D points acquired by range scanner
and / or
• Digital images of scene
We want to build a model for scene geometry and “color”.
Admittedly:
• Data is not standard “cases by variables” or time series
• Noise is not a dominant aspect of the problem
This does not mean that Statistics has nothing to contribute.
9/24/2009 13
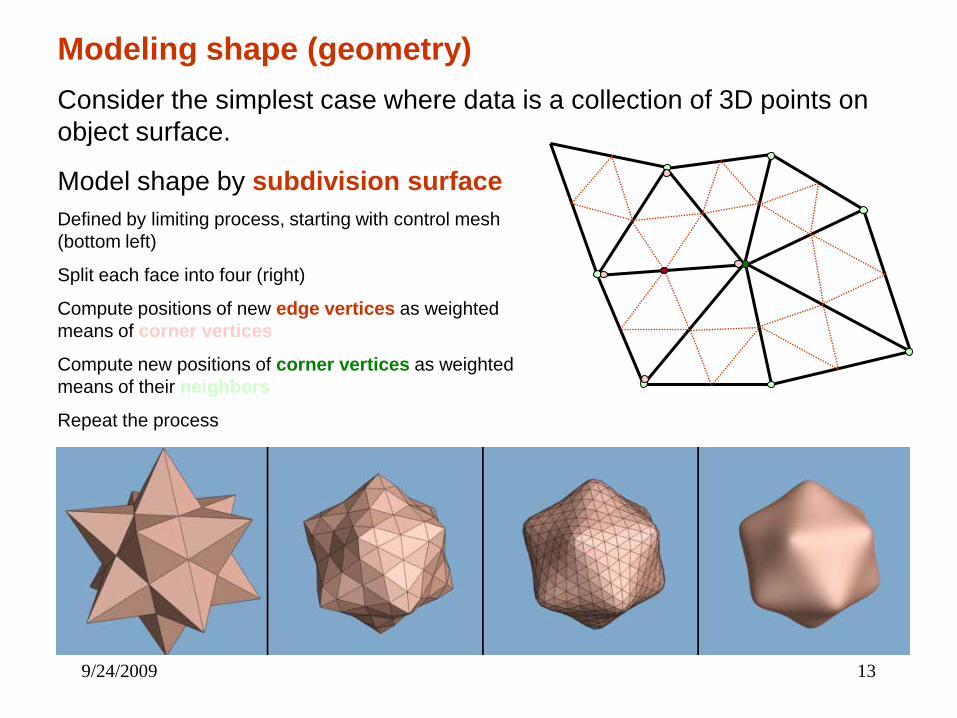
Modeling shape (geometry)Consider the simplest case where data is a collection of 3D points on object surface.
Model shape by subdivision surfaceDefined by limiting process, starting with control mesh (bottom left)
Split each face into four (right)
Compute positions of new edge vertices as weighted means of corner vertices
Compute new positions of corner vertices as weighted means of their neighbors
Repeat the process
9/24/2009 14
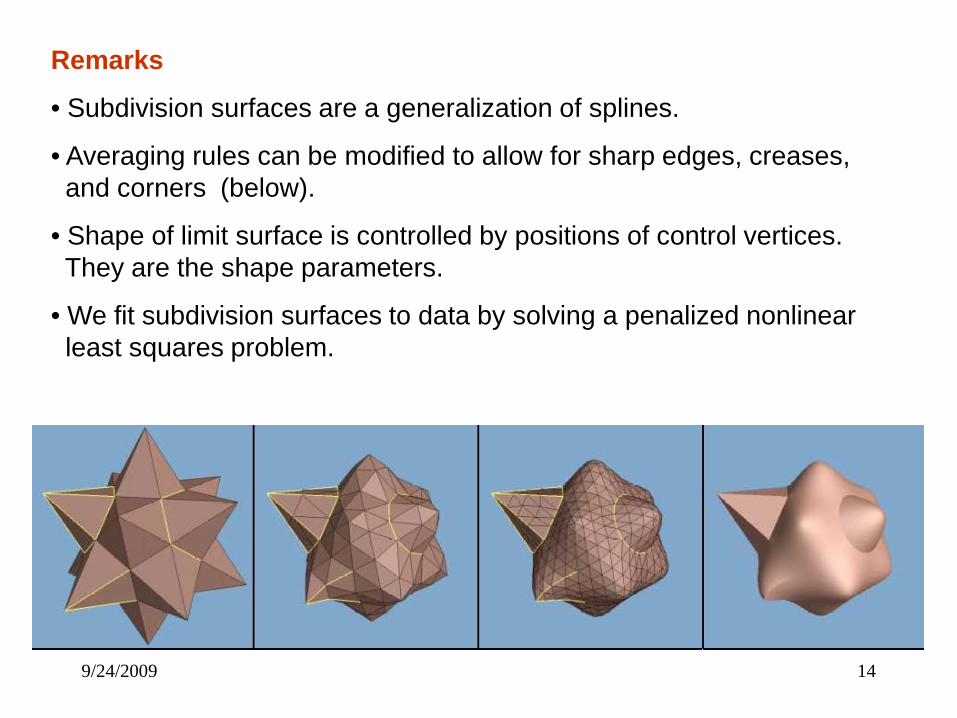
Remarks
• Subdivision surfaces are a generalization of splines.
• Averaging rules can be modified to allow for sharp edges, creases,and corners (below).
• Shape of limit surface is controlled by positions of control vertices.They are the shape parameters.
• We fit subdivision surfaces to data by solving a penalized nonlinearleast squares problem.

9/24/2009 15
9/24/2009 16
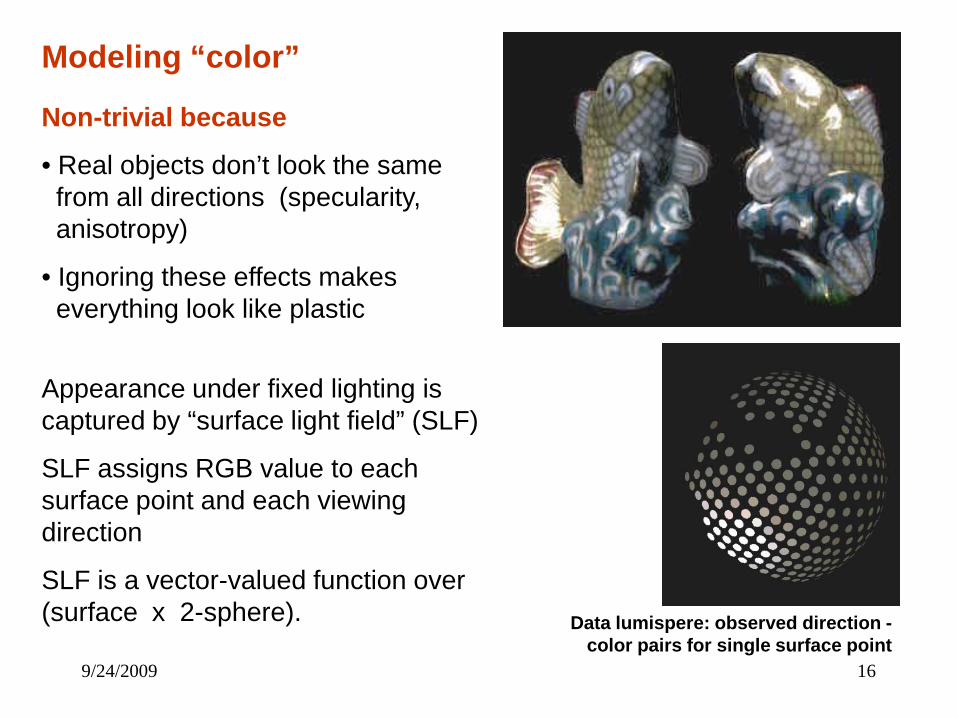
Modeling “color”
Non-trivial because
• Real objects don’t look the samefrom all directions (specularity,anisotropy)
• Ignoring these effects makeseverything look like plastic
Appearance under fixed lighting is captured by “surface light field” (SLF)
SLF assigns RGB value to each surface point and each viewing direction
SLF is a vector-valued function over (surface x 2-sphere). Data lumispere: observed direction -
color pairs for single surface point
9/24/2009 17
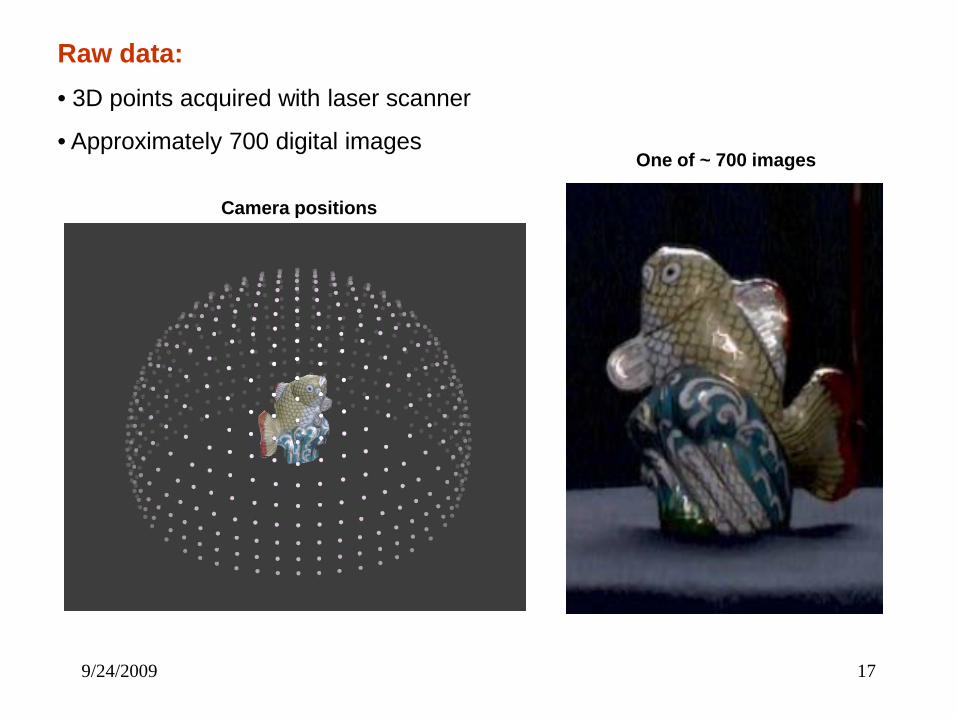
Raw data:• 3D points acquired with laser scanner
• Approximately 700 digital images
Camera positions
One of ~ 700 images

9/24/2009 18
After modeling geometry and pre-processing images we have:
• Triangular mesh with 1,000’s ofvertices
• Collection of (direction, RGB value)pairs for each vertex
Issues
• Interpolation / smoothing on generalmanifolds
• Compression: uncompressed SLFfor fish is about 170 MB
• Real time rendering non-trivial
Mesh generated from fish scans
9/24/2009 19
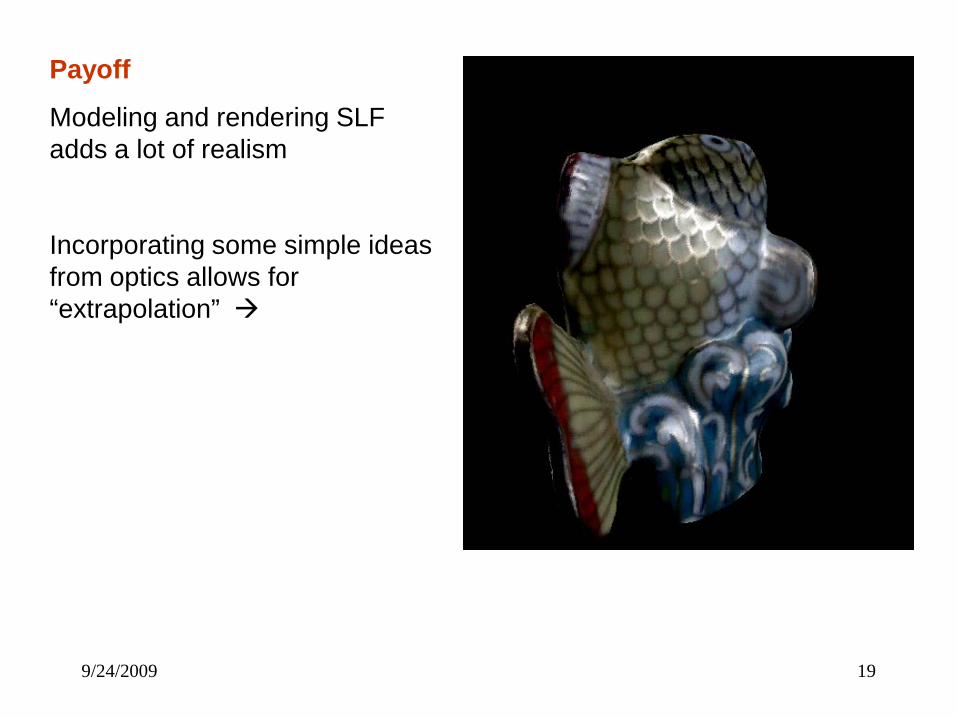
Payoff
Modeling and rendering SLF adds a lot of realism
Incorporating some simple ideas from optics allows for “extrapolation”
9/24/2009 20
Contributions of Statistics
1. General approach
• We have a set of data - surface points produced by the sensor.
• We want to “fit a parametric model” to these data, in our case a 2Dmanifold.
• Parameters of model control shape of the manifold.
• We define a goodness-of-fit measure quantifying how well modelapproximates data.
• We then find the best parameter setting using numericaloptimization.
9/24/2009 21
Contributions of Statistics
2. More specific methods and theory
• Linear and nonlinear least squares• Regularization (ridge regression, penalized PCA, spline smoothing)• Principal surfaces• Clustering, vector quantization
9/24/2009 22
Selected examples for use of statistical ideas in other technology related research areas
Medical imaging: Reconstructing the human heart from ultrasound data
• Data that are sparse and noisy
• Build detailed model of imaging process
• Fit surface model instead of working “slice by slice” and thengluing slices together (uses spatial contiguity)
• Incorporate prior information about shape: deformable template +Bayesian analysis using empirical prior distribution for shapeparameters
9/24/2009 23
Computer vision: Face recognition in images
• To recognize a face independent of pose probably need 3D model of head
• Want to build model from one or a few photographs
• Prior information on head shape has to be built into the modelingprocess
Computer graphics: Posing humans
A non-standard prediction problem
Trainig data: High resolution 3D scans of- few subjects in many poses, and- many subjects in few poses
Goal: Generate a rule to predict the shape of a new (test) subjectin a target pose from the scan in a different pose.
9/24/2009 24
Customer modeling and transaction analysis: Recommender systems
A non-standard prediction problem
Given a sparsely populated matrix
R[ i, j ] = rating of product j by consumer i,
and attributes for products and consumers, predict the missingelements of R.
Document organization and retrieval: Topic detection and tracking
Given a (dynamic) collection of text documents, partition the collection into topics and track the appearance and disappearance of topics over time.

9/24/2009 25
Positioning Statistics to take advantage of opportunities
Characteristics exhibited by the examples
• Non-standard data --- not cases x variables or time series
• Images
• Text
• Streaming data
• Emphasis on description and prediction, not on inference
• Algorithm development, implementation, and testing is large part ofresearch

9/24/2009 26
To take advantage of opportunities, Statistics has to change its self-image:
• The goal of Statistics is to develop tools for analyzing data.Statistics is an Engineering discipline.Methodology is its core.
• Development of a tool has to start with a problem that the toolis supposed to address. This indicates the need for collaborativeresearch which can
• stimulate research in statistical methodology and theory;• benefit the application area;• create a constituency for Statistics.
9/24/2009 27
• Tools are implemented and assessed on the computer.In methodology research Computer Science plays a role that iscomparable to the role of Mathematics.
• Assesssment is an integral part of tool development. Tools can be assessed using mathematical analysis, or empirically (Princeton Robustness Study)
• The traditional focus of Statistics on one particular aspect of dataanalysis, namely dealing with variability, is unnecessarily restrictiveas well as unfortunate.

9/24/2009 28
To take advantage of opportunities, Statistics has to change the way in which it recruits and trains students:
• Ph.D. programs currently focus on training and research instatistical theory and applications.
• Therefore, we select for students with background and interestin Mathematics.
• We should also prepare students for methodology research.
• We should select students with background and interest incomputing and in collaborative research.
9/24/2009 29
Other disciplines are seizing the opportunity and taking the butter off our bread.
• Either adopt “policy of the small flock” or
• Meet the challenge

9/24/2009 31
Modeling color
• We are given a collection of data lumispheres (direction – colorpairs)
• We find a low dimensional subspace of piecewise linear functionson the sphere.
• We aproximaten data lumispheres by their projections on thesubspace -> imputation, compression.