1.40 150 Statistics (GENS SP) 52w high/low (SGD) 1.30 BUY ...
3.29
September 11, 2020
Technolo
gy
Sin
gapore
THIS REPORT HAS BEEN PREPARED BY MAYBANK KIM ENG RESEARCH
SEE PAGE 14 FOR IMPORTANT DISCLOSURES AND ANALYST CERTIFICATIONS
Co. Reg No: 198700034E MICA (P) : 099/03/2012
ESG Tear Sheet Insert
Gene Lih Lai, CFA [email protected] (65) 6231 5832
AEM Holdings (AEM SP)
Buy the dip
Capturing upside opportunities; TP +19%; BUY
AEM raised FY20 revenue guidance to SGD480-500m from SGD460-480m.
We raise FY20-22E EPS by 5-7% to account for this. We now value AEM at
14x FY21E P/E, from ROE-g/COE-g derived 5x blended FY20-21E P/B, to
better account for: i) upside from system-level test’s structural growth
prospects from new customers/ stronger-than-expected order
momentum; and ii) potential for valuation gap to narrow against global
peers due to increasing international investor participation. BUY.
Continued relevance with key customer
Takeaways from Intel’s Architecture Day include that Intel will continue
to decouple design from process technology, as well as focus on
advanced packaging technologies to drive leadership products. We
believe this is favourable to AEM as heterogeneously packaged chips
come with testing challenges at the wafer level that can be overcome by
SLT at the packaged level to ensure product reliability.
Exciting end-markets beckon
Automotive and edge computing are growth markets where system level
test (SLT) is advantageous, but we believe AEM has little to no
penetration yet. Automotive chips are challenging to test given
requirements for zero defect and high thermal reliability. AEM presented
at the SEMI SEA 2020 conference on how its asynchronous, modular and
massively parallel approach to SLT can tackle these challenges in a cost-
effective way. We walked away with a greater appreciation for AEM’s
AMPS solution, and believe exciting end-markets beckon for AEM.
Potential for valuation rerating
We believe 14x FY21E is appropriate to value AEM to account for: i) its
market-leading SLT solution; and ii) attractive SLT growth prospects, but
remains at a discount to global peers at 17x, to factor in customer-
concentration risks. We now favour using P/E over ROE-g/COE-g derived
P/B as this overcomes: i) under-reflected ROE generation due to strong
cash build; ii) unquantifiable ROEs from new and potential customers;
and iii) potential re-rating sparked by an incrementally global investor
base if earnings growth paves the way for USD1b market cap and higher.
Share Price SGD 3.29
12m Price Target SGD 5.05 (+56%)
Previous Price Target SGD 4.26
BUY
Company Description
Statistics
52w high/low (SGD)
3m avg turnover (USDm)
Free float (%)
Issued shares (m)
Market capitalisation
Major shareholders:
5.0%
5.0%
4.9%
273
15.3
AEM manufactures equipment used in the
semiconductor back-end process
Toh Ban Leng James
Aberdeen Standard Investments (Asia) Ltd
UBS Group AG
4.29/1.12
76.9
SGD899.2M
USD658M
Price Performance
0
100
200
300
400
500
600
700
800
0.50
1.00
1.50
2.00
2.50
3.00
3.50
4.00
4.50
Sep-18 Dec-18 Mar-19 Jun-19 Sep-19 Dec-19 Mar-20 Jun-20
AEM Holdings - (LHS, SGD) AEM Holdings / Straits Times Index - (RHS, %)
-1M -3M -12M
Absolute (%) (22) 5 196
Relative to index (%) (21) 18 274
Source: FactSet
FYE Dec (SGD m) FY18A FY19A FY20E FY21E FY22E
Revenue 262 323 492 517 541
EBITDA 42 70 112 126 133
Core net profit 33 53 88 99 105
Core FDEPS (cts) 12.3 19.4 32.0 36.0 38.4
Core FDEPS growth(%) 3.4 58.3 64.8 12.6 6.5
Net DPS (cts) 3.4 5.1 8.0 9.0 9.6
Core FD P/E (x) 6.7 10.4 10.3 9.1 8.6
P/BV (x) 2.5 4.1 4.5 3.3 2.6
Net dividend yield (%) 4.1 2.5 2.4 2.7 2.9
ROAE (%) 45.5 47.3 52.5 41.7 33.6
ROAA (%) 26.6 29.1 32.9 28.8 25.0
EV/EBITDA (x) 4.0 6.3 6.7 5.4 4.5
Net gearing (%) (incl perps) net cash net cash net cash net cash net cash
Consensus net profit - - 89 96 99
MKE vs. Consensus (%) - - (1.7) 3.3 6.7
September 11, 2020 2
AEM Holdings
Business Model & Industry Issues
As an equipment maker, AEM is inherently exposed to environmental, workplace safety, and socio-economic risks. AEM has
had zero incidences of environmental non-compliance, as well as zero substantiated cases of corruption and legal
compliance issues in 2019.
From an environmental and social perspective, AEM screens all of its suppliers. AEM constantly strives to be more efficient
with electricity usage, and ensures employees are well trained and remunerated fairly.
AEM is recognised for good transparency with shareholders, while still being able to balance business requirements (e.g.
respecting non-disclosure agreements).
AEM has several new products in the pipeline and it is engaging customers for more. In our view, this is the key for
economic sustainability, as well as for development of its own employees.
Material E issues
AEM’s environmental exposure is through energy, water
and inputs (fabricated parts and electronics).
AEM adheres to all National Environment Agency laws and
regulations and has not had incidences of environmental
non-compliance over the past 10 years.
Further, AEM’s constant energy-saving initiatives efforts
has resulted in energy consumption rising in only 7.5% (in
kWh) in 2019 despite a 23% increase in revenue.
AEM screens suppliers for negative environmental and
social impacts, including pollutions, biodiversity loss,
global warning, incidences of child labour, breaches of
customer privacy, and more. All eight key fabrication
suppliers and 23 key standard part suppliers were found to
have no negative environmental or social impacts.
Key G metrics and issues
The board has seven directors, of which one is the
executive chairman, four are independent directors
(57%), and two are non-independent, non-executive.
All the directors are male.
The audit & risk management, remuneration, and
nominating committees are chaired by independent
directors. The strategy committee, which works with
management on long-term strategic planning, is
chaired by the executive chairman.
Executive chairman Mr. Loke Wai San plans to return to
a non-executive chairman role from 1 Jan-20.
Key management compensation (comprising the Board
and senior management) accounted for 27% of staff
costs in 2019 (2018:17%). FY19 profit was 58% higher
YoY.
In 2019, AEM won “Most Transparent Company Award,
Technology” and was runner up for the “Singapore
Corporate Governance Award” by SIAS. AEM regularly
updates on its sales guidance and orders received and
it’s active in engaging with the investment community.
Zero substantiated cases of corruption or legal
compliance issues in 2019, to be maintained in 2020.
AEM was granted two patents in 2019, and staff were
involved rewarded. AEM views its considerable
engineering development revenue as a positive sign of
customer satisfaction and relationship.
Material S issues
AEM values talent retention. One approach is through
wages. In Malaysia, where around a-third of production
takes place, AEM’s entry wages for production workers
have been higher than the minimum wage at least since
2017, to retain employees. Entry wages are also higher
than minimum wages in the US and China.
Workforce diversity. AEM is an equal-opportunities
employer. Management are hired from local communities
and consists of various nationalities. 86% of management
are local across AEM’s footprint globally.
Workplace safety. AEM trains its employees on health and
safety work practices. In 2018, there was 1 minor injury.
In 2019, average training per employee was 15.7 hours, or
7,590 hours in total, to equip staff with skills across
technical, project management and software domains.
Females comprise 22-23% of the total work force, and 19-
23% of new hires since 2017.
Turnover rate per month ranged from 1.1-2.1% in FY17-19.
2020 target is to maintain turnover rate at below 1.5% a
month.
September 11, 2020 3
AEM Holdings
Forecasts and TP revisions
Fig 1: Forecast revisions
FY20E FY21E FY22E
New Old Chg (%) New Old Chg (%) New Old Chg (%)
Revenue (SGDm) 491.5 471.3 4.3 517.3 497.1 4.1 541.3 519.4 4.2
Gross profit (SGDm) 194.6 186.1 4.6 210.5 201.3 4.6 223.0 213.0 4.7
EBIT (SGDm) 104.1 98.5 5.6 117.5 111.4 5.4 125.2 117.3 6.7
EBITDA (SGDm) 108.7 106.6 2.0 122.1 119.2 2.4 129.6 126.2 2.7
Core net profit (SGDm)
87.9 83.3 5.5 99.0 94.0 5.3 105.4 98.9 6.6
EPS (SGD) 0.32 0.30 5.4 0.36 0.34 5.2 0.38 0.36 6.5
Chg (ppt)
Chg (ppt)
Chg (ppt)
Gross margin 39.6% 39.5% 0.1 40.7% 40.5% 0.2 41.2% 41.0% 0.2
Staff cost as % of sales 13.7% 13.7% 0.0 13.7% 13.7% 0.0 14.0% 14.0% 0.0
Source: Maybank Kim Eng
We raise FY20-22E EPS by 5-7% to account for the latest revision in guidance. We
switch our valuation methodology from ROE-g/COE-g derived P/B to P/E as we
believe this enables us to better gauge AEM’s fair value. Our rationales include:
Strong cash build under-reflects ROE generation. AEM’s business is asset
light and its key enablers lie in its human capital as well as IPs (e.g.
HDMT test handler, proprietary FPGA for Inspirain). Based on projected
cash-generation, we expect AEM to maintain net-cash to equity above
70% throughout our forecast period. While this cash-hoard is strategic
for potential acquisition opportunities, it under-reflects AEM’s ROEs and
penalizes derived multiples from the ROE-g/COE-g approach.
Capturing unquantifiable earnings upside risks. In our view, upside to
current forecasts stem from: i) better-than-expected order momentum
in the short term; and ii) new customers in the long term. Such upside is
not quantifiable, but we believe are legitimate factors to consider in
arriving at a holistic view of AEM’s future economic opportunities. We
continue to favour SLT’s growth prospects, in particular in markets such
as edge computing and electric and/or autonomous driving, where SLT’s
propositions are attractive, but penetration is still low.
Re-rating opportunities from global investors. With continued earnings
growth, we believe AEM may eventually achieve USD1b in market cap
and more. This may unlock the opportunity for increased global investor
participation, along with more global perspectives of AEM’s growth
prospects. We believe this may in turn spark a re-rating for AEM’s P/E
multiples to narrow the gap compared to global peers.
AEM is trading at 9x FY21E P/E, and our TP is based on 14x. We believe 14x is fair
given: i) AEM’s market leading SLT capabilities; and ii) structural growth
prospects for SLT, including with the key customer; yet iii) it remains at a
discount compared to global peers trading at around 17x, to account for single-
customer concentration.
In the shorter term, we believe weaker-than-expected FY21E order momentum is
a key risk. This may be due to a challenging macro environment and/or our
concern that some equipment orders may be pushed out to FY22 alongside the
delay of Intel’s 7nm products. We are also mindful of faster-than-expected
market share loss at Intel, as this may translate to lost chip volumes that could
otherwise underpin more resilient equipment order momentum.

September 11, 2020 4
AEM Holdings
Takeaways from Intel Architecture Day
Intel updated on its progress on its six pillars of technology innovation1 strategy
at its Architecture Day on 13-Aug. Highlights from the event, as well as
Digitimes’ exerpts of the Q&A session during the event include:
Intel’s growth drivers over the next 3-5 years - Intel’s six pillars of
technology innovation will remain the key driver of growth. Intel says it
is the only company with investments and IPs in the transistor,
architecture and software sectors. Intel is confident this will continue to
sustain competitiveness along with the development of new offerings.
Moore’s law is alive - Intel believes there is a lot more transistor density
to come. At the same time, it believes that user experience
improvements can still double every 2-3 years through innovations in
packaging technologies, architectures and software solutions on top of
improving transistor manufacturing processes.
Intel’s overall architecture strategy - Data analysis, edge computing and
AI are driving the development of diverse compute applications from the
edge to the cloud. Intel offers a mix of scalar, vector, matrix and spatial
architectures deployed in CPU, GPU, accelerator and FPGA sockets,
which are unified by oneAPI, an industry-standard open programming
model to simplify application development.
Process technology - Intel unveiled its 10nm SuperFin, which delivers
performance improvement in the vicinity of 15-20%, and comparable to
a full node transition. Its upcoming Tiger Lake SoC is based on 10nm
SuperFin technology. (see Fig 2)
Advanced packaging - Intel highlighted its roadmap to scale bump pitch
for existing technologies (e.g. EMIB and Foveros) and also introduced
die-on-wafer “Hybrid Bonding”, which enables bump pitches of 10
microns and below, delivering higher interconnect density and
bandwidth, along with lower power. Intel also detailed combining both
EMIB and Foveros technologies in what it calls Co-EMIB, which allows for
two or more Foveros elements to be connected with no loss of
performance compared with a standard planar design. (see Fig 3)
Client 2.0 - Intel laid out a vision of the future of its client products in
the 2024+ timeframe, encapsulated in something it calls Client 2.0.
Contrasting the one-size-fits-all approach of the past (Client 1.0), Client
2.0 provides more immersive and custom-tailored computing
experiences through the ability to mix and match IPs/functions to
processes. Client 2.0 also aims to cut development time to 1 year, from
3-4 from the monolithic die approach, and has significant lesser bugs.
(see Fig 4 & 5).
1 Intel’s six pillars of technology innovation are i) process & packaging; ii) XPU architecture; iii) memory; iv) interconnect; v) security and vi) software

September 11, 2020 5
AEM Holdings
Fig 2: Intel SuperFin delivers nearly 20% of performance improvement, comparable to a full node transition
Source: Intel
Fig 3: Intel’s packaging technology roadmap
Source: Intel
Fig 4: Intel envisages a world where computing is immersive and personalised, which it dubs as Client 2.0
Source: Intel
Fig 5: Chiplets are able to cut down product development time and bugs significantly compared to monolithic approach.
Source: Intel
Opportunities for AEM
With Intel putting increasing emphasis on advanced packaging technologies, we
see increased relevance for SLT, in turn spelling opportunities for AEM.
For starters, heterogeneously packaged chips offer greater scope for
customization and complexity, which generally translate to lengthening test
times. With a heterogeneously packaged chip, even if each IP has 100% yield,
combining the different IPs to a package does not 100% coverage for the
package. As such SLT can be used to provide greater coverage. Heterogenously
packaged chips (in particular 3D-stacked chips) are also more vulnerable to
temperature-related defects compared to monolithic dies - hence, the need to
test for reliability at extreme temperatures.
Currently, a key industry challenge with chiplets is the ability to ensure known-
good die (i.e. chips, or in this case, chiplets, that are known to meet or exceed
required specifications). Generally, ensuring KGD is done by hot testing a
packaged part. However, with chiplets, the testing is essentially done on a bare
die (i.e. pre-packaged), and the chiplet must be tested at the same level of
capability as a packaged die. This increases challenges with probing because of
the extra fine pads to set the probes on. As chiplets face KGD issues, we believe
there will be an increasing reliance on SLT to capture defect chiplets at the
packaged level, as combining a defective chiplet with other good chiplets will
still result in a bad package.
In fact, we believe that with time, chipmakers will seek to address chiplet KGD
issues to avoid the cumulative yield loss from defect chiplets affecting good
chiplets combined with it. We do not rule out SLT at the wafer level as one of
the potential tools that can be employed to ensure that chips are fully tested,
qualified and reliable as to not jeopardize yield at the packaged level.

September 11, 2020 6
AEM Holdings
Takeaways from AEM’s presentation at SEMI SEA
Conference
We attended AEM’s presentation at the SEMI SEA 2020 conference in Aug-20,
entitled “System Level Test (SLT) for Automotive Devices – A Thermal
Perspective”. Our takeaways are as follows.
Testing automotive chips come with a few key challenges:
Chips are frequently made using advanced process nodes – which increases
the gap in test coverage.
Automotive chips are often mission critical – and system level tests typically
have long test times. As chips get increasingly mission critical, there is zero
tolerance for errors and requirements are now defective parts per billion
(DPPB) than defective parts per million (DPPM) in the past.
Chips that have complex packaging come with new fault modes that are
thermal related. Further, automotive parts are subject to more rigorous
temperature environments and swings.
AEM believes testing system level test, with massive parallelism and active
thermal control are the key to overcome these challenges, as:
System level test is able to simulate final application environment, and hence
is able to test for corner cases, which are even more pertinent for mission
critical devices.
To offset long-test times the solution requires high level of parallelism to
boost throughput to make SLT cost effective.
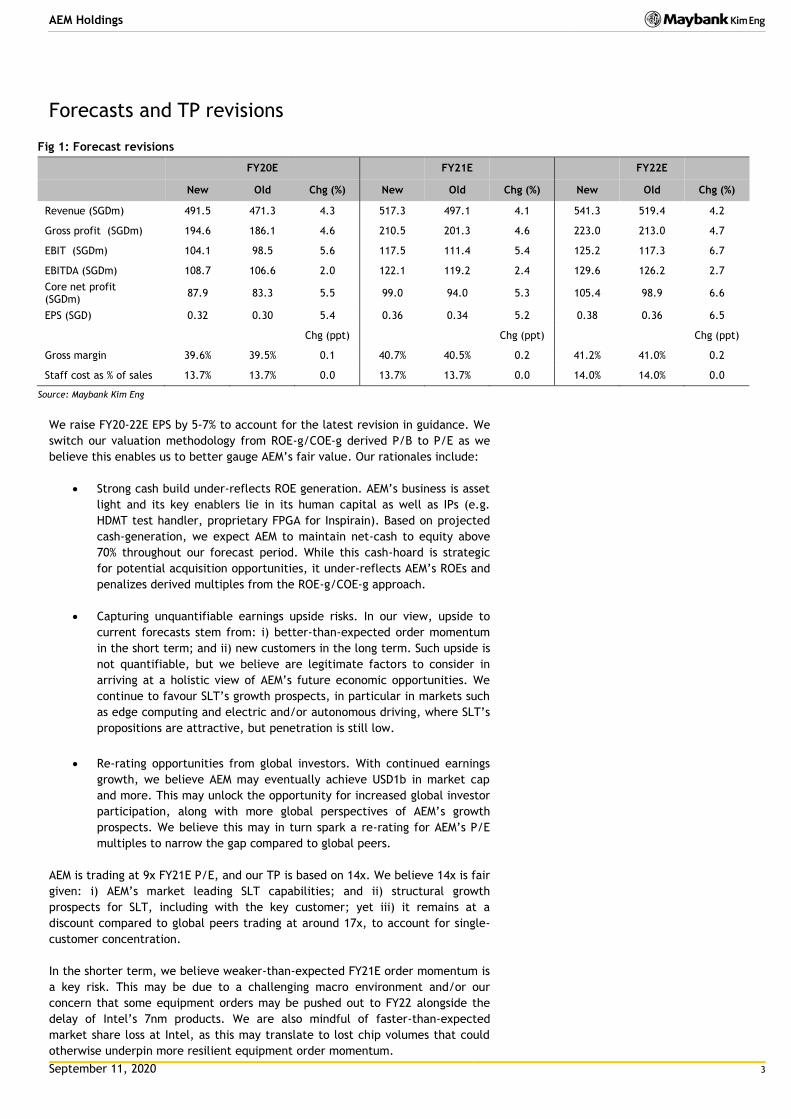
Active thermal control (ATC) on a per site basis allows for accurate
temperature for each device under test (DUT). AEM’s liquid cool solution is
able to test hundreds of DUTs simultaneously, each at different temperature.
This is advantageous over the chamber-based method, as in a large chamber,
it is challenging to enable high parallelism, given temperature variations are
likely higher due to uneven air flow. Liquid cooling is also more cost effective
for high parallelism test, and allows for high ramp rate and extreme
temperature swings, in addition of being good in handling extreme low
temperatures. AEM’s ATC solution for AMPS is architected to house up to 480
sites in a single handler, with temperature range from -40C to +125C.
September 11, 2020 7
AEM Holdings
Fig 6: AEM’s ATC solution allows for different temperatures across 100s of DUTs with tight tolerances
Source: AEM, SSIA
Additionally, AEM sees the benefits of an asynchronous, modular and massively
parallel approach due to the following:
Massive parallelism boosts handler utilization – Typically, SLT test times are
long. As such, the handler spends much of its time being idle – without
parallelism. A many-testers-to-one handler approach boosts handler
utilization.
Modularity allows for the system to easily scale up or down depending on
requirements. E.g., less testers-to-one handler approach can be used for
simple test with shorter test times, and more-testers-to-one handler
approach can cater for complex tests with longer test time.
Asynchronous operation allows for effective sharing of centralized resources
(e.g. centralized cooling system), which in turn enhances cost effectiveness.
AEM also explained its approach for modularity to scale between low and high-
volume environments:
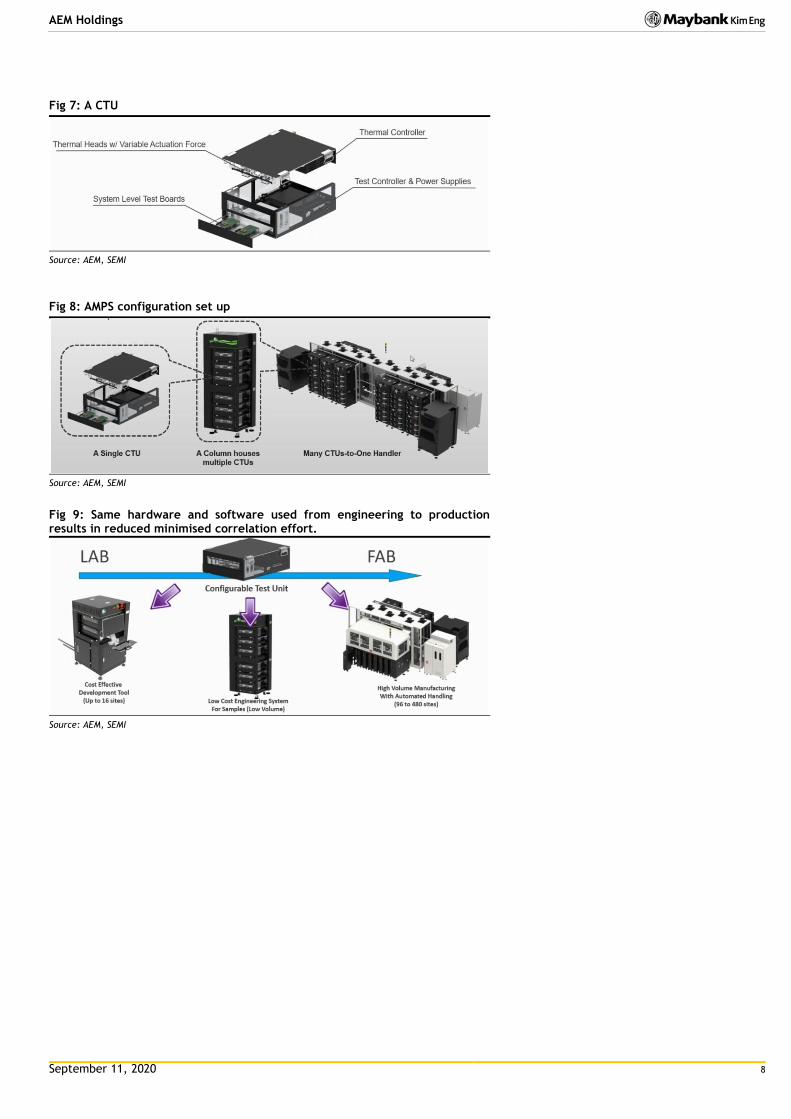
A configurable test unit consists of build-in hardware and software for test.
Each CTU operates as a complete asynchronous system, and is designed to
support a wide range of test temperatures. (see Fig 7).
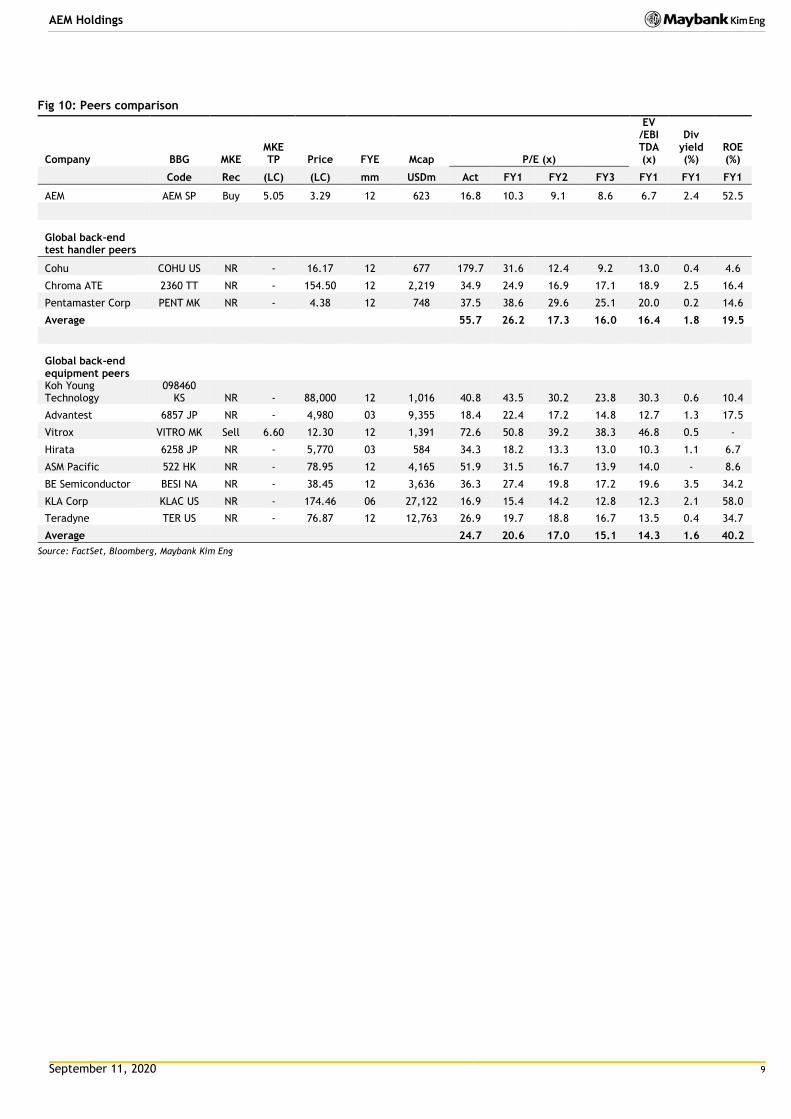
A column houses multiple CTUs in a stacked fashion. Fig 8 shows a many
CTUs-to-One handler approach.
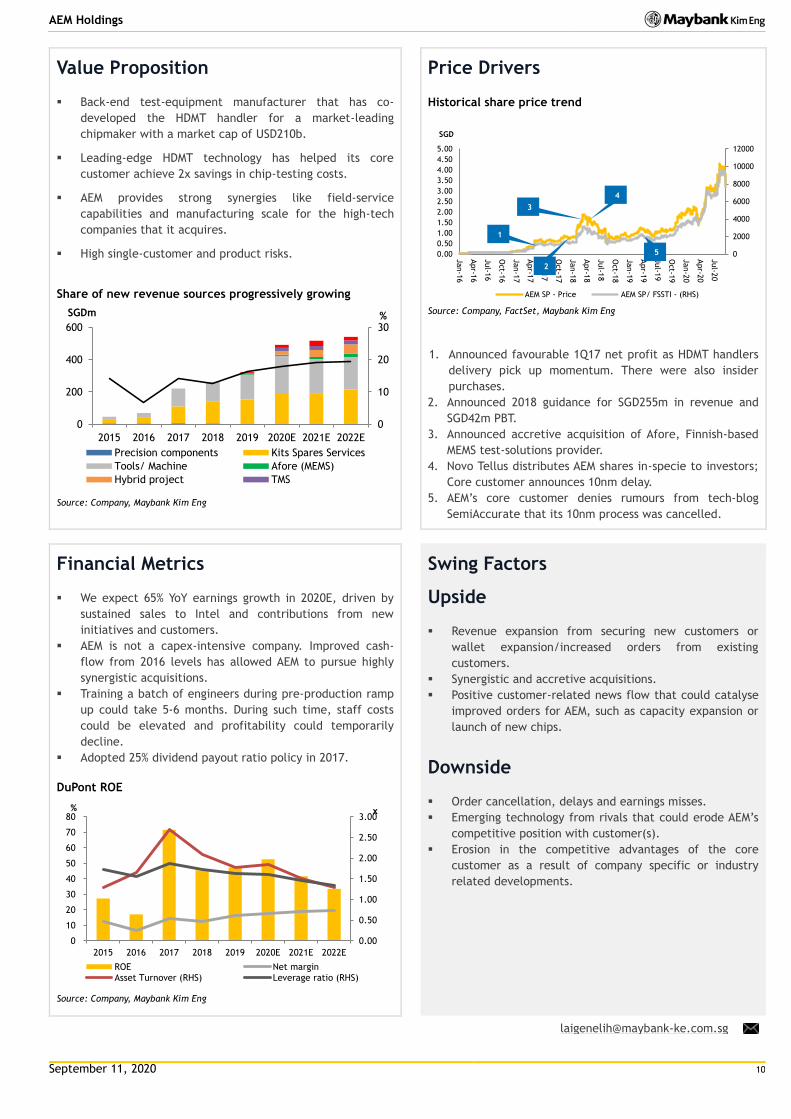
As the same hardware and software are used from engineering to production,
AEM’s AMPS solution is able to minimize correlation effort (see Fig 9).
September 11, 2020 8
AEM Holdings
Fig 7: A CTU
Source: AEM, SEMI
Fig 8: AMPS configuration set up
Source: AEM, SEMI
Fig 9: Same hardware and software used from engineering to production results in reduced minimised correlation effort.
Source: AEM, SEMI
September 11, 2020 9
AEM Holdings
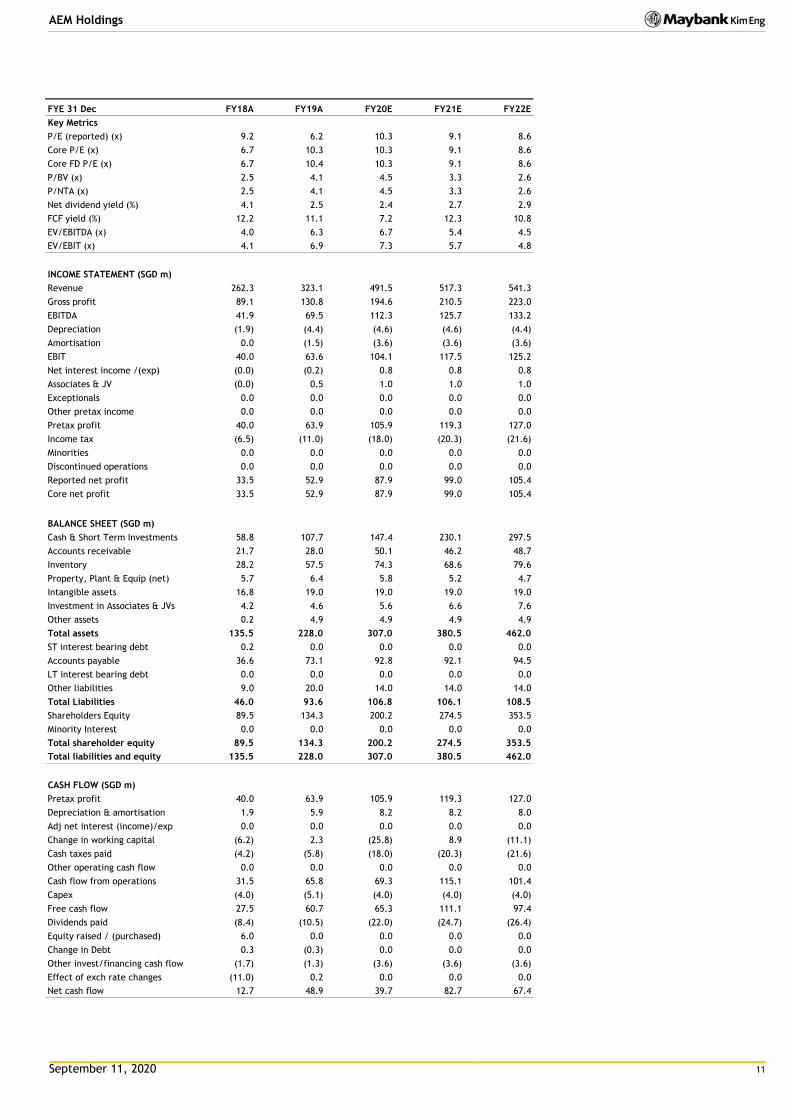
Fig 10: Peers comparison
Company BBG MKE MKE TP Price FYE Mcap P/E (x)
EV /EBITDA (x)
Div yield (%)
ROE (%)
Code Rec (LC) (LC) mm USDm Act FY1 FY2 FY3 FY1 FY1 FY1
AEM AEM SP Buy 5.05 3.29 12 623 16.8 10.3 9.1 8.6 6.7 2.4 52.5
Global back-end test handler peers
Cohu COHU US NR - 16.17 12 677 179.7 31.6 12.4 9.2 13.0 0.4 4.6
Chroma ATE 2360 TT NR - 154.50 12 2,219 34.9 24.9 16.9 17.1 18.9 2.5 16.4
Pentamaster Corp PENT MK NR - 4.38 12 748 37.5 38.6 29.6 25.1 20.0 0.2 14.6
Average 55.7 26.2 17.3 16.0 16.4 1.8 19.5
Global back-end equipment peers Koh Young Technology
098460 KS NR - 88,000 12 1,016 40.8 43.5 30.2 23.8 30.3 0.6 10.4
Advantest 6857 JP NR - 4,980 03 9,355 18.4 22.4 17.2 14.8 12.7 1.3 17.5
Vitrox VITRO MK Sell 6.60 12.30 12 1,391 72.6 50.8 39.2 38.3 46.8 0.5 -
Hirata 6258 JP NR - 5,770 03 584 34.3 18.2 13.3 13.0 10.3 1.1 6.7
ASM Pacific 522 HK NR - 78.95 12 4,165 51.9 31.5 16.7 13.9 14.0 - 8.6
BE Semiconductor BESI NA NR - 38.45 12 3,636 36.3 27.4 19.8 17.2 19.6 3.5 34.2
KLA Corp KLAC US NR - 174.46 06 27,122 16.9 15.4 14.2 12.8 12.3 2.1 58.0
Teradyne TER US NR - 76.87 12 12,763 26.9 19.7 18.8 16.7 13.5 0.4 34.7
Average 24.7 20.6 17.0 15.1 14.3 1.6 40.2
Source: FactSet, Bloomberg, Maybank Kim Eng
September 11, 2020 10
AEM Holdings
Value Proposition
Back-end test-equipment manufacturer that has co-
developed the HDMT handler for a market-leading
chipmaker with a market cap of USD210b.
Leading-edge HDMT technology has helped its core
customer achieve 2x savings in chip-testing costs.
AEM provides strong synergies like field-service
capabilities and manufacturing scale for the high-tech
companies that it acquires.
High single-customer and product risks.
Share of new revenue sources progressively growing
Source: Company, Maybank Kim Eng
Price Drivers
Historical share price trend
Source: Company, FactSet, Maybank Kim Eng
1. Announced favourable 1Q17 net profit as HDMT handlers
delivery pick up momentum. There were also insider
purchases.
2. Announced 2018 guidance for SGD255m in revenue and
SGD42m PBT.
3. Announced accretive acquisition of Afore, Finnish-based
MEMS test-solutions provider.
4. Novo Tellus distributes AEM shares in-specie to investors;
Core customer announces 10nm delay.
5. AEM’s core customer denies rumours from tech-blog
SemiAccurate that its 10nm process was cancelled.
Financial Metrics
We expect 65% YoY earnings growth in 2020E, driven by
sustained sales to Intel and contributions from new
initiatives and customers.
AEM is not a capex-intensive company. Improved cash-
flow from 2016 levels has allowed AEM to pursue highly
synergistic acquisitions.
Training a batch of engineers during pre-production ramp
up could take 5-6 months. During such time, staff costs
could be elevated and profitability could temporarily
decline.
Adopted 25% dividend payout ratio policy in 2017.
DuPont ROE
PBT (SGDm) 1H17 9M17 FY17
Actual 14.6 26.2 36.8
2nd updated guidance
35-37
1st updated guidance
25-27 32
Original guidance 6.5 17.5 24
Source: Company
Source: Company, Maybank Kim Eng
Swing Factors
Upside
Revenue expansion from securing new customers or
wallet expansion/increased orders from existing
customers.
Synergistic and accretive acquisitions.
Positive customer-related news flow that could catalyse
improved orders for AEM, such as capacity expansion or
launch of new chips.
Downside
Order cancellation, delays and earnings misses.
Emerging technology from rivals that could erode AEM’s
competitive position with customer(s).
Erosion in the competitive advantages of the core
customer as a result of company specific or industry
related developments.
0
10
20
30
0
200
400
600
2015 2016 2017 2018 2019 2020E 2021E 2022E
% SGDm
Precision components Kits Spares Services
Tools/ Machine Afore (MEMS)
Hybrid project TMS
0
2000
4000
6000
8000
10000
12000
0.00
0.50
1.00
1.50
2.00
2.50
3.00
3.50
4.00
4.50
5.00
Jan-1
6
Apr-1
6
Jul-1
6
Oct-1
6
Jan-1
7
Apr-1
7
Jul-1
7
Oct-1
7
Jan-1
8
Apr-1
8
Jul-1
8
Oct-1
8
Jan-1
9
Apr-1
9
Jul-1
9
Oct-1
9
Jan-2
0
Apr-2
0
Jul-2
0
SGD
AEM SP - Price AEM SP/ FSSTI - (RHS)
0.00
0.50
1.00
1.50
2.00
2.50
3.00
0
10
20
30
40
50
60
70
80
2015 2016 2017 2018 2019 2020E 2021E 2022E
x %
ROE Net marginAsset Turnover (RHS) Leverage ratio (RHS)
1 1
2
3
4
5
September 11, 2020 11
AEM Holdings
FYE 31 Dec FY18A FY19A FY20E FY21E FY22E
Key Metrics
P/E (reported) (x) 9.2 6.2 10.3 9.1 8.6
Core P/E (x) 6.7 10.3 10.3 9.1 8.6
Core FD P/E (x) 6.7 10.4 10.3 9.1 8.6
P/BV (x) 2.5 4.1 4.5 3.3 2.6
P/NTA (x) 2.5 4.1 4.5 3.3 2.6
Net dividend yield (%) 4.1 2.5 2.4 2.7 2.9
FCF yield (%) 12.2 11.1 7.2 12.3 10.8
EV/EBITDA (x) 4.0 6.3 6.7 5.4 4.5
EV/EBIT (x) 4.1 6.9 7.3 5.7 4.8
INCOME STATEMENT (SGD m)
Revenue 262.3 323.1 491.5 517.3 541.3
Gross profit 89.1 130.8 194.6 210.5 223.0
EBITDA 41.9 69.5 112.3 125.7 133.2
Depreciation (1.9) (4.4) (4.6) (4.6) (4.4)
Amortisation 0.0 (1.5) (3.6) (3.6) (3.6)
EBIT 40.0 63.6 104.1 117.5 125.2
Net interest income /(exp) (0.0) (0.2) 0.8 0.8 0.8
Associates & JV (0.0) 0.5 1.0 1.0 1.0
Exceptionals 0.0 0.0 0.0 0.0 0.0
Other pretax income 0.0 0.0 0.0 0.0 0.0
Pretax profit 40.0 63.9 105.9 119.3 127.0
Income tax (6.5) (11.0) (18.0) (20.3) (21.6)
Minorities 0.0 0.0 0.0 0.0 0.0
Discontinued operations 0.0 0.0 0.0 0.0 0.0
Reported net profit 33.5 52.9 87.9 99.0 105.4
Core net profit 33.5 52.9 87.9 99.0 105.4
BALANCE SHEET (SGD m)
Cash & Short Term Investments 58.8 107.7 147.4 230.1 297.5
Accounts receivable 21.7 28.0 50.1 46.2 48.7
Inventory 28.2 57.5 74.3 68.6 79.6
Property, Plant & Equip (net) 5.7 6.4 5.8 5.2 4.7
Intangible assets 16.8 19.0 19.0 19.0 19.0
Investment in Associates & JVs 4.2 4.6 5.6 6.6 7.6
Other assets 0.2 4.9 4.9 4.9 4.9
Total assets 135.5 228.0 307.0 380.5 462.0
ST interest bearing debt 0.2 0.0 0.0 0.0 0.0
Accounts payable 36.6 73.1 92.8 92.1 94.5
LT interest bearing debt 0.0 0.0 0.0 0.0 0.0
Other liabilities 9.0 20.0 14.0 14.0 14.0
Total Liabilities 46.0 93.6 106.8 106.1 108.5
Shareholders Equity 89.5 134.3 200.2 274.5 353.5
Minority Interest 0.0 0.0 0.0 0.0 0.0
Total shareholder equity 89.5 134.3 200.2 274.5 353.5
Total liabilities and equity 135.5 228.0 307.0 380.5 462.0
CASH FLOW (SGD m)
Pretax profit 40.0 63.9 105.9 119.3 127.0
Depreciation & amortisation 1.9 5.9 8.2 8.2 8.0
Adj net interest (income)/exp 0.0 0.0 0.0 0.0 0.0
Change in working capital (6.2) 2.3 (25.8) 8.9 (11.1)
Cash taxes paid (4.2) (5.8) (18.0) (20.3) (21.6)
Other operating cash flow 0.0 0.0 0.0 0.0 0.0
Cash flow from operations 31.5 65.8 69.3 115.1 101.4
Capex (4.0) (5.1) (4.0) (4.0) (4.0)
Free cash flow 27.5 60.7 65.3 111.1 97.4
Dividends paid (8.4) (10.5) (22.0) (24.7) (26.4)
Equity raised / (purchased) 6.0 0.0 0.0 0.0 0.0
Change in Debt 0.3 (0.3) 0.0 0.0 0.0
Other invest/financing cash flow (1.7) (1.3) (3.6) (3.6) (3.6)
Effect of exch rate changes (11.0) 0.2 0.0 0.0 0.0
Net cash flow 12.7 48.9 39.7 82.7 67.4

September 11, 2020 12
AEM Holdings
FYE 31 Dec FY18A FY19A FY20E FY21E FY22E
Key Ratios
Growth ratios (%)
Revenue growth 18.4 23.2 52.1 5.2 4.6
EBITDA growth 11.3 65.8 61.6 11.9 6.0
EBIT growth 8.3 58.8 63.6 12.9 6.6
Pretax growth 8.5 59.9 65.6 12.6 6.5
Reported net profit growth 6.4 58.1 66.0 12.6 6.5
Core net profit growth 6.4 58.1 66.0 12.6 6.5
Profitability ratios (%)
EBITDA margin 16.0 21.5 22.8 24.3 24.6
EBIT margin 15.3 19.7 21.2 22.7 23.1
Pretax profit margin 15.2 19.8 21.5 23.1 23.5
Payout ratio 27.6 26.0 25.0 25.0 25.0
DuPont analysis
Net profit margin (%) 12.8 16.4 17.9 19.1 19.5
Revenue/Assets (x) 1.9 1.4 1.6 1.4 1.2
Assets/Equity (x) 1.5 1.7 1.5 1.4 1.3
ROAE (%) 45.5 47.3 52.5 41.7 33.6
ROAA (%) 26.6 29.1 32.9 28.8 25.0
Liquidity & Efficiency
Cash conversion cycle 5.2 5.2 7.9 8.9 9.9
Days receivable outstanding 31.0 27.7 28.6 33.5 31.6
Days inventory outstanding 66.5 80.2 79.9 83.8 83.8
Days payables outstanding 92.3 102.7 100.6 108.5 105.5
Dividend cover (x) 3.6 3.8 4.0 4.0 4.0
Current ratio (x) 2.4 2.2 2.6 3.4 4.1
Leverage & Expense Analysis
Asset/Liability (x) 2.9 2.4 2.9 3.6 4.3
Net gearing (%) (incl perps) net cash net cash net cash net cash net cash
Net gearing (%) (excl. perps) net cash net cash net cash net cash net cash
Net interest cover (x) nm nm na na na
Debt/EBITDA (x) 0.0 0.0 0.0 0.0 0.0
Capex/revenue (%) 1.5 1.6 0.8 0.8 0.7
Net debt/ (net cash) (58.5) (107.7) (147.4) (230.1) (297.5)
Source: Company; Maybank

September 11, 2020 13
AEM Holdings
Research Offices
MACRO
Sadiq CURRIMBHOY Head of Regional Macro Research (65) 6231 5836 [email protected]
ECONOMICS
Suhaimi ILIAS Chief Economist Malaysia | Philippines | Global (603) 2297 8682 [email protected]
CHUA Hak Bin Regional Thematic Macroeconomist (65) 6231 5830 [email protected]
LEE Ju Ye Singapore | Thailand (65) 6231 5844 [email protected]
Linda LIU Singapore | Vietnam (65) 6231 5847 [email protected]
Dr Zamros DZULKAFLI (603) 2082 6818 [email protected]
Ramesh LANKANATHAN (603) 2297 8685 [email protected]
William POH (603) 2297 8683 [email protected]
FX
Saktiandi SUPAAT Head of FX Research (65) 6320 1379 [email protected]
Christopher WONG (65) 6320 1347 [email protected]
TAN Yanxi (65) 6320 1378 [email protected]
Fiona LIM (65) 6320 1374 [email protected]
STRATEGY
Willie CHAN
Regional (852) 2268 0631 [email protected]
Anand PATHMAKANTHAN
ASEAN (603) 2297 8783 [email protected]
FIXED INCOME
Winson PHOON, ACA (65) 6812 8807 [email protected]
SE THO Mun Yi (603) 2074 7606 [email protected]
REGIONAL EQUITIES
Anand PATHMAKANTHAN Head of Regional Equity Research (603) 2297 8783 [email protected]
WONG Chew Hann, CA Head of ASEAN Equity Research (603) 2297 8686 [email protected]
ONG Seng Yeow Research, Technology & Innovation (65) 6231 5839 [email protected]
MALAYSIA
Anand PATHMAKANTHAN Head of Research (603) 2297 8783 [email protected] • Strategy
Desmond CH’NG, BFP, FCA (603) 2297 8680 [email protected] • Banking & Finance
LIAW Thong Jung (603) 2297 8688 [email protected] • Oil & Gas Services- Regional • Automotive
ONG Chee Ting, CA (603) 2297 8678 [email protected] • Plantations - Regional
YIN Shao Yang, CPA (603) 2297 8916 [email protected] • Gaming – Regional • Media • Aviation
TAN Chi Wei, CFA (603) 2297 8690 [email protected] • Power • Telcos
WONG Wei Sum, CFA (603) 2297 8679 [email protected] • Property
LEE Yen Ling (603) 2297 8691 [email protected] • Glove • Ports • Shipping • Healthcare • Petrochemicals
Kevin WONG (603) 2082 6824 [email protected] • REITs • Consumer Discretionary • Technology
Jade TAM (603) 2297 8687 [email protected] • Consumer Staples
TEE Sze Chiah Head of Retail Research (603) 2082 6858 [email protected]
Nik Ihsan RAJA ABDULLAH, MSTA, CFTe (603) 2297 8694 [email protected] • Chartist
Amirah AZMI (603) 2082 8769 [email protected] • Retail Research
SINGAPORE
Thilan WICKRAMASINGHE Head of Research (65) 6231 5840 [email protected] • Banking & Finance - Regional • Consumer
CHUA Su Tye (65) 6231 5842 [email protected] • REITs - Regional
LAI Gene Lih, CFA (65) 6231 5832 [email protected] • Technology • Healthcare
Kareen CHAN (65) 6231 5926 [email protected] • Transport
TAN Chin Poh Head of Retail Research (65) 6231 5928 [email protected]
Eric ONG (65) 6231 5924 [email protected] • Retail Research
Matthew SHIM (65) 6231 5929 [email protected] • Retail Research
INDIA
Jigar SHAH Head of Research (91) 22 4223 2632 [email protected] • Strategy • Oil & Gas • Automobile • Cement
Neerav DALAL (91) 22 4223 2606 [email protected] • Software Technology • Telcos
Kshitiz PRASAD (91) 22 4223 2607 [email protected] • Banks
Vikram RAMALINGAM (91) 22 4223 2607 [email protected] • Automobile • Media
INDONESIA
Isnaputra ISKANDAR Head of Research (62) 21 8066 8680 [email protected] • Strategy • Metals & Mining • Cement • Autos • Consumer • Utility
Rahmi MARINA (62) 21 8066 8689 [email protected] • Banking & Finance
Aurellia SETIABUDI (62) 21 8066 8691 [email protected] • Property
Willy GOUTAMA (62) 21 8066 8500 [email protected]
• Consumer
PHILIPPINES
Romel LIBO-ON (63) 2 8849 8844 [email protected] • Property
Fredrick De GUZMAN (63) 2 8849 8847 [email protected] • Consumer • Banking & Finance
THAILAND
Maria LAPIZ Head of Institutional Research Dir (66) 2257 0250 | (66) 2658 6300 ext 1399 [email protected] • Strategy • Consumer • Materials • Services
Jesada TECHAHUSDIN, CFA (66) 2658 6300 ext 1395 [email protected] • Banking & Finance
Kaushal LADHA, CFA (66) 2658 6300 ext 1392 [email protected] • Oil & Gas – Regional • Petrochemicals - Regional
Vanida GEISLER, CPA (66) 2658 6300 ext 1394 [email protected] • Property
Ekachai TARAPORNTIP Head of Retail Research (66) 2658 5000 ext 1530 [email protected]
Surachai PRAMUALCHAROENKIT (66) 2658 5000 ext 1470 [email protected] • Auto • Conmat • Contractor • Steel
Suttatip PEERASUB (66) 2658 5000 ext 1430 [email protected] • Media • Commerce
Jaroonpan WATTANAWONG (66) 2658 5000 ext 1404 [email protected] • Transportation • Small cap
Thanatphat SUKSRICHAVALIT (66) 2658 5000 ext 1401 [email protected] • Media • Electronics
Wijit ARAYAPISIT (66) 2658 5000 ext 1450 [email protected] • Strategist
Theerasate PROMPONG (66) 2658 5000 ext 1400 [email protected] • Equity Portfolio Strategist
Apiwat TAVESIRIVATE (66) 2658 5000 ext 1310 [email protected] • Chartist and TFEX
VIETNAM
Le Nguyen Nhat Chuyen (84 28) 44 555 888 ext 8082 [email protected] • Oil & Gas
Quan Trong Thanh (84 28) 44 555 888 ext 8184
[email protected] • Banks
Nguyen Thi Sony Tra Mi (84 28) 44 555 888 ext 8084 [email protected] • Consumer
Tyler Manh Dung Nguyen (84 28) 44 555 888 ext 8180 [email protected] • Utilities
Nguyen Thi Ngan Tuyen Head of Retail Research (84 28) 44 555 888 ext 8081 [email protected] • Food & Beverage • Oil & Gas • Banking
Nguyen Thanh Lam (84 28) 44 555 888 ext 8086 [email protected] • Technical Analysis
September 11, 2020 14
AEM Holdings
APPENDIX I: TERMS FOR PROVISION OF REPORT, DISCLAIMERS AND DISCLOSURES
DISCLAIMERS This research report is prepared for general circulation and for information purposes only and under no circumstances should it be considered or intended as an offer to sell or a solicitation of an offer to buy the securities referred to herein. Investors should note that values of such securities, if any, may fluctuate and that each security’s price or value may rise or fall. Opinions or recommendations contained herein are in form of technical ratings and fundamental ratings. Technical ratings may differ from fundamental ratings as technical valuations apply different methodologies and are purely based on price and volume-related information extracted from the relevant jurisdiction’s stock exchange in the equity analysis. Accordingly, investors’ returns may be less than the original sum invested. Past performance is not necessarily a guide to future performance. This report is not intended to provide personal investment advice and does not take into account the specific investment objectives, the financial situation and the particular needs of persons who may receive or read this report. Investors should therefore seek financial, legal and other advice regarding the appropriateness of investing in any securities or the investment strategies d iscussed or recommended in this report.
The information contained herein has been obtained from sources believed to be reliable but such sources have not been independently verified by Maybank Investment Bank Berhad, its subsidiary and affiliates (collectively, “MKE”) and consequently no representation is made as to the accuracy or completeness of this report by MKE and it should not be relied upon as such. Accordingly, MKE and its officers, directors, associates, connected parties and/or employees (collectively, “Representatives” ) shall not be liable for any direct, indirect or consequential losses or damages that may arise from the use or reliance of this report. Any information, opinions or recommendations contained herein are subject to change at any time, without prior notice.
This report may contain forward looking statements which are often but not always identified by the use of words such as “anticipate”, “believe”, “estimate”, “intend”, “plan”, “expect”, “forecast”, “predict” and “project” and statements that an event or result “may”, “will”, “can”, “should”, “could” or “might” occur or be achieved and other similar expressions. Such forward looking statements are based on assumptions made and information currently available to us and are subject to certain risks and uncertainties that could cause the actual results to differ materially from those expressed in any forward looking statements. Readers are cautioned not to place undue relevance on these forward-looking statements. MKE expressly disclaims any obligation to update or revise any such forward looking statements to reflect new information, events or circumstances after the date of this publication or to reflect the occurrence of unanticipated events.
MKE and its officers, directors and employees, including persons involved in the preparation or issuance of this report, may, to the extent permitted by law, from time to time participate or invest in financing transactions with the issuer(s) of the securities mentioned in this report, perform services for or solic it business from such issuers, and/or have a position or holding, or other material interest, or effect transactions, in such securities or options thereon, or other investments related thereto. In addition, it may make markets in the securities mentioned in the material presented in this report. One or more directors, officers and/or employees of MKE may be a director of the issuers of the securities mentioned in this report to the extent permitted by law.
This report is prepared for the use of MKE’s clients and may not be reproduced, altered in any way, transmitted to, copied or distributed to any other party in whole or in part in any form or manner without the prior express written consent of MKE and MKE and its Representatives accepts no liability whatsoever for the actions of third parties in this respect.
This report is not directed to or intended for distribution to or use by any person or entity who is a citizen or resident of or located in any locality, state, country o r other jurisdiction where such distribution, publication, availability or use would be contrary to law or regulation. This report is for distribution only under such circumstances as may be permitted by applicable law. The securities described herein may not be eligible for sale in all jurisdictions or to certain categories of investors. Without prejudice to the foregoing, the reader is to note that additional disclaimers, warnings or qualifications may apply based on geographical location of the person or entity receiving this repor t.
Malaysia Opinions or recommendations contained herein are in the form of technical ratings and fundamental ratings. Technical ratings may differ from fundamental ratings as technical valuations apply different methodologies and are purely based on price and volume-related information extracted from Bursa Malaysia Securities Berhad in the equity analysis.
Singapore This report has been produced as of the date hereof and the information herein may be subject to change. Maybank Kim Eng Research Pte. Ltd. (“Maybank KERPL”) in Singapore has no obligation to update such information for any recipient. For distribution in Singapore, recipients of this report are to contact Maybank KERPL in Singapore in respect of any matters aris ing from, or in connection with, this report. If the recipient of this report is not an accredited investor, expert investor or institutional investor (as defined under Section 4A of the Singapore Securities and Futures Act), Maybank KERPL shall be legally liable for the contents of this report, with such liability being limited to the extent (if any) as permitted by law.
Thailand Except as specifically permitted, no part of this presentation may be reproduced or distributed in any manner without the prior written permission of Maybank Kim Eng Securities (Thailand) Public Company Limited. Maybank Kim Eng Securities (Thailand) Public Company Limited (“MBKET”) accepts no liability whatsoever for the actions of third parties in this respect.
Due to different characteristics, objectives and strategies of institutional and retail investors, the research products of MBKET Institutional and Retail Research departments may differ in either recommendation or target price, or both. MBKET reserves the rights to disseminate MBKET Retail Research reports to institutional investors who have requested to receive it. If you are an authorised recipient, you hereby tacitly acknowledge that the research reports from MBKET Retail Research are first produced in Thai and there is a time lag in the release of the translated English version.
The disclosure of the survey result of the Thai Institute of Directors Association (“IOD”) regarding corporate governance is made pursuant to the policy of the Office of the Securities and Exchange Commission. The survey of the IOD is based on the information of a company listed on the Stock Exchange of Thailand and the market for Alternative Investment disclosed to the public and able to be accessed by a general public investor. The result, therefore, is from the perspective of a third party. It is not an evaluation of operation and is not based on inside information. The survey result is as of the date appearing in the Corporate Governance Report of Thai Listed Companies. As a result, the survey may be changed after that date. MBKET does not confirm nor certify the accuracy of such survey result.
The disclosure of the Anti-Corruption Progress Indicators of a listed company on the Stock Exchange of Thailand, which is assessed by Thaipat Institute, is made in order to comply with the policy and sustainable development plan for the listed companies of the Office of the Securit ies and Exchange Commission. Thaipat Institute made this assessment based on the information received from the listed company, as stipulated in the form for the assessment of Anti-corruption which refers to the Annual Registration Statement (Form 56-1), Annual Report (Form 56-2), or other relevant documents or reports of such listed company. The assessment result is therefore made from the perspective o f Thaipat Institute that is a third party. It is not an assessment of operation and is not based on any inside information. Since this assessment is only the assessment result as of the date appearing in the assessment result, it may be changed after that date or when there is any change to the relevant information. Nevertheless, MBKET does not confirm, verify, or certify the accuracy and completeness of the assessment result.
US This third-party research report is distributed in the United States (“US”) to Major US Institutional Investors (as defined in Rule 15a -6 under the Securities Exchange Act of 1934, as amended) only by Maybank Kim Eng Securities USA Inc (“Maybank KESUSA”), a broker-dealer registered in the US (registered under Section 15 of the Securities Exchange Act of 1934, as amended). All responsibility for the distribution of this report by Maybank KESUSA in the US shall be borne by Maybank KESUSA. This report is not directed at you if MKE is prohibited or restricted by any legislation or regulation in any jurisdiction from making it available to you. You should satisfy yourself before reading it that Maybank KESUSA is permitted to provide research material concerning investments to you under relevant legislation and regulations. All U.S. persons receiving and/or accessing this report and wishing to effect transactions in any security mentioned within must do so with: Maybank Kim Eng Securities USA Inc. 400 Park Avenue, 11th Floor, New York, New York 10022, 1-(212) 688-8886 and not with, the issuer of this report.
September 11, 2020 15
AEM Holdings
Disclosure of Interest
Malaysia: MKE and its Representatives may from time to time have positions or be materially interested in the securities referred to he rein and may further act as market maker or may have assumed an underwriting commitment or deal with such securities and may also perform or seek to perform investment banking services, advisory and other services for or relating to those companies. Singapore: As of 11 September 2020, Maybank KERPL and the covering analyst do not have any interest in any companies recommended in this research report. Thailand: MBKET may have a business relationship with or may possibly be an issuer of derivative warrants on the securities /companies mentioned in the research report. Therefore, Investors should exercise their own judgment before making any investment decisions. MBKET, its associates, directors, connected parties and/or employees may from time to time have interests and/or underwriting commitments in the securities mentioned in this report. Hong Kong: As of 11 September 2020, KESHK and the authoring analyst do not have any interest in any companies recommended in this research report. India: As of 11 September 2020, and at the end of the month immediately preceding the date of publication of the research report, KESI, authoring analyst or their associate / relative does not hold any financial interest or any actual or beneficial ownership in any shares or having any conflict of interest in the subject companies except as otherwise disclosed in the research report.
In the past twelve months KESI and authoring analyst or their associate did not receive any compensation or other benefits from the subject companies or third party in connection with the research report on any account what so ever except as otherwise disclosed in the research report.
MKE may have, within the last three years, served as manager or co-manager of a public offering of securities for, or currently may make a primary market in issues of, any or all of the entities mentioned in this report or may be providing, or have provided within the previous 12 months, significant advice or investment services in relation to the investment concerned or a related investment and may receive compensation for the services provided from the companies covered in this report.
OTHERS
Analyst Certification of Independence
The views expressed in this research report accurately reflect the analyst’s personal views about any and all of the subject securities or issuers; and no part of the research analyst’s compensation was, is or will be, directly or indirectly, related to the specific recommendations or views expressed in the report.
Reminder
Structured securities are complex instruments, typically involve a high degree of risk and are intended for sale only to soph isticated investors who are capable of understanding and assuming the risks involved. The market value of any structured security may be affected by changes in economic, financial and political factors (including, but not limited to, spot and forward interest and exchange rates), time to maturity, market conditions and volatility and the credit quality of any issuer or reference issuer. Any investor interested in purchasing a structured product should conduct its own analysis of the product and consult with its own professional advisers as to the risks involved in making such a purchase.
No part of this material may be copied, photocopied or duplicated in any form by any means or redistributed without the prior consent of MKE.
UK This document is being distributed by Maybank Kim Eng Securities (London) Ltd (“Maybank KESL”) which is authorized and regula ted, by the Financial Conduct Authority and is for Informational Purposes only. This document is not intended for distribution to anyone defined as a Retail Client under the Financial Services and Markets Act 2000 within the UK. Any inclusion of a third party link is for the recipients convenience only, and that the firm does not take any responsibility for its comments or accuracy, and that access to such li nks is at the individuals own risk. Nothing in this report should be considered as constituting legal, accounting or tax advice, and that for accurate guidance recipients should consult with their own independent tax advisers.
DISCLOSURES
Legal Entities Disclosures Malaysia: This report is issued and distributed in Malaysia by Maybank Investment Bank Berhad (15938- H) which is a Participating Organization of Bursa Malaysia Berhad and a holder of Capital Markets and Services License issued by the Securities Commission in Malaysia. Singapore: This report is distributed in Singapore by Maybank KERPL (Co. Reg No 198700034E) which is regulated by the Monetary Authority of Singapore. Indonesia: PT Maybank Kim Eng Securities (“PTMKES”) (Reg. No. KEP-251/PM/1992) is a member of the Indonesia Stock Exchange and is regulated by the Financial Services Authority (Indonesia). Thailand: MBKET (Reg. No.0107545000314) is a member of the Stock Exchange of Thailand and is regulated by the Ministry of Finance and the Securities and Exchange Commission. Philippines: Maybank ATRKES (Reg. No.01-2004-00019) is a member of the Philippines Stock Exchange and is regulated by the Securities and Exchange Commission. Vietnam: Maybank Kim Eng Securities Limited (License Number: 117/GP-UBCK) is licensed under the State Securities Commission of Vietnam. Hong Kong: KESHK (Central Entity No AAD284) is regulated by the Securities and Futures Commission. India: Kim Eng Securities India Private Limited (“KESI”) is a participant of the National Stock Exchange of India Limited and the Bombay Stock Exchange and is regulated by Securities and Exchange Board of India (“SEBI”) (Reg. No. INZ000010538). KESI is also registered with SEBI as Category 1 Merchant Banker (Reg. No. INM 000011708) and as Research Analyst (Reg No: INH000000057) US: Maybank KESUSA is a member of/ and is authorized and regulated by the FINRA – Broker ID 27861. UK: Maybank KESL (Reg No 2377538) is authorized and regulated by the Financial Conduct Authority.

September 11, 2020 16
AEM Holdings
Historical recommendations and target price: AEM Holdings (AEM SP)
Definition of Ratings
Maybank Kim Eng Research uses the following rating system
BUY Return is expected to be above 10% in the next 12 months (including dividends)
HOLD Return is expected to be between 0% to 10% in the next 12 months (including dividends)
SELL Return is expected to be below 0% in the next 12 months (including dividends)
Applicability of Ratings
The respective analyst maintains a coverage universe of stocks, the list of which may be adjusted according to needs. Investment ratings are only applicable to the stocks which form part of the coverage universe. Reports on companies which are not part of the coverage do not carry investment ratings as we do not actively follow developments in these companies.
0.0
1.0
2.0
3.0
4.0
5.0
Mar-19 Jun-19 Sep-19 Dec-19 Mar-20 Jun-20 Sep-20
AEM Holdings
11 Mar Buy : SGD1.2
25 Apr Buy : SGD1.4
16 Sep Buy : SGD1.5
4 Nov Buy : SGD2.1
9 Jan Buy : SGD2.6
26 Feb Buy : SGD2.8
29 Apr Buy : SGD3.2
8 May Buy : SGD4.0
4 Aug Buy : SGD4.3
10 Sep Buy : SGD5.1
September 11, 2020 17
AEM Holdings
Malaysia Maybank Investment Bank Berhad
(A Participating Organisation of
Bursa Malaysia Securities Berhad)
33rd Floor, Menara Maybank,
100 Jalan Tun Perak,
50050 Kuala Lumpur
Tel: (603) 2059 1888;
Fax: (603) 2078 4194
Singapore Maybank Kim Eng Securities Pte Ltd
Maybank Kim Eng Research Pte Ltd
50 North Canal Road
Singapore 059304
Tel: (65) 6336 9090
London Maybank Kim Eng Securities
(London) Ltd
PNB House
77 Queen Victoria Street
London EC4V 4AY, UK
Tel: (44) 20 7332 0221
Fax: (44) 20 7332 0302
New York Maybank Kim Eng Securities USA
Inc
400 Park Avenue, 11th Floor
New York, New York 10022,
U.S.A.
Tel: (212) 688 8886
Fax: (212) 688 3500
Stockbroking Business:
Level 8, Tower C, Dataran Maybank,
No.1, Jalan Maarof
59000 Kuala Lumpur
Tel: (603) 2297 8888
Fax: (603) 2282 5136
Hong Kong Kim Eng Securities (HK) Ltd
28/F, Lee Garden Three,
1 Sunning Road, Causeway Bay,
Hong Kong
Tel: (852) 2268 0800
Fax: (852) 2877 0104
Indonesia PT Maybank Kim Eng Securities
Sentral Senayan III, 22nd Floor
Jl. Asia Afrika No. 8
Gelora Bung Karno, Senayan
Jakarta 10270, Indonesia
Tel: (62) 21 2557 1188
Fax: (62) 21 2557 1189
India Kim Eng Securities India Pvt Ltd
1101, 11th floor, A Wing, Kanakia
Wall Street, Chakala, Andheri -
Kurla Road, Andheri East,
Mumbai City - 400 093, India
Tel: (91) 22 6623 2600
Fax: (91) 22 6623 2604
Philippines Maybank ATR Kim Eng Securities Inc.
17/F, Tower One & Exchange Plaza
Ayala Triangle, Ayala Avenue
Makati City, Philippines 1200
Tel: (63) 2 8849 8888
Fax: (63) 2 8848 5738
Thailand Maybank Kim Eng Securities
(Thailand) Public Company Limited
999/9 The Offices at Central World,
20th - 21st Floor,
Rama 1 Road Pathumwan,
Bangkok 10330, Thailand
Tel: (66) 2 658 6817 (sales)
Tel: (66) 2 658 6801 (research)
Vietnam Maybank Kim Eng Securities Limited
4A-15+16 Floor Vincom Center Dong
Khoi, 72 Le Thanh Ton St. District 1
Ho Chi Minh City, Vietnam
Tel : (84) 844 555 888
Fax : (84) 8 38 271 030
Saudi Arabia In association with
Anfaal Capital
Ground Floor, KANOO Building
No.1 - Al-Faisaliyah,Madina Road,
P.O.Box 126575 Jeddah 21352
Kingdom of Saudi Arabia
Tel: (966) 920023423
South Asia Sales Trading Kevin Foy
Regional Head Sales Trading
Tel: (65) 6636-3620
US Toll Free: 1-866-406-7447
North Asia Sales Trading Andrew Lee
Tel: (852) 2268 0283
US Toll Free: 1 877 837 7635
Indonesia Iwan Atmadjaja [email protected] (62) 21 8066 8555
London Greg Smith [email protected] Tel: (44) 207-332-0221
New York James Lynch [email protected] Tel: (212) 688 8886
India Sanjay Makhija [email protected] Tel: (91)-22-6623-2629
Philippines Keith Roy [email protected] Tel: (63) 2 848-5288
www.maybank-ke.com | www.maybank-keresearch.com