Statistics 300: Introduction to Probability and Statistics Section 1-2.
26
Statistics 300: Introduction to Probability and Statistics Section 1-2
-
Upload
marylou-leonard -
Category
Documents
-
view
239 -
download
3
Transcript of Statistics 300: Introduction to Probability and Statistics Section 1-2.
Statistics 300:Introduction to Probability
and Statistics
Section 1-2

More Definitions
• Parameter–a numerical characteristic of a
population
–“population parameter”
More Definitions
• Statistic– a numerical characteristic of a
sample
–“sample statistic”
1. Average or Mean2. Biggest (maximum) value3. Smallest (minimum) value4. Range : maximum - minimum
Examples of “numerical characteristics”

A Statistic is:• A function of data
• Function : y = f(x)
– the value of “x” determines the value of “y”
• The average is a function of a set of “x” values; the average of 4, 6, and 8 = 6.
Start with the sample or the population?
• Sometimes we have a sample and we need to consider the population or populations that the sample represents
Start with the sample or the population?
• A sample is likely to be “representative” (it looks like the population) if it is collected in a well-planned and well-executed manner

The Nature of Data
Definitions• Quantitative vs. Qualitative
• Discrete vs. Continuous
• Four “levels” of measurement
Definitions• Quantitative vs. Qualitative
• Quantitative Data are numbers that represent counts or measurements
• Qualitative Data may represent categories based on a non-numerical characteristic
• Sometimes called categorical or attribute data

Definitions
• Discrete vs. Continuous
Definitions
• Discrete
• The set of possible values can be counted (possibly infinite)
• Main example: “Counts”

Definitions• Continuous
• The possible values cannot be counted. Even in a small range, the possibilities are infinite.
• “Measurements” such as speed, weight, temperature, time.

Definitions• Four “levels” of measurement
–Nominal
–Ordinal
–Interval
–Ratio
Definitions• Four “levels” of measurement
–Nominal (in name, only)
•“name”•not quantitative•cannot compare values according to magnitude

Definitions• Four “levels” of measurement
–Nominal•New York, San Francisco, Sacramento, Lodi
•Other attributes of these cities can be compared as quantities, but not the names

Definitions• Four “levels” of measurement
–Ordinal (in order, also)
•“names” or categories
•not quantitative
•Magnitude can be compared as “less than” or “greater than” only.
Definitions• Four “levels” of measurement
–Ordinal•Small < medium < large
•can be put in order according to magnitude, but other comparisons cannot be done

Definitions• Four “levels” of measurement
–Interval (differences make sense)
•values represent magnitude explicitly
•can be put in order, and
• intervals can be compared, but
•ratios cannot be compared

Definitions• Four “levels” of measurement
–Interval•Temperatures
•0oC, 10oC, 20oC
•can be put in order
• interval from 0 to 10 is the same as 10 to 20
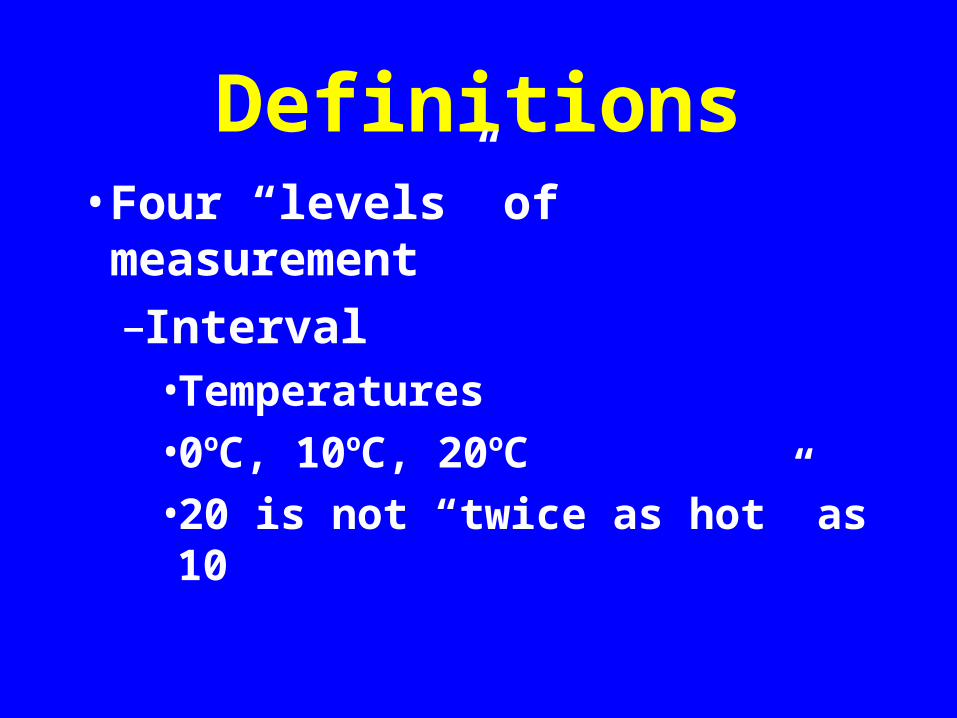
Definitions• Four “levels” of measurement
–Interval•Temperatures
•0oC, 10oC, 20oC
•20 is not “twice as hot” as 10
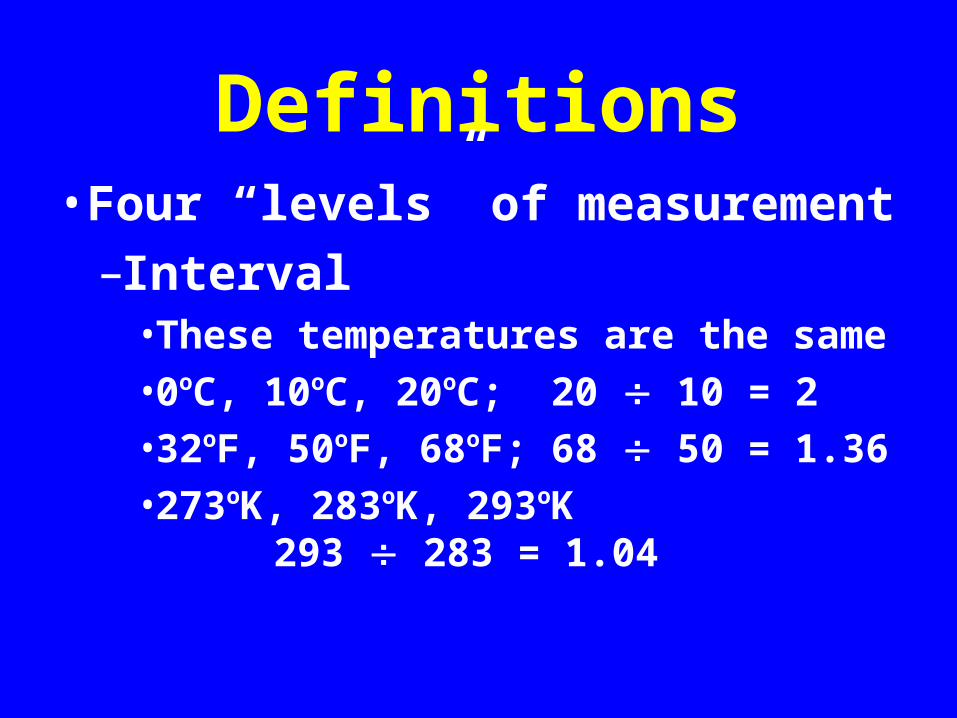
Definitions• Four “levels” of measurement
–Interval• These temperatures are the same
• 0oC, 10oC, 20oC; 20 10 = 2
• 32oF, 50oF, 68oF; 68 50 = 1.36
• 273oK, 283oK, 293oK 293 283 = 1.04
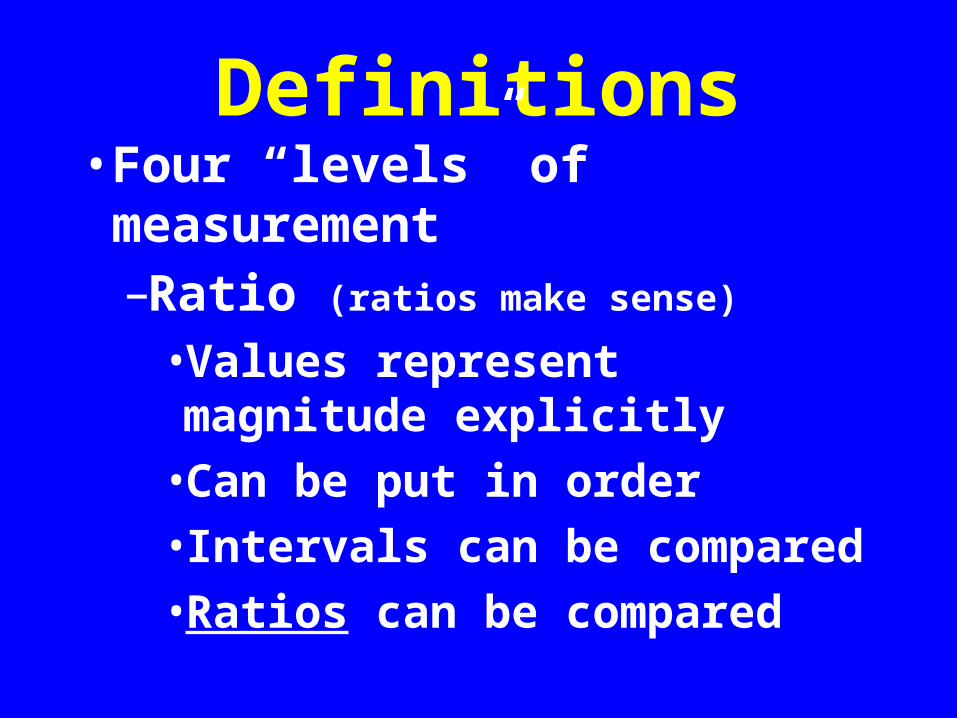
Definitions• Four “levels” of measurement
–Ratio (ratios make sense)
•Values represent magnitude explicitly
•Can be put in order
•Intervals can be compared
•Ratios can be compared

Definitions• Four “levels” of measurement
–Ratio•Natural not arbitrary “zero”
•Speed, weight, elapsed time, voltage, distance
•60 miles per hour is twice as fast as 30 miles per hour