Statistics 101: Formula-Free Statistics Author: Nick Barrowman, PhD Date: July 16 th, 2012.
64
Statistics 101: Formula-Free Statistics Author: Nick Barrowman, PhD Date: July 16 th , 2012
-
Upload
letitia-lawson -
Category
Documents
-
view
225 -
download
0
Transcript of Statistics 101: Formula-Free Statistics Author: Nick Barrowman, PhD Date: July 16 th, 2012.
Statistics 101:Formula-Free Statistics
Author: Nick Barrowman, PhD
Date: July 16th, 2012

2
Conflict of interest disclosure
• I do not hold any research grants funded by industry
• I have done paid consulting work for Mead Johnson Nutrition [Canada] Co.
• I have no other relevant financial relationships with members of the pharmaceutical industry or medical supply companies.

Learning objectives
By the end of this talk you will be able to:
• Understand the principal concepts of statistics
• Interpret statistics commonly reported in the medical literature
• Identify "red flags" in research reports that may be signs of trouble

Variability
• Patients vary.
• Physicians vary.
• Nurses vary.
• Hospitals vary.
• Measurements vary.
• Disease states vary.
• Immune response varies.
• Drug adherence varies. …

Variability

Consequences of variability
• Variability means that the patterns we notice may be illusory and we may miss the real patterns.
• Variability means that our conclusions will always be tentative.
• Variability means that we’ll have to deal with uncertainty.

“Uncertainty is an uncomfortable position. But certainty is an absurd one.”
- Voltaire

What is Statistics?
• Statistics is the science of variability.

The principal concepts of statistics
• Variability can be modeled using probability.
• This provides a framework for drawing inferences and quantifying our uncertainty.

Fundamental statistical ideas
• The population and the sample
• Confidence intervals
• Hypothesis tests
• P-values

Population vs. sample
Population Random sample
Sample mean blood pressure
Calculation
Calculation
Population mean blood pressure InferenceInference

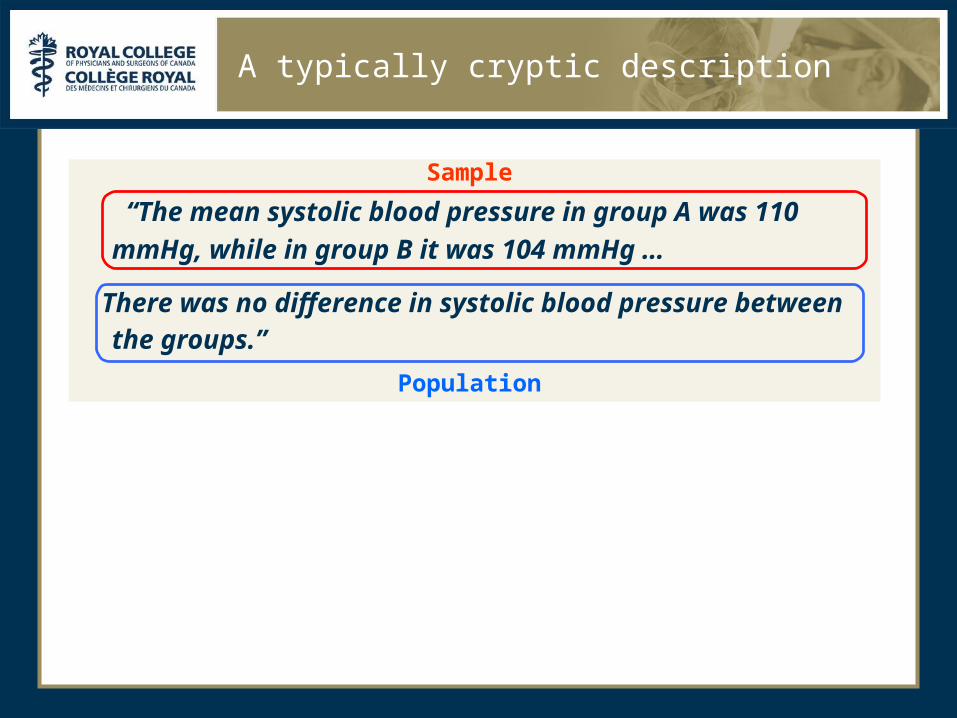
A typically cryptic description
“The mean systolic blood pressure in group A was 110 mmHg, while in group B it was 104 mmHg …
There was no difference in systolic blood pressure between the groups.”

A typically cryptic description
Statements like this can be perplexing.
For a start, how can there be no difference when there is clearly a difference?
“The mean systolic blood pressure in group A was 110 mmHg, while in group B it was 104 mmHg …
There was no difference in systolic blood pressure between the groups.”

Population vs. sample
Population Random sample
Population difference between groups in mean blood pressure
InferenceInference
High BP
Low BP
Sample difference between groups in mean blood pressure
Calculation
Calculation

A typically cryptic description
“The mean systolic blood pressure in group A was 110 mmHg, while in group B it was 104 mmHg …
There was no difference in systolic blood pressure between the groups.”
“The mean systolic blood pressure in group A was 110 mmHg, while in group B it was 104 mmHg …
There was no difference in systolic blood pressure between the groups.”
A typically cryptic description
Sample
Population
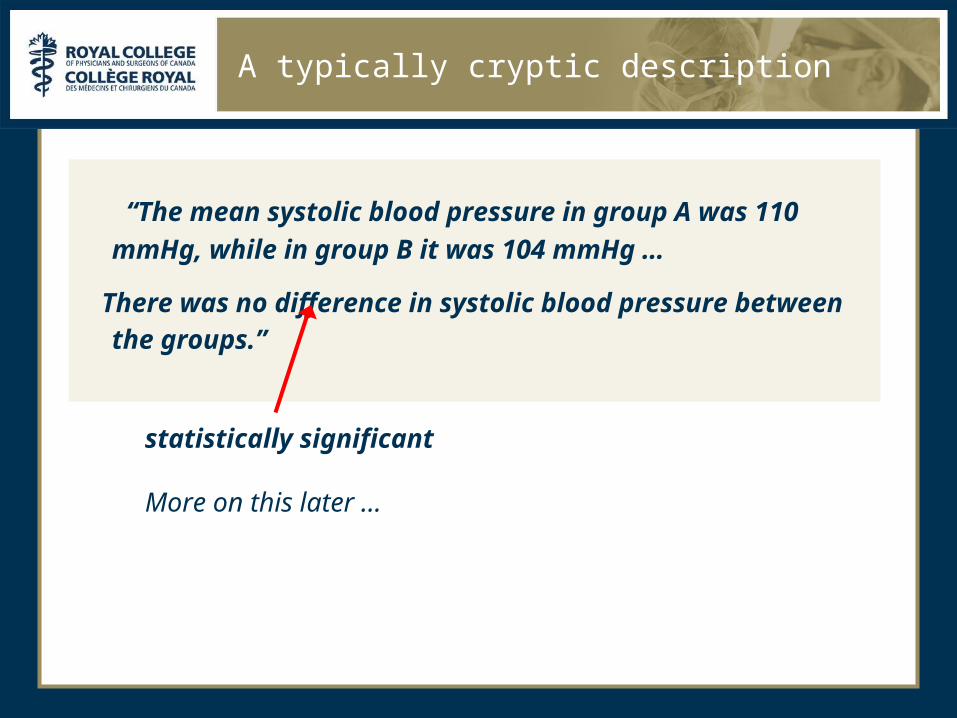
A typically cryptic description
“The mean systolic blood pressure in group A was 110 mmHg, while in group B it was 104 mmHg …
There was no difference in systolic blood pressure between the groups.”
statistically significant

A typically cryptic description
“The mean systolic blood pressure in group A was 110 mmHg, while in group B it was 104 mmHg …
There was no statistically significant difference in systolic blood pressure between the groups.”
mean Even if the means do not differ significantly between groups, systolic blood pressure varies within each group.
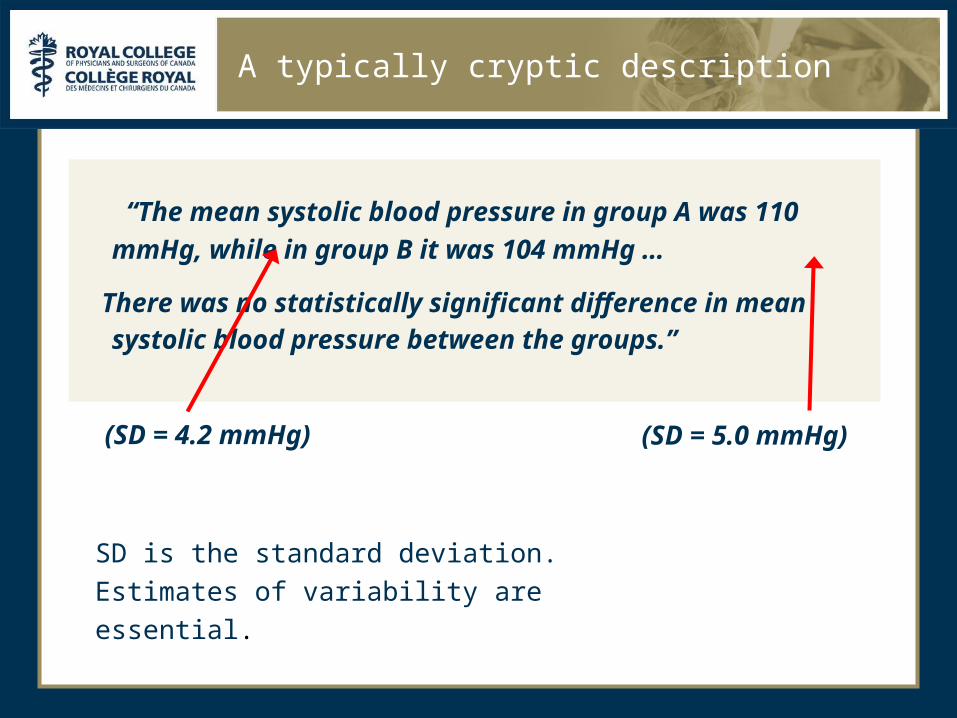
A typically cryptic description
“The mean systolic blood pressure in group A was 110 mmHg, while in group B it was 104 mmHg …
There was no statistically significant difference in mean systolic blood pressure between the groups.”
(SD = 4.2 mmHg)
SD is the standard deviation.Estimates of variability are essential.
(SD = 5.0 mmHg)
Red flag
Failing to report estimates of variability
Variability is always present. Failing to report estimates of variability can be misleading and can also make it impossible for the reader to verify results.

Comparisons
• Many studies focus on comparisons• between groups
• between a single group and a reference standard.
• e.g. Compare weight gain:• On average, did group A gain more than group B?
• On average, did people in a single group gain weight? Here the reference standard is no change.

The null hypothesis
• The null hypothesis is a default assumption about the population, usually that there is no difference.
• For example: In the population, there is no difference between the mean blood pressure for groups A and B.

Weight gain example
• With two groups, the null hypothesis is:
• Mean weight gain is the same in the two groups• i.e. Difference in mean weight gain = 0
• With one group, the null hypothesis is:
• Mean weight gain = 0
• In these two cases, zero is the “null value”

Other examples of the null hypothesis
• Example: Mortality in two groups
• Mortality rate in group A = mortality rate in group B• i.e. Relative risk of mortality is 1.• So 1 is the null value.
• Example: IQ in a single group
• Mean IQ is 100.• So 100 is the null value.
Hypothesis testing
An example:
Bedside Limited Echocardiography by the Emergency Physician Is Accurate During Evaluation of the Critically Ill PatientPershad et al. Pediatrics 2004;114;e667-e671.
Goal: to compare echocardiography measurements made by emergency physicians and experienced pediatric echocardiography providers.

Shortening fraction SF (%)
Patient Emerg Doc Cardiographer
Hypothesis testing
Hypothesis testing
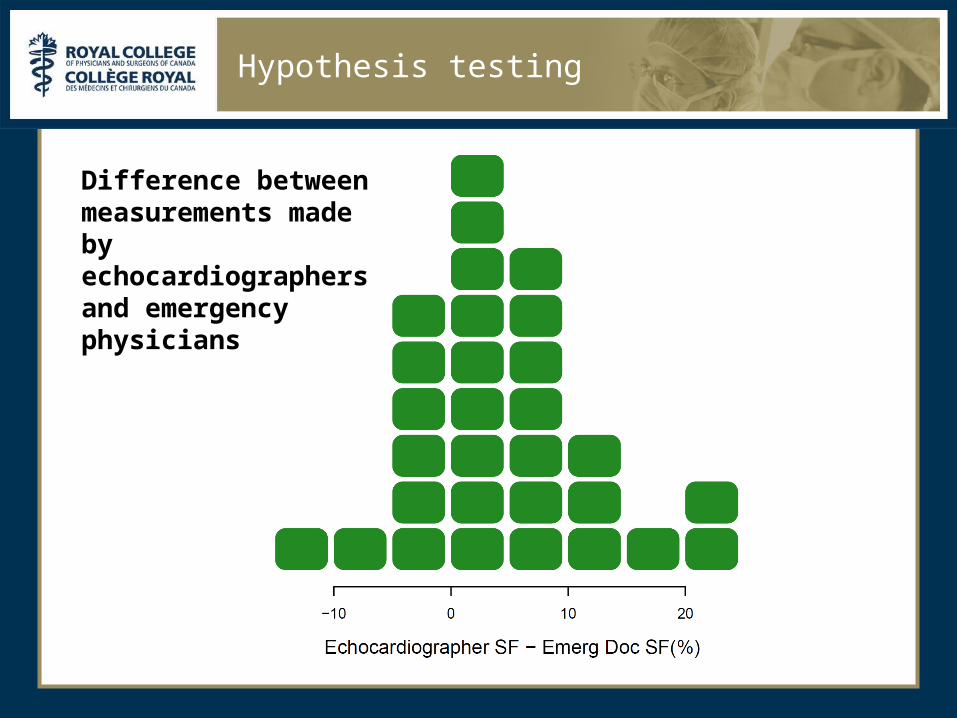
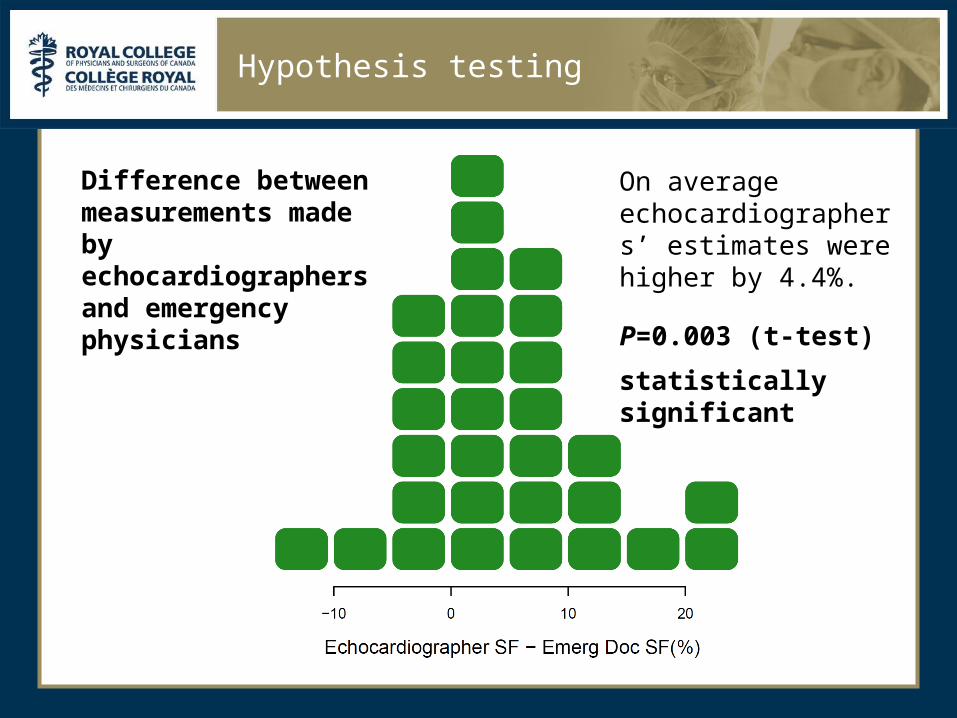
Difference between measurements made by echocardiographers and emergency physicians

Difference between measurements made by echocardiographers and emergency physicians
On average echocardiographers’ estimates were higher by 4.4%.
Hypothesis testing

Difference between measurements made by echocardiographers and emergency physicians
On average echocardiographers’ estimates were higher by 4.4%.
Hypothesis testing
Could this difference be a chance occurrence?

Hypothesis testing
• We need to test the hypothesis that in the population there is no difference.
• We often report a p-value: the probability of observing a difference that is at least as extreme as what was observed, assuming there is no difference in the population.
• Usually consider a p-value < 0.05 to be statistically significant.
Difference between measurements made by echocardiographers and emergency physicians
On average echocardiographers’ estimates were higher by 4.4%.
Hypothesis testing
P=0.003 (t-test)
statistically significant

Statistical vs. Clinical significance
• But the authors note, “Although statistically significant, the difference of 4.4% in the estimation of SF may not be clinically relevant.”
• A statistically significant finding is not always clinically significant.
• Subject area judgement is always needed.

Red flag
Treating a statistically significant finding as important without considering whether it is clinically relevant
Statistical significance simply rules out chance as an explanation for the results. It does not necessarily mean that the results are clinically significant.

Beyond the p-value
• The mean sample difference is 4.4%
• The mean population difference could be larger or smaller.
• We know (with 95% confidence) that the population difference is greater than zero. Do we know anything more?
Confidence intervals
• Yes! A much more useful result than a p-value is a confidence interval.
• A confidence interval tells us what population values (of the difference in means) are consistent with our data.
• Values outside the confidence interval are ruled out.
• The key issue is the clinical relevance of the values contained in a confidence interval.

Difference between measurements made by echocardiographers and emergency physicians
On average echocardiographers’ estimates were higher by 4.4%.
The 95% confidence interval is 1.6% – 7.2%.
Hypothesis testing

“Statistics means never having to say you’re certain.”

Patient Emerg Doc Cardiographer
Inferior vena cava (IVC) diameter(mm)
Hypothesis testing

Difference between measurements made by echocardiographers and emergency physicians
Hypothesis testing

Difference between measurements made by echocardiographers and emergency physicians
On average echocardiographers’ estimates were higher by 0.068 mm
P=0.14
Not statistically significant
Hypothesis testing
• Since p>0.05, can we conclude that there is no difference between IVC measurements made by echocardiographers and emergency physicians?
Hypothesis testing

• Since p>0.05, can we conclude that there is no difference between IVC measurements made by echocardiographers and emergency physicians?
• No! The confidence interval can help us understand why not.
Hypothesis testing

Difference between measurements made by echocardiographers and emergency physicians
On average echocardiographers’ estimates were higher by 0.068 mm
The 95% confidence interval is -0.025 to 0.16 mm.
Hypothesis testing
Is the null hypothesis true?
• It is not necessary (or even possible) to know if the null hypothesis is exactly correct.
• For instance, it is not necessary to know if a difference is exactly zero.
• Rather, it is sufficient to be confident that a difference is small enough that it is negligible or unimportant.
• Who should decide what is unimportant?
Red flag
Claiming there is no difference because p > 0.05
The sample size of the study may not be sufficient to detect a difference, or the difference may be small (but possibly still important).

Association
• The example examined the question of whether type of training (emergency physician or echocardiographer) was associated with the measured value of SF or IVC.
• Many common statistical methods focus on estimating or testing associations.

Measures and tests of association
• Student’s t-test, Wilcoxon test
…

Measures and tests of association
• Student’s t-test, Wilcoxon test
• chi-square test, Fisher’s exact test
…

Measures and tests of association
• Student’s t-test, Wilcoxon test
• chi-square test, Fisher’s exact test
• log rank test
…

Measures and tests of association
• Student’s t-test, Wilcoxon test
• chi-square test, Fisher’s exact test
• log rank test
• Pearson and Spearman correlations
…

Measures and tests of association
• Student’s t-test, Wilcoxon test
• chi-square test, Fisher’s exact test
• log rank test
• Pearson and Spearman correlations
• absolute risk reduction
• relative risk
• odds ratio
• number needed to treat …

Group A
Group B
Absolute risk reduction
Relativerisk
Oddsratio
50% 30% 20%
(NNT=5)
0.6
(RRR=40%)
0.43
5% 3% 2%
(NNT=50)
0.6
(RRR=40%)
0.59
25% 5% 20%
(NNT=5)
0.2
(RRR=80%)
0.16
Measures of association for dichotomous outcomes

The slippery slope of causation
• When there is an association, we may be tempted to ascribe causation. For example:
• “The new surgical technique produced quicker recovery.”
• Compare with:
• “Patients who received the new surgical technique recovered quicker.”
• Perhaps the patients who received the new surgical technique had less serious conditions.

The slippery slope of causation
• Be very cautious with conclusions about causality
• A well-executed randomized trial provides the most solid grounds for causal inferences

“Correlation does not imply causation.”

Red flag
Causal inferences in an observational study
An observational study can detect an association, but not (by itself) causation.

Raw and adjusted analyses
• In the analysis of the surgery data, it might be wise to take into account the severity of each patient’s condition.
• This would give “adjusted” results.
• Terminology: Unadjusted results are often called “raw” or “crude” results.
• Adjusted analyses are often used to account for imbalances between groups.

Raw and adjusted analyses
• But remember: an adjusted association is still just an association.
• Remain cautious of causal inferences!

Adjusted analyses
• linear regression
• logistic regression
• Poisson regression
• Cox proportional hazards regression
• Cochran-Mantel-Haenszel methods
…

Some things I haven’t discussed
• Biases
• Study designs
• Power and sample size determination
• Other statistical methods
• evaluation of diagnostic tests• meta-analysis• multi-level/hierarchical models• assessment of measurement reliability
…

Summary
• Variability leads to uncertainty.
• Statistics uses probability theory to model variability and quantify uncertainty.
• Confidence intervals are more informative than p-values, and help to assess clinical significance.
• Many common statistical methods focus on estimating and testing associations.
• Be careful about ascribing causation.
• To account for other factors, statistical methods are available for adjusting associations.

“Variety Variability is the spice of life.”