Statistically Guided Synthesis of MoV- Based Mixed Oxide ...
17
University of South Carolina University of South Carolina Scholar Commons Scholar Commons Faculty Publications Chemical Engineering, Department of 9-2-2018 Statistically Guided Synthesis of MoV- Based Mixed Oxide Statistically Guided Synthesis of MoV- Based Mixed Oxide Catalysts for Ethane Partial Oxidation Catalysts for Ethane Partial Oxidation Juan D. Jimenez [email protected] Kathleen Mingle Teeraya Bureerug Cun Wen Jochen Lauterbach [email protected] Follow this and additional works at: https://scholarcommons.sc.edu/eche_facpub Part of the Chemical Engineering Commons Publication Info Publication Info Published in Catalysts, Volume 8, Issue 9, 2018, pages 1-16. © 2018 by the authors. Licensee MDPI, Basel, Switzerland. This article is an open access article distributed under the terms and conditions of the Creative Commons Attribution (CC BY) license (http://creativecommons.org/licenses/by/4.0/). Jimenez, J. D., Mingle, K., Bureerug, T., Wen, C., & Lauterbach, J. (2018). Statistically Guided Synthesis of MoV- Based Mixed Oxide Catalysts for Ethane Partial Oxidation. Catalysts, 8(9), 370. doi:10.3390/ catal8090370 This Article is brought to you by the Chemical Engineering, Department of at Scholar Commons. It has been accepted for inclusion in Faculty Publications by an authorized administrator of Scholar Commons. For more information, please contact [email protected].
Transcript of Statistically Guided Synthesis of MoV- Based Mixed Oxide ...
University of South Carolina University of South Carolina
Scholar Commons Scholar Commons
Faculty Publications Chemical Engineering, Department of
9-2-2018
Statistically Guided Synthesis of MoV- Based Mixed Oxide Statistically Guided Synthesis of MoV- Based Mixed Oxide
Catalysts for Ethane Partial Oxidation Catalysts for Ethane Partial Oxidation
Juan D. Jimenez [email protected]
Kathleen Mingle
Teeraya Bureerug
Cun Wen
Jochen Lauterbach [email protected]
Follow this and additional works at: https://scholarcommons.sc.edu/eche_facpub
Part of the Chemical Engineering Commons
Publication Info Publication Info Published in Catalysts, Volume 8, Issue 9, 2018, pages 1-16. © 2018 by the authors. Licensee MDPI, Basel, Switzerland. This article is an open access article distributed under the terms and conditions of the Creative Commons Attribution (CC BY) license (http://creativecommons.org/licenses/by/4.0/). Jimenez, J. D., Mingle, K., Bureerug, T., Wen, C., & Lauterbach, J. (2018). Statistically Guided Synthesis of MoV- Based Mixed Oxide Catalysts for Ethane Partial Oxidation. Catalysts, 8(9), 370. doi:10.3390/catal8090370
This Article is brought to you by the Chemical Engineering, Department of at Scholar Commons. It has been accepted for inclusion in Faculty Publications by an authorized administrator of Scholar Commons. For more information, please contact [email protected].

catalysts
Article
Statistically Guided Synthesis of MoV-BasedMixed-Oxide Catalysts for Ethane Partial Oxidation
Juan D. Jimenez 1,†, Kathleen Mingle 1,†, Teeraya Bureerug 2, Cun Wen 1 andJochen Lauterbach 1,*
1 Department of Chemical Engineering, University of South Carolina, Columbia, SC 29208, USA;[email protected] (J.D.J.); [email protected] (K.M.); [email protected] (C.W.)
2 Department of Chemistry, Mahidol University, Bangkok 10400, Thailand; [email protected]* Correspondence: [email protected]; Tel.: +1-803-777-7904† Authors contributed equally.
Received: 15 August 2018; Accepted: 31 August 2018; Published: 2 September 2018�����������������
Abstract: The catalytic performance of Mo8V2Nb1-based mixed-oxide catalysts for ethane partialoxidation is highly sensitive to the doping of elements with redox and acid functionality. Specifically,control over product distributions to ethylene and acetic acid can be afforded via the specific pairingof redox elements (Pd, Ni, Ti) and acid elements (K, Cs, Te) and the levels at which these elements aredoped. The redox element, acid element, redox/acid ratio, and dopant/host ratio were investigatedusing a three-level, four-factor factorial screening design to establish relationships between catalystcomposition, structure, and product distribution for ethane partial oxidation. Results show that thebalance between redox and acid functionality and overall dopant level is important for maximizingthe formation of each product while maintaining the structural integrity of the host metal oxide.Overall, ethylene yield was maximized for a Mo8V2Nb1Ni0.0025Te0.5 composition, while acetic acidyield was maximized for a Mo8V2Nb1Ti0.005Te1 catalyst.
Keywords: ethane partial oxidation; statistical design of experiments; mixed metal oxides
1. Introduction
The catalytic conversion of ethane into olefins and chemicals has been a subject of much researchover the past several decades [1,2]. Conversion of ethane into value-added products goes through eitherethane deoxyhydrogenation, whose main product is ethylene [3–5], or ethane partial oxidation (EPO),which produces various value-added C2 components, such as ethylene [6,7] and acetic acid [8–12].Currently, the development of efficient heterogeneous catalysts for ethane conversion into theirvalue-added products, acetic acid and ethylene, is of interest due to the abundance of low-cost ethanefrom shale gas.
State-of-the-art catalysts for the partial oxidation of short alkanes are typically based onmolybdenum and vanadium mixed oxides, which have been shown to preferentially form value-addedproducts such as acrylic acid and acetic acid [9,12–20]. Elements such as niobium and antimony havebeen added to these Mo-V-O structures with the objective of increasing their structural stability andmaintaining the desired Mo-V phase [10]. Additionally, the stabilization of the active Mo-V-M-O(M = Al, Co, Cr, Fe, and Bi) phase through interactions between the molybdenum and M speciesresulting in the formation of a solid solution during the hydrothermal treatment has been explored asa means of forming a uniform phase [21]. Overall, Nb was found to be the most effective stabilizingagent for the Mo-V-M-O structure, resulting in the mitigation of phase segregation and increasedactivity in both ethane partial oxidation [10,16,22] and ethane oxidative dehydrogenation [20,23].
Catalysts 2018, 8, 370; doi:10.3390/catal8090370 www.mdpi.com/journal/catalysts

Catalysts 2018, 8, 370 2 of 16
In addition to studies focused on stabilizing the Mo-V-O catalyst, recent studies havebeen dedicated to improving the catalytic performance through the incorporation of promoters.Such promoters are typically either acid/base elements, such as tellurium [10,14], calcium,potassium [24], or transition metals with varying redox properties, such as palladium, nickel,and titanium [3,21,22]. Optimal loadings of acid/base elements are typically on the same order ofmagnitude as the loading of niobium into the base catalyst, such as Mo6V2Te1Ox and Mo6V2Sb1Ox [25],where the acid/base elements in this case were tellurium and antimony in place of the niobium.Similarly, in cases where both the niobium and an additional acid/base element is present, their atomicratio remains at approximate unity, such as Mo1V0.22Nb0.15Te0.23 [15,24,26]. Interestingly, in somecases the destabilization of the primary Mo-V-O phase has not resulted in decreased catalytic activity,possibly due to the formation of new active sites in lieu of the Mo-V-O phase. One such exampleis the incorporation of small amounts of alkali metals such as potassium, or basic metals such asbismuth, to MoVTeNbO [24]. Due to extensive segregation of the crystalline structure of mixed-oxidecatalysts upon addition of dopants, forming a clear correlation between catalyst structure, dopants,and performance is currently challenging when comparing the varied literature [24,27–30].
Contrary to findings for acid–element doping, optimal loadings of redox elements vary based onthe reducibility of the metal. For example, incorporating noble metals such as palladium dramaticallyaffects the catalytic activity to favor acetic acid production with the addition of only 0.0025 wt %Pd metal to a Mo0.61V0.31Nb0.08Ox/TiO2 catalyst [12]. However, less reducible transition metals,such as nickel and titanium, appear to require higher loadings to have a comparable effect on activity,where optimal ethylene production was achieved using a Ni0.85Nb0.15Ox catalyst [31] and highacetic acid production was achieved using a Mo6V2Al1Ti0.5Ox catalyst [19]. While the doping ofacid/base elements into Mo-V-O structures has been addressed in depth in several studies [32–34],a comprehensive understanding of how co-incorporating both reducible and acidic species at varyinglevels affects both catalytic activity and structure; specifically, the required balance between reducibilityand acidity remains unclear.
This work is focused on addressing the effects of adding acid and redox elements in various ratiosto elucidate their coupled effects on both ethane partial oxidation and their structural properties to gaininsight into the origins of enhanced activity. To guide this work, a statistical Design of Experiments(DOE) was employed to screen a three-level four-factor (34) full factorial design space of distinctcatalyst formulations based on doping a Mo8V2Nb1 catalyst. A hydrothermal synthesis method wasused to prepare the desired Mo-V-O mixed-oxide crystalline structure. The parameters exploredinclude: transition metal redox element (Pd, Ni, and Ti) doped, acid/base element (K, Cs, and Te)doped, the ratio between the redox and acid/base element (0.005, 0.5, and 1.0), and the total dopantadded relative to the niobium content of the base catalyst (0.005, 0.5, and 1.0). By systematicallyadjusting the acidity and reducibility of the catalyst across a range of elemental combinations, we candraw statistically significant conclusions on the coupled effects of doping Mo8V2Nb1 mixed-oxidecatalysts with elements of varied redox and acid functionality on the catalytic performance in ethanepartial oxidation and the corresponding changes in crystalline structure.
2. Results and Discussion
2.1. Synthesis of Doped Mo8V2Nb1Ox Catalysts
The formation of a uniform solid solution of the Mo-V-O oxide has been widely reported to leadto the preferential oxidation of alkanes to olefins and acids [15,35,36]. In contrast to conventionalmixtures of molybdenum- and vanadium-based oxides, which give rise to multiple oxide phases dueto phase segregation, the high dispersion of the vanadium in the Mo-V-O complex can be achievedvia the formation of a solid solution [15,18,19,21,25]. Furthermore, the Mo-V-O complex allows forthe incorporation of stabilization agents and promoters [29,30,33]. Niobium has been reported asa stabilizing agent in the Mo-V-O structure, helping keep the vanadium and molybdenum species

Catalysts 2018, 8, 370 3 of 16
stable throughout the reaction [8,16–18] by facilitating their redox cycles. The solid solution is dueto the formation of an Anderson-type complex, which is formed upon mixing the molybdenum andniobium precursors to create a (NH4)3NbMo6H6O24 complex [19,25,37]. The Anderson-type complexthen readily reacts with VOSO4 to form the Mo-V-M-O structure, where M here is niobium, and form asolid solution with no observable phase segregation of the individual oxide phases.
A composition of Mo8V2Nb1 was chosen as the base catalyst due its high selectivity towardsacetic acid and ethylene during EPO [12,16]. Additionally, the excess molybdenum in the synthesis gel,where the Anderson-type complex requires a stoichiometry of six to one Mo:Nb, serves to accommodatethe addition of dopants into the base Mo8V2Nb1 structure. The dopants for this work were chosen toprobe the relationship between surface acidity and reducibility and EPO-product distribution [9,22,38].In this study, the reducible metals chosen included palladium, nickel, and titanium. Each of thesedopants varies in terms of their reducibility, with palladium being the most reducible and titaniumbeing the least. Additionally, these metals have been shown to promote EPO to favor the productionof ethylene or acetic acid, both being target products for this system. Palladium is one of themost studied promoters for this system due to its ability to preferentially form acetic acid via anacetaldehyde intermediate [12,17,22,39,40]. Titanium has been chosen as a redox element due toits support interaction effects for EPO [18,39], while nickel has been shown to preferentially formethylene [31,41–43] for various distinct catalytic systems. In a similar manner, the surface acidity wasadjusted by introducing potassium, cesium, or tellurium to the catalyst precursor. These elementswere chosen to cover a range of acidities, where potassium represents a typical alkali group metalof nominal acidity and cesium represents a much stronger acid. Tellurium was chosen as the thirdacid/base component due to its overwhelming precedence in catalyzing EPO to promote greatercatalytic activity and the more selective formation of acetic acid [14,23,26,37,44]. It is important to notethat, while tellurium can contribute catalytic activity via its redox cycling between the +4 and +6 state,its contribution to the overall reducibility of the catalyst is significantly lower than the chosen redoxelements for this study; warranting categorization as an acid/base element in this study and not aredox element.
To address mixed findings in the literature over the effect of the surface acidity and reducibilitybalance, we systematically varied the redox/acid element ratio between the acid elements and theredox elements to various degrees. Since the redox elements tend to affect catalytic activity largelyby electronic effects caused by the electron orbital overlap from the d-shells of the transition metals,typically only small amounts of these elements are required to significantly change the catalytic activity.Conversely, acids affect catalytic activity by changing the surface acidity, where an effect on catalyticactivity is generally only observed at higher doping levels.
2.2. Design of Experiment-Parameter Space
To explore all possible combinations between redox elements and acid elements, we created 81distinct catalyst formulations by adding nine unique dopant pairs to the base Mo8V2Nb1 catalyst,and synthesizing catalysts, including each dopant pair, at nine distinct loadings. Dopant pairs includedthe following: PdK, PdCs, PdTe, NiK, NiCs, NiTe, TiK, TiCs, and TiTe. The balance between redox andacid functionality was tailored by varying the redox to acid (R/A) ratio and the total amount of dopantadded was varied with the dopant to host (D/H) ratio, where each were treated as numerical variablesranging from 0.005, 0.5, and 1.0, as summarized in Table 1. The addition of dopants at different levelscan yield varied effects, ranging from predominantly electronic interactions at low D/H ratios tophase segregation of the dopant species and possible formation of new active sites at high D/H ratios.The wide range of dopant/host ratios screened was intended to cover the range of these possibleeffects. Elemental ratios were relative to the niobium loading of the base catalyst (Nb = 1), where thesum of the both redox and acid species totals to either a D/H ratio of 0.005, 0.5, or 1.0. For illustration,a D/H and R/A ratio of 1.0 corresponds to a composition of Mo8V2Nb1Ni0.5Te0.5.

Catalysts 2018, 8, 370 4 of 16
Table 1. Parameter space for three-level four-factor full factorial design (34).
Factor Variable Type Low Center Point High
A: Redox element (R) Categorical Pd Ni TiB: Acid/base element (A) Categorical K Cs Te
C: Dopant to Host ratio (D/H) Numerical 0.005 0.5 1.0
D: Redox to acid ratio (R/A) Numerical 0.005 0.5 1.0
Catalyst composition: Mo8V2Nb(1 = H)[RRAA]D.
2.3. Energy Dispersive X-ray Spectroscopy (EDS) Elemental Uptake Analysis
The hydrothermal synthesis method employed here proceeds through the formation of anAnderson-type heteromolybdate intermediate for which the possibility of incomplete element uptakeexists [26,27,45]. Variation in elemental composition over the design space was accomplished byvarying the R/A and the D/H ratio. Energy Dispersive X-ray Spectroscopy (EDS) was used to probeboth intended and unintended variation in the loadings of catalyst components. Analysis of the EDSdata was focused on perturbations to the base structure as evidenced by the measured vanadium andniobium contents. It should be noted that nominal loadings for the 81 catalysts were expected to fallin the following compositional range: Mo8V2Nb1R0.000025-0.5A0.0025-1. Over the 81 samples studied,atomic loadings for the Mo8V2Nb1 base composition were found to range from 1.28 ± 0.1 to 3.33 ± 0.84for vanadium, and 0.69 ± 0.12 to 1.17 ± 0.05 for niobium. While some of this variance can be ascribedto an EDS measurement error, certain relationships between the base catalyst uptake and the catalystdesign variables were found to be statistically significant. For instance, uptake of both vanadium andniobium into the structure were negatively correlated with an increased D/H ratio, meaning that,to some extent, the dopants displaced the V and Nb from the material. It should be noted that thiseffect was more pronounced in the case of Nb, with Nb uptake being almost 10% less when D/H wasincreased from 0.005 to 1. This effect was also much more significant when the elements being dopedwere primarily redox elements (i.e., high R/A ratio), as shown in Figure 1. This suggests that the redoxelements were able to displace the niobium in part from the channels of the base structure.Catalysts 2018, 8, x FOR PEER REVIEW 5 of 18
Catalysts 2018, 8, x; doi: FOR PEER REVIEW www.mdpi.com/journal/catalysts
Figure 1. Effect of dopant levels on Nb uptake in MoVNb-based catalysts.
Additionally, some sensitivity was found in terms of Nb and V uptake with respect to the specific redox and acid elements doped. The V uptake was found to be particularly sensitive to the doping of redox elements, being the lowest when Pd was doped, while the Nb uptake was sensitive to both redox and acid doping, with the lowest uptakes corresponding to Ti and Te doping. In general, the least amount of disturbance to the base structure was achieved when balanced levels of redox and acid elements were doped (R/A = 1), and the greatest amount of disturbance was found at the highest doping levels (D/H = 1). Additionally, an interaction between the R/A ratio and D/H ratio was observed where increasing the D/H ratio only caused significant changes to the base structure for high levels of redox element loading (R/A = 1). This indicates that acid/base elements were more easily incorporated into the base structure than redox elements. Overall, it was found that increasing or decreasing D/H and R/A ratios yielded the intended variations in dopant loadings.
2.4. Crystalline Structure of Doped Mo8V2Nb1Ox Catalysts
The crystalline structure of the redox and acid/base element-doped MoVNb catalysts was studied for all samples using powder X-ray diffraction (XRD). The hydrothermally synthesized base MoVNb catalyst, shown in Figure 2, showed the Mo-V-O mixed-oxide phase hallmarked by sharp 22° and 45° (00l) reflections and a broad 27° reflection. Based on the literature [19–21,27], this Mo-V-O structure is ascribed to a slablike structure comprised of both ordered and disordered crystallographic directions. Additional peaks could be ascribed to MoO3, Mo6V9O40, and/or Mo3Nb2O11 [16,28,32,46]. To understand the influence of the redox and acid/base dopants, as well as their relative and overall doping levels, differences between the hydrothermally prepared base MoVNb and doped MoVNb catalysts were studied.
Figure 1. Effect of dopant levels on Nb uptake in MoVNb-based catalysts.
Additionally, some sensitivity was found in terms of Nb and V uptake with respect to the specificredox and acid elements doped. The V uptake was found to be particularly sensitive to the doping ofredox elements, being the lowest when Pd was doped, while the Nb uptake was sensitive to both redoxand acid doping, with the lowest uptakes corresponding to Ti and Te doping. In general, the leastamount of disturbance to the base structure was achieved when balanced levels of redox and acidelements were doped (R/A = 1), and the greatest amount of disturbance was found at the highest

Catalysts 2018, 8, 370 5 of 16
doping levels (D/H = 1). Additionally, an interaction between the R/A ratio and D/H ratio wasobserved where increasing the D/H ratio only caused significant changes to the base structure forhigh levels of redox element loading (R/A = 1). This indicates that acid/base elements were moreeasily incorporated into the base structure than redox elements. Overall, it was found that increasingor decreasing D/H and R/A ratios yielded the intended variations in dopant loadings.
2.4. Crystalline Structure of Doped Mo8V2Nb1Ox Catalysts
The crystalline structure of the redox and acid/base element-doped MoVNb catalysts was studiedfor all samples using powder X-ray diffraction (XRD). The hydrothermally synthesized base MoVNbcatalyst, shown in Figure 2, showed the Mo-V-O mixed-oxide phase hallmarked by sharp 22◦ and45◦ (00l) reflections and a broad 27◦ reflection. Based on the literature [19–21,27], this Mo-V-Ostructure is ascribed to a slablike structure comprised of both ordered and disordered crystallographicdirections. Additional peaks could be ascribed to MoO3, Mo6V9O40, and/or Mo3Nb2O11 [16,28,32,46].To understand the influence of the redox and acid/base dopants, as well as their relative and overalldoping levels, differences between the hydrothermally prepared base MoVNb and doped MoVNbcatalysts were studied.
Catalysts 2018, 8, x FOR PEER REVIEW 6 of 18
Catalysts 2018, 8, x; doi: FOR PEER REVIEW www.mdpi.com/journal/catalysts
Figure 2. X-ray diffraction (XRD) pattern of hydrothermally prepared base MoVNbOx catalyst.
The analysis of the XRD data focused on both the position and the Full-Width Half-Maximum (FWHM) of the main 22° peak to calculate the d-spacing and grain size of the Mo-V oxide, where this peak is correlated to the crystallographic structure denoted as the “M1 phase” in the literature [20,28,46]. Additionally, crystal faceting of the primary slablike Mo-V-O phase was analyzed by measuring the intensity ratio between the sharp 22° peak, showing the ordered crystallographic growth direction, and the disordered amorphous peak at 27°. The correlation between the intensity of the 22° reflection and the specific activity for ethane oxydehydrogenation (ODH) has been proposed as an indicator for the preferential formation of olefins or oxygenates in the Mo-V system[20]. Additionally, it was found that secondary phases were formed on top of the base Mo-V-O structure when doped with certain redox and acid/base elements at varying levels. The identity of these secondary phases are assorted Mo- and V-based oxides of different stoichiometry as well as, in a few cases, reflections from small particles of segregated oxides of redox/acid/base dopants. While exhaustive structural resolution of each design point was out of the scope of this study, the conditions under which secondary-phase formation occurred were noted and relative intensities between the main reflection and the most intense peak arising from secondary phases were calculated to indicate the relative volume of the catalyst involved in secondary-phase formation.
First, the d-spacing of the mixed-oxide indicated by the peak location of the 22° reflection (d = 4.01 Å) was tracked for each sample as a possible gauge for dopant incorporation directly into the mixed-oxide lattice [46,47]. In such a situation an increase in d-spacing (evidenced by a peak shift to lower 2θ) would be expected, since most dopant elements have large radius compared with Mo, V and Nb. It was found, however, that the d-spacings of the 22° reflection for the doped samples only ranged from 3.98 to 4.02. This small range of d-spacings supports the conclusion that the various redox and acid/base dopants investigated were not actually incorporated directly into the mixed-oxide lattice and most likely reside in the six- and seven-membered rings formed by the Mo-V-O structure, where these vacancies allow for the insertion of atoms [32].
The grain sizes calculated via Scherrer’s equation from the FWHM of 22° peak of the doped MoVNb samples were found to be sensitive to both the type of dopants and the levels studied. These parameters were investigated to understand how different doping levels could change the active surface area and/or redox properties of the catalysts; effects which may be expected to accompany a change in Mo-V-O grain
Figure 2. X-ray diffraction (XRD) pattern of hydrothermally prepared base MoVNbOx catalyst.
The analysis of the XRD data focused on both the position and the Full-Width Half-Maximum(FWHM) of the main 22◦ peak to calculate the d-spacing and grain size of the Mo-V oxide, where thispeak is correlated to the crystallographic structure denoted as the “M1 phase” in the literature [20,28,46].Additionally, crystal faceting of the primary slablike Mo-V-O phase was analyzed by measuring theintensity ratio between the sharp 22◦ peak, showing the ordered crystallographic growth direction,and the disordered amorphous peak at 27◦. The correlation between the intensity of the 22◦ reflectionand the specific activity for ethane oxydehydrogenation (ODH) has been proposed as an indicator forthe preferential formation of olefins or oxygenates in the Mo-V system [20]. Additionally, it was foundthat secondary phases were formed on top of the base Mo-V-O structure when doped with certainredox and acid/base elements at varying levels. The identity of these secondary phases are assortedMo- and V-based oxides of different stoichiometry as well as, in a few cases, reflections from smallparticles of segregated oxides of redox/acid/base dopants. While exhaustive structural resolution ofeach design point was out of the scope of this study, the conditions under which secondary-phaseformation occurred were noted and relative intensities between the main reflection and the mostintense peak arising from secondary phases were calculated to indicate the relative volume of thecatalyst involved in secondary-phase formation.
First, the d-spacing of the mixed-oxide indicated by the peak location of the 22◦ reflection(d = 4.01 Å) was tracked for each sample as a possible gauge for dopant incorporation directly intothe mixed-oxide lattice [46,47]. In such a situation an increase in d-spacing (evidenced by a peak shift

Catalysts 2018, 8, 370 6 of 16
to lower 2θ) would be expected, since most dopant elements have large radius compared with Mo,V and Nb. It was found, however, that the d-spacings of the 22◦ reflection for the doped samplesonly ranged from 3.98 to 4.02. This small range of d-spacings supports the conclusion that the variousredox and acid/base dopants investigated were not actually incorporated directly into the mixed-oxidelattice and most likely reside in the six- and seven-membered rings formed by the Mo-V-O structure,where these vacancies allow for the insertion of atoms [32].
The grain sizes calculated via Scherrer’s equation from the FWHM of 22◦ peak of the dopedMoVNb samples were found to be sensitive to both the type of dopants and the levels studied.These parameters were investigated to understand how different doping levels could change the activesurface area and/or redox properties of the catalysts; effects which may be expected to accompanya change in Mo-V-O grain size. The grain size of the base MoVNb material, calculated using thebroadening of the 22◦ peak according to Scherrer’s equation [48,49], was 22 nm. Identical analysisof the doped MoVNb catalysts showed that the range of grain sizes was 12.4–35.0 nm, dependingon the design levels employed. Statistical analysis of the relationship between doping elements andlevels with grain size revealed that the most important factors for controlling grain size were the typeof redox element and the D/H ratio, as well as the interaction between the two. It was found thatdoping with Ni increased grain size most significantly, while Ti yielded grain sizes that were smallerand, on average, identical to that of the base MoVNb oxide. In general, increasing dopant levels hadthe effect of decreasing grain sizes, but at the lowest level of D/H = 0.005, no notable difference couldbe seen between the grain sizes when Pd, Ni, or Ti was doped. In an analogous manner, differencesbetween grain sizes of Pd-, Ni-, and Ti-doped materials were only apparent at R/A ratios of 0.5 orgreater. These interactions simply indicate that the different behavior of redox elements with respectto grain size were not apparent under the conditions where the redox elements were doped in thesmallest amounts (i.e., small D/H and R/A ratios). The observation of decreased grain sizes at higherdopant levels, as can be seen for the MoVNbNiCs family of catalysts at the R/A = 0.5 level in Figure 3,leads to the question of whether one of the effects of the redox dopant is to impede the crystal growthof the primary mixed-oxide phase.
Catalysts 2018, 8, x FOR PEER REVIEW 7 of 18
Catalysts 2018, 8, x; doi: FOR PEER REVIEW www.mdpi.com/journal/catalysts
size. The grain size of the base MoVNb material, calculated using the broadening of the 22° peak according to Scherrer’s equation [48,49], was 22 nm. Identical analysis of the doped MoVNb catalysts showed that the range of grain sizes was 12.4–35.0 nm, depending on the design levels employed. Statistical analysis of the relationship between doping elements and levels with grain size revealed that the most important factors for controlling grain size were the type of redox element and the D/H ratio, as well as the interaction between the two. It was found that doping with Ni increased grain size most significantly, while Ti yielded grain sizes that were smaller and, on average, identical to that of the base MoVNb oxide. In general, increasing dopant levels had the effect of decreasing grain sizes, but at the lowest level of D/H = 0.005, no notable difference could be seen between the grain sizes when Pd, Ni, or Ti was doped. In an analogous manner, differences between grain sizes of Pd-, Ni-, and Ti-doped materials were only apparent at R/A ratios of 0.5 or greater. These interactions simply indicate that the different behavior of redox elements with respect to grain size were not apparent under the conditions where the redox elements were doped in the smallest amounts (i.e., small D/H and R/A ratios). The observation of decreased grain sizes at higher dopant levels, as can be seen for the MoVNbNiCs family of catalysts at the R/A = 0.5 level in Figure 3, leads to the question of whether one of the effects of the redox dopant is to impede the crystal growth of the primary mixed-oxide phase.
Figure 3. XRD grain size differences for MoVNbNiCs at varied dopant levels.
The relative intensity of the ordered 22° reflection scaled to the intensity of the disordered 27° reflection was investigated as an indication of ordered preferential growth. For convenience, this will be referred to as the primary-phase intensity ratio (PPIR). The base formulation of MoVNb was found to have a PPIR of 3.41. R/A and D/H ratios were found to affect the PPIR significantly, with increasing each having the effect of decreasing the PPIR. It was also found that the significance of the effect of changing the D/H ratio was most apparent at the low R/A level of 0.005. In practice, this means that the highest PPIR values, and the only values that were greater than the base catalyst PPIR, occurred for catalysts with both low overall dopant levels and high relative levels of acid/base dopant (D/H = R/A = 0.005), as shown in Figure 4. Interestingly, the redox and acid/base elements doped were found to have virtually no effect on this measurement, meaning that nearly identical trends held for all redox-acid/base pairs were studied.
Figure 3. XRD grain size differences for MoVNbNiCs at varied dopant levels.
The relative intensity of the ordered 22◦ reflection scaled to the intensity of the disordered 27◦
reflection was investigated as an indication of ordered preferential growth. For convenience, this willbe referred to as the primary-phase intensity ratio (PPIR). The base formulation of MoVNb was foundto have a PPIR of 3.41. R/A and D/H ratios were found to affect the PPIR significantly, with increasingeach having the effect of decreasing the PPIR. It was also found that the significance of the effect ofchanging the D/H ratio was most apparent at the low R/A level of 0.005. In practice, this meansthat the highest PPIR values, and the only values that were greater than the base catalyst PPIR,occurred for catalysts with both low overall dopant levels and high relative levels of acid/base dopant

Catalysts 2018, 8, 370 7 of 16
(D/H = R/A = 0.005), as shown in Figure 4. Interestingly, the redox and acid/base elements dopedwere found to have virtually no effect on this measurement, meaning that nearly identical trends heldfor all redox-acid/base pairs were studied.
Catalysts 2018, 8, x FOR PEER REVIEW 8 of 18
Catalysts 2018, 8, x; doi: FOR PEER REVIEW www.mdpi.com/journal/catalysts
Figure 4. XRD primary-phase intensity ratio variations with dopant level.
The final structural descriptor studied via XRD analysis was the formation and relative volume of secondary phases. This variable is important in understanding trends in activity due to its direct relation to the abundance of the active Mo-V-O phase. This will be defined as the secondary-phase intensity ratio (SPIR); the XRD intensity ratio between the largest secondary phase peak and the largest Mo-V-O primary phase peak was at 22° 2θ. While the doped redox element, particularly when the element was Pd, affected the occurrence of secondary phases, it had no significant effect on the SPIR. The SPIR was found to be mostly sensitive to the type of acid/base element doped as well as the R/A and D/H ratios. Specifically, it was found that doping with Cs at an R/A level of 0.005 yielded the highest SPIRs, and this effect was increasingly apparent at higher D/H ratios. The effect of increased SPIR with decreased R/A ratio and increased D/H ratio held for other redox–acid/base pairings as well, but at a much smaller magnitude. The effect of secondary-phase formation when Cs was doped is illustrated in Figure 5.
Figure 4. XRD primary-phase intensity ratio variations with dopant level.
The final structural descriptor studied via XRD analysis was the formation and relative volumeof secondary phases. This variable is important in understanding trends in activity due to its directrelation to the abundance of the active Mo-V-O phase. This will be defined as the secondary-phaseintensity ratio (SPIR); the XRD intensity ratio between the largest secondary phase peak and the largestMo-V-O primary phase peak was at 22◦ 2θ. While the doped redox element, particularly when theelement was Pd, affected the occurrence of secondary phases, it had no significant effect on the SPIR.The SPIR was found to be mostly sensitive to the type of acid/base element doped as well as the R/Aand D/H ratios. Specifically, it was found that doping with Cs at an R/A level of 0.005 yielded thehighest SPIRs, and this effect was increasingly apparent at higher D/H ratios. The effect of increasedSPIR with decreased R/A ratio and increased D/H ratio held for other redox–acid/base pairings aswell, but at a much smaller magnitude. The effect of secondary-phase formation when Cs was dopedis illustrated in Figure 5.
Catalysts 2018, 8, x FOR PEER REVIEW 9 of 18
Catalysts 2018, 8, x; doi: FOR PEER REVIEW www.mdpi.com/journal/catalysts
Figure 5. XRD secondary-phase formation in selected samples (R/A = 0.005 and D/H = 0.5).
2.5. Ethane Partial Oxidation
2.5.1. Ethane Partial Oxidation on Doped Mo8V2Nb1 Catalysts
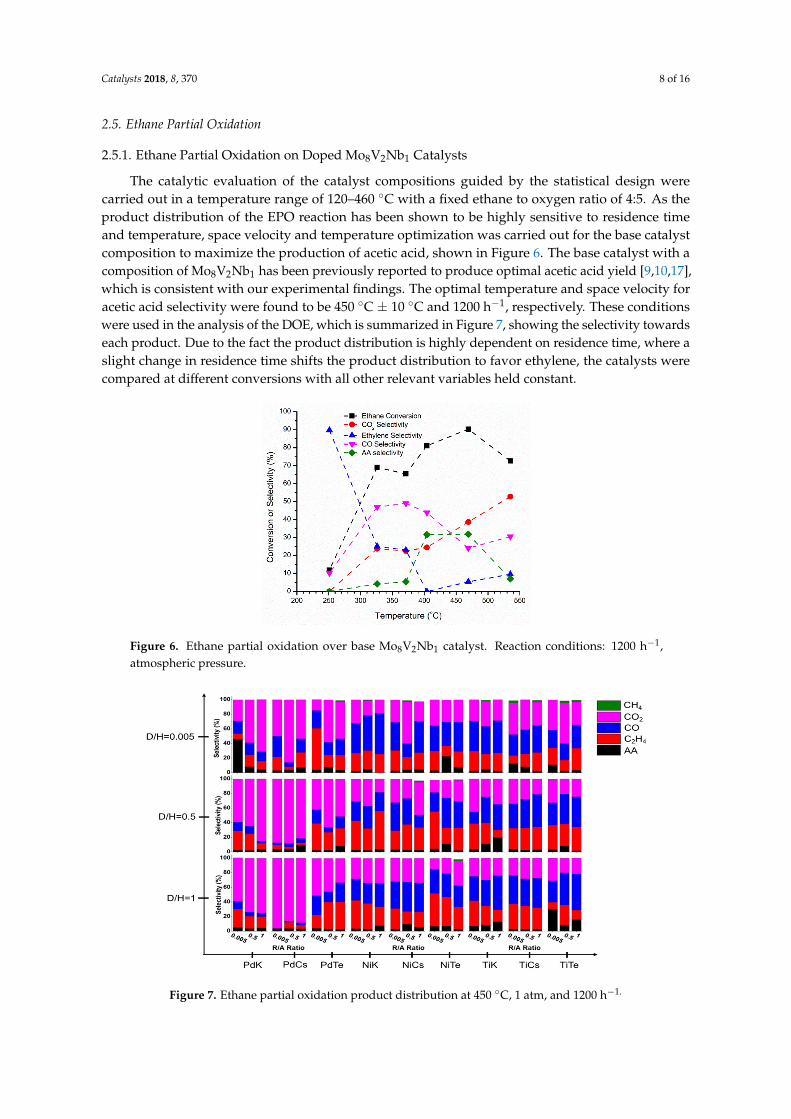
The catalytic evaluation of the catalyst compositions guided by the statistical design were carried out in a temperature range of 120–460 °C with a fixed ethane to oxygen ratio of 4:5. As the product distribution of the EPO reaction has been shown to be highly sensitive to residence time and temperature, space velocity and temperature optimization was carried out for the base catalyst composition to maximize the production of acetic acid, shown in Figure 6. The base catalyst with a composition of Mo8V2Nb1 has been previously reported to produce optimal acetic acid yield [9,10,17], which is consistent with our experimental findings. The optimal temperature and space velocity for acetic acid selectivity were found to be 450 °C ± 10 °C and 1200 h−1, respectively. These conditions were used in the analysis of the DOE, which is summarized in Figure 7, showing the selectivity towards each product. Due to the fact the product distribution is highly dependent on residence time, where a slight change in residence time shifts the product distribution to favor ethylene, the catalysts were compared at different conversions with all other relevant variables held constant.
Figure 5. XRD secondary-phase formation in selected samples (R/A = 0.005 and D/H = 0.5).
Catalysts 2018, 8, 370 8 of 16
2.5. Ethane Partial Oxidation
2.5.1. Ethane Partial Oxidation on Doped Mo8V2Nb1 Catalysts
The catalytic evaluation of the catalyst compositions guided by the statistical design werecarried out in a temperature range of 120–460 ◦C with a fixed ethane to oxygen ratio of 4:5. As theproduct distribution of the EPO reaction has been shown to be highly sensitive to residence timeand temperature, space velocity and temperature optimization was carried out for the base catalystcomposition to maximize the production of acetic acid, shown in Figure 6. The base catalyst with acomposition of Mo8V2Nb1 has been previously reported to produce optimal acetic acid yield [9,10,17],which is consistent with our experimental findings. The optimal temperature and space velocity foracetic acid selectivity were found to be 450 ◦C ± 10 ◦C and 1200 h−1, respectively. These conditionswere used in the analysis of the DOE, which is summarized in Figure 7, showing the selectivity towardseach product. Due to the fact the product distribution is highly dependent on residence time, where aslight change in residence time shifts the product distribution to favor ethylene, the catalysts werecompared at different conversions with all other relevant variables held constant.
Catalysts 2018, 8, x FOR PEER REVIEW 10 of 18
Catalysts 2018, 8, x; doi: FOR PEER REVIEW www.mdpi.com/journal/catalysts
Figure 6. Ethane partial oxidation over base Mo8V2Nb1 catalyst. Reaction conditions: 1200 h−1, atmospheric pressure.
Figure 7. Ethane partial oxidation product distribution at 450 °C, 1 atm, and 1200 h−1.
The product distribution at 450 °C for all 81 doped Mo8V2Nb1Ox catalysts is shown in Figure 7. Design of experiments was used to elucidate statistically significant relationships between design levels and product distribution. The analysis of effects relevant to the catalytic activity is highlighted in Table 2, which shows the trends across the different redox and acid/base elements, the D/H ratio, and the R/A ratio. A main conclusion from this analysis is that each variable investigated—redox element, acid/base element, redox/acid ratio, and dopant/host ratio—had significant effects on ethane conversion and product distribution. Furthermore, the effects of external mass transfer limitations were explored by reproducing catalytic activity with varying catalyst mesh sizes, where the same catalyst composition with
Figure 6. Ethane partial oxidation over base Mo8V2Nb1 catalyst. Reaction conditions: 1200 h−1,atmospheric pressure.
Catalysts 2018, 8, x FOR PEER REVIEW 10 of 18
Catalysts 2018, 8, x; doi: FOR PEER REVIEW www.mdpi.com/journal/catalysts
Figure 6. Ethane partial oxidation over base Mo8V2Nb1 catalyst. Reaction conditions: 1200 h−1, atmospheric pressure.
Figure 7. Ethane partial oxidation product distribution at 450 °C, 1 atm, and 1200 h−1.
The product distribution at 450 °C for all 81 doped Mo8V2Nb1Ox catalysts is shown in Figure 7. Design of experiments was used to elucidate statistically significant relationships between design levels and product distribution. The analysis of effects relevant to the catalytic activity is highlighted in Table 2, which shows the trends across the different redox and acid/base elements, the D/H ratio, and the R/A ratio. A main conclusion from this analysis is that each variable investigated—redox element, acid/base element, redox/acid ratio, and dopant/host ratio—had significant effects on ethane conversion and product distribution. Furthermore, the effects of external mass transfer limitations were explored by reproducing catalytic activity with varying catalyst mesh sizes, where the same catalyst composition with
Figure 7. Ethane partial oxidation product distribution at 450 ◦C, 1 atm, and 1200 h−1.
Catalysts 2018, 8, 370 9 of 16
The product distribution at 450 ◦C for all 81 doped Mo8V2Nb1Ox catalysts is shown in Figure 7.Design of experiments was used to elucidate statistically significant relationships between designlevels and product distribution. The analysis of effects relevant to the catalytic activity is highlightedin Table 2, which shows the trends across the different redox and acid/base elements, the D/H ratio,and the R/A ratio. A main conclusion from this analysis is that each variable investigated—redoxelement, acid/base element, redox/acid ratio, and dopant/host ratio—had significant effects on ethaneconversion and product distribution. Furthermore, the effects of external mass transfer limitationswere explored by reproducing catalytic activity with varying catalyst mesh sizes, where the samecatalyst composition with a mesh size <125 µm performed identical to the same composition with amesh size of 500–400 µm in both the differential conversion regime and the high conversion regime,as shown in Figure S1.
Table 2. Summary of Design of Experiments (DOE) main effects.
Factor EthaneConversion
EtheneSelectivity
Acetic AcidSelectivity
Secondary-PhaseAbundance Grain Size
Redox element Ti > Ni >> Pd Ni > Ti >> Pd Ti > Pd > Ni No effect Ni > Pd > TiAcid/base element Te > K > Cs Te > K > Cs K = Te > Cs Cs > Te > K No effectRedox/acid ratio No effect 0.005 optimal 0.005 optimal Decreases No effect
Dopant/host ratio 1 optimal 0.5 optimal(0.005 for Pd) 0.005 optimal Increases Decreases
2.5.2. Effect of Doping Mo8V2Nb1Ox on EPO Product Distribution
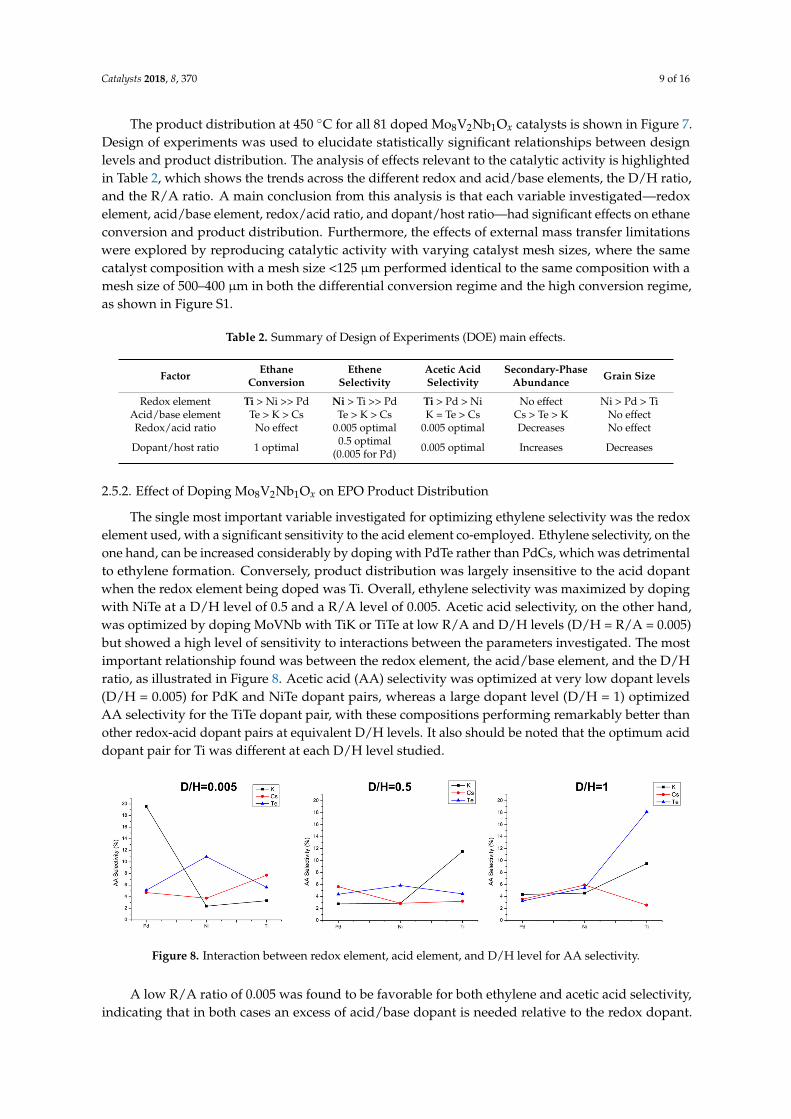
The single most important variable investigated for optimizing ethylene selectivity was the redoxelement used, with a significant sensitivity to the acid element co-employed. Ethylene selectivity, on theone hand, can be increased considerably by doping with PdTe rather than PdCs, which was detrimentalto ethylene formation. Conversely, product distribution was largely insensitive to the acid dopantwhen the redox element being doped was Ti. Overall, ethylene selectivity was maximized by dopingwith NiTe at a D/H level of 0.5 and a R/A level of 0.005. Acetic acid selectivity, on the other hand,was optimized by doping MoVNb with TiK or TiTe at low R/A and D/H levels (D/H = R/A = 0.005)but showed a high level of sensitivity to interactions between the parameters investigated. The mostimportant relationship found was between the redox element, the acid/base element, and the D/Hratio, as illustrated in Figure 8. Acetic acid (AA) selectivity was optimized at very low dopant levels(D/H = 0.005) for PdK and NiTe dopant pairs, whereas a large dopant level (D/H = 1) optimizedAA selectivity for the TiTe dopant pair, with these compositions performing remarkably better thanother redox-acid dopant pairs at equivalent D/H levels. It also should be noted that the optimum aciddopant pair for Ti was different at each D/H level studied.
Catalysts 2018, 8, x FOR PEER REVIEW 11 of 18
Catalysts 2018, 8, x; doi: FOR PEER REVIEW www.mdpi.com/journal/catalysts
a mesh size <125 μm performed identical to the same composition with a mesh size of 500–400 μm in both the differential conversion regime and the high conversion regime, as shown in Figure S1.
Table 2. Summary of Design of Experiments (DOE) main effects.
Factor Ethane
Conversion Ethene
Selectivity Acetic Acid Selectivity
Secondary-Phase Abundance
Grain Size
Redox element
Ti >Ni >> Pd Ni > Ti >> Pd Ti > Pd > Ni No effect Ni > Pd > Ti
Acid/base element
Te > K > Cs Te > K > Cs K = Te > Cs Cs > Te > K No effect
Redox/acid ratio
No effect 0.005 optimal 0.005 optimal Decreases No effect
Dopant/host ratio
1 optimal 0.5 optimal
(0.005 for Pd) 0.005 optimal Increases Decreases
2.5.2. Effect of Doping Mo8V2Nb1Ox on EPO Product Distribution
The single most important variable investigated for optimizing ethylene selectivity was the redox element used, with a significant sensitivity to the acid element co-employed. Ethylene selectivity, on the one hand, can be increased considerably by doping with PdTe rather than PdCs, which was detrimental to ethylene formation. Conversely, product distribution was largely insensitive to the acid dopant when the redox element being doped was Ti. Overall, ethylene selectivity was maximized by doping with NiTe at a D/H level of 0.5 and a R/A level of 0.005. Acetic acid selectivity, on the other hand, was optimized by doping MoVNb with TiK or TiTe at low R/A and D/H levels (D/H = R/A = 0.005) but showed a high level of sensitivity to interactions between the parameters investigated. The most important relationship found was between the redox element, the acid/base element, and the D/H ratio, as illustrated in Figure 8. Acetic acid (AA) selectivity was optimized at very low dopant levels (D/H = 0.005) for PdK and NiTe dopant pairs, whereas a large dopant level (D/H = 1) optimized AA selectivity for the TiTe dopant pair, with these compositions performing remarkably better than other redox-acid dopant pairs at equivalent D/H levels. It also should be noted that the optimum acid dopant pair for Ti was different at each D/H level studied.
Figure 8. Interaction between redox element, acid element, and D/H level for AA selectivity.
A low R/A ratio of 0.005 was found to be favorable for both ethylene and acetic acid selectivity, indicating that in both cases an excess of acid/base dopant is needed relative to the redox dopant. This is consistent with the literature, where the incorporation of acid/base elements at an atomic ratio of ~2:1 between V and the acid/base element has been shown to result in the increased formation of value-added
Figure 8. Interaction between redox element, acid element, and D/H level for AA selectivity.
A low R/A ratio of 0.005 was found to be favorable for both ethylene and acetic acid selectivity,indicating that in both cases an excess of acid/base dopant is needed relative to the redox dopant.

Catalysts 2018, 8, 370 10 of 16
This is consistent with the literature, where the incorporation of acid/base elements at an atomic ratioof ~2:1 between V and the acid/base element has been shown to result in the increased formation ofvalue-added products in partial oxidation reactions [13,15,38]. Surface acidity is thought to play alarge role in product selectivity, where acid sites promote the formation and subsequent desorptionof acetic acid, while ethylene preferentially forms and desorbs on reducible sites [9,50], such as thosefound on the redox elements. However, in this case, it was found that acid sites were also necessaryfor the formation of ethylene. The role of surface acidity also extends to other catalytic systemsfor the conversion of ethane into value-added products, where in the oxidative dehydrogenation ofethane, the inclusion of highly basic metals such as platinum leads to increased selectivity towardsethylene [4,6]. It is well-known that dopant effects can considerably affect catalytic activity whendoping with transition metals due to the electronic interactions between the metals and the host oxidestructure [6,8,12,17,22,31].
Two distinct mechanisms are possible in the partial oxidation of ethane into ethylene and AA.The first possibility is the direct oxidation of ethane via a CH3CH2O* intermediate species followedby the subsequent oxidation to acetic acid [1,11,16,51]; the second is the oxidation of an adsorbedethylene species through a Wacker mechanism involving a surface X-O site that reacts with water toform a X-OHOH site capable of converting ethylene to AA [9,22]. In our findings, an increase in AAformation was generally coupled with an immediate decrease in ethylene, suggesting that AA wasforming mainly through the oxidation of readsorbed ethylene via the Wacker mechanism. However,the possibility of parallel pathways cannot be ruled out entirely as the products were often coproduced.
2.5.3. Effect of Doped Mo8V2Nb1 Structure on Catalytic Activity
While a small R/A ratio being favorable for both acetic acid and ethylene formation can beattributed in part to an excess of surface acidity necessary relative to redox properties, it should benoted that small R/A levels were highly correlated with high PPIRs introduced previously. In fact,at the low D/H and low R/A pairing, the PPIR was as much as four times greater than its value atother D/H and R/A combinations. This is consistent with observations of increased ethane-oxidationactivity at higher intensity ratios reported previously [20]. It follows that, in addition to creatingfavorable surface acid properties for reactivity, an excess of acid dopant could play a role in extendingthe aspect ratio of the slablike structure of the primary active Mo-V-O phase indicated by the PPIR.
On the other hand, smaller D/H levels (D/H = 0.005) were preferable for acetic acid formation,while intermediate levels were optimum for ethylene formation (D/H = 0.5). It should be noted thathigh D/H levels were associated with smaller Mo-V-O grain sizes measured with XRD and lowerV and Nb uptake into the base catalysts evidenced by EDS. These results suggest that control overproduct distribution may be afforded through a combination of appropriate catalyst stoichiometry andtuning of grain size. It is clear, however, that a large displacement of V from the Mo-V-O structure isunfavorable for all value product yields, as this was observed to the greatest extent for high dopinglevels of Pd and Cs, which on average yielded the lowest selectivity towards both acetic acid andethylene. This is consistent with the role of vanadia as a catalytically active center for alkane activationand olefin production [9,52,53].
In fact, the presence of Cs was detrimental to both ethylene and AA formation for all redoxelements at all D/H and R/A levels, leading to the formation of almost exclusively total oxidationproducts. This is likely because Cs disrupts the structural integrity of the host, as evidenced by theformation of secondary phases visible in XRD. As the primary Mo-V-O phase, hallmarked by thecharacteristic 22◦ XRD peak, has been attributed to the preferential oxidation towards olefins andacids [20,54], it is reasonable to assume that the destabilization of this phase and secondary-phaseformation induced by Cs would negatively affect activity through the loss of AA and ethylene-selectivesites or formation of combustion sites. This type of structural disturbance induced by dopant additionto the base Mo-V-O structure is markedly different from that observed by others, where activity hasbeen found to increase with increased dopant concentrations accompanied by higher defect densities

Catalysts 2018, 8, 370 11 of 16
and more polydisperse crystallites [24]. Additionally, decreased activity can also be attributed to adisruption of the crystalline M1/M2 structure, which can hinder lattice oxygen mobility that results ina loss in selectivity towards acids and olefins from alkane oxidation [22,36,55]. The difference in theobserved structural effect is possibly due to the very large atomic radius of Cs in comparison to otherdopants studied.
To address the finding that the doped MoVNb reached different levels of conversion at 450 ◦C,the catalysts were compared according to their ethylene and acetic acid selectivity as a function ofconversion, as shown in Figure 9. Catalysts are labeled by their standard orders according to the 34
full factorial design. The corresponding factorial design levels (dopants and loadings) for each designpoint are shown in Table 1 of the supporting info. To understand how changing the conversion levelchanged the selectivity of the most promising materials, the optimum catalysts were compared atdifferent conversions achieved by ramping the catalyst bed temperature in the range of 250–550 ◦C.Optimum catalysts were defined as those samples that reached the highest AA or ethylene selectivityat the highest possible ethane conversions at 450 ◦C, as shown in Figure 7. The ethylene and aceticacid selectivity of the selected catalysts at varied conversions are shown in Figure 10. In general,ethylene selectivity decreased with increased conversion, corresponding to higher bed temperatures,while acetic acid selectivity increased. For most catalysts, acetic acid selectivity was maximized atconversions >80%, while ethylene selectivity was maximized at conversions <20%. While kineticunderstanding of the system is convoluted at high conversion, we chose to maximize the total yield ofacetic acid by optimizing the system for high conversion and high acetic selectivity, shown in Figure 9.
Catalysts 2018, 8, x FOR PEER REVIEW 13 of 18
Catalysts 2018, 8, x; doi: FOR PEER REVIEW www.mdpi.com/journal/catalysts
M1/M2 structure, which can hinder lattice oxygen mobility that results in a loss in selectivity towards acids and olefins from alkane oxidation [22,36,55]. The difference in the observed structural effect is possibly due to the very large atomic radius of Cs in comparison to other dopants studied.
To address the finding that the doped MoVNb reached different levels of conversion at 450 °C, the catalysts were compared according to their ethylene and acetic acid selectivity as a function of conversion, as shown in Figure 9. Catalysts are labeled by their standard orders according to the 34 full factorial design. The corresponding factorial design levels (dopants and loadings) for each design point are shown in Table 1 of the supporting info. To understand how changing the conversion level changed the selectivity of the most promising materials, the optimum catalysts were compared at different conversions achieved by ramping the catalyst bed temperature in the range of 250–550 °C. Optimum catalysts were defined as those samples that reached the highest AA or ethylene selectivity at the highest possible ethane conversions at 450 °C, as shown in Figure 7. The ethylene and acetic acid selectivity of the selected catalysts at varied conversions are shown in Figure 10. In general, ethylene selectivity decreased with increased conversion, corresponding to higher bed temperatures, while acetic acid selectivity increased. For most catalysts, acetic acid selectivity was maximized at conversions >80%, while ethylene selectivity was maximized at conversions <20%. While kinetic understanding of the system is convoluted at high conversion, we chose to maximize the total yield of acetic acid by optimizing the system for high conversion and high acetic selectivity, shown in Figure 9.
Figure 9. Ethylene and acetic acid selectivity vs. conversion for all samples at 450 °C. Figure 9. Ethylene and acetic acid selectivity vs. conversion for all samples at 450 ◦C.
Catalysts 2018, 8, x FOR PEER REVIEW 14 of 18
Catalysts 2018, 8, x; doi: FOR PEER REVIEW www.mdpi.com/journal/catalysts
Figure 10. Ethylene and acetic acid selectivity vs. ethane conversion for optimum catalysts.
3. Experimental Methods
3.1. Catalyst Synthesis
A typical catalyst composition was synthesized using 4.03 g ammonium molybdate tetrahydrate (Sigma-Aldrich, St. Louis, MO, USA, 81–83% MoO3 basis) mixed with 0.88 g ammonium niobate (V) oxalate hydrate (Sigma-Aldrich, St. Louis, MO, USA, 99.95%) in 60 mL of deionized water (DI water) while heating to 50 °C to ensure complete solvation of the precursors. The vanadium precursor was prepared in a separate container consisting of 1.73 g of vanadium oxide sulfate (Sigma-Aldrich, St. Louis, MO, USA, 97%) in 15 mL of DI water at 50 °C. Dopants were added before mixing the base catalyst components via stock solutions of either ammonium tetrachloropalladate (Sigma-Aldrich, St. Louis, MO, USA, 97%), titanium sulfate solution (Sigma-Aldrich, St. Louis, MO, USA, 99.9%), nickel sulfate (Sigma-Aldrich, St. Louis, MO, USA, 99.99%), cesium sulfate (Sigma-Aldrich, St. Louis, MO, USA, 99.99%), telluric acid (Sigma-Aldrich, St. Louis, MO, USA, 98%), and potassium sulfate (Sigma-Aldrich, St. Louis, MO, USA, 99%), prepared via dissolving the precursor salts in DI water. After addition of the required amount of dopant, the molybdenum/niobium and vanadium solution were added to the dopant mixture and allowed to mix for 20 min under stirring. The mixed precursors were then transferred into Teflon liners and set in autoclaves to carry out the hydrothermal synthesis at 175 °C for 48 h. Upon completion of the hydrothermal synthesis, the catalyst was washed with water and acetone to ensure only the precipitated product was recovered, after which the washed catalyst was set to dry at 120 °C for 2 h followed by calcination at 400 °C for 4 hours in air using a 10 °C ramp rate for heating and cooling. Synthesis of the base catalyst was carried out following the same steps without the addition of dopants.
3.2. XRD
X-ray diffraction was carried out for all samples in a Rigaku Miniflex II (Tokyo, Japan) equipped with a Cu-Kα X-ray source and a high-speed silicon-strip detector. Scans were completed between a 10 and 90° 2θ angle at a rate of 2 °/min with step size of 0.02°.
3.3. Scanning Electron Microscopy/EDS (SEM/EDS)
Figure 10. Ethylene and acetic acid selectivity vs. ethane conversion for optimum catalysts.

Catalysts 2018, 8, 370 12 of 16
3. Experimental Methods
3.1. Catalyst Synthesis
A typical catalyst composition was synthesized using 4.03 g ammonium molybdate tetrahydrate(Sigma-Aldrich, St. Louis, MO, USA, 81–83% MoO3 basis) mixed with 0.88 g ammonium niobate(V) oxalate hydrate (Sigma-Aldrich, St. Louis, MO, USA, 99.95%) in 60 mL of deionized water (DIwater) while heating to 50 ◦C to ensure complete solvation of the precursors. The vanadium precursorwas prepared in a separate container consisting of 1.73 g of vanadium oxide sulfate (Sigma-Aldrich,St. Louis, MO, USA, 97%) in 15 mL of DI water at 50 ◦C. Dopants were added before mixing the basecatalyst components via stock solutions of either ammonium tetrachloropalladate (Sigma-Aldrich,St. Louis, MO, USA, 97%), titanium sulfate solution (Sigma-Aldrich, St. Louis, MO, USA, 99.9%),nickel sulfate (Sigma-Aldrich, St. Louis, MO, USA, 99.99%), cesium sulfate (Sigma-Aldrich, St. Louis,MO, USA, 99.99%), telluric acid (Sigma-Aldrich, St. Louis, MO, USA, 98%), and potassium sulfate(Sigma-Aldrich, St. Louis, MO, USA, 99%), prepared via dissolving the precursor salts in DI water.After addition of the required amount of dopant, the molybdenum/niobium and vanadium solutionwere added to the dopant mixture and allowed to mix for 20 min under stirring. The mixed precursorswere then transferred into Teflon liners and set in autoclaves to carry out the hydrothermal synthesis at175 ◦C for 48 h. Upon completion of the hydrothermal synthesis, the catalyst was washed with waterand acetone to ensure only the precipitated product was recovered, after which the washed catalystwas set to dry at 120 ◦C for 2 h followed by calcination at 400 ◦C for 4 hours in air using a 10 ◦C ramprate for heating and cooling. Synthesis of the base catalyst was carried out following the same stepswithout the addition of dopants.
3.2. XRD
X-ray diffraction was carried out for all samples in a Rigaku Miniflex II (Tokyo, Japan) equippedwith a Cu-Kα X-ray source and a high-speed silicon-strip detector. Scans were completed between a 10and 90◦ 2θ angle at a rate of 2 ◦/min with step size of 0.02◦.
3.3. Scanning Electron Microscopy/EDS (SEM/EDS)
To confirm elemental uptakes and identify unintended variations in loadings, SEM/EDScharacterization was performed on all 81 samples using a Zeiss Ultraplus Thermal Field EmissionScanning Electron Microscope (Carl Zeiss, Oberkochen, Germany) at 15 keV. Atomic percentagedata were collected over three unique regions of each sample selected from SEM micrographs toprovide average atomic compositions as well as measurement error. The atomic composition of eachcomponent was scaled to Mo = 8 to omit the presence of oxygen and carbon from the measurements.This constraint necessarily defined the error in Mo loading to equal zero.
3.4. Catalytic Activity Tests
Ethane partial oxidation tests were performed using an ethane to oxygen ratio of 4:5 [16,50](40% ethane, 50% oxygen, 10% nitrogen). Onstream results were analyzed with a Shimadzu GasChromatograph GC2014 (Kyoto, Japan), equipped with a thermal conductivity detector (TCD) toanalyze the product distribution. The experiments were carried out in a quartz tube plug flow reactorat ambient pressure, where the space velocity was kept at a constant 1200 h−1. Catalysts were sievedbetween 45 and 60 mesh size to mitigate a pressure drop. The catalysts were used as synthesized and atemperature ramp in the range of 120–460 ◦C was used with an initial 10 ◦C/min ramp rate from roomtemperature to 120 ◦C, and a subsequent 30 ◦C step size (1.5 ◦C/min rate) for each catalyst was applied.Temperature measurements were taken inside the catalyst bed using an insulated K-type thermocouple.

Catalysts 2018, 8, 370 13 of 16
4. Conclusions
In our studies, the optimal catalyst compositions for ethane partial oxidation to both acetic acidand ethylene with regards to the addition of redox and acid dopants to a base Mo8V2Nb1 catalystwere identified. A DOE methodology was implemented to gain statistically significant insights on theimpact of tuning the balance between the acidity and redox behavior of the catalyst via the additionof the selected dopants and to identify useful trends to aid the design of mixed metal oxide EPOcatalysts in the future. Analysis was carried out to correlate the redox-element loading (Pd, Ni, orTi) and acid-element loading (K, Cs, or Te) with the catalytic performance and structural integrity ofthe materials. It was found that across all catalyst compositions explored, an excess of surface acidityrelative to the redox element (R/A ratio of 0.005) benefited both ethylene and acetic acid formation.Additionally, investigation of the total dopant level (D/H ratio) led to the finding that doping highlevels of Ti optimized the selectivity for both AA and ethylene, while doping high levels of Ni and Pdled to the formation of combustion products. Overall, AA production was favored with TiTe dopingwhile ethylene production was favored with NiTe doping. Additionally, it was found that Cs-dopedcatalysts ubiquitously favored ethane combustion. The effects of dopant composition on the catalyststructure were elucidated, where the extent of phase segregation and incorporation of dopants intothe base catalyst was most sensitive to the acid/base element doped, and the incorporation of cesiumwas found to trigger the formation of multiple secondary phases. Overall, tuning the balance betweenredox and acid elements doped into Mo8V2Nb1 catalysts resulted in not only changes to the surfaceacidity and redox properties, but also induced a change in the bulk catalyst structure, the coupledeffects of which were found to ultimately determine the materials’ catalytic properties.
Supplementary Materials: The following are available online at http://www.mdpi.com/2073-4344/8/9/370/s1.
Author Contributions: Conceptualization of the work by J.D.J., C.W., and J.L. Methodology and data analysis byJ.D.J., T.B., and K.M. Manuscript-writing and editing by J.D.J. and K.M. Project administration and supervision byC.W. and J.L.
Funding: The authors acknowledge financial support from the National Science Foundation, grant IIP 1464630,and the South Carolina Smartstate Center for Strategic Approaches to the Generation of Electricity.
Conflicts of Interest: The authors declare no conflict of interest.
References
1. Banares, M.A. Supported metal oxide and other catalysts for ethane conversion: A review. Catal. Today 1999,51, 319–348. [CrossRef]
2. Cavani, F.; Ballarini, N.; Cericola, A. Oxidative dehydrogenation of ethane and propane: How far fromcommercial implementation? Catal. Today 2007, 127, 113–131. [CrossRef]
3. Brik, Y.; Kacimi, M.; Ziyad, M.; Bozon-Verduraz, F. Titania-supported cobalt and cobalt–phosphorus catalysts:Characterization and performances in ethane oxidative dehydrogenation. J. Catal. 2001, 202, 118–128.[CrossRef]
4. Cimino, S.; Donsì, F.; Russo, G.; Sanfilippo, D. Olefins production by catalytic partial oxidation of ethane andpropane over Pt/LaMnO3 catalyst. Catal. Today 2010, 157, 310–314. [CrossRef]
5. Le Bars, J.; Auroux, A.; Forissier, M.; Vedrine, J. Active sites of V2O5/γ-Al2O3 catalysts in the oxidativedehydrogenation of ethane. J. Catal. 1996, 162, 250–259. [CrossRef]
6. Bodke, A.; Olschki, D.; Schmidt, L.; Ranzi, E. High selectivities to ethylene by partial oxidation of ethane.Science 1999, 285, 712–715. [CrossRef] [PubMed]
7. Michael, B.C.; Nare, D.N.; Schmidt, L.D. Catalytic partial oxidation of ethane to ethylene and syngasover rh and pt coated monoliths: Spatial profiles of temperature and composition. Chem. Eng. Sci. 2010,65, 3893–3902. [CrossRef]
8. Bergh, S.; Guan, S.; Hagemeyer, A.; Lugmair, C.; Turner, H.; Volpe, A.F.; Weinberg, W.H.; Mott, G. Gasphase oxidation of ethane to acetic acid using high-throughput screening in a massively parallel microfluidicreactor system. Appl. Catal. A 2003, 254, 67–76. [CrossRef]

Catalysts 2018, 8, 370 14 of 16
9. Rahman, F.; Loughlin, K.F.; Al-Saleh, M.A.; Saeed, M.R.; Tukur, N.M.; Hossain, M.M.; Karim, K.; Mamedov, A.Kinetics and mechanism of partial oxidation of ethane to ethylene and acetic acid over mov type catalysts.Appl. Catal. A 2010, 375, 17–25. [CrossRef]
10. Roussel, M.; Barama, S.; Löfberg, A.; Al-Sayari, S.; Karim, K.; Bordes-Richard, E. Mov-based catalysts inethane oxidation to acetic acid: Influence of additives on redox chemistry. Catal. Today 2009, 141, 288–293.[CrossRef]
11. Tessier, L.; Bordes, E.; Gubelmann-Bonneau, M. Active specie on vanadium-containing catalysts for theselective oxidation of ethane to acetic acid. Catal. Today 1995, 24, 335–340. [CrossRef]
12. Li, X.; Iglesia, E. Kinetics and mechanism of ethane oxidation to acetic acid on catalysts based on Mo-V-Nboxides. J. Phys. Chem. C 2008, 112, 15001–15008. [CrossRef]
13. Botella, P.; Dejoz, A.; Nieto, J.L.; Concepcion, P.; Vázquez, M. Selective oxidative dehydrogenation of ethaneover movsbo mixed oxide catalysts. Appl. Catal. A 2006, 298, 16–23. [CrossRef]
14. Botella, P.; Garcıa-González, E.; Dejoz, A.; Nieto, J.L.; Vázquez, M.; González-Calbet, J. Selective oxidativedehydrogenation of ethane on movtenbo mixed metal oxide catalysts. J. Catal. 2004, 225, 428–438. [CrossRef]
15. Botella, P.; Nieto, J.L.; Solsona, B.; Mifsud, A.; Márquez, F. The preparation, characterization, and catalyticbehavior of movtenbo catalysts prepared by hydrothermal synthesis. J. Catal. 2002, 209, 445–455. [CrossRef]
16. Ruth, K.; Kieffer, R.; Burch, R. Mo-V-Nb oxide catalysts for the partial oxidation of ethane: I. Preparation andstructural characterisation. J. Catal. 1998, 175, 16–26. [CrossRef]
17. Li, X.; Iglesia, E. Support and promoter effects in the selective oxidation of ethane to acetic acid catalyzed byMo-V-Nb oxides. Appl. Catal. A 2008, 334, 339–347. [CrossRef]
18. Chen, N.F.; Ueda, W.; Oshihara, K. Hydrothermal synthesis of Mo-V-M-O complex metal oxide catalystsactive for partial oxidation of ethane. Chem. Commun. 1999, 517–518. [CrossRef]
19. Chen, N.F.; Oshihara, K.; Ueda, W. Selective oxidation of ethane over hydrothermally synthesizedMo–V–Al–Ti oxide catalyst. Catal. Today 2001, 64, 121–128. [CrossRef]
20. Thorsteinson, E.; Wilson, T.; Young, F.; Kasai, P. The oxidative dehydrogenation of ethane over catalystscontaining mixed oxides of molybdenum and vanadium. J. Catal. 1978, 52, 116–132. [CrossRef]
21. Oshihara, K.; Nakamura, Y.; Sakuma, M.; Ueda, W. Hydrothermal synthesis of novel crystalline Mo-V-M-O(M = Al, Ga, Fe) mixed oxide in the presence of triethylammonium chloride and their catalytic performancefor selective ethane oxidation. Catal. Today 2001, 71, 153–159. [CrossRef]
22. Linke, D.; Wolf, D.; Baerns, M.; Timpe, O.; Schlögl, R.; Zeyβ, S.; Dingerdissen, U. Catalytic partial oxidationof ethane to acetic acid over Mo1V0.25Nb0.12Pd0.0005Ox: I. Catalyst performance and reaction mechanism.J. Catal. 2002, 205, 16–31. [CrossRef]
23. Valente, J.S.; Quintana-Solórzano, R.; Armendáriz-Herrera, H.; Barragán-Rodríguez, G.; López-Nieto, J.Kinetic study of oxidative dehydrogenation of ethane over movtenb mixed-oxide catalyst. Ind. Eng. Chem.Res. 2013, 53, 1775–1786. [CrossRef]
24. Ishchenko, E.; Kardash, T.Y.; Gulyaev, R.; Ishchenko, A.; Sobolev, V.; Bondareva, V. Effect of k and Bi dopingon the M1 phase in MoVTeNbO catalysts for ethane oxidative conversion to ethylene. Appl. Catal. A 2016,514, 1–13. [CrossRef]
25. Ueda, W.; Oshihara, K. Selective oxidation of light alkanes over hydrothermally synthesized Mo-V-M-O (M= Al, Ga, Bi, Sb, and Te) oxide catalysts. Appl. Catal. A 2000, 200, 135–143. [CrossRef]
26. Nguyen, T.; Aouine, M.; Millet, J. Optimizing the efficiency of movtenbo catalysts for ethane oxidativedehydrogenation to ethylene. Catal. Commun. 2012, 21, 22–26. [CrossRef]
27. Valente, J.S.; Armendáriz-Herrera, H.C.; Quintana-Solórzano, R.; Del Angel, P.; Nava, N.; Massó, A.; LópezNieto, J.M. Chemical, structural, and morphological changes of a MoVTeNb catalyst during oxidativedehydrogenation of ethane. ACS Catal. 2014, 4, 1292–1301. [CrossRef]
28. Grasselli, R.K.; Buttrey, D.J.; Burrington, J.D.; Andersson, A.; Holmberg, J.; Ueda, W.; Kubo, J.; Lugmair, C.G.;Volpe, A.F. Active centers, catalytic behavior, symbiosis and redox properties of MoV(Nb,Ta)Teoammoxidation catalysts. Top. Catal. 2006, 38, 7–16. [CrossRef]
29. DeSanto, P.; Buttrey, D.J.; Grasselli, R.K.; Lugmair, C.G.; Volpe, A.F.; Toby, B.H.; Vogt, T. Structural aspectsof the M1 and M2 phases in MoVNbTeO propane ammoxidation catalysts. Z. Krist-Cryst. Mater. 2004,219, 152–165. [CrossRef]
Catalysts 2018, 8, 370 15 of 16
30. Guliants, V.V.; Bhandari, R.; Swaminathan, B.; Vasudevan, V.K.; Brongersma, H.H.; Knoester, A.;Gaffney, A.M.; Han, S. Roles of surface Te, Nb, and Sb oxides in propane oxidation to acrylic acid over bulkorthorhombic Mo−V−O phase. J. Phys. Chem. B 2005, 109, 24046–24055. [CrossRef] [PubMed]
31. Heracleous, E.; Lemonidou, A. Ni–Nb–O mixed oxides as highly active and selective catalysts for etheneproduction via ethane oxidative dehydrogenation. Part I: Characterization and catalytic performance. J. Catal.2006, 237, 162–174. [CrossRef]
32. Sadakane, M.; Yamagata, K.; Kodato, K.; Endo, K.; Toriumi, K.; Ozawa, Y.; Ozeki, T.; Nagai, T.; Matsui, Y.;Sakaguchi, N.; et al. Synthesis of orthorhombic Mo-V-Sb oxide species by assembly of pentagonal Mo6O21
polyoxometalate building blocks. Angew. Chem. 2009, 121, 3840–3844. [CrossRef]33. Hibst, H.; Rosowski, F.; Cox, G. New cs-containing Mo–V4+ based oxides with the structure of the m1
phase—base for new catalysts for the direct alkane activation. Catal. Today 2006, 117, 234–241. [CrossRef]34. Weirich, T.E.; Portillo, J.; Cox, G.; Hibst, H.; Nicolopoulos, S. Ab initio determination of the framework
structure of the heavy-metal oxide CsxNb2.54W2.46O14 from 100 kv precession electron diffraction data.Ultramicroscopy 2006, 106, 164–175. [CrossRef] [PubMed]
35. Solsona, B.; Vázquez, M.; Ivars, F.; Dejoz, A.; Concepción, P.; Nieto, J.L. Selective oxidation of propane andethane on diluted Mo–V–Nb–Te mixed-oxide catalysts. J. Catal. 2007, 252, 271–280. [CrossRef]
36. Wagner, J.B.; Timpe, O.; Hamid, F.A.; Trunschke, A.; Wild, U.; Su, D.S.; Widi, R.K.; Hamid, S.B.A.; Schlögl, R.Surface texturing of Mo–V–Te–Nb–Ox selective oxidation catalysts. Top. Catal. 2006, 38, 51–58. [CrossRef]
37. Nieto, J.L.; Botella, P.; Vázquez, M.; Dejoz, A. The selective oxidative dehydrogenation of ethane overhydrothermally synthesised movtenb catalysts. Chem. Commun. 2002, 1906–1907. [CrossRef]
38. López-Medina, R.; Sobczak, I.; Golinska-Mazwa, H.; Ziolek, M.; Bañares, M.A.; Guerrero-Pérez, M.O.Spectroscopic surface characterization of movnbte nanostructured catalysts for the partial oxidation ofpropane. Catal. Today 2012, 187, 195–200. [CrossRef]
39. Li, X.; Iglesia, E. Synergistic effects of TiO2 and palladium-based Cocatalysts on the selective oxidation ofethene to acetic acid on Mo–V–Nb oxide domains. Angew. Chem. Int. Ed. 2007, 46, 8649–8652. [CrossRef][PubMed]
40. Linke, D.; Wolf, D.; Baerns, M.; Zeyβ, S.; Dingerdissen, U. Catalytic partial oxidation of ethane to acetic acidover Mo1V0.25Nb0.12Pd0.0005Ox: II. Kinetic modelling. J. Catal. 2002, 205, 32–43. [CrossRef]
41. Schuurman, Y.; Ducarme, V.; Chen, T.; Li, W.; Mirodatos, C.; Martin, G. Low temperature oxidativedehydrogenation of ethane over catalysts based on group viii metals. Appl. Catal. A 1997, 163, 227–235.[CrossRef]
42. Zhang, X.; Liu, J.; Jing, Y.; Xie, Y. Support effects on the catalytic behavior of NiO/Al2O3 for oxidativedehydrogenation of ethane to ethylene. Appl. Catal. A 2003, 240, 143–150. [CrossRef]
43. Heracleous, E.; Lemonidou, A. Ni–Nb–O mixed oxides as highly active and selective catalysts for etheneproduction via ethane oxidative dehydrogenation. Part II: Mechanistic aspects and kinetic modeling. J. Catal.2006, 237, 175–189. [CrossRef]
44. Amakawa, K.; Kolen’ko, Y.V.; Villa, A.; Schuster, M.E.; Csepei, L.-I.; Weinberg, G.; Wrabetz, S.; Naumannd’Alnoncourt, R.; Girgsdies, F.; Prati, L. Multifunctionality of crystalline MoV (TeNb) M1 oxide catalysts inselective oxidation of propane and benzyl alcohol. ACS Catal. 2013, 3, 1103–1113. [CrossRef]
45. Sopa, M.; Wacław-Held, A.; Grossy, M.; Pijanka, J.; Nowinska, K. Ethane to acetic acid oxidation oversupported heteropoly acids. Appl. Catal. A 2005, 285, 119–125. [CrossRef]
46. Grasselli, R.K.; Buttrey, D.J.; DeSanto, P., Jr.; Burrington, J.D.; Lugmair, C.G.; Volpe, A.F., Jr.; Weingand, T.Active centers in Mo–V–Nb–Te–Ox (amm) oxidation catalysts. Catal. Today 2004, 91, 251–258. [CrossRef]
47. Holmberg, J.; Grasselli, R.K.; Andersson, A. Catalytic behaviour of M1, M2, and M1/M2 physical mixturesof the Mo–V–Nb–Te–oxide system in propane and propene ammoxidation. Appl. Catal. A 2004, 270, 121–134.[CrossRef]
48. Azaroff, L.V.; Buerger, M.J. Analytical methods for indexing powder photographs. In The powder method inx-ray crystallography; The Maple Press Company: York, PA, USA, 1958; Volume 1, pp. 79–90.
49. Henry, N.F.; Wooster, W.A.; Lipson, H. Measurements of crystal grain size in polycrystalline aggregates.In The interpretation of x-ray diffraction photographs; Macmillan: London, UK, 1951; Volume 1, pp. 212–230.
50. Karim, K.; Mamedov, A.; Al-Hazmi, M.H.; Al-Andis, N. Oxidative dehydrogenation of ethane overMoVMnW oxide catalysts. React. Kinet. Catal. Lett. 2003, 80, 3–11. [CrossRef]

Catalysts 2018, 8, 370 16 of 16
51. Oyama, S.T. Adsorbate bonding and the selection of partial and total oxidation pathways. J. Catal. 1991,128, 210–217. [CrossRef]
52. Zhao, Z.; Gao, X.; Wachs, I.E. Comparative study of bulk and supported V−Mo−Te−Nb−O mixed metaloxide catalysts for oxidative dehydrogenation of propane to propylene. J. Phys. Chem. B 2003, 107, 6333–6342.[CrossRef]
53. Hävecker, M.; Wrabetz, S.; Kröhnert, J.; Csepei, L.-I.; d’Alnoncourt, R.N.; Kolen’ko, Y.V.; Girgsdies, F.;Schlögl, R.; Trunschke, A. Surface chemistry of phase-pure M1 MoVTeNb oxide during operation in selectiveoxidation of propane to acrylic acid. J. Catal. 2012, 285, 48–60. [CrossRef]
54. Chen, C.; Kosuke, N.; Murayama, T.; Ueda, W. Single-crystalline-phase mo3vox: An efficient catalyst for thepartial oxidation of acrolein to acrylic acid. ChemCatChem 2013, 5, 2869–2873. [CrossRef]
55. Wagner, J.B.; Hamid, S.A.; Othman, D.; Timpe, O.; Knobl, S.; Niemeyer, D.; Su, D.S.; Schlögl, R.Nanostructuring of binary molybdenum oxide catalysts for propene oxidation. J. Catal. 2004, 225, 78–85.[CrossRef]
© 2018 by the authors. Licensee MDPI, Basel, Switzerland. This article is an open accessarticle distributed under the terms and conditions of the Creative Commons Attribution(CC BY) license (http://creativecommons.org/licenses/by/4.0/).


![MOV Instruction MOV destination,source MOV AX,BX MOV SUM,EAX MOV EDX,ARRAY[EBX][ESI] MOV CL,5 MOV DL,[BX]](https://static.fdocuments.in/doc/165x107/5a4d1b787f8b9ab0599b8123/mov-instruction-mov-destinationsource-mov-axbx-mov-sumeax-mov-edxarrayebxesi.jpg)