STATISTICAL REPORT - Fuels Europe · Statistical Report 2015 55 ... ril anging from transportatoni...
60
STATISTICAL REPORT
Transcript of STATISTICAL REPORT - Fuels Europe · Statistical Report 2015 55 ... ril anging from transportatoni...

STATISTICAL REPORT

Editor: John Cooper Copyright © FuelsEurope
Printed in Belgium - Designed by www.morris-chapman.com

STATISTICAL REPORT

#FuelsEurope
www.fuelseurope.eu
FuelsEurope

5Statistical Report 2015 5
Welcome to the FuelsEurope’s Statistical Report 2015, our second such report.
While the statistics were originally included in Annual Reports, the 2015 Statistical Report follows the same structure as 2014 edition thus ensuring a consistent historical overview for our readers.
The Report aims to provide high-quality data on energy markets in general but also on refining industry specific issues. Selected charts give readers a broad overview of energy and environment related data and trends over recent years.
FuelsEurope’s Statistical Report 2015 uses the following colour coding to help navigation easily through the document. Each colour corresponds to a specific oil-related theme making browsing between subsections user-friendly. We hope that you find this Report useful.
• Oil & Energy
• Oil Products
• Prices and Margins
• Refining
• Marketing Infrastructures
Foreword
John CooperDirector General

Statistical Report 20156
World
European Union33%
24%
30%
4%
7% 2%
Mtoe
36%
24%
17%
12%
5% 7%
:Uni
t: M
toe
5 000
4 500
4 000
3 500
3 000
2 500
2 000
1 500
1 000
500
0
Oil
4 185
605394 285 199 82 111
3 020
3 827
563856
279
Natural gas
Coal Nuclear energy
Hydro electricity
Renewables
Oil consumption is measured inmillion tonnes; other fuels inmillion tonnes of oil equivalent (Mtoe).
EU1 676 Mtoe
WORLD:12 730 Mtoe
Note: Please note that due to rounding, figures may not add up exactly to 100%
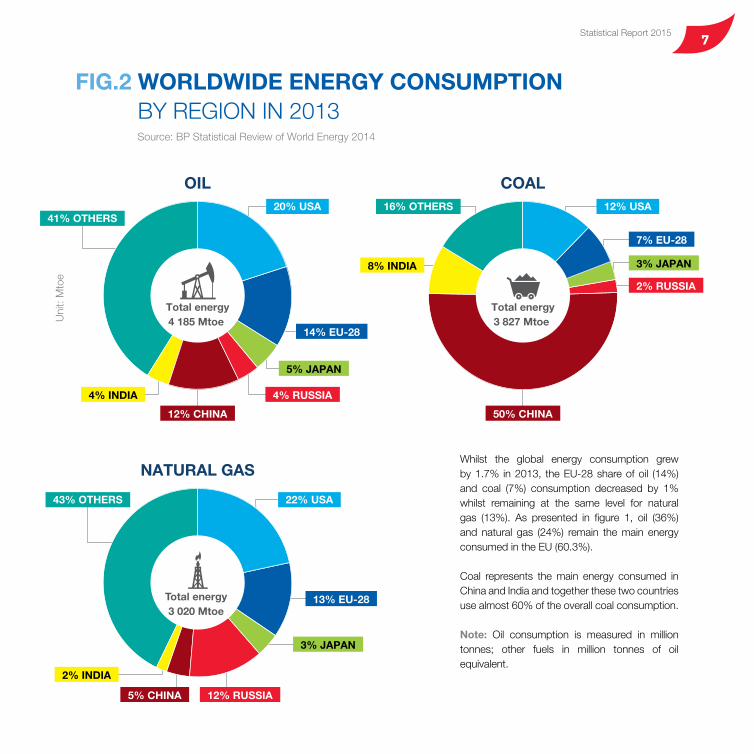
FIG.1 WORLDWIDE ENERGY CONSUMPTION BY FUEL TYPE IN 2013
Oil, natural gas and coal currently meet the world’s energy needs (together 86.8%). The overall share for renewables remains very small (8.5%). The EU, unlike other major economies, has a
higher share of nuclear (12%) and renewables & hydro (12%) in its energy mix.
Source: BP Statistical Review of World Energy 2014
7Statistical Report 2015 7
20% USA 12% USA
14% EU-28
7% EU-28
5% JAPAN
3% JAPAN
4% RUSSIA
12% RUSSIA
2% RUSSIA
12% CHINA 50% CHINA
4% INDIA
8% INDIA
41% OTHERS
43% OTHERS
16% OTHERS
OIL COAL
NATURAL GAS
Total energy3 020 Mtoe
Uni
t: M
toe
Total energy4 185 Mtoe 3 827 Mtoe
Total energy
22% USA
2% INDIA
5% CHINA
3% JAPAN
13% EU-28
World
European Union33%
24%
30%
4%
7% 2%
Mtoe
36%
24%
17%
12%
5% 7%
:Uni
t: M
toe
5 000
4 500
4 000
3 500
3 000
2 500
2 000
1 500
1 000
500
0
Oil
4 185
605394 285 199 82 111
3 020
3 827
563856
279
Natural gas
Coal Nuclear energy
Hydro electricity
Renewables
Oil consumption is measured inmillion tonnes; other fuels inmillion tonnes of oil equivalent (Mtoe).
EU1 676 Mtoe
WORLD:12 730 Mtoe
Note: Please note that due to rounding, figures may not add up exactly to 100%
Whilst the global energy consumption grew by 1.7% in 2013, the EU-28 share of oil (14%) and coal (7%) consumption decreased by 1% whilst remaining at the same level for natural gas (13%). As presented in figure 1, oil (36%) and natural gas (24%) remain the main energy consumed in the EU (60.3%).
Coal represents the main energy consumed in China and India and together these two countries use almost 60% of the overall coal consumption.
Note: Oil consumption is measured in million tonnes; other fuels in million tonnes of oil equivalent.
Source: BP Statistical Review of World Energy 2014
FIG.2 WORLDWIDE ENERGY CONSUMPTION BY REGION IN 2013

Statistical Report 20158
Uni
t: M
illion
tonn
es p
er y
ear
32.3
23.8
25.0
154.5
24.7
45.6
52.6
30.631.5
53.026.8
18.2
16.5
227.2
83.8
USA
SOUTH AND CENTRAL AMERICA
CANADA
EUROPE & EURASIA
AFRICA
ASIA PACIFIC
TRADE FLOWS IN 2013
MEXICO
MIDDLE EAST
100.1
74.1
72.9
28.7
102.6164.2
153.9
53.0124.6
24.4
295.0 19.1
43.4
31.5
25.3
56.9
38.5
19.5
16.7
17.4
Crude oil is an internationally traded commodity with flows moving all over the world.
There are two open and transparent markets – crude oil and refined products- within which the European refining industry operates. The products are freely traded.
Source: BP Statistical Review of World Energy 2014
FIG.3 WORLDWIDE CRUDE OIL MOVEMENT IN 2013

9Statistical Report 2015 9
26% NORTH AMERICA
7% SOUTH AND CENTRAL AMERICA
4% RUSSIA
MIDDLE EAST 9%
AFRICA 4%
CHINA 12%
OTHER ASIA PACIFIC 13%
EURASIA 1%
JAPAN 5%
INDIA 4%
15% EUROPEof which EU: 13.6% and Non EU: 1.4%
Total91.34 Mbd
Uni
t: M
illion
tonn
es p
er y
ear
32.3
23.8
25.0
154.5
24.7
45.6
52.6
30.631.5
53.026.8
18.2
16.5
227.2
83.8
USA
SOUTH AND CENTRAL AMERICA
CANADA
EUROPE & EURASIA
AFRICA
ASIA PACIFIC
TRADE FLOWS IN 2013
MEXICO
MIDDLE EAST
100.1
74.1
72.9
28.7
102.6164.2
153.9
53.0124.6
24.4
295.0 19.1
43.4
31.5
25.3
56.9
38.5
19.5
16.7
17.4
FIG.4 WORLDWIDE REFINED PRODUCT DEMAND AVERAGED 91.34 MILLION BARRELS PER DAY IN 2013, WITH EUROPE ACCOUNTING FOR 15%Source: BP Statistical Review of World Energy 2014
Global demand for oil refined products continues to grow from 86.77 million barrels per day in 2012 to 91.34 in 2013. Although the European market is declining it still remains
the second largest in the world (15%) behind North-America (26%), but with China, Middle East and the rest of Asia catching rapidly.

Statistical Report 201510
Uni
t: M
illion
tonn
es p
er y
ear
162 209
651 701
501 520
343 396
286143
117 175
703 731
269 340
993 1 030
REFINERY THROUGHPUT REFINED PETROLEUM PRODUCTS DEMAND
NORTHAMERICA
AFRICA
RUSSIA
ASIA &OCEANIA
CHINAJAPAN
EUROPE
LATINAMERICA
MIDDLE EAST
The refining supply/market demand balance shows that most of the regions are dependent on imports to meet market demand. Russia and at a lesser extent China has a positive trade balance which provides Russia in particular a key role in supplying demand from other regions.
Apparently balanced product demand and refinery throughput in the EU hide a large surplus of EU gasoline production and a shortage of diesel and jet production.
Source: Wood Mackenzie
FIG.5 WORLDWIDE REFINING SUPPLY/MARKET DEMAND BALANCES IN 2014

11Statistical Report 2015 11
Uni
t: M
illion
tonn
es p
er y
ear
NON EU
EU
Austria
Belgium
Bulgaria
Croatia
Cyprus
Czech Republic
Denmark
Estonia
Finland
France
Germany
Greece
Hungary
Ireland
Italy
Latvia
Lithuania
Luxembourg
Malta
Netherlands
Poland
Portugal
Romania
Slovakia
Slovenia
Spain
Sweden
United Kingdom
12.6
COUNTRY Mt/y COUNTRY Mt/y
28.9
4.5
3.3
2.7
9.1
7.3
1.5
9.3
81.2
115.1
13.2
6.3
6.6
60.8
1.7
2.5
2.7
2.6
47.2
23.9
10.9
9.7
3.6
2.4
60.0
13.3
68.6
Norway
EU TOTAL 611.4
TOTAL NO + CH + TR 57.3
TOTAL 668.7
Switzerland
Turkey
10.3
11.1
35.9
Uni
t: M
illion
tonn
es p
er y
ear
162 209
651 701
501 520
343 396
286143
117 175
703 731
269 340
993 1 030
REFINERY THROUGHPUT REFINED PETROLEUM PRODUCTS DEMAND
NORTHAMERICA
AFRICA
RUSSIA
ASIA &OCEANIA
CHINAJAPAN
EUROPE
LATINAMERICA
MIDDLE EAST
FIG.6 EU TOTAL OIL DEMAND AMOUNTED TO 611 MILLION TONNES IN 2014Source: Wood Mackenzie
EU-28 total oil amounted to 611 MT for 2014, representing a decrease of 3.3% compared to 2013.
While the bigger Member States such as Germany (-1.6%), France (-1.1%), UK (-2.4%) witnessed a decrease close to the European average, the Member States hit by the Eurozone crisis recorded a more significant decrease - Greece (-13.6%); Italy (-6.5%); Spain (-5.2%).

Statistical Report 201512
LPG
GASOLINE
OTHER PRODUCTS
REFINERY FUEL & LOSS
JET/KEROSENE
NAPHTHA
DIESEL/GASOIL
FUEL OIL
Uni
t: M
illion
tonn
es p
er y
ear
800
700
600
500
400
300
200
100
0
2013 2014
53.3
270.3
53.7
48.7
80.426.7
50.128.2
201220112010200920082007200620052004
FIG.7 DEMAND HISTORY OF OIL PRODUCTS IN THE EUSource: Wood Mackenzie
Since 2009, we can observe a downward trend for oil products demand. Over the past 5 years, the overall demand has declined by 8%. The downward trend is mainly driven by the decrease in gasoline (-17%) whilst gasoil and kerosene only decreased by 3%.

13Statistical Report 2015 13
1.3% LUBRICANTS
0.2% WHITE SPIRITS
REFINERY GAS AND ETHANE 3.4%
LPG 2.5%
5.7% NAPHTHA
GASOLINE 19.2%
39% DIESEL/GASOIL
13.0% FUEL OIL
BITUMEN 3.4%
1.4% PETROLEUM COKE
OTHER PRODUCTS 4%
6.8% KEROSENE
0.1% PARAFFIN WAXES
LPG
GASOLINE
OTHER PRODUCTS
REFINERY FUEL & LOSS
JET/KEROSENE
NAPHTHA
DIESEL/GASOIL
FUEL OIL
Uni
t: M
illion
tonn
es p
er y
ear
800
700
600
500
400
300
200
100
0
2013 2014
53.3
270.3
53.7
48.7
80.426.7
50.128.2
201220112010200920082007200620052004
FIG.8 AVERAGE REFINERY OUTPUT BY PRODUCT TYPE IN OECD EUROPESource: OECD
A wide range of products are produced from crude oil, ranging from transportation and industrial fuels to chemical feedstock. EU refineries produce also many specialty products such as bitumen for road construction and roofing, lubricants
for transport and industry, petroleum coke for the metal industry as well as waxes, solvents and other specialised products. Fuels for transport represent the biggest share of the production.

Statistical Report 201514
GASOLINE DIESEL RATIO
Uni
t: M
illion
tonn
es p
er y
ear
Die
sel/G
asol
ine
ratio
0,5
1,0
1,5
2,0
2,5
0
50
100
150
200
250
2000 2001 2002 2003 2004 2005 2006 2007 2008 2009 2010 2011 2012 2013 2014
FIG.9 ROAD FUEL DEMAND IN THE EUSource: Wood Mackenzie
The tax-incentivised dieselisation trend has significantly contributed to a fundamental change in the EU road fuel demand structure. The shift from gasoline to diesel began some 25 years ago and led to major gasoline demand decline as well as a shortage of diesel production in the EU.
Gasoline demand continue to decline while diesel demand is on the rise, currently reaching a 2.5 demand ratio in 2014.

15Statistical Report 2015 15
GASOLINE DIESELUnit: Million tonnes per year
- - 5 10 15 20 25 30 35 5 10 15 20
France17.4% 82.6%63.5%36.5% Germany
64.4%35.6% United Kingdom73.7%26.3% Italy
81.1%18.9% Spain73.6%26.4% Poland
63.1%36.9% Netherlands83.8%16.2% Belgium
78.2%21.8% Austria32.1% 67.9%Sweden
21.3% 78.7%Portugal30.2% 69.8%Czech Republic
27.3% 72.7%Romania36.5% 63.5%Finland34.2% 65.8%Hungary
32.8% 67.2%Ireland37.3% 62.7%Denmark
55.6% 44.4%Greece
15.0% 85.0%Luxembourg22.4% 77.6%Bulgaria
26.1% 73.9%Slovakia25.9% 74.1%Slovenia35.4% 64.6%Croatia17.2% 82.8%Lithuania26.8% 73.2%Latvia30.5% 69.5%Estonia48.8% 51.2%Cyprus44.8% 55.2%Malta
GASOLINE DIESEL RATIO
Uni
t: M
illion
tonn
es p
er y
ear
Die
sel/G
asol
ine
ratio
0,5
1,0
1,5
2,0
2,5
0
50
100
150
200
250
2000 2001 2002 2003 2004 2005 2006 2007 2008 2009 2010 2011 2012 2013 2014
Source: Wood Mackenzie
FIG.10 ROAD FUEL DEMAND IN THE EU BY COUNTRY IN 2014
Spurred on by favourable excise taxes on diesel, the shift from gasoline to diesel over past two decades led to a higher demand for diesel than gasoline as a road fuel in the vast majority of EU Member States.
In some countries, such as France and Spain the imbalance is far more pronounced as a result of very favourable tax policies for diesel.
The continued growth in truck transport in the EU, driven by internal market and external trade, has further contributed to spurring diesel demand.

Statistical Report 201516
GASOLINE
DIESEL/GASOIL
JET FUEL
Uni
t: pe
rcen
tage
impo
rts
/ pe
rcen
tage
exp
orts
Net gasoline exports:45 796 ktonnes
Net gasoil imports:22 672 ktonnes
Net jet fuel imports:15 218 ktonnes-40%
-30%
-20%
-10%
0%
10%
20%
30%
40%
50%
60%
2000 2001 2002 2003 2004 2005 2006 2007 2008 2009 2010 2011 2012 2013
Source: Eurostat
FIG.11 NET TRADE FLOWS FOR REFINED PRODUCTS DEMONSTRATE THE TREND OF GROWING GASOLINE SURPLUS AND DIESEL / GASOIL / JET FUEL DEFICITS
The EU has significant excess gasoline production capacity, but is however unable to meet regional demand for diesel and jet fuel.

17Statistical Report 2015 17
18.6
14.7
18.0
5.9
6.011.2
NORTHAMERICA
AFRICA
RUSSIA
ASIA
ASIA
Uni
t: M
illion
tonn
es p
er y
ear
GASOLINE DEMAND IN 2013
DIESEL/GASOIL DEMAND IN 2013
MAIN GASOLINE TRADE FLOWS IN 2013
MAIN DIESEL/GASOIL TRADE FLOWS IN 2013
77.8 253.7
EU
Source: Eurostat
FIG.12 MAJOR GASOLINE AND DIESEL/GASOIL TRADE FLOWS TO AND FROM THE EU IN 2013
As a result of the gasoline/diesel imbalance demand Europe has significant excess gasoline production capacity that need to be exported, while to meet regional demand for diesel and jet fuel, Europe became heavily reliant on other countries for import, especially from Russia, Middle East & USA.
North America was the traditional market for exporting gasoline surplus but the recent shale oil revolution, cheap energy and reducing demand have enabled US refiners to increase their supplies for the internal market and to compete on other export markets with EU refiners.

Statistical Report 201518
EUROPE NON EU
REST OF THE WORLD
USA
Note: Please note that due to rounding, figures may not add up exactly to 100%
Unit: Million tonnes per year
500 10 155 20 25 30 35 40 45
EXPORT
2012
2011
2010
2009
2008
2007
2006
2005
2004
2003
2013
17%
14%
11%
10%
9%
13%
10%
9%
7%
10%
11%
21%
22%
32%
34%
42%
44%
51%
57%
61%
56%
58% 32%
33%
33%
33%
39%
43%
49%
56%
57%
64%
62%
Source: Eurostat
FIG.13 EU GASOLINE TRADING BALANCE: USA IS A KEY EXPORT MARKET FOR THE EU
The US was the traditional export market for the structural EU gasoline surplus. The recent shale oil boom has decreased export opportunities to the US and forced EU refiners to find other markets.
The EU gasoline surplus in 2013 decreased by 8% compared to 2012. Comparatively the share of the US has decreased from 43% in 2008 to 32% in 2013 of the total exports.

19Statistical Report 2015 19
EUROPE NON EU
REST OF THE WORLD
USA
Note: Please note that due to rounding, figures may not add up exactly to 100%
Unit: Million tonnes per year
500 10 155 20 25 30 35 40 45
EXPORT
2012
2011
2010
2009
2008
2007
2006
2005
2004
2003
2013
17%
14%
11%
10%
9%
13%
10%
9%
7%
10%
11%
21%
22%
32%
34%
42%
44%
51%
57%
61%
56%
58% 32%
33%
33%
33%
39%
43%
49%
56%
57%
64%
62%
Unit: Million tonnes per year
EXPORTIMPORT
NORTH AMERICA
RUSSIA
REST OF THE WORLD
40 30 20 10 0 10 20
2003
2004
2005
2006
2007
2008
2009
2010
2011
2012
201344%
48.8%
43.6%
27.1%
35.1%
35.9%
56%
51.2%
56.4%
72.9%
64.9%
64.1%
94%6%
91.5%8.5%
88.3%1.5%10.3%
90.2%9.8%
100%
Note: Please note that due to rounding, figures may not add up exactly to 100%
Source: Eurostat
FIG.14 EU GASOIL TRADING BALANCE: RUSSIA IS A LEADING EXPORTER OF GASOIL TO THE EU
Major growth of US diesel exports to EU. EU increasingly dependent upon imported diesel, exporting lower quality gasoil.

Statistical Report 201520
Unit: Million tonnes per year
EXPORTIMPORT
REST OF THE WORLD
MIDDLE EAST
EUROPE NON EU
20 15 10 5 0 5
2003
2004
2005
2006
2007
2008
2009
2010
2011
2012
201339% 61%
38% 62%
38% 62%
36% 64%
51% 49%
51% 49%
27% 73%
35% 65%
37% 63%
26%
23%
74%
77%
Source: Eurostat
FIG.15 EU JET FUEL TRADING BALANCE: MIDDLE EAST REMAINS MAIN JET FUEL SUPPLIER FOR THE EU
Growing EU dependence on jet fuel imported mainly from Middle East.

21Statistical Report 2015 21
FUEL OIL
GASOIL
FUEL OIL
GASOILUni
t: C
onsu
mpt
ion
(1,0
00 to
nnes
)U
nit:
Con
sum
ptio
n (1
,000
tonn
es)
2004 2006 2008 2010 2012 2014
2004 2006 2008 2010 2012 2014
0
10 000
20 000
30 000
40 000
50 000
60 000
0
50 000
100 000
150 000
200 000
250 000
Unit: Million tonnes per year
EXPORTIMPORT
REST OF THE WORLD
MIDDLE EAST
EUROPE NON EU
20 15 10 5 0 5
2003
2004
2005
2006
2007
2008
2009
2010
2011
2012
201339% 61%
38% 62%
38% 62%
36% 64%
51% 49%
51% 49%
27% 73%
35% 65%
37% 63%
26%
23%
74%
77%
Source: Wood MackenzieFIG.16b MARINE FUEL CONSUMPTION IN THE EU
Switch to LNG or the use of scrubbers are alternatives to new IMO emissions limits in 2020 or 2025.
Source: Wood MackenzieFIG.16a GLOBAL MARINE FUEL CONSUMPTION
The global demand for marine fuel is mainly met by fuel oil (85%) while gasoil only represents 15% of the market.
The new limits for sulphur content of marine fuels could drastically change the market with a massive demand for low sulphur distillates, requiring major refinery investments.

Statistical Report 201522
max
. sul
phur
con
tent
(ppm
)m
ax. s
ulph
ur c
onte
nt (p
pm)
6000
5000
4000
3000
2000
1000
01975 1980 1985 1990 1995 2000 2005 20142010
6000
5000
4000
3000
2000
1000
01975 1980 1985 1990 1995 2000 2005 20142010
The sulphur content of road fuels has been reduced from 5500 ppm in 1975 to sulphur free in 2010 allowing use of sophisticated emissions control by vehicles.
In addition to the environmental benefits arising from reduced sulphur dioxide (SO2), the use of 10ppm sulphur gas oil is also essential for the effective working of abatement technology in engines fitted in newer non-road mobile machinery, including tractors, which are manufactured to meet stringent new EU emission standards for oxides of nitrogen (NOX).
Source: PFC Energy
Source: PFC Energy
FIG.17a EU ROAD DIESEL SULPHUR SPECIFICATIONS
FIG.17b EU OFF-ROAD DIESEL SULPHUR SPECIFICATIONS

23Statistical Report 2015 23
max
. sul
phur
con
tent
(ppm
)m
ax. s
ulph
ur c
onte
nt (p
pm)
6000
5000
4000
3000
2000
1000
01975 1980 1985 1990 1995 2000 2005 20142010
6000
5000
4000
3000
2000
1000
01975 1980 1985 1990 1995 2000 2005 20142010
The following areas impose limits on the sulphur level of fuel in ships travelling within them.
Changes in shipping fuel specifications require large-scale industry investment, by shipping and fuels supply industries.
The new 0.10% marine fuel will be difficult to produce from fuel oil and be met by marine diesel, a lighter product or potentially by LNG.
Secondary technology such as scrubbers can also be used to meet these sulphur levels but this technology is not suitable for our ships.
FIG.18 MARINE FUEL SULPHUR SPECIFICATIONS SO2 EMISSION CONTROL AREAS (SECAs)Source: European Commission
SECAs cover the Baltic and North Seas and the English Channel
Limits for the sulphur content of marine fuels in SECAs: 1% until 31 December 20140.10% as from 1 January 2015
Limits for the sulphur content of marine fuels outside SECAs in the EU waters: 0.50% by 2020

Statistical Report 201524
PM2.5 Overall transport emissions
PM2.5 Exhaust emissions
PM10 Overall transport emissions
PM2.5 PM10
PM10 Exhaust emissions
0
50
100
150
200
250
300
350
400
1990 1996 2002 2008 20120
50
100
150
200
250
300
350
400
1990 1996 2002 2008 2012
Uni
t: G
igag
ram
s (G
g)
FIG.19a PM EMISSIONS FROM EXHAUST IN THE EU REDUCED BY OVER 50%Source: European Environment Agency
PM emissions are continuously decreasing as the result of cleaner diesel fuel, advanced engines and effective emissions control technology.
With the EURO6 standard, modern road vehicles with diesel engines are using highly efficient filters that remove over 99.9% of the number of PMs.

25Statistical Report 2015 25
0
1000
2000
3000
4000
5000
6000
1990 2000 2012
NMVOC
0
5000
10000
15000
20000
25000
30000
35000
1990 2000 2012
CO
0
1000
2000
3000
4000
5000
6000
7000
8000
1990 2000 2012
NOx
SOx
0
100
200
300
400
500
600
700
1990 2000 2012
Uni
t: G
igag
ram
s (G
g)
PM2.5 Overall transport emissions
PM2.5 Exhaust emissions
PM10 Overall transport emissions
PM2.5 PM10
PM10 Exhaust emissions
0
50
100
150
200
250
300
350
400
1990 1996 2002 2008 20120
50
100
150
200
250
300
350
400
1990 1996 2002 2008 2012
Uni
t: G
igag
ram
s (G
g)
FIG.19b SINCE 1990 FUELS ARE GETTING PROGRESSIVELY CLEANER RESULTING IN SIGNIFICANT EMISSIONS REDUCTIONSSource: European Environment Agency
NOx - Nitrogen OxidesSOx - Sulphur Oxides NMVOC - Non Methane Volatile Organic CompoundsCO - Carbon Monoxide
Since 1990 the refining industry has contributed to cleaner exhausts by containing today over 80% lower SOx, NMVOC & CO, while NOx emissions decreased by over 50%. These significant improvements are the result of the partnerships with the automotive industry aiming at improving the fuel-engine efficiency and leading to multiple environmental benefits.

Statistical Report 201526
10 - 15 PPM 16 - 50 PPM 51 - 350 PPM
351 - 500 PPM 501 - 2000 PPM >2000 PPM
FIG.20 MAXIMUM ON-ROAD DIESEL SULPHUR LIMITSSource: Hart Energy Research and Consulting, 2014
Europe together with USA, Canada, Japan, Australia and Chile apply the lowest (10-15 ppm) on-road diesel sulphur limits in the world.
Countries may apply lower limits for different grades, regions/cities, or based on average content. Detailed information on limits and regulations can be found at www.ifqc.org

27Statistical Report 2015 27
10 PPM 11 - 99 PPM 100 - 150 PPM
151 - 600 PPM 601 - 2500 PPM
10 - 15 PPM 16 - 50 PPM 51 - 350 PPM
351 - 500 PPM 501 - 2000 PPM >2000 PPM
FIG.21 MAXIMUM GASOLINE SULPHUR LIMITSource: Hart Energy Research and Consulting, 2014
The EU has set the most stringent environmental specifications for sulphur in gasoline worldwide with a maximum level of 10 PPM.
Countries may apply lower limits for different grades, regions/cities, or based on average content. Detailed information on limits and regulations can be found at www.ifqc.org

Statistical Report 201528
Uni
t: U
S D
olla
r pe
r ba
rrel
Eur
ope
Bre
nt s
pot p
rice
per
barr
el in
mon
thly
ave
rage
0
20
40
60
80
100
120
140
160
Jan-
1989
Jan-
1990
Jan-
1991
Jan-
1992
Jan-
1993
Jan-
1994
Jan-
1995
Jan-
1996
Jan-
1997
Jan-
1998
Jan-
1999
Jan-
2000
Jan-
2001
Jan-
2002
Jan-
2003
Jan-
2004
Jan-
2005
Jan-
2006
Jan-
2007
Jan-
2008
Jan-
2009
Jan-
2010
Jan-
2011
Jan-
2012
Jan-
2013
Jan-
2014
REAL PRICE (2014$)
NOMINAL PRICE
The EU Refining industry operates between two global, open and transparent markets: the market of crude oil and the market of refined products. The main benchmarks are priced in dollars.
The price of crude oil is set on international spot markets and reported by designated agencies. The price of oil is an important marker for the global economy and is closely watched by businesses and policy-makers.
After a decade of relatively low prices, oil started rising last decade, leading to peaks just before the financial crisis in 2008. In the summer of 2014, oil prices started to fall, reaching daily closing prices of below 50 $.
FIG.22 CRUDE OIL PRICE EVOLUTIONSource: Energy Information Administration

29Statistical Report 2015 29
Net Cash Margin in US $/bbl for all regions indexed relative to 100 in Year 2000
Inde
xed
Net
Cas
h M
argi
n U
SD
/bbl
700
600
500
400
300
200
100
0
-100
2000 2002 2004 2006 2008 2010 2012
US Gulf Coast
Middle East
Korea/Singapore
EU - 28
Uni
t: U
S D
olla
r pe
r ba
rrel
Eur
ope
Bre
nt s
pot p
rice
per
barr
el in
mon
thly
ave
rage
0
20
40
60
80
100
120
140
160
Jan-
1989
Jan-
1990
Jan-
1991
Jan-
1992
Jan-
1993
Jan-
1994
Jan-
1995
Jan-
1996
Jan-
1997
Jan-
1998
Jan-
1999
Jan-
2000
Jan-
2001
Jan-
2002
Jan-
2003
Jan-
2004
Jan-
2005
Jan-
2006
Jan-
2007
Jan-
2008
Jan-
2009
Jan-
2010
Jan-
2011
Jan-
2012
Jan-
2013
Jan-
2014
REAL PRICE (2014$)
NOMINAL PRICE
FIG.23 REFINERS’ NET CASH MARGIN ACROSS REGIONSSource: Concawe

Statistical Report 201530
Uni
t: U
S D
olla
r pe
r ba
rrel
(Nom
inal
)
GASOLINE PRICE (NW EUROPE, 95R)
CRUDE OIL PRICE (BRENT)
0
20
40
60
80
100
120
140
1998 2000 2002 2004 2006 2008 2010 2012 2014
FIG.24 REFINERS OPERATE BETWEEN TWO GLOBAL COMMODITY MARKETSSource: Wood Mackenzie & Argus Media
EU refining operates between two global commodity markets, the crude market and the refined products market. The ‘crack spread’ represents the difference between the cost of crude oil and the market sales price for refined products.
Generally product prices rise with crude prices but the drivers of the difference are many.
In historic terms, the profitability has started to decline in a context of falling demand (2008). Whilst 2012 saw a small improvement for refiners, the spread is generally tight- margins are low and the industry is highly vulnerable to the operating costs that must be deducted from the spread before profitability can be considered.

31Statistical Report 2015 31
Uni
t: U
S D
olla
r pe
r ba
rrel
(Nom
inal
)
GASOLINE PRICE (NW EUROPE, 95R)
CRUDE OIL PRICE (BRENT)
0
20
40
60
80
100
120
140
1998 2000 2002 2004 2006 2008 2010 2012 2014
US Gulf Coast
Middle East
Korea/Singapore
EU - 28
0
100
200
300
400
2000 2002 2004 2006 2008 2010 2012
Inde
xed
Cas
h O
PEX
FIG.25 EU CASH OPEX OPERATING YEARS 2000–2012Source: Concawe
Cash OPEX in US $/bbl for all regions indexed relative to 100 in Year 2000
Since 2000, the EU has seen greater operating cost increases than rival areas, leaving them at a competitive disadvantage. In recent years the US Gulf Coast has seen operating costs fall, due largely to cheaper gas from unconventionals.

Statistical Report 201532
6.0
6.5
7.0
7.5
8.0
8.5
9.0
9.5
10.0
10.5
11.0
11.5
12.0
Baselineopex
ETS IED REACH RED SLFD(MFD)
Estim
ated
cos
t to
EU r
efine
rs ($
/bbl
)
2020 Low costscenario
6.0
6.5
7.0
7.5
8.0
8.5
9.0
9.5
10.0
10.5
11.0
11.5
12.0
Estim
ated
cos
t to
EU r
efine
rs ($
/bbl
)
Baselineopex
ETS IED REACH RED SLFD(MFD)
2020 High costscenario
FIG.26 ESTIMATED CUMULATIVE COST IMPACT OF EU LEGISLATION IN 2020 ON EU REFININGSource: Concawe
ETS - Emission Trading Scheme (2009/29/EC)IED - Industrial Emission Directive (2010/75/EC)REACH - Registration, Evaluation, Authorisation & Restriction of Chemicals (Regulation 1907/2006)RED - Renewable Energy Directive (2009/28/EC)SLFD - The Sulphur in Liquid Fuels Directive (1999/32/EC)OPEX - Operating Expense
For EU ETS, ‘low cost scenario assumes 16.5 €/t CO2, high cost scenario 30 €/t CO2
This chart provides an estimation of the cost burden imposed on EU refineries over the period from 2010 to 2020 by a number of EU legislative and implementing acts. It shows the cumulative impact in a low and high cost scenario, expressed in dollars per barrel of refinery intake. These estimated costs impacts should be seen in the context of the EU refining net margin which was less than 3 $/bbl in several of the recent years (source: IEA Oil Market Report).
The legislation under consideration has the potential to significantly increase the operating costs of the EU refining industry, thereby impairing its competitive position relative to other world regions where similar legislation is not enacted or is enforced at later dates.

33Statistical Report 2015 33
CH4%
10%8%
4%
7%
3%
5%
3% 3%7%
7%
8%
4%
4%
9%
7%
8%
6%
12%
6%
9%
7%
4%6%
6%6%
3%
COUNTRY SHARE
AT Austria 4%
BE Belgium 3%
BG Bulgaria 12%
HR Croatia 8%
CY Cyprus 7%
CZ Czech Republic 7%
DK Denmark 3%
EE Estonia 9%
FI Finland 4%
FR France 3%
DE Germany 3%
EL Greece 6%
HU Hungary 6%
IE Ireland 6%
IT Italy 4%
LV Latvia 7%
LT Lithuania 8%
LU Luxembourg 7%
MT Malta 5%
NL Netherlands 4%
PL Poland 8%
PT Portugal 6%
RO Romania 9%
SK Slovakia 7%
SI Slovenia 10%
ES Spain 6%
SE Sweden 4%
UK United Kingdom 5%
5%
6% - 10%
HIGHER THAN 10%
EUROPE NON EU
LESS THAN 6%
FIG.27 FUEL TAXES MAKE A SIGNIFICANT CONTRIBUTION TO MEMBER STATE TAX REVENUESource: Eurostat and Wood Mackenzie
Taxes on fuels contribute on average to 7% of Member State tax revenue.
Many competing products are subsidised. Replacing economically viable petroleum products with such alternatives would have large fiscal consequences.
Figures are based on 2012 revenues.

Statistical Report 201534
EU28 + Norway Net Government Revenues and Mandated Transfers
400
350
300
250
200
150
100
50
0
-50
€bn
OIL GAS COAL WIND SOLAR
Government Revenues
Government Expenditure + Mandated Transfers
Total
FIG.28 OIL IS THE LARGEST CONTRIBUTOR TO GOVERNMENT REVENUES, WHILE WIND AND SOLAR POWER ARE NET RECIPIENTS OF TRANSFERS AS A RESULT OF GOVERNMENT POLICIESSource: NERA
Note: Upstream oil and gas revenues allocated in proportion to production value, resulting in slightly higher allocation to oil.
Oil and gas contribute hundreds of billions of euros to European government revenues every year. Far from being subsidised, the oil and gas industry is one of the largest contributors to government revenues in the energy sector.
In 2011 oil and gas contributed €433 billion to the EU and Norwegian government treasuries.

35Statistical Report 2015 35
EU28 + Norway Net Government Revenues and Mandated Transfers
400
350
300
250
200
150
100
50
0
-50
€bn
OIL GAS COAL WIND SOLAR
Government Revenues
Government Expenditure + Mandated Transfers
Total
EU28 + Norway Net Government Revenues and Mandated Transfers per boe (2011):
$ /b
oe
OIL GAS COAL WIND SOLAR
Government Revenues
Government Expenditure + Mandated Transfers
Total
200
0
-200
-400
-600
-800
-1000
FIG.29 PER UNIT OF PRIMARY ENERGY CONSUMPTION OIL, GAS AND COAL ARE NET CONTRIBUTORS TO GOVERNMENT REVENUESSource: NERA
Note: Upstream oil and gas revenues allocated in proportion to production value, resulting in slightly higher allocation to oil.
The consumption of one barrel of oil generates $124 (around €90) in government revenue. This contrasts with the consumption of an equivalent amount of energy generated by renewables, which in some cases can cost tax payers over $700 (or more than €500).

Statistical Report 201536
4954
5058
4959
5559
4756
5157
5357
525756655464
5769
5865
54615364
53575359
5362
5564
6871
6165
6367
5764
5364
4967
4953 5559
PTES
FR
UKNL
BEDE
DK
SE
FI
EE
LV
LT
PL
CZ SK
HUHR
RO
BGIT
GR
MT CY
AT
LU
IE
6267
5461
SI
Euro-Super 95COUNTRY %
United Kingdom 71
Netherlands 69
Italy 67
Greece 67
Slovenia 67
Germany 65
Ireland 65
France 65
Sweden 64
Finland 64
Belgium 64
Portugal 64
64Slovakia
Denmark 62
Czech Republic 61
Croatia 61
Austria 59
Cyprus 59
Lithuania 59
Latvia 58
Hungary 57
Spain 57
Poland 57
Estonia 57
Luxembourg 56
Bulgaria 54
Malta
Romania
53
59
EURO-SUPER 95 ROAD DIESEL OIL
<50%
50-55%
55-60%
>60%
ROAD DIESEL OILCOUNTRY %
United Kingdom 68
Finland
55
Italy 63
Slovenia 62
Ireland 61
France 58
Netherlands 57
Sweden 57
Germany 56
Cyprus 55
Belgium 54
Czech Republic 54
54Croatia
Denmark 53
Portugal 53
Slovakia 53
Hungary 53
Austria 53
Estonia 53
Poland 52
Spain 51
Latvia 50
Greece 49
49Malta
Lithuania 49
Bulgaria 49
Luxembourg
Romania
47
55
FIG.30 TOTAL TAXATION SHARE IN THE END CONSUMER PRICESource: European Commission
The price at the pump is driven to a large degree by taxes and over half the cost of fuel represents taxes. The taxes on gasoline are generally higher than for diesel. This differential tax treatment has driven a demand shift over the past 10 years.
Fuels Taxes contribute substantially to Member State revenues.
Note: Share at February 2015

37Statistical Report 2015 37
Unit: Price in Euro per litrePRODUCT TARIFFS VAT
PRODUCT TARIFFS VAT
0.000 0.200 0.400 0.600 0.800 1.000 1.200 1.400 1.600 1.800
United Kingdom 0.538 0.794 0.267 1.599
Italy 0.580 0.617 0.263 1.460
Sweden 0.627 0.519 0.286 1.432
Finland 0.606 0.463 0.256 1.325
Denmark 0.648 0.419 0.267 1.333
Ireland 0.533 0.499 0.237 1.269
Cyprus 0.603 0.461 0.202 1.265
Netherlands 0.579 0.490 0.224 1.293
Germany 0.564 0.470 0.197 1.231
Greece 0.634 0.341 0.224 1.199
Belgium 0.585 0.429 0.213 1.227
Bulgaria 0.631 0.330 0.192 1.153
Malta 0.642 0.442 0.195 1.280
Slovenia 0.507 0.493 0.220 1.220
Slovakia 0.533 0.406 0.188 1.127
Hungary 0.598 0.368 0.261 1.228
Portugal 0.594 0.402 0.229 1.225
Spain 0.600 0.368 0.203 1.171
Czech Republic 0.549 0.398 0.199 1.146
Austria 0.574 0.410 0.197 1.180
France 0.527 0.481 0.202 1.210
Estonia 0.569 0.393 0.192 1.154
Romania 0.581 0.427 0.242 1.250
Lithuania 0.566 0.330 0.188 1.085
Latvia 0.532 0.346 0.184 1.063
Croatia 0.566 0.373 0.235 1.173
Poland 0.550 0.351 0.207 1.108
Luxembourg 0.584 0.335 0.156 1.075
COUNTRY% of taxes
United Kingdom 66.35%
Italy 60.31%Slovenia 58.47%Ireland 58.02%France 56.41%Sweden 56.22%Netherlands 55.26%Finland 54.28%Germany 54.18%Romania 53.52%Slovakia 52.70%Cyprus 52.37%Belgium 52.30%Czech Republic 52.10%Croatia 51.76%Portugal 51.52%Denmark 51.43%Austria 51.38%Hungary 51.25%Estonia 50.72%Poland 50.38%Latvia 49.92%Malta 49.82%Spain 48.77%Lithuania 47.80%Greece 47.13%Luxembourg 45.68%Bulgaria 45.26%
FIG.31 BREAKDOWN OF AUTOMOTIVE DIESEL PRICES ACROSS EU (DECEMBER 2014)Source: European Commission
Diesel prices are generally lower than gasoline prices due to the lower tax element, with the notable exception of the United Kingdom.
Only a fraction of the price paid at the pump contributes to the refiners’ income, the remainder gain to Member States and to buy the crude oil.

Statistical Report 201538
Unit: Price in Euro per litrePRODUCT TARIFFS VAT
0.000 0.200 0.400 0.600 0.800 1.000 1.200 1.400 1.600
% of taxes
United KingdomNetherlandsItalyGreeceIrelandSloveniaSlovakiaFinlandGermanyFranceSwedenPortugalBelgiumDenmarkCzech RepublicCroatiaAustriaRomaniaLatviaCyprusLithuaniaPolandHungaryEstoniaSpainLuxembourgMaltaBulgaria
COUNTRY
66.98%65.12%64.93%64.43%63.50%63.29%63.28%63.15%63.05%62.57%62.40%61.92%60.93%59.30%58.69%57.92%57.18%56.72%56.26%55.75%55.64%55.53%54.93%54.69%54.48%53.73%50.07%
69.73%
Latvia
Bulgaria
Poland
Estonia
Czech Republic
Lithuania
Luxembourg
Hungary
Austria
Romania
Cyprus
Slovakia
Croatia
Spain
Slovenia
Ireland
Malta
France
Belgium
Germany
Portugal
Sweden
Finland
Greece
Denmark
United Kingdom
Italy
Netherlands 0.515 0.774 0.271 1.560
0.539 0.728 0.279 1.547
0.453 0.794 0.250 1.497
0.584 0.612 0.299 1.495
0.517 0.681 0.275 1.473
0.521 0.624 0.275 1.420
0.530 0.603 0.283 1.415
0.531 0.618 0.264 1.413
0.511 0.655 0.221 1.387
0.526 0.615 0.240 1.381
0.502 0.631 0.227 1.359
0.625 0.519 0.206 1.350
0.473 0.608 0.249 1.329
0.477 0.595 0.236 1.308
0.561 0.462 0.215 1.237
0.509 0.477 0.247 1.233
0.449 0.570 0.204 1.223
0.532 0.490 0.194 1.215
0.519 0.458 0.234 1.212
0.503 0.493 0.199 1.196
0.519 0.400 0.248 1.168
0.527 0.462 0.168 1.157
0.501 0.434 0.196 1.131
0.453 0.467 0.193 1.114
0.498 0.423 0.184 1.105
0.482 0.402 0.203 1.087
0.543 0.363 0.181 1.087
0.465 0.423 0.187 1.075
PRODUCT TARIFFS VAT
FIG.32 BREAKDOWN OF AUTOMOTIVE GASOLINE PRICES ACROSS EU (DECEMBER 2014)Source: European Commission
Gasoline prices are generally higher than diesel prices due to the higher tax element.
Only a fraction of the price paid at the pump contributes to the refiners’ income, the remainder going to Member States and to buy the crude oil.

39Statistical Report 2015 39
Uni
t: th
ousa
nd b
arre
ls d
aily
21 389
6 029 3 517 8 822 31 284
17 861 6 027
e
22.5%North
America
19%Europe +Eurasia
6%Russia
6.5%Latin
America
9%MiddleEast
4%Africa
33%Asia
Pacific
FIG.33 GLOBAL REFINING CAPACITY AS OF 2013Source: BP Statistical Review of World Energy 2014
Refining is spread around the world and is a truly global business. The share of Europe & Eurasia refining has decreased from over
20% in 2012 to 19% in 2013 but still remains the third largest refining region.

Statistical Report 201540
REFINERY LOCATION
STEAM CRACKER LOCATION
INTEGRATED REFINERY / STEAM CRACKER LOCATION
4
3
FIG.34 REFINERY/STEAM CRACKER SITES IN EUROPESource: Concawe
A large number of refineries are integrated with or located very close to steam crackers that produce products for the petrochemicals industry.
Such interconnections show how refining is an intrinsic part of the industrial value chain and provides the basis for highly advance, high value products.

41Statistical Report 2015 41
REFINERY LOCATION
STEAM CRACKER LOCATION
INTEGRATED REFINERY / STEAM CRACKER LOCATION
4
3
EFTAEU
Threshold >50 kbbl/d or 2.5Mt/a
10.2
39.2
5.0
6.7
8.4
8.8
13.2
70.5
102.3
24.0
8.1
Number of refineries
Refining capacity
Refining capacity
Number of refineries
Austria
Belgium
Bulgaria
Croatia
Czech Republic
Denmark
Finland
France
Germany
Greece
Hungary
1
COUNTRY COUNTRY
3
1
2
2
2
2
8
11
4
1
84
10.0
66.0
24.7
16.0
15.0
5.6
70.5
21.6
65.6
Italy
Lithuania
Netherlands
Poland
Portugal
Romania
Slovakia
Spain
Sweden
United Kingdom
10
1
6
2
2
3
1
9
3
6
Norway
EU TOTAL: Refineries = 81 | Refining capacity = 679
TOTAL NO + CH: Refineries = 3 | Refining capacity = 20.7
TOTAL: Refineries = 84 | Refining capacity = 699.7
Switzerland
2
1
17.3
3.4
3.6Ireland 1
FIG.35 84 MAINSTREAM REFINERIES WERE OPERATING IN THE EU, NORWAY AND SWITZERLAND AT END 2014Source: Concawe
At the end of 2014, there are 84 `mainstream` refineries in the EU & EFTA. In addition there were 22 small or speciality sites.
Note: Refining capacity is expressed in million tonnes per year.

Statistical Report 201542
REFINERY THROUGHPUT UTILISATION RATEIDLE CAPACITY
Cap
acity
(milli
on to
nnes
)
Util
isat
ion
rate
2012 2013201120102009200820072006200520042003
600
700
800
62%
74.6%
87.3%
100%
FIG.36 CAPACITY AND UTILISATION OF EUROPEAN REFINERIESSource: BP Statistical Review of World Energy 2014
The utilisation rate of EU refineries dropped from the 2012 levels to about 80%. The continued decrease of demand and evolution
of market demand (increasing diesel/gasoline imbalance) forces European refiners to adapt these market forces.

43Statistical Report 2015 43
REFINERY THROUGHPUT UTILISATION RATEIDLE CAPACITY
Cap
acity
(milli
on to
nnes
)
Util
isat
ion
rate
2012 2013201120102009200820072006200520042003
600
700
800
62%
74.6%
87.3%
100%
31% ENERGY INDUSTRIES
OTHER SECTORS 15%
TRANSPORT 20%
FUGITIVE EMISSIONS 2%FROM FUELS
INDUSTRIAL PROCESSES* 7%
WASTE 3%
AGRICULTURE 10%
12% MANUFACTURINGINDUSTRIES & CONSTRUCTION
FIG.37 GHG EMISSIONS BY SECTOR IN THE EU IN 2012Source: European Environmental Agency
*NOTE: This sector includes by-product or fugitive emissions of greenhouse gases from industrial processes. Emissions from fuel combustion in industry are reported under Energy.
Energy and manufacturing industries accounts for 43% of GHG emissions in the EU. Transport, supplied around 90% by oil refined products, generates 20% of EU GHG emissions.

Statistical Report 201544
ENERGY INDUSTRIES MANUFACTURING, INDUSTRIES & CONSTRUCTIONTRANSPORTRESIDENTIAL
FUGITIVE EMISSIONS FROM FUELS
AGRICULTURE
TOTAL (EXCLUDING LULUCF)
INDUSTRIAL PROCESSES
WASTE
Em
issi
ons
(% o
f 199
0 le
vel)
40
50
60
70
80
90
100
110
120
130
140
1990
(1990=100%)
1992 1994 1996 1998 2000 2002 2004 2006 2008 2010 2012
FIG.38 CO2 EMISSIONS TREND BY SECTORSource: European Commission
CO2 emissions per sector are generally all declining since 2007. Industry (processes and manufacturing) CO2 emissions reduced sharply over the period 2007-2012 and are now between 30% and 38% lower than 1990 level.
CO2 emissions from transport are also steadily decreasing since 2007.

45Statistical Report 2015 45
ENERGY INDUSTRIES MANUFACTURING, INDUSTRIES & CONSTRUCTIONTRANSPORTRESIDENTIAL
FUGITIVE EMISSIONS FROM FUELS
AGRICULTURE
TOTAL (EXCLUDING LULUCF)
INDUSTRIAL PROCESSES
WASTE
Em
issi
ons
(% o
f 199
0 le
vel)
40
50
60
70
80
90
100
110
120
130
140
1990
(1990=100%)
1992 1994 1996 1998 2000 2002 2004 2006 2008 2010 2012
CO
2 e
mis
sion
s (%
of w
orld
tota
l)
2012
2040
AFRICA
RUSSIA
CHINA
INDIA
LATINAMERICA
REST OFTHE WORLD
MIDDLE EAST
USA
16%11%
EUROPEAN UNION
6%11%
4.5%5%
12%6.5%
5% 6%
5%
3.5%
4%4%
24.5%23.5%
26.5%26%
FIG.39 DECLINING EU SHARE IN GLOBAL CO2 EMISSIONSSource: IEA, WEO 2014
In 2012 the EU accounted for 11% of global CO2 emissions and is expected to account for only 6% by 2040.

Statistical Report 201546
Ene
rgy
cost
as
% o
f tot
al o
pera
ting
cost
Cash operating costs
Trendline
0%
10%
20%
30%
40%
50%
60%
70%
1998 2000 2002 2004 2006 2008 2010 2012
FIG.40 EU REFINERIES’ ENERGY COST AS PERCENTAGE OF TOTAL OPERATING COSTSSource: Concawe
The share of energy costs has continuously increased over the past 20 years to reach in 2012 over 60% of total operating costs.Despite strong records in energy efficiency gains and a leading
position in this field, European refiners suffer a strong competitive disadvantage from these high energy costs.

47Statistical Report 2015 47
Ene
rgy
cost
as
% o
f tot
al o
pera
ting
cost
Cash operating costs
Trendline
0%
10%
20%
30%
40%
50%
60%
70%
1998 2000 2002 2004 2006 2008 2010 2012
1979 1982 1985 1989 1992 1995 1998 2002 2006 2010
1.8
1.6
1.4
1.2
1
0.8
0.6
0.4
0.2
0
SULPHUR EMISSIONS IN RELATION TO REFINERIES’ THROUGHPUT
Uni
t: K
ilo-t
onne
Sul
phur
per
milli
on to
nne
of re
fi ner
y th
roug
hput
Source: Concawe
FIG.41 REFINERY SULPHUR EMISSIONS HAVE BEEN DECLINING OVER THE YEARS
The sulphur emissions from refinery operations decreased by 75% over the past 30 years.

Statistical Report 201548
50
45
40
35
30
25
20
15
10
5
0
140
120
100
80
60
40
20
01969 1974 1978 1981 1984 1987 1990 1993 1997 2000 2005 2008 2010 2012
OIL DISCHARGED WITH AQUEOUS EFFLUENTS (KTONNES/YR)
OIL DISCHARGED PER REPORTED THROUGHPUT (G/TONNE)
Uni
t: O
il in
wat
er d
isch
arge
(kto
nnes
/yr)
Uni
t: O
il di
scha
rged
per
rep
orte
d th
roug
hput
(g/t
onne
)
Over the years the EU Refineries have significantly improved the quality of refinery water effluent.
The amount of oil discharged in effluents from reporting installations continued to decrease to extremely low levels - both in terms of the absolute amount discharged and the amount expressed relative to the volume of feedstock processed (throughput) and the refining capacity of the installations.
FIG.42 QUALITY OF REFINERY WATER EFFLUENT: OIL DISCHARGED IN WATERSource: Concawe

49Statistical Report 2015 49
Total Energy Consumption per tonne (Net input)
Energy intensity index (EII)
Note: the lower the Ell®, the higher the energy efficiency of a refinery
Tota
l Ene
rgy
Con
sum
ptio
n pe
r to
nne
net i
nput
and
Ell
rela
tive
to 1
992
85
90
95
100
105
110
115
1992 1994 1996 1998 2000 2002 2004 2006 2008 2010 2012
FIG.43 EU REFINERIES’ ENERGY CONSUMPTION AND EFFICIENCY TRENDS RELATIVE TO 1992Source: Solomon Associates
The index shows that EU refineries have improved their energy efficiency by about 10% over the past 20 years. This improvement was achieved despite more energy intensive refinery operations to produce cleaner fuels and meet shifts
in market demand. The corresponding annual energy saving is roughly equivalent to the total annual average energy consumption of four large EU refineries.

Statistical Report 201550
60%
55%
50%
45%
40%
35%
30%2010200820062004200220001998199619941992
Cogeneration
Overall
EU conventional thermal plants
Ele
ctric
ity g
ener
atio
n ef
ficie
ncy
perc
enta
geFIG.44 ELECTRICITY GENERATION EFFICIENCY
Source: Concawe
Refineries have long recognised the considerable efficiency gains offered by cogeneration, which now accounts for more than 90% of the electricity produced in EU refineries.
As a result the average efficiency of electricity generation in EU refineries is substantially higher than the EU average efficiency of electricity production from the average of conventional thermal plants of the electricity sector.

51Statistical Report 2015 51
60%
55%
50%
45%
40%
35%
30%2010200820062004200220001998199619941992
Cogeneration
Overall
EU conventional thermal plants
Ele
ctric
ity g
ener
atio
n ef
ficie
ncy
perc
enta
ge
Japan
US
OECD Europe
80
100
120
140
160
180
200
2005 2006 2007 2008 2009 2010 2011 2012 2013 2014Q2
FIG.45 EVOLUTION OF END-USER ELECTRICITY PRICES FOR INDUSTRYSource: IEA
(2005 = index 100)
Over the past few years US industry gained a significant competitive advantage as a result of low electricity prices.
While European industry faced a 80% energy price increase between 2005 and 2014, the price of electricity for US industry only increased by 20% over the same period.

Statistical Report 201552
68% Refined products
Natural gas 21%
Renewables 9%2% Coal
FIG.46 RELATIVE CHEMICAL INDUSTRY RAW MATERIAL USESource: CEFIC
The EU Refining sector is closely integrated with the Petrochemical Sector. In 2011, 68% of the petrochemical feedstock relied on refined products, such as naphtha and petroleum gases.

53Statistical Report 2015 53
68% Refined products
Natural gas 21%
Renewables 9%2% Coal
Leat
her
& fo
otw
ear
Agr
icul
ture
& fo
rest
ryC
loth
ing
Woo
d &
woo
d pr
oduc
tsTe
xtile
sFu
rnitu
reA
ccom
odat
ion
& fo
od s
ervi
ces
Food
Fabr
icat
ed m
etal
pro
duct
sC
onst
ruct
ion
Tran
spor
tatio
n &
sto
rage
Non
-met
allic
min
eral
pro
duct
sR
ubbe
r &
pla
stic
sB
asic
met
als
Pap
erW
hole
sale
& re
tail
trad
eW
ater
Min
ing
& q
uarr
ying
Prin
ting
Adm
inis
trat
ive
& s
uppo
rt s
ervi
ces
Rep
air
of m
achi
nery
Oth
er m
anuf
actu
ring
Ele
ctric
al e
quip
men
tM
otor
veh
icle
sB
ever
ages
Oth
er s
ervi
ces
Mac
hine
ry &
equ
ipm
ent n
.e.c
.To
bacc
oC
hem
ical
sO
ther
tran
spor
t equ
ipm
ent
Rea
l est
ate
activ
ities
Ele
ctric
ity &
gas
Com
pute
r, el
ectr
onic
and
opt
ical
Co
ke a
nd r
efi n
ed p
etro
leum
Art
s &
ent
erta
iinm
ent
Adm
inis
trat
ion
Hum
an h
ealth
and
soc
ial w
ork
Fina
ncia
l & in
sura
nce
activ
ities
Pha
rmac
eutic
als
Info
rmat
ion
Per
sona
l, sc
ient
ifi c
and
tech
nica
l act
iviti
esE
duca
tion
80%
60%
40%
20%
0%
HIGH SKILL
MEDIUM SKILL
LOW SKILL
FIG.47 SKILL AND KNOWLEDGE INTENSITIES (% OF TOTAL EMPLOYMENT)Source: European Competitiveness Report 2013
According to the European Commission’s Competitiveness Report for 2013, the European refining industry employs one
of the largest percentages of highly skilled workers of all manufacturing industries, just after the pharmaceutical industry.

Statistical Report 201554
Pha
rmac
eutic
als
Com
pute
rsC
hem
ical
sC
oke
and
pet
role
um p
rod
ucts
Ele
ctric
al e
q.M
achi
nery
and
eq.
n.e
.c.
Bev
erag
esIn
form
atio
n an
d co
mm
unic
atio
nTo
bacc
oO
ther
tran
spor
t eq.
Rub
ber
and
plas
tics
Mot
or v
ehic
les
Oth
er m
anuf
actu
ring
Bas
ic m
etal
sM
anuf
actu
ring
Non
-met
allic
min
eral
pro
duct
sTe
xtile
sP
aper
Furn
iture
Pro
fess
iona
l and
sci
entifi
c a
ctiv
ities
Food
and
drin
kFi
nanc
ial a
ctiv
ities
Ele
ctric
ity a
nd g
asLe
athe
rFa
bric
ated
met
al p
rodu
cts
Rep
air
and
inst
alla
tion
of m
achi
nery
Mar
ket s
ervi
ces
Prin
ting
and
publ
ishi
ngW
ood
Who
lesa
le a
nd re
tail
trad
eR
eal e
stat
e ac
tiviti
esC
loth
ing
Wat
er s
uply
Min
ing
& q
uarr
ying
Con
stru
ctio
nA
dmin
istr
ativ
e an
d su
ppor
t act
iviti
esTr
ansp
ort a
nd s
tora
geA
ccom
odat
ion
and
food
40%
35%
30%
25%
20%
15%
10%
5%
0%
PRODUCT INNOVATION
COKE AND PETROLEUM PRODUCTS
PROCESS INNOVATION
PROCESS INNOVATION
FIG.48 EU REFINING INDUSTRY # 1 PROCESS INNOVATION AND AMONG MOST INNOVATIVE INDUSTRIES FOR PRODUCTSSource: European Competitiveness Report 2013
According to data presented by the European Commission in its annual Competitiveness Report, the EU Refining industry was the leading industrial sector in process innovation and among the top 4 for product innovation.

55Statistical Report 2015 55
Uni
t: N
umbe
r of
pet
rol s
tatio
ns
NON EU
EU
Austria
Belgium
Bulgaria
Croatia
Cyprus
Czech Republic
Denmark
Estonia
Finland
France
Germany
Greece
Hungary
Ireland
Italy
Latvia
Lithuania
Luxembourg
Malta
Netherlands
Poland
Portugal
Romania
Slovakia
Slovenia
Spain
Sweden
United Kingdom
2 622
COUNTRY END 2014 COUNTRY END 2014
3 386
2 980 **
280 *
3 792
2 007
440 *
1 892
11 356
14 562
6 245
1 914
1 798
21 800
609
238
3 825
6 479
2 709
2 050
857
546
10 712
2 723 *
8 609
Norway
EU TOTAL 114 431
TOTAL NO + CH + TR 17 705
TOTAL 132 136
Switzerland
Turkey
1 602
3 480
12 623 *
* Numbers for 2013
** Numbers for 2012
Source: National Oil Inustry Associations + FPS Economy - DG Energy
FIG.49 NUMBER OF PETROL STATIONS IN EUROPE END OF 2014
There were over 130,000 petrol stations in the EU, Norway, Switzerland and Turkey operating in 2014, fuelling some 230 million cars and over 30 million trucks on Europe’s roads.

Statistical Report 201556
FuelsEurope is a division of the European Petroleum Refiners Association, an AISBL operating in Belgium. This association, whose members are all 42 companies that operate petroleum refineries in the European Economic Area in 2014, is comprised of FuelsEurope and Concawe divisions, each having separate and distinct roles and expertise but administratively consolidated for efficiency and cost effectiveness.
Members account for almost 100% of EU petroleum refining capacity and more than 75% of EU motor fuel retail sales.
FuelsEurope aims to inform and provide expert advice to the EU institutions and other stakeholders about European Petroleum Refining and Distribution and its products in order to:
n Contribute in a constructive way to the development of technically feasible and cost effective EU policies and legislation.
n Promote an understanding amongst the EU institutions and citizens of the contribution of European Petroleum Refining and Distribution and its value chain to European economic, technological and social progress.
About FuelsEurope

57Statistical Report 2015 57
FuelsEurope Members


FuelsEurope
Boulevard du Souverain, 165 I B-1160 Brussels I BelgiumPhone: +32 (0)2 566 9100 I Fax: +32 (0)2 566 9111
www.fuelseurope.eu