Statistical Process Control Used to determine whether the output of a process conforms to product or...
50
Statistical Process Statistical Process Control Control Used to determine whether the output of a process conforms to product or service specifications. We use control charts to detect production of defective products or services or to indicate that the production or service process has changed. We can measure items such as: •Increases in defective production •Decrease in service complaints •Consistently low measure of units •Decline in re-work or scrap
-
Upload
nico-grennan -
Category
Documents
-
view
216 -
download
2
Transcript of Statistical Process Control Used to determine whether the output of a process conforms to product or...

Statistical Process ControlStatistical Process Control
Used to determine whether the output of a process conforms to product or service specifications. We use control charts to detect production of defective products or services or to indicate that the production or service process has changed. We can measure items such as:
•Increases in defective production•Decrease in service complaints
•Consistently low measure of units•Decline in re-work or scrap
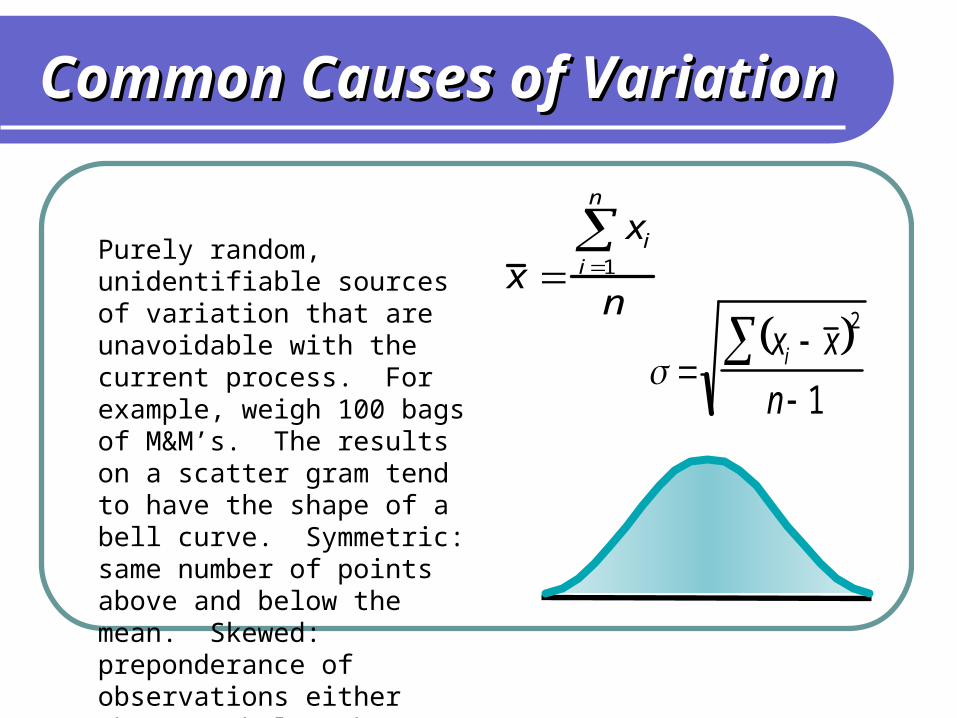
Common Causes of VariationCommon Causes of Variation
x xi
i1
n
n
xi x 2
n 1
Purely random, unidentifiable sources of variation that are unavoidable with the current process. For example, weigh 100 bags of M&M’s. The results on a scatter gram tend to have the shape of a bell curve. Symmetric: same number of points above and below the mean. Skewed: preponderance of observations either above or below the mean.

Common Causes
Characteristics of distributions Mean—the average observation Spread—the dispersion of observations
around the mean Shape—whether the observations are
symmetrical or skewed
Common cause variation is normally distributed (symmetrical) and stable (the mean and spread do not change over time).

Assignable Causes of Variation
Any cause of variation that can be identified and eliminated. Such as an employee that needs training or a machine that needs repair.
Change in the mean, spread, or shape of a process distribution is a symptom that an assignable cause of variation has developed.
After a process is in statistical control, SPC is used to detect significant change, indicating the need for corrective action.

The Inspection Process
Use of inspection to simply remove defectives is improper. It does nothing to prevent defects. We cannot “inspect” quality into a part.
Quality measurements Variables—a characteristic measured on a
continuous scale: such as weight, length, volume, or time.
Advantage: if defective, we know by how much—the direction and magnitude of corrections are indicated.
Disadvantage: precise measurements are required.

The Inspection Process
Quality measurements Attributes—a characteristic that can be counted (yes-no,
integer number). Used to determine conformance to complex specifications, or when measuring variables is too costly
Advantages - Quickly reveals when quality has changed, provides an integer number of how many are defective. Requires less effort and fewer resources than measuring variables.
Disadvantages: Doesn’t show by how much they were defective, the direction and magnitude of corrections are not indicated, Requires more observations, as each observation provides little information
The Inspection Process
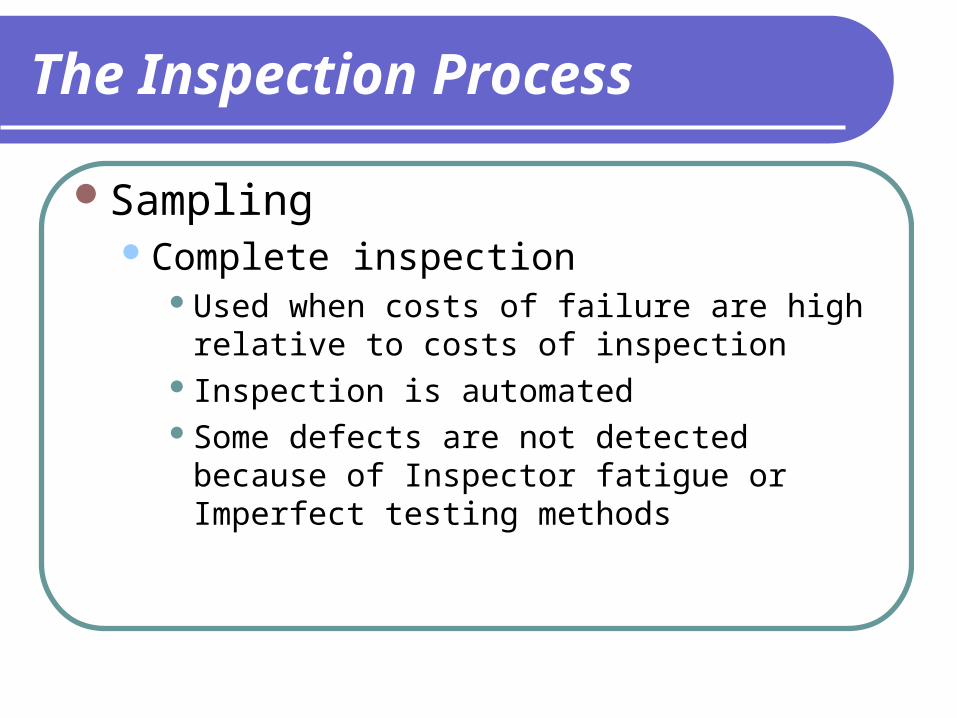
SamplingComplete inspection
Used when costs of failure are high relative to costs of inspection
Inspection is automatedSome defects are not detected because of
Inspector fatigue or Imperfect testing methods
The Inspection Process
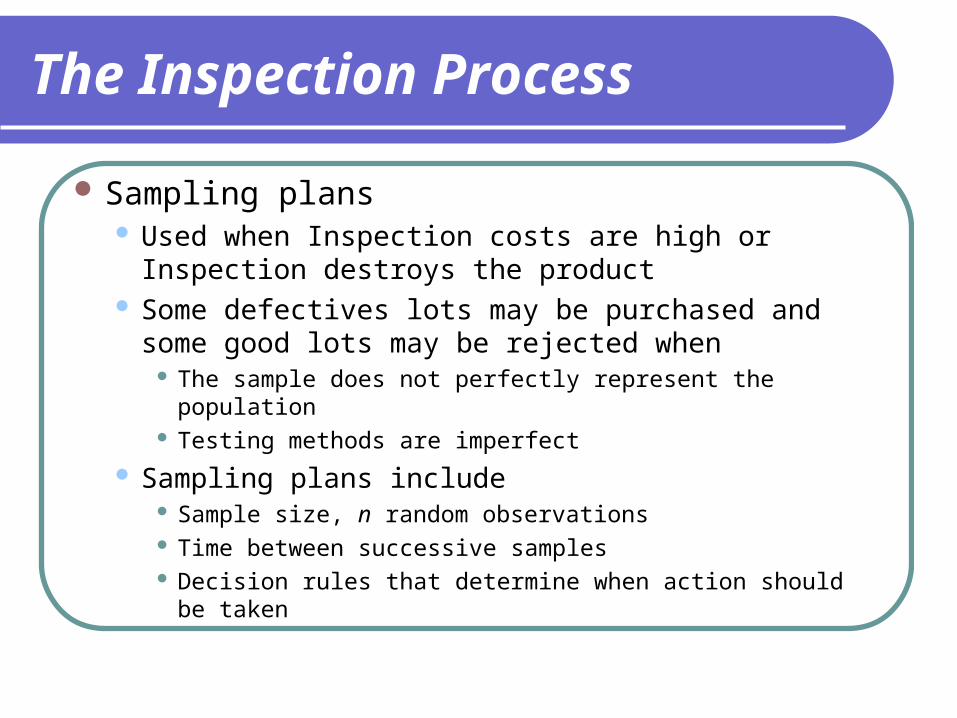
Sampling plans Used when Inspection costs are high or Inspection
destroys the product Some defectives lots may be purchased and some
good lots may be rejected when The sample does not perfectly represent the population Testing methods are imperfect
Sampling plans include Sample size, n random observations Time between successive samples Decision rules that determine when action should be taken

The Inspection Process
Sampling distributions Sample means are usually dispersed about the
population mean according to the normal probability distribution (reference the central limit theorem described in statistics texts).
Control charts Used to judge whether action is required A sample characteristic measured above the upper
control limit (UCL) or below the lower control limit (LCL) indicates that an assignable cause probably exists.
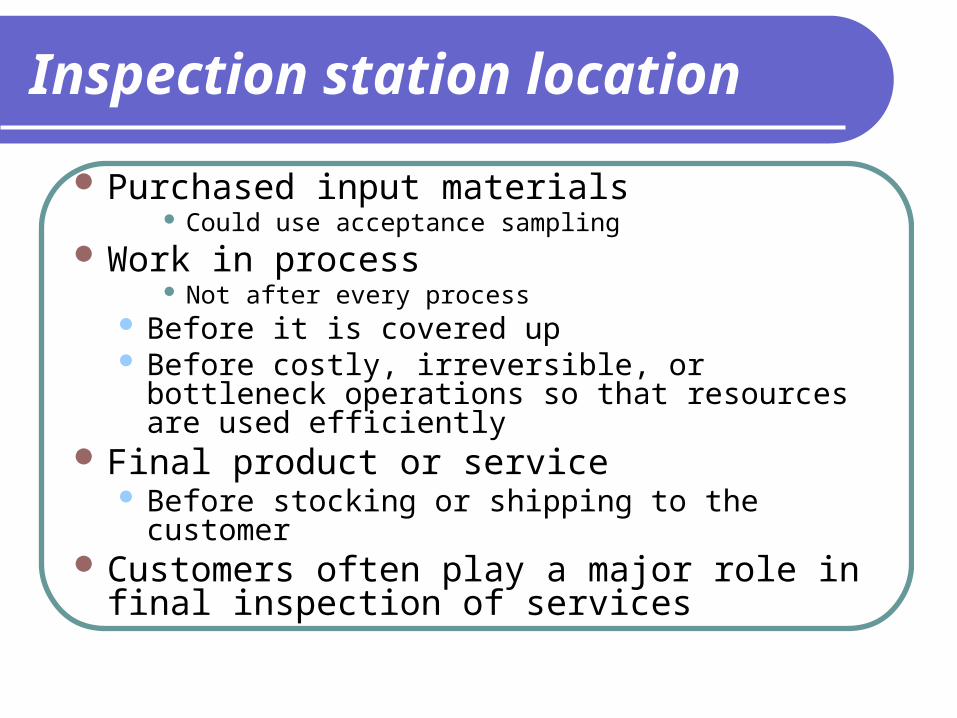
Inspection station location
Purchased input materials Could use acceptance sampling
Work in process Not after every process
Before it is covered up Before costly, irreversible, or bottleneck operations
so that resources are used efficiently Final product or service
Before stocking or shipping to the customer Customers often play a major role in final
inspection of services

Normal DistributionNormal Distribution
–3–2–1+1+2+3Mean
68.26%95.44%99.74%
= Standard deviation

Control ChartsControl Charts
UCL
Nominal
LCL
Assignable causes likely – may also indicate
improvement
1 2 3Samples
Common Causes

Using Control Charts for Process Using Control Charts for Process ImprovementImprovement
Measure the process When changes are indicated,
find the assignable cause Eliminate problems, incorporate
improvements Repeat the cycle

Indicators of out of control conditions
A trend in the observations (the process is drifting)
A sudden or step change in the observations A run of five or more observations on the
same side of the mean (If we flip a coin and get “heads” five times in a row, we become suspicious of the coin or of the coin flipping process.)
Several observations near the control limits (Normally only 1 in 20 observations are more than 2 standard deviations from the mean.)

Control Chart ExamplesControl Chart Examples
Nominal
UCL
LCL
Sample number
Var
iati
on
s
In Control

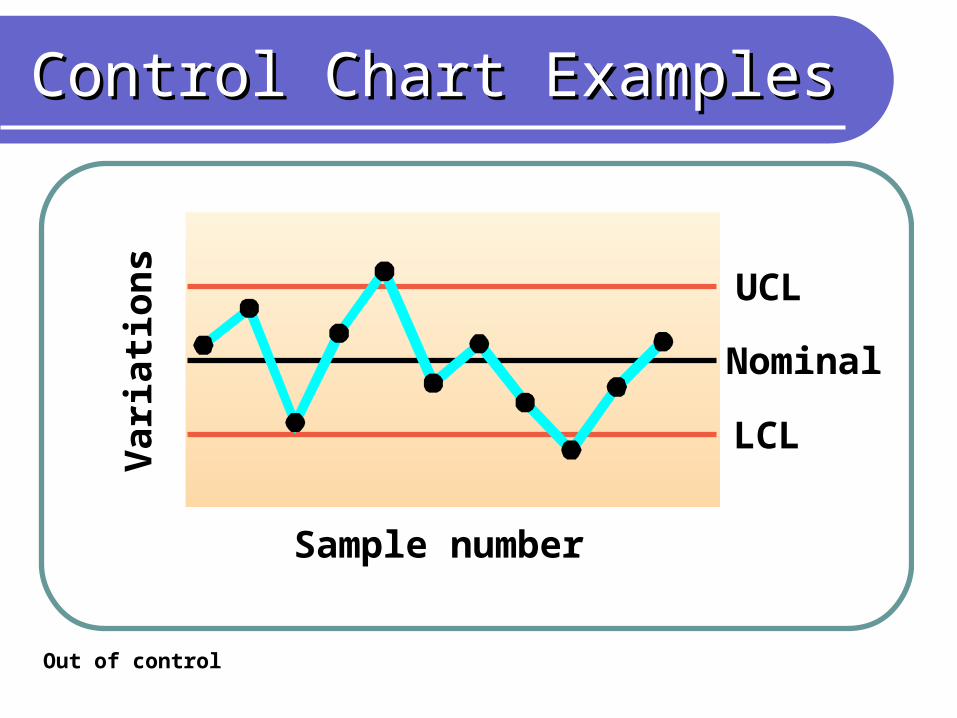
Control Chart ExamplesControl Chart Examples
Nominal
UCL
LCL
Sample number
Var
iati
on
s
Run – generally 5 or more, take action, even if not outside control limits

Control Chart ExamplesControl Chart Examples
Nominal
UCL
LCL
Sample number
Var
iati
on
s
Sudden change – last 4 are unusual

Control Chart ExamplesControl Chart Examples
Nominal
UCL
LCL
Sample number
Var
iati
on
s
Upward run
Control Chart ExamplesControl Chart Examples
Nominal
UCL
LCL
Sample number
Var
iati
on
s
Out of control

Control Limits and ErrorsControl Limits and Errors
LCL
Processaverage
UCL
Three-sigma limits – the cost of searching for assignable cause is large relative to the cost of not detecting a shift in the process average.
Type I error:Probability of searching for a cause when none exists
Type II error:Probability of concludingthat nothing has changed
Shift in process average

Control Limits and ErrorsControl Limits and Errors
Type I error:Probability of searching for a cause when none exists
Two-sigma limits – the cost of not detecting a shift in the process exceeds the cost of searching for assignable causes. With smaller control limits, a shift in process average will be detected sooner.
Type II error:Probability of concludingthat nothing has changed
Shift in process average
UCL
LCL
Processaverage

Sample Sample
Number 1 2 3 4
1 0.5014 0.5022 0.5009 0.5027
2 0.5021 0.5041 0.5024 0.5020
3 0.5018 0.5026 0.5035 0.5023
4 0.5008 0.5034 0.5024 0.5015
5 0.5041 0.5056 0.5034 0.5047
Special Metal Screw
Control Charts for VariablesControl Charts for Variables

Sample Sample
Number 1 2 3 4 R x
1 0.5014 0.5022 0.5009 0.5027 0.0018 0.5018
2 0.5021 0.5041 0.5024 0.5020
3 0.5018 0.5026 0.5035 0.5023
4 0.5008 0.5034 0.5024 0.5015
5 0.5041 0.5056 0.5034 0.5039
0.5027 – 0.50090.5027 – 0.5009 == 0.00180.0018(0.5014 + 0.5022 +(0.5014 + 0.5022 + 0.5009 + 0.5027)/40.5009 + 0.5027)/4 == 0.50180.5018
Special Metal Screw
_
Control Charts for VariablesControl Charts for Variables
Control Charts for VariablesControl Charts for Variables
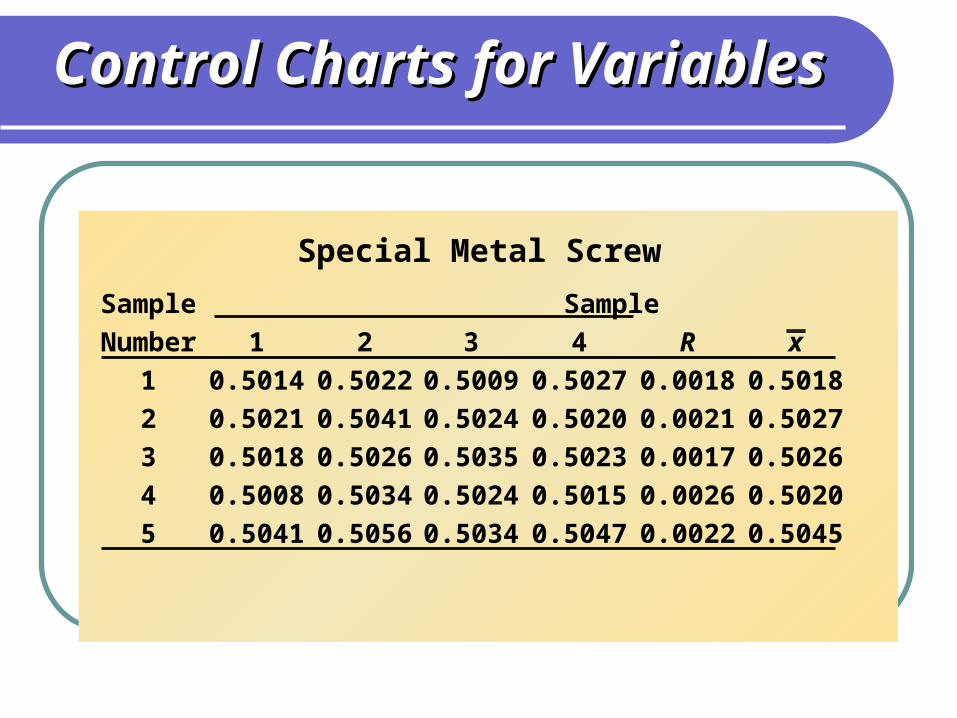
Sample Sample
Number 1 2 3 4 R x
1 0.5014 0.5022 0.5009 0.5027 0.0018 0.5018
2 0.5021 0.5041 0.5024 0.5020 0.0021 0.5027
3 0.5018 0.5026 0.5035 0.5023 0.0017 0.5026
4 0.5008 0.5034 0.5024 0.5015 0.0026 0.5020
5 0.5041 0.5056 0.5034 0.5047 0.0022 0.5045
Special Metal Screw
_

Sample Sample
Number 1 2 3 4 R x
1 0.5014 0.5022 0.5009 0.5027 0.0018 0.5018
2 0.5021 0.5041 0.5024 0.5020 0.0021 0.5027
3 0.5018 0.5026 0.5035 0.5023 0.0017 0.5026
4 0.5008 0.5034 0.5024 0.5015 0.0026 0.5020
5 0.5041 0.5056 0.5034 0.5047 0.0022 0.5045
R = 0.0021
x = 0.5027
Special Metal Screw
=
_
Control Charts for VariablesControl Charts for Variables

Control Charts – Special Metal Screw
R-Charts R = 0.0021
UCLR = D4RLCLR = D3R
Control Charts for VariablesControl Charts for Variables

Control Chart FactorsControl Chart Factors
Factor for UCLFactor for UCL Factor forFactor for FactorFactorSize ofSize of and LCL forand LCL for LCL forLCL for UCL forUCL forSampleSample xx-Charts-Charts RR-Charts-Charts RR-Charts-Charts
((nn)) ((AA22)) ((DD33)) ((DD44))
22 1.8801.880 0 0 3.2673.26733 1.0231.023 0 0 2.5752.57544 0.7290.729 0 0 2.2822.28255 0.5770.577 0 0 2.1152.11566 0.4830.483 0 0 2.0042.00477 0.4190.419 0.076 0.076 1.9241.924
Control Charts for VariablesControl Charts for Variables

Control Charts—Special Metal Screw
R-Charts R = 0.0021 D4 = 2.282D3 = 0
UCLR = 2.282 (0.0021) = 0.00479 in.LCLR = 0 (0.0021) = 0 in.
UCLR = D4RLCLR = D3R
Control Charts for VariablesControl Charts for Variables

Control Charts for VariablesControl Charts for Variables

Control Charts—Special Metal Screw
X-Charts
UCLx = x + A2RLCLx = x - A2R
==
R = 0.0021x = 0.5027=
Control Charts for VariablesControl Charts for Variables

Control Charts—Special Metal Screw
x-Charts
UCLx = 0.5027 + 0.729 (0.0021) = 0.5042 in.LCLx = 0.5027 – 0.729 (0.0021) = 0.5012 in.
UCLx = x + A2RLCLx = x - A2R
==
R = 0.0021 A2 = 0.729x = 0.5027=
Control Charts for VariablesControl Charts for Variables

Measure the process Find the assignable cause Eliminate the problem Repeat the cycle
Control Charts for VariablesControl Charts for Variables
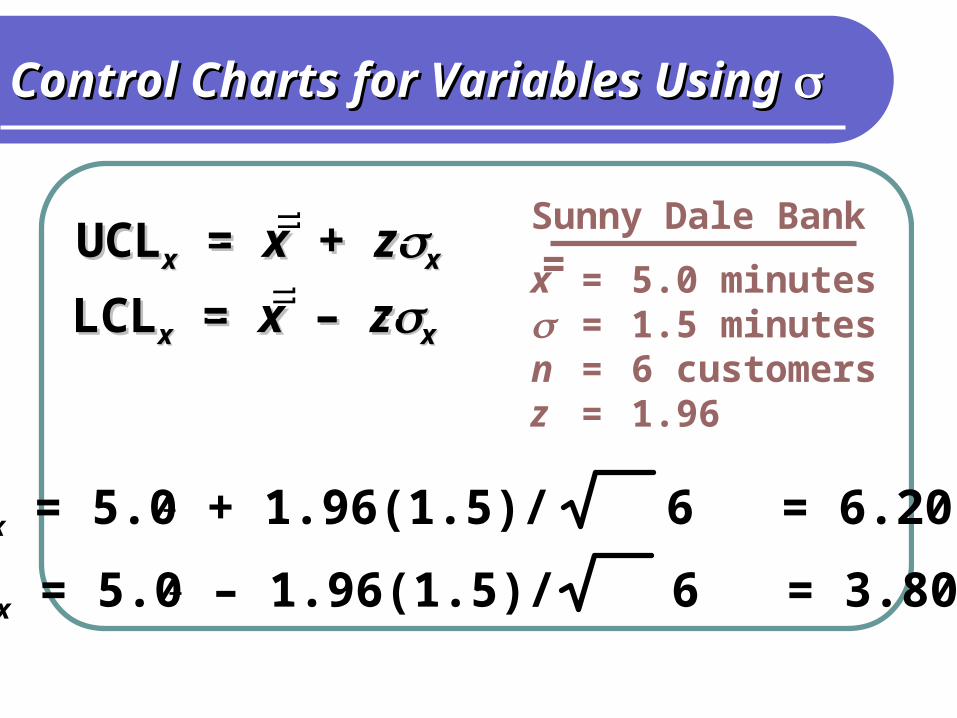
Control Charts for Variables Using Control Charts for Variables Using
UCLx = 5.0 + 1.96(1.5)/ 6 = 6.20 min
UCLx = 5.0 – 1.96(1.5)/ 6 = 3.80 min
UCLUCLxx = = xx + + zzxx
LCLLCLxx = = xx – – zzxx
x = /n
==
==
Sunny Dale Bank
x = 5.0 minutes = 1.5 minutesn = 6 customersz = 1.96
=

Control Charts for AttributesControl Charts for Attributes
Hometown BankHometown Bank
UCLUCLpp = = pp + + zzpp
LCLLCLpp = = pp – – zzpp
pp = = pp(1 – (1 – pp))//nn

Hometown BankHometown Bank
Sample WrongNumber Account
Number 1 15 2 12 3 19 4 2 5 19 6 4 7 24 8 7 9 1010 1711 1512 3
Total 147
Total defectives
Total observationsp =
n = 2500
147
12(2500)p =
p = 0.0049

Hometown BankHometown Bank
UCLUCLpp = = pp + + zzpp
LCLLCLpp = = pp – – zzpp
pp = 0.0049(1 – 0.0049)/2500 = 0.0049(1 – 0.0049)/2500
n = 2500 p = 0.0049
Control Charts for AttributesControl Charts for Attributes

Hometown BankHometown Bank
pp = 0.0014 = 0.0014
n = 2500 p = 0.0049
UCLUCLpp = 0.0049 + 3(0.0014) = 0.0049 + 3(0.0014)
LCLLCLpp = 0.0049 – 3(0.0014) = 0.0049 – 3(0.0014)
Control Charts for AttributesControl Charts for Attributes

p-ChartWrong Account Numbers
Measure the process Find the assignable cause Eliminate the problem Repeat the cycle

p-Chart comments
Two things to note:The lower control limit cannot be negative.When the number of defects is less than the
LCL, then the system is out of control in a good way. We want to find the assignable cause. Find what was unique about this event that caused things to work out so well.

c = 20 z = 2
UCLc = c + z c
LCLc = c – z c
Control Charts for AttributesControl Charts for Attributes

c = 20 z = 2
UCLc = 20 + 2 20
LCLc = 20 – 2 20
Control Charts for AttributesControl Charts for Attributes
UCLc = 28.94
LCLc = 11.06

Control Charts for AttributesControl Charts for Attributes

Process CapabilityProcess CapabilityNominal
value
800 1000 1200 Hours
Upperspecification
Lowerspecification
Process distribution
(a) Process is capable
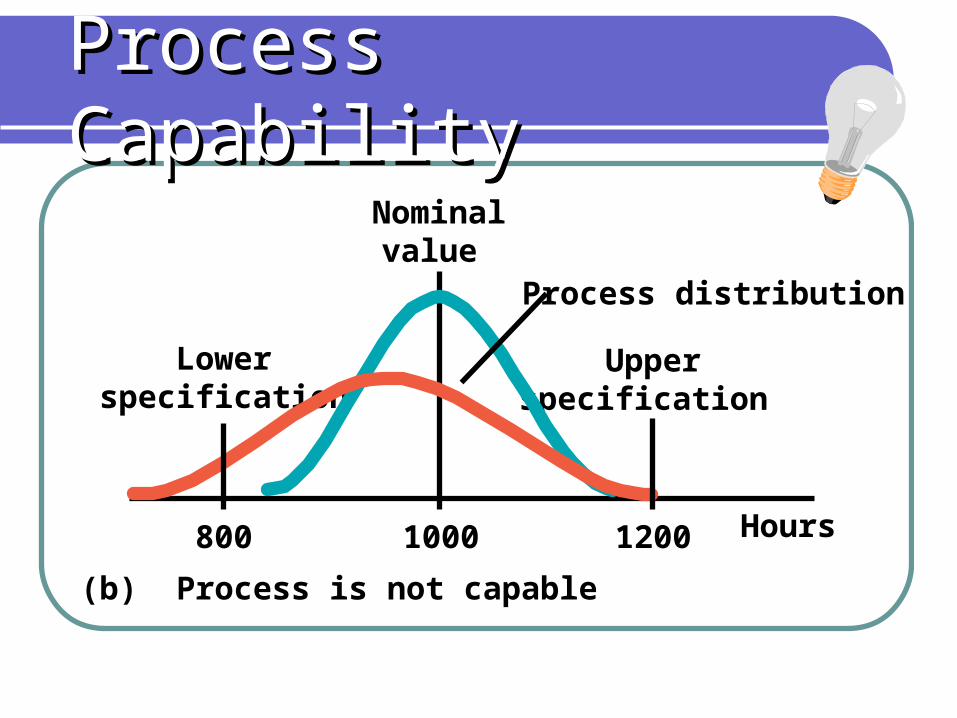
Process CapabilityProcess Capability
Nominalvalue
Hours
Upperspecification
Lowerspecification
Process distribution
(b) Process is not capable
800 1000 1200

Process CapabilityProcess Capability
Lowerspecification
Mean
Upperspecification
Six sigma
Four sigma
Two sigma
Nominal value

Upper specification = 1200 hoursLower specification = 800 hoursAverage life = 900 hours = 48 hours
Process Capability RatioProcess Capability Ratio
Cp =
Upper specification - Lower specification
6
Cp = 1200 – 800
6(48)Cp = 1.39

Process CapabilityProcess Capability
Lightbulb ProductionUpper specification = 1200 hoursLower specification = 800 hoursAverage life = 900 hours = 48 hours
Cp = 1.39
Cpk = Minimum of
ProcessProcessCapabilityCapabilityIndexIndex
Upper specification – x
3
x – Lower specification
3,
=
=

Process CapabilityProcess Capability
Lightbulb ProductionUpper specification = 1200 hoursLower specification = 800 hoursAverage life = 900 hours = 48 hours
1200 – 900
3(48)
900 – 800
3(48)
ProcessProcessCapabilityCapabilityIndexIndex
,Cpk = Minimum of
Cp = 1.39
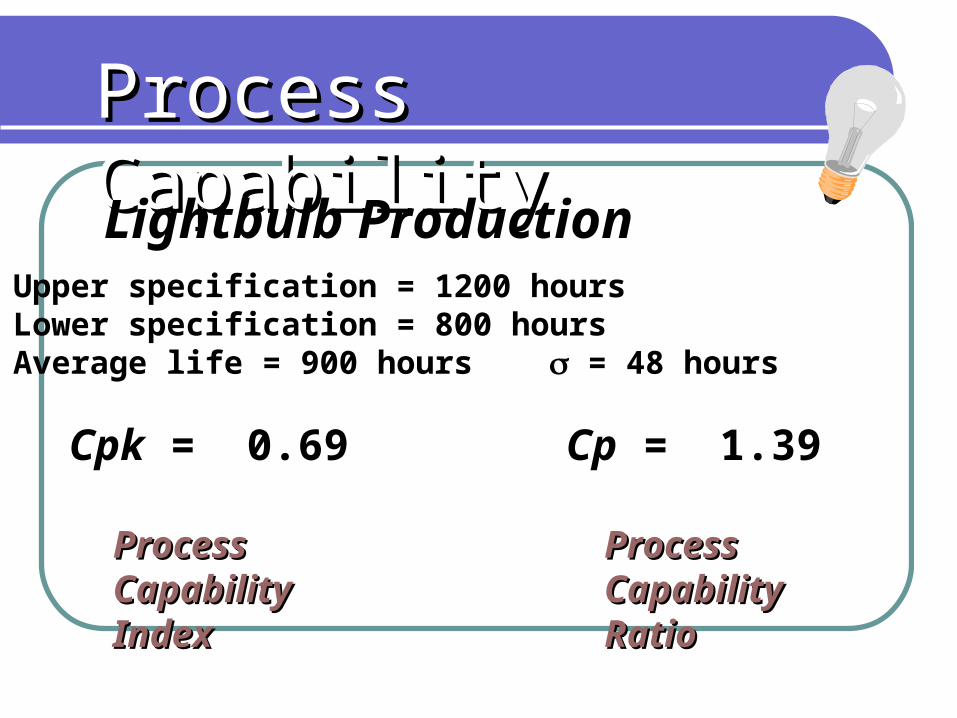
Process CapabilityProcess CapabilityLightbulb ProductionUpper specification = 1200 hoursLower specification = 800 hoursAverage life = 900 hours = 48 hours
Cp = 1.39Cpk = 0.69
ProcessProcessCapabilityCapabilityIndexIndex
ProcessProcessCapabilityCapabilityRatioRatio

Taguchi's Quality Loss FunctionTaguchi's Quality Loss Function
Lo
ss (
do
llar
s)
Lower Nominal Upperspecification value specification