Statistical Physics at Crystal Surfaces
18
6 Statistical Physics at Crystal Surfaces Alberto Pimpinelli LASMEA, Universit6 Blaise Pascal Clermont 2, Les C6zeaux, 63177 Aubi6re Cedex, France 1 6.1 Surface Thermodynamics 6.1.1 Surface Free Energy According to thermodynamics, physical properties can be deduced from the knowledge of the free energy. In this lecture, the surface free energy is intro- duced in a simplified way (disregarding, in particular, elasticity). In order to create a surface, one has to break chemical bonds, and this costs energy. At finite temperature, the free energy has to be considered. It is easy to give, a precise definition of the surface free energy: to break a crystal along a plane, it requires a work W. If L' is the area of the crystal section, the surface free energy for unit area or surface tension is ao W/(2L2), the factor of 2 coming from the two surfaces which are created this way. It is straightforward to see that the number of broken bonds per unit surface area varies with the surface orientation. In particular, in the broken-bond approximation compact surfaces are expected to have a larger surface tension than open ones: o-(111) > o-(ool) > o-(11o) (Problem, Prove that, for instance, o-(111) 1.155o-(Ool) for an fcc crystal, at low temperature.) Given this dependence on orientation, if the surface is not a plane the total surface free energy may be expected to be the integral of the energies of all surface elements. This is only true for an incompressible solid of large enough size (the interested reader will find a discussion of this statement in [1]. If x, y and z are Cartesian coordinates and z(x, y) is the height of the surface over the xy plane, the local surface tension is then a function o-(p, q) of the partial derivatives P (9Z1,9X, q azlay representing the local slopes of the surface profile. The total free energy of a large, incompressible solid body containing N atoms is then: F -- Fo + I I o-(p, q)dS Most of the material in this lecture is based on the book "Physics of crystal growth", A. Pimpinelli & J. Villain, Cambridge University Press (1998). The interested reader should refer directly to it for delving deeper into the different subjects quickly treated here.
Transcript of Statistical Physics at Crystal Surfaces

6 Statistical Physics at Crystal Surfaces
Alberto Pimpinelli
LASMEA, Universit6 Blaise Pascal - Clermont 2, Les C6zeaux, 63177 Aubi6re
Cedex, France1
6.1 Surface Thermodynamics
6.1.1 Surface Free Energy
According to thermodynamics, physical properties can be deduced from the
knowledge of the free energy. In this lecture, the surface free energy is intro-
duced in a simplified way (disregarding, in particular, elasticity).In order to create a surface, one has to break chemical bonds, and this
costs energy. At finite temperature, the free energy has to be considered. It is
easy to give, a precise definition of the surface free energy: to break a crystalalong a plane, it requires a work W. If L' is the area of the crystal section,the surface free energy for unit area or surface tension is ao W/(2L2),the factor of 2 coming from the two surfaces which are created this way. It
is straightforward to see that the number of broken bonds per unit surface
area varies with the surface orientation. In particular, in the broken-bond
approximation compact surfaces are expected to have a larger surface tension
than open ones: o-(111) > o-(ool) > o-(11o) (Problem, Prove that, for instance,o-(111) 1.155o-(Ool) for an fcc crystal, at low temperature.)
Given this dependence on orientation, if the surface is not a plane the
total surface free energy may be expected to be the integral of the energiesof all surface elements. This is only true for an incompressible solid of largeenough size (the interested reader will find a discussion of this statement in
[1]. If x, y and z are Cartesian coordinates and z(x, y) is the height of the
surface over the xy plane, the local surface tension is then a function o-(p, q)of the partial derivatives
P (9Z1,9X,
q azlay
representing the local slopes of the surface profile. The total free energy of a
large, incompressible solid body containing N atoms is then:
F -- Fo + I I o-(p, q)dS
Most of the material in this lecture is based on the book "Physics of crystalgrowth", A. Pimpinelli & J. Villain, Cambridge University Press (1998). The
interested reader should refer directly to it for delving deeper into the different
subjects quickly treated here.
ute
J. Daillant and A. Gibaud: LNPm 58, pp. 199 - 216, 1999 © Springer-Verlag Berlin Heidelberg 1999

200 Alberto Pimpinelli
where the first term on the right-hand side is the bulk free energy, and thesecond term is the surface free energy. The integration is made over thesurface of the solid and dS is the surface element.
For an incompressible solid, one can equivalently use the (Helmholtz) free
energy F(T, V) or the Gibbs free energy (free enthalpy) G(T, P) -- F +PV. The latter is known from thermodynamics to be equal to yoN (in the
thermodynamic limit N -+ oo and in the absence of a surface). Processes at
constant pressure are more adequately described if G is used. In the future,we shall mainly use the free energy F because, in the absence of external
forces, it results directly from the interactions between the molecules of thesolid. Sometimes, we will drop the word "free", especially at low temperaturewhere energy and free energy are not very different.
In formula (6. 1), the free . energy is assumed to be independent of thelocal curvature. This is only true for a large sample. (Problem. Why? Is the
assumption appropriate for membranes?) Another simplification comes fromthe fact that the surface itself may be difficult to define: its location may berather imprecise. This point has been addressed by Gibbs [2]. Also, in formula
(6. 1) it is assumed that z (x, y) is analytic, which implies that fluctuations on
an atomic scale are ignored-or, better, averaged out (what is called coarse-
graining in the jargon).
6.1.2 Step Free Energy
At zero temperature, a (001) or (111) surface is flat. At higher temperatures,thermal fluqtuations will make atoms leave the surface plane and create holesand mounds. In other words, steps are present on the surface at any finite
temperature. In the same way as the surface free energy, a step free energymay be defined. This is how to proceed: a bulk solid is cut into two piecesof cross section L x L, but this time a step is also cut. The work needed to
take apart the two pieces is proportional to the total surface exposed, whichis now L2 + U, if b is the step heigth. The total free energy is thus
0 -"-
W- 0"
b(6.2) L2 0 +7L
The "excess" free energy due to the step, ^/, is called the step free energy or
step line tension. If more steps are present, (6.2) shows that the total free
energy is proportional to the number of steps per unit length, or step density,as long as the steps are far enough from each other that their interactionscan be neglected. Broken bond arguments show that the step free energy is
a function of the step orientation.

6 Statistical Physics at Crystal Surfaces 201
6.1.3 Singularities of the Surface Tension
Let us suppose that the plane z -- 0 is parallel to a high-symmetry orientation,for instance (001), and that the temperature is low. We will see the precisemeaning of "low temperature" when addressing the roughening transition
in Sect. 6.2. Of course, no experimental realisation of a flat high-symmetrysurface is possible beyond a certain length. In other words, real surfaces
are always slightly "misoriented" or "miscut" with respect to a given high-symmetry plane, so that they make a small angle 0 with that orientation (atypical lower bound for 0 is - 0.1'). As said above, if step-step interactions
are neglected-which is licit, if steps are rare-the projected surface freeenergy 0 -- al cos 0 is simply equal to the step free energy Multiplied by the
step density I tan 0 1:
0(0) -_ 0(0) + -yJ tan 01 :-- 0(0) + -yV/p2 + q2 . (6.3)
This shows that the surface free energy is non-analytic (as a function of the
local slopes p and # The line tension -/ is a function of the step orientation
y" -_ dy/dx -- -p1q. As a matter of fact, it is an analytic function at all
T. The singular behaviour of the surface free energy at low temperatureis typical of the high-symmetry, low-index orientations, which are therefore
called singular. These appear as flat facets in the macroscopic equilibriumshape of the crystal. The linear size of a facet is proportional to -/. These
statements are proved using the so-called Wulff construction, a geometricalconstruction which relies the surface free energy of 4 crystal to its equilibriumshape [3]. Using the projected free energy 0 is useful to derive the analyticequivalent of Wulff's contruction from a variational principle: the equilibriumshape of a crystal minimises the surface free energy for a given volume [4,3].
6.1.4 Surface Stiffness
It seems doubtful that equation (6.3) may hold at all temperatures. Steps can
be straight as assumed in deriving (6.2), only at T -- 0. At finite temperature,they must fluctuate-in what is called step meandering. It may well be that
a step becomes so "delocalised" that the concept of step looses its meaningaltogether, above a given temperature. Indeed, we will see in Sect. 6.2 that
such a temperature exists, and the corresponding transition is the roughen-ing transition; in the rough, high-temperature phase, the step line tension ^/
actually vanishes. What is the form of the surface free energy at high tem-
perature? Our experience with critical phenomena suggests that it may be
useful to assume for the free energy an analytic expansion a la Landau in the
disordered, high temperature phase [4]. To do that, it is convenient to trans-
form the surface integral in (6.1) into an integral over Cartesian coordinates
x and y. For a closed surface, this requires that the surface be cut into a few
pieces and different projection planes be used for the various pieces. Locally,
202 Alberto Pimpinelli
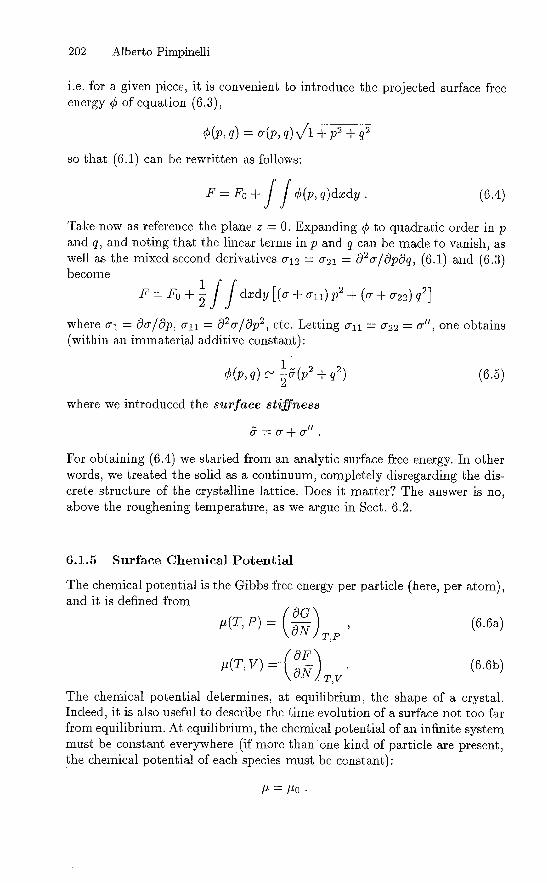
i. e. for a given piece, it is convenient to introduce the projected surface free
energy 0 of equation (6.3),
0(p, q) = a(p, q) 11 + p2 + q2
so that (6.1) can be rewritten as follows:
F -- F0 + I 0(p, q)dxdy (6.4)
Take now as reference the plane z 0. Expanding 0 to quadratic order in pand q, and noting that the linear terms in p and q can be made to vanish, as
well as the mixed second derivatives 0'12 = 0'21 = 02 alOpOq, (6. 1) and (6.3)become
F _- Fo +1
dxdy [(0. + 0.11) P2 +(0- + 0'22) q2]2 11where o-1 -- Oulap, 0.11 = a20.1OP2, etc. Letting 0"11 - 0'22 - 0'//, one obtains
(within an immaterial additive constant):
(p, q) -_I&(P2+ q2) (6.5)2
where we introduced the surface stiffness
& = 0- + 0-".
For obtaining (6.4) we started from an analytic surface free energy. In other
words, we treated the solid as a continuum, completely disregarding the dis-crete structure of the crystalline lattice. Does it matter? The answer is no,above the roughening temperature, as we argue in Sect. 6.2.
6.1.5 Surface Chemical Potential
The chemical potential is the Gibbs free energy per particle (here, per atom),and it is defined from
y (T, P)OG
(6.6a)(ON )T,P
y(T, V)OF
(6.6b)ON )T,VThe chemical potential determines, at equilibrium, the shape of a crystal.Indeed, it is also useful to describe the time evolution of a surface not too farfrom equilibrium. At equilibrium, the chemical potential of an infinite systemmust be constant everywhere (if more than one kind of particle are present,the chemical potential of each species must be constant):
Y - Yo

6 Statistical Physics at Crystal Surfaces 203
How is this relation. modified for a finite size system such as a crystal of
fixed volume V? Let us locally modify the crystal surface so as to changeisothermally and at constant volume the number of particles by a quantityJN. The most appropriate thermodynamic potential to use is the Helmoltz
free energy. Then, p is found from (JF)T,V = yJN. Introducing the atomic
volume v -- VIN, let
N z(x, y)dxdy .
V
If z(x, y) varies by Jz, then
(JF)T,V -- y(T, V)JN =
V if Jz(x, y)dxdy. (6.7)
Varying (6.4) yields:
JF = 10 Jz (x, y)dxdy + I I LOSp + 00Jq dxdy. (6.8)
V if ( Op Oq )The term within brackets in the second integral can be integrated by parts,
provided 0 is at least twice differentiable. Since p = c9z/Ox,
00 0Sp) dxdy = I f (L '9 (Jz)) dxdyc9p Op OX
0 JZ) dxdy - JZa 00
dxdy.Op Ox ( OPC9X (
We only consider local variations Jz, so that the first term vanishes. The
second term in brackets in (6.8) can be handled in the same way, and we
find:Ito
JF -- JZ(X' Y) - ( 00) '9 ( 00 ) ] dxdy.'if I V OX Op ay aq
Finally, equating the preceding equation to (6.7) one gets (Herring 1953,Mullins 1963):
Y = P (2p) + (6-9)0 - V [c9x C9Y c9q
In the following we will often choose our units in such a way that the molecular
volume v -- VIN is 1. The reference chemical potential po is the chemical
potential of the bulk solid, according to (6.1). At equilibrium, the chemical
potential at the surface must also be equal to yo, and from (6.9) the surface
must be flat.
If (6.4) holds, the chemical potential is P + Jp, where Jp is, according to
(6.9), given by
61-t = -V&(a2Z
+(92Z
(6-10)TX-2 9y2
204 Alberto Pimpinelli
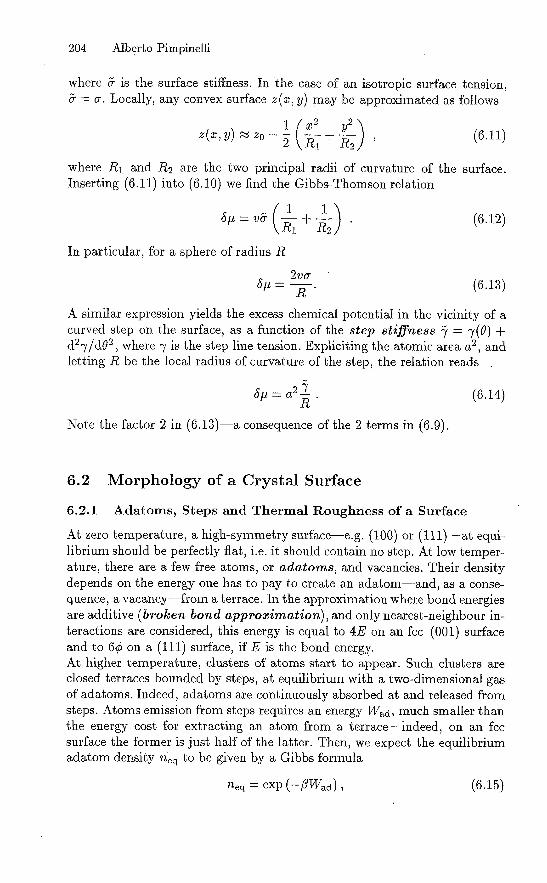
where & is the surface stiffness. In'the case of an isotropic surface tension,& = o-. Locally, any convex surface z (x. I y) may be approximated as follows
(x2 +Y2
Z(X' Y) ZO -2 R, R2 (6.11)
where R, and R2 are the two principal radii of curvature of the surface.
Inserting (6. 11) into (6. 10) we find the Gibbs-Thomson relation
61t = V&1+
1(6.12)(Ri R2
In particular, for a sphere of radius R
2vo-
R
A similar expression yields the excess chemical potential in the vicinity of a
curved step on the surface, as a function of the step stiffness = -Y(O) +d27/dO2' where ^/ is the step line tension. Expliciting the atomic area a
2,and
letting R be the local radius of curvature of the step, the relation reads,
Jy = a2
* (6.14)R
Note the factor 2 in (6.13)-a consequence of the 2 terms in (6.9).
6.2 Morphology of a Crystal Surface
6.2.1 Adatoms, Steps and Thermal Roughness of a Surface
At zero temperature, a high-symmetry surface-e.g. (100) or (I I 1)-at equi-librium should be perfectly flat, i.e. it should contain no step. At low temper-ature, there are a few free atoms, or adatoms, and vacancies. Their densitydepends on the energy one has to pay to create an adatom-and, as a conse-
quence, a vacancy-from a terrace. In the approximation where bond energiesare additive (broken bond approximation), and only nearest-neighbour in-teractions are considered, this energy is equal to 4E on an fcc-(001) surfaceand to 60 on a (111) surface, if E is the bond energy.At higher temperature, clusters of atoms start to appear. Such clusters are
closed terraces bounded by steps, at equilibrium with a two-dimensional gasof adatoms. Indeed, adatoms are continuously absorbed at and released from
steps. Atoms emission from steps requires an energy Wad) much smaller thanthe energy cost for extracting an atom from a terrace-indeed, on an fccsurface the former is just half of the latter. Then, we expect the equilibriumadatom density neq to be given by a Gibbs formula
neq -- exp, (-#Wad) 1 (6.15)
6 Statistical Physics at Crystal Surfaces 205
where 1/# = k.8T and kB is the Boltzmann constant.
The step density (total step length per unit surface) increases with tempera-ture. This increase is not easily seen directly by microscopy. Indeed, most of
microscopy techniques work best at low temperature, where matter transportis hard and the surface does not easily attain thermal equilibrium. On the
other hand, the atom scattering or x-ray diffraction signal does exhibit a dra-
matic change when temperature is increased and the surface roughens. Above
some temperature, the lineshape, which is lorentzian at low temperature, un-
dergoes a qualitative change. One can for instance measure the "specular"reflection, i.e. that whose reflection angle almost equals the incidence angle(speculum is the Latin for mirror). The specular peak (as well as the Braggpeaks) is narrow for a smooth surface while a rough surface scatters radiation
in all directions.
The interpretation of diffraction patterns from a hot surface is difficult
[5-7] because the effect of atomic vibrations adds to roughness to broaden
the reflected beam. It is however clear, from a quantitative analysis, that the
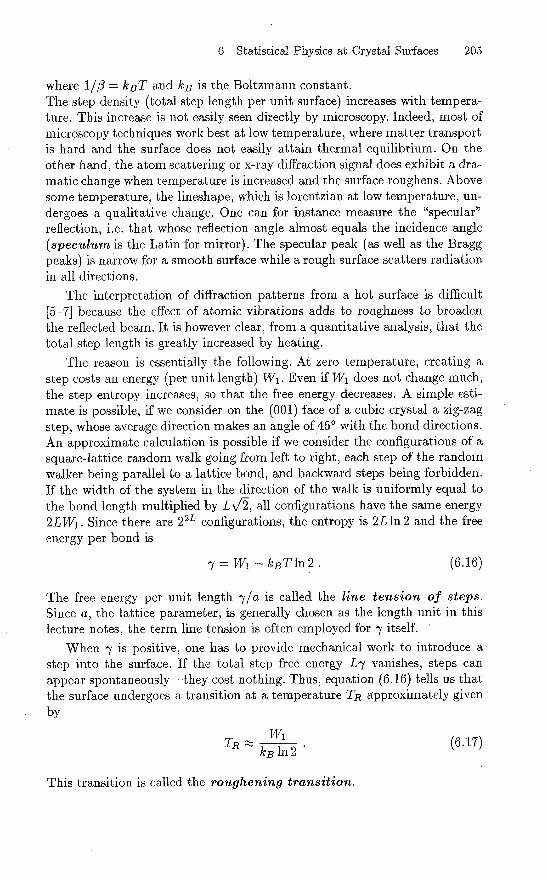
total step length is greatly increased by heating.The reason is essentially the following. At zero temperature, creating a
step costs an energy (per unit length) W1. Even if W, does not change much,the step entropy increases, so that the free energy decreases. A simple esti-
mate is possible, if we consider on the (001) face of a cubic crystal a zig-zagstep, whose average direction makes an angle of'45' with the bond directions.
An approximate calculation is possible if we consider the configurations of a
square-lattice random walk going from left to right, each step of the random
walker being parallel to a lattice bond, and backward steps being forbidden.
If the width of the system in the direction of the walk is uniformly equal to
the bond length multiplied by Lv _2, all configurations have the same energy
2LW,. Since there are 22L configurations, the entropy is 2L In 2 and the free
energy per bond is
W, - kBTln2. (6.16)
The free energy per unit length -y1a is called the line tension of steps.Since a, the lattice parameter, is generally chosen as the length unit in this
lecture notes, the term line tension is often employed for 7 itself.
When -y is positive, one has to provide mechanical work to introduce a-
step into the surface. If the total step free energy L7 vanishes, steps can
appear spontaneously-they cost nothing. Thus, equation (6.16) tells us that
the surface undergoes a transition at a temperature TR approximately givenby
TR -W,
(6.17)kB In 2
This transition is called the roughening transition.
206 Alberto Pimpinelli
6.2.2 The Roughening Transition
As seen above, the roughening transition temperature may be defined as the
temperature at which the line tension of steps vanishes. According to the
experiment [8] the line tension does vanish at some temperature, and itsbehaviour agrees with (6.16). Near TR, the experimental curve bends awayfrom the straight line predicted by formula (6.16): one can wonder whetherit is an instrumental effect or a fundamental one. As will be seen in the next
section, it is a fundamental effect. But before discussing that, we would liketo make three remarks.
* 1. The roughening transition temperature depends on the surface ori-
entation, i.e. it is different for a (111) and for a (1,1,19) surface. This pointwill be addressed in Sect. 6.2.6.
* 2. For a given surface orientation, the step line tension vanishes at the
same temperature for all step orientations, so that Tp is independent of the
step orientation. (Problem: prove this.)* 3. Formula (6.16) suggests that the step line tension may become neg-
ative for T > TR. Actually, it is not so, if a step is defined in a model-
independent way. (Problem: could you think of the appropriate definition?)Indeed, the concept of a step looses its meaning above TR.
6.2.3 Smooth and Rough Surfaces
The roughening transition is much more complicated than suggested by thediscussion of Sect. 6.1.2. Indeed, thermally excited steps are not isolated
objects, they are closed loops. In this Section, we shall try to give an idea ofwhat a rough surface really is. The reader will find more details about the
roughening transition in the monographies by Balibar & Castaing (1985) [9],Van Beijeren & Nolden (1987) [10], Lapujoulade (1994) [11], Nozi6res (1991)[12] and Weeks (1980) [13].
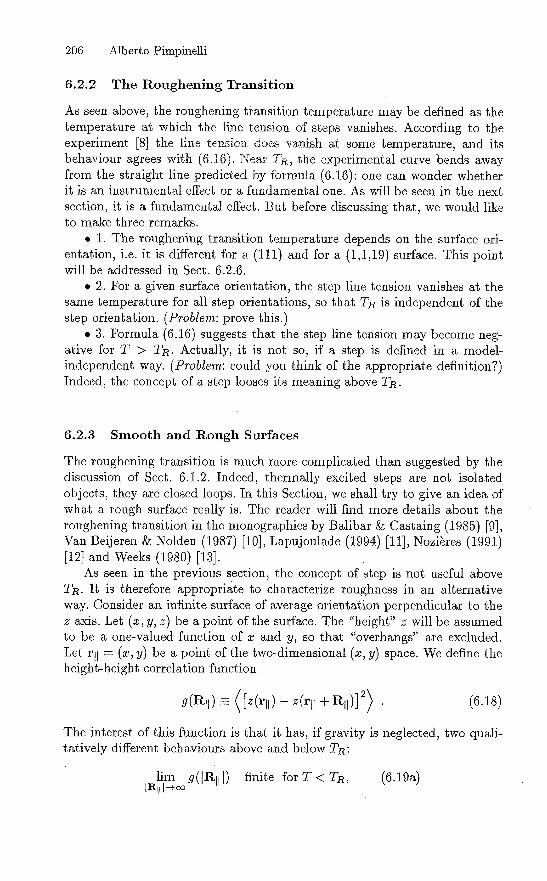
As seen in the previous section, the concept of step is not useful above
TR. It is therefore appropriate to characterize roughness in an alternative
way. Consider an infinite surface of average orientation perpendicular to the
z axis. Let (x, y, z) be a point of the surface. The "height" z will be assumedto be a one-valued function of x and y, so that "overhangs" are excluded.Let r1l -- (x, y) be a point of the two-dimensional (x, y) space. We define the
height-height correlation function
g(R11) -= ( [z(rll) - z(r11 + R11 )]2 (6-18)
The interest of this function is that it has, if gravity is neglected, two quali-tatively different behaviours above and below TR:
lim g (I R11 1) finite for T < TR, (6.19a)JR111-+oo
6 Statistical Physics at Crystal Surfaces 207
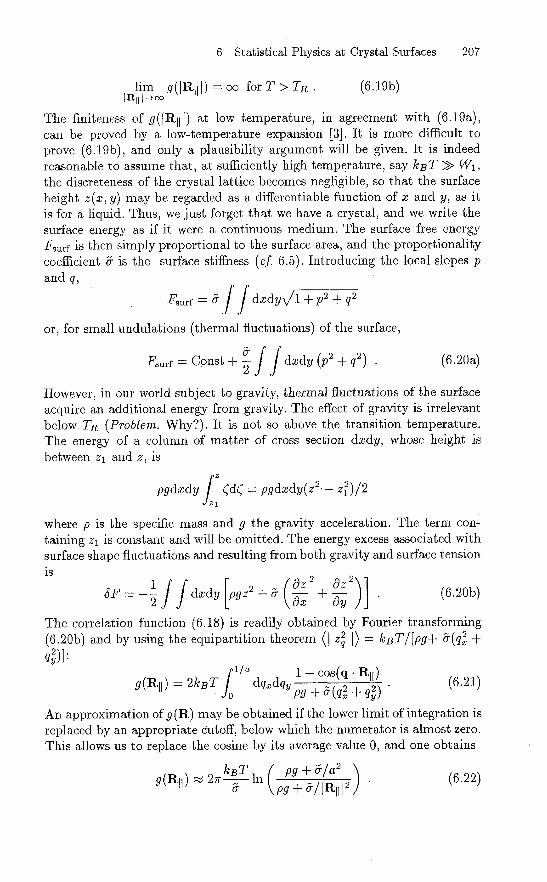
lim g (I R11 oo for T > TR (6.19b)JR111-+oo
The finiteness of g(JR11 I) at low temperature, in agreement with (6.19a),can be proved by a low-temperature expansion [3]. It is more difficult to
prove (6.19b), and only a plausibility argument will be given. It is indeed
reasonable to assume that, at sufficiently high tempqrature, say kBT > W1,the discreteness of the crystal lattice becomes negligible, so that the surface
height z(x, y) may be regarded as a differentiable function of x and y, as it
is for a liquid. Thus, we just forget that we have a crystal, and we write the
surface energy as if it were a continuous medium. The surface free energy
F ,,,,f is then simply proportional to the surface area, and the proportionalitycoefficient & is the surface stiffness (cf. 6.5). Introducing the local slopes pand q,
If - 6 dxdyVF17+i-p +q2F,u
or, for small undulations (thermal fluctuations) of the surface,
FE;u,f = Co.nst + dxdy (P2 + q2) (6.20a)2
However, in our world subject to gravity, thermal fluctuations of the surface
acquire an additional energy from gravity. The effect of gravity is irrelevant
below TR (Problem. Why?). It is not so above the transition temperature.The energy of a column of matter of cross section dxdy, whose height is
between z, and z, is
Z
pgdxdy (d( = pgdxdy(Z2. _ Z2 )/2f'.
I
where p is the specific mass and g the gravity acceleration. The term con-
taining z, is constant and will be omitted. The energy excess associated with
surface shape fluctuations and resulting from both gravity and surface tension
is
(19Z2 (9Z 2) F dxdy pgz2
7. - + (6.20b)2JJ 1 C9X ay
The correlation function (6.18) is readily obtained by Fourier transforming(6.20b) and by using the equipartition theorem (I Z2 1) = kBTI[pg+ &(q2 +
q2)]q X
Y
g(R11) - 2kBT jila dq,dqycos(q - R11) (6.21)
0 + &(q2 + q2)n P9 X Y
An approximation of g(R) may be obtained if the lower limit of integration is
replaced by an appropriate cutoff, below which the numerator is almost zero.
This allows us to replace the cosine by its average value 0, and one obtains
kBT pg + &/a2
g(R11) _- 27r&
In ( pg + &/ JR11 12(6.22)
208 Alberto Pimpinelli
If gravity can be neglected, which is possible for JR11 I < A = V1o_-1pg, (6.22)goes as:
g(Rll)=Const.+(47rkBT/ ,-)I-nlR,llI (6.23)This proves (6.19b). A surface is called rough if the height-height correlationfunction g(R11) diverges as in (6.23), and smooth if there is no divergence.
Previously, we defined the roughening transition in terms of the vanish-
ing of the step free energy 7. We should worry about the equivalence ofthe two definitions. Fortunately, they are equivalent. (Problem. Prove this
equivalence. Hint: the proof of (6.23) relies on the use of (6.20b). If the stepline tension is positive, equation (6.20b) cannot be true). Indeed, if -/ > 0,the formation of a terrace of size L has a free energy cost which divergeswith L. A diverging free energy means forbidden configurations-i.e., whosestatistical weight vanishes-and the correlation function g(R11) is finite for
JR11 I -* oo. Therefore, the roughening transition can be defined (at least on
a high-symmetry surface) either by (6.19a,b) or by the vanishing of ^/.The role of gravity, which kills the roughening transition, becomes neg-
ligible at lengthscales shorter than the capillary length A -- c Ipg. Theorder of magnitude of & is typically the energy of a chemical bond, i.e. IeV
per atom. The resulting value of A is a few centimetres, i.e. much larger thanthe distance over which equilibrium can be reached at a crystal surface. Forthis reason, gravity is usually neglected in surface science.
6.2.4 Diffraction from a Rough Surface
Another important consequence of the peculiarity of the roughening transi-tion is the form of diffraction peaks in a scattering experiment. The x-raysor atom scattering cross section has the form (see Chap. 2)
do- A- i'l [h(X,Y)-h(O)] _i(g"X+qYY)
_2dXdY e e (6.24)dS2 q '
where A depends on the electronic density of the surface atoms and z --
h(X, Y) describes the shape of the surface. The angular brackets denote ther-mal averaging over surface fluctuations. In order to compute this average, itis customary to make the assumption that fluctuations have a Gaussian prob-ability distribution. With this assumption. it is straightforward to show that
(Chap. 2)
q2iq ,[h(Rjj)-h(O)] ([h(Rjj)-h(O)]2)r(R11) -= (e_ ) - e
2 (6.25)
where we wrote Rjj = (X, Y). In the exponent at the right-hand side of
equation (6.25) we recognize the height-height correlation function of the
preceding section. The function r(R) takes the name of pair correlation

6 Statistical Physics at Crystal Surfaces 209
function. To appreciate the relation between the height-height and the paircorrelation functions, the latter being the quantity directly measured in a
scattering experiment, it is instructive to consider a few examples:i) g(R11) = C. The pair correlation function is also a constant,
r(R11) = C',
and the scattered intensity obtained from (6.24) is a delta function.
ii) g(R11) = CIR11 I. The 'pair correlation function is an exponential
cg2' JR111r(R11) -_ e-. (6.26)
The scattering cross section allows us to find the scattered intensity 1, which
is a Lorentzian in this case:
2Cq2
C2q4 + 4q2z 11
where q, and q1I are the components of the momentum transfer wavevector
respectively orthogonal and parallel to the average surface.
iii) g (R11) -_ C In I R11 1. The pair correlation function has a power-lawbehaviour
Cq2InIR111 IRIII-Cq,2 1'(RII) = e- - (6.27)as well as the scattered intensity
2
q2+Cq.
The case of a vicinal (stepped) crystal surface will be treated here [14]. At
low temperature g(R11) is a constant, and delta-function peaks are expected.Beyond TR, the diffraction peaks are expected to acquire a power-law shape.However, a vicinal surface has two non equivalent directions, parallel and
orthogonal to the steps. When computing the scattered intensity we must
integrate only along a vector orthogonal to the steps. Then one finds
qI+Cq 2,
At the position of largest sensitivity, qz = 7r/a, the intensity of the diffraction
peaks behave as I - q 11+C7r2 /a2, where C is actually a function of the tem-
perature, C -- QT). According to (6.23), at TR the height-height correlation
function has the form of case (iii) above, and C(TR) is equal to the universal
value 2a2/7r2 . Thus, the scattered intensity at the transition temperature TRreads
q1+2
and the roughening temperature can be -found as the temperature where
T -_
d (In 1)d (In q11)

210 Alberto Pimpinelli
6.2.5 Capillary Waves
In the case of an isotropic surface, such as the surface of a liquid, (6.20b)describes thermal excitations of the surface, the so-called capillary waves.
As we have seen in Sect. 6.2.5, equation (6.22) implies that the reflectedintensity of e.g. x-rays from the surface allows a direct measurement of the
surface tension o- (which coincides with & for a liquid).
6.3 Surface Growth and Kinetic Roughening
6.3.1 Equilibrium with the Saturated Vapour
At any temperature, a crystal is in equilibrium with its saturated vapourat pressure Psat. Assuming the vapour to be an ideal gas with density Psat,kinetic theory dictates the impingement rate of atoms onto the surface [4,1]:Rimp :::::: Psat1'/2__7rMkBT-
Assuming that all the atoms are adsorbed-equivalently, that the stickingcoefficient is unity, which is not necessarily true with molecular species-detailed balance gives the equilibrium adatom density neq once the saturated
vapour pressure is known. If Tev is the average lifetime of an adatom before
evaporation, then Rimp -- Revap neq/Tev, and
neq Psat(6.28)
Tev v '27rmkBT
The right-hand side of this equation is called the evaporation rate of the
crystal. The saturated vapour pressure for a given solid is obtained from the
equation of state of an ideal gas; the detailed derivation is in [1]. The result
is
Psat - (k 2 ( M )2 (6.29)BT)
27rh2exp(-PWcoh) -
Inserting (6.29) into (6.28) we obtain the evaporation rate in the form
neqM
'rev 47r2h3 exp(-13Wcoh) (6.30)
The quantity in front of the exponential has dimension [length-2 time-']. Its
temperature dependence is weak compared to the exponential, so that it is
usually written as a T-independent coefficient T -'. Numerical values of I/Toare of order 1014 'k-2 s-1 for most elements, at room temperature.
6.3.2 Supersaturation and Vapour Deposition
In the equilibrium state, the chemical potential of the solid and of its vapour
must be equal: 1-tsolid - Yvapour = Peq- What happens if we increase the
6 Statistical Physics at Crystal Surfaces 211
chemical potential in the vapour? The vapour atoms go where the chemical
potential is lower, i.e. to the solid. The solid grows! The difference
- /-1vapour - Yeq
is called the supersaturation. The chemical potential is not easily controlled
by the experimentalist. It is easier to change the pressure. For a vapour
treated as an ideal gas, the pressure can be written as
P ---:: Psat exp (OzAp)
Therefore, for 0Ap < 1,
flzAP - Psat
(6.31)Psat
The growth rate i of a rough crystal surface is then simply determined bythe balance between the atoms impinging from the vapour and those re-
evaporating, = Rimp - Rev :-- (P - Psat)/V/'2__7rrnkBT, (6-32)
where we used (6.28). From (6.29) we find
P
Psat
M472V exp(-Mcoh) (6.33)
From (6.33) we see that the growth rate is proportional to the super-saturation-when the latter is not too small, see Ref. [15] -and that it is thermally ac-
tivated: a barrier must be overcome, which is given by the cohesion energy.In particular, one sees that the growth rate does not depend on the surface
orientation. It is not always so, as it has been shown by [15]. However, (6.33)gives an upper limit to the growth rate of a crystal. Indeed, equation (6.33) is
valid for a surface which is rough at equilibrium. Impinging atoms find plentyof favorable sites (kinks) for being incorporated. When the starting surface
is Parallel to a high-symmetry direction below the equilibrium rougheningtemperature, steps and kinks have to be created before the atoms can be
incorporated. This is the phenomenon of nucleation.
6.3.3 Nucleation on a High Symmetry Substrate
On a close packed, step-free high-symmetry surface like (I 11) or (00 1), below
'its roughening temperature, atoms impinging from a vapour-aswell as from
an atomic or molecular beam-do not find energetically favourable sites to be
incorporated into. Indeed, they first have to condense into aggregates, which
will then grow by capturing other atoms. If the supersaturation ZAP is small,i.e. if the system is not far from equilibrium, atom condensation will be ruled
by the free energy gain in forming a two-dimensional aggregate of size R,
212 Alberto Pimpinelli
, AG&,, = -irzApR', which is opposed by the free energy cost of forming a
step on the surface ,_AGc,,,,t = 21r7R. Adding the competing contributions one
finds2AG(R) -- 27r-yR - 7rzApR (6.34)
This function of R has a maximum at R = R, = -ylAy. It is the phenomenonof nucleation: aggregates of size smaller than the critical radius Rc can
decrease their free energy by shrinking, while those whose radius is larger thanR, will grow further. The nucleation rate J,,uc is expected to be dominated
by the probability of finding an aggregate at the nucleation barrier AG* --
Z G(R,) - 7r-y'/zAp, i.e.
(-7r' ) -Jnuc - expAy (6-35)
Small variations in the supersaturation are enormously amplified by the ex-
ponential dependence. The growth rate is now determined by the nucleationrate (6.35), and by the spreading velocity of the supercritical aggregates.Qualitatively, one expects to observe random nucleation of two-dimensional
seeds, lateral spreading of the aggregates, and coalescence. The process willthen. start again on the freshly created layer. The growth rate will thus be
an oscillating function of time, the period being equal to the formation timeof a whole layer. The oscillation is a consequence of the discrete (layered)structure of a crystal, which is kept by its surface as long as it is below its
roughening temperature.However, if growth is continued, after a system-dependent time span the
oscillations die out, and a quasi-stationary distribution of surface steps sets
in. Indeed, the oscillations demand that each layer is started and completedin succession, with a high degree of temporal correlation. Randomness in
deposition and nucleation destroy such correlations, and a disordered state,that we would be tempted to call rough, appears. In fact, it is found thatafter transients have died out, any growing surface is rough, with power-lawcorrelations, as well in space as in time. This is kinetic roughening.
6.3.4 Kink-Limited Growth Kinetics
Kinetic roughening is the outcome of the competition of two different mecha-nisms: randomness in deposition and nucleation, which, following the current
jargon, we ,Vill call noise, and matter transport processes. The effect of noise
can be easily seen by picturing growth without matter transport at the grow-ing interface. Atoms just stick where they hit, which happens at a rate F
per unit surface and time. The number of deposited atoms in time t is thusN Ft. The statistical fluctuation of this number is W -\/_N VT.One would thus expect the rms fluctuations of the surface height (or surface

6 Statistical Physics at Crystal Surfaces 213
width),W(t) = V([Z(J) - Z(o)]2) (6.36)
to be proportional to JN, so that
W(t) _ t1/2 (6.37)This is an example of the power laws mentioned at the end of the previous sec-
tion. Of course, the random deposition model without smoothening processesis an extreme example, though it may be appropriate to very low tempera-ture, where surface mobilities are very slow. In real experimental situations,one seeks to obtain as flat a surface as possible. Indeed, the Gibbs-Thomson
equation (6.12) states that an excess of chemical potential is stored where
an excess of particle has accumulated: the surface will thus tend to relax bytransferring these particles towards places with lower chemical potential. In a
reference frame moving at the average growth velocity of the interface, F, the
surface height z(t) evolves according to the laws of linear thermodynamics:
- V'3 02 Z 02 Z
(6.38)+(19X2 y2where the linearized expression (6.10) for the chemical potential has been
used, and v is a kinetic coefficient related to the rate of capture and emission
of atoms by kinks, from and to the vapour.The randomizing noise and the smoothing term (6.38) may be put togetherto obtain a Langevin equation for describing growth of a fluctuating interface
in a vapour phase:(9Z a2Z -02Z.
+ Tj (6.39)19t _X2 + (9Y2 )
where q(x, t) is a random function with the properties
6.3.5 Scaling
(TI) -- 0, (77 (x, t),q (x', t')) -- FS(x - x) 6 (t - t') . (6.40).
Since the equation (6.40) is linear, it is readily solved by Fourier tranforma-
tion [1]. Instead, we will perfo"rm a scaling analysis [16,1]. Rescale x = (x, y)by a factor A, z by a factor Ac, and the time by a factor A'. Equation (6.39)becomes
Aa-z19Z
11&Aa-2 (a2Z (92Z.+ A-1-z/2 (6.41)
at 5_X2 + OY2 )where the rescaling of the noise follows from the properties of &functions
(6(ax) = J(x)la).Dividing both sides by A", we get
0Z= V&Az-2
02Z (92Z+ Az/2-1-a
at (5-X2 + V) 77 (6.42)
214 Alberto Pimpinelli
This equation coincides with (6.39) if z = 2 and a = 0. What is the meaning ofthese exponents? To see this, we need playing a little with scaling relations.Consider the surface width (6.36). Under rescaling z' = A'z, t' -- A't, w
behaves as
W(tl) AO V([Z(Azj) - Z(o)]2) (6.43)
On the other hand, we expect that w(t) be a power-law function of t as in
(6.37). We introduce another exponent, 3, such that
w(t) - to. (6.44)
In critical phenomena, power-law behaviour at the critical point is a con-
sequence of the absence of a characteristic lengthscale in the problem, the
correlation length being infinite at T,. We conclude that also in the case of
growth of an interface no typical lengthscale exists, except for the lattice
parameter a, which is immaterial at long wavelengths, and the size L of the
system. Letting A -_ L in equation (6.43), we find
w(t) LV _(_[z(L2t)- z(O)]2) . (6.45)
We see that for times t of the order Of tcrossover - L', the surface width w
reaches the time-independent (saturation) value
Wsaturation -- LV([z(l) - Z(o)]2) L'. (6.46)
To be coherent with (6.44), which implies Uisaturation W(tcrossover) - t c3rossoverL',8, equation (6.46) requires L' L'P, or
Z a/,8. (6.47)
We see now how the exponents a, and z can be intrerpreted:* a is the roughness exponent, which characterizes the increase of the
saturation value (the value at t > tcrossover) of the surface width with the
system size L:
Wsaturation - L' ;
* P is the growth exponent, which characterizes the increase of thesurface width with the time t (at t < tcrossover):
w (t) - 0 -3
z is the dynamic exponent, which characterizes the increase of the
crossover time with the system size L:
tcrossover - L'
The equality (6.47) relates the three exponents. Random deposition, as seen
at the beginning of Sect. 6.3.4, gives # -- 1/2. In this extreme model, a and
6 Statistical Physics at Crystal Surfaces 215
are not defined, due to the strict locality of the deposition process: the
system's behaviour is completely insensitive to the system size. The resultinginterface is completely-and maximally-uncorrelated. The growth model
of equation (6.39), known as the Edwards-Wilkinson model[17], has z = 2
and oz -_ # -_ 0 in three dimensions-that is, for a two-dimensional surface.
Indeed, the direct solution shows that a = 0 -- 0 means in reality logarithmi-cally diverging correlations, like equation (6.23) of equilibrium roughening.Not all models behave like that, as seen in next section.
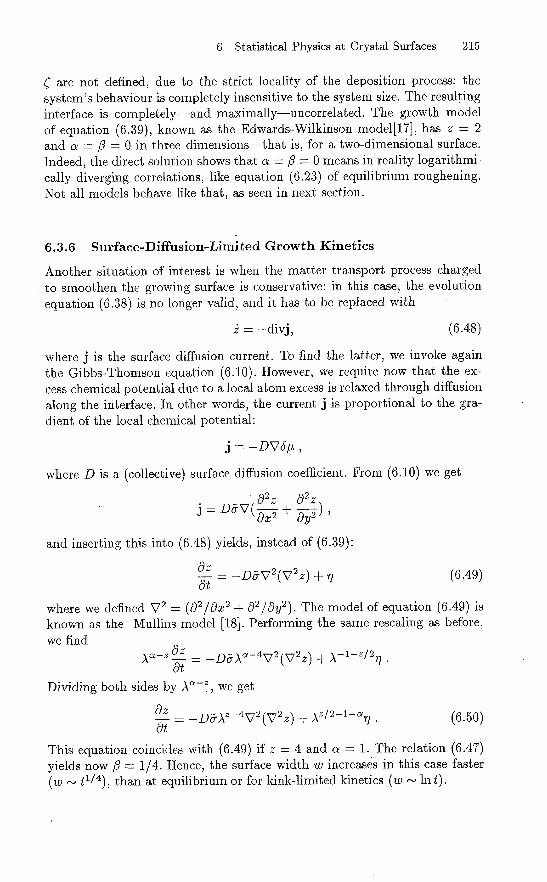
6.3.6 Surface-Diffusion-Limited Growth Kinetics
Another situation of interest is when the matter transport process chargedto smoothen the growing surface is conservative: in this case, the evolution
equation (6.38) is no longer valid, and it has to be replaced with
i = -divi, (6.48)
where j is the surface diffusion current. To find the latter, we invoke againthe Gibbs-Thomson equation (6.10). However, we require now that the ex-
cess chemical potential due to a local atom excess is relaxed through diffusion
along the interface. In other words, the current j is proportional to the gra-
dient of the local chemical potential:
j -- -DWy ,
where D is a (collective) surface diffusion coefficient. From (6.10) we get
2Z 2Zj
X2+
ay2
and inserting this into (6.48) yields, instead of (6.39):
0Z- 7,72(V2Z) + 71at
-R (6.49)
where we defined V = ((92/aX2 + a2/ay2). The model of equation (6.49) is
known as the Mullins model [18]. Performing the same rescaling as before,we find
Aa-zaz
= -D&Aa-4,72(V2Z) + A-I-z/2, at
Dividing both sides by A`, we get
azD&A'-4,72(,72Z) + Az/2-1-a, (6.50)
at
This equation coincides with (6.49) if z = 4 and a = 1. The relation (6.47)yields now 1/4. Hence, the surface width w increases in this case faster
(W _ t1/4 ), than at equilibrium or for kink-limited kinetics (w - In t).
216 Alberto Pimpinelli
Different physical situations will thus give different exponents. Again,this resembles very much the case of critical phenomena. Indeed, universalityclasses appear, where different models such as (6.39) or (6.49) find their place,characterised by different sets of vallues of a, 13 and z. Symmetry arguments,as well as physical considerations, dictate the form of the equation whichrules the evolution of the interface, and thus the universality class where it
belongs to. A lot more of details on this fascinating subject will be found inRefs. [16] and [1].
References
1. A. Pimpinelli, J.. Villain Physics of Cristal Growth Al6a-Saclay series n' 4,Cambridge University Press, Cambridge (UK), 1998.
2. B. Caroli, C. Caroli, B. Roulet in Solids far from equilibrium, C. Godreche ed.
(Cambridge University Press, 1991). Instabilities of planar solidification fronts.3. J. Villain, A. Pimpinelli. Physique de la croissance cristalline, Coll. A16a-
Saclay, Eyrolles (Paris), 1995.
4. L. Landau, E. Lifshitz Statistical Physics, Pergamon Press, London, 1959.
5. G. Blatter Surface Sci. 145, 419 (1984).6. A.C. Levi Surface Sci. 137, 385 (1984).7. G. Armand, J.R. Manson Phys. Rev. B 37, 4363 (1988).8. F. Gallet, S. Balibar, E. Rolley J. de Physique 48, 369 (1987).9. S. Balibar, B. Castaing Surface Sci. Reports 5 (1985), 87.
10. H. van Beijeren, 1. Nolden in Structure and Dynamics of Surfaces 11, W. Schom-
mers and P. von Blanckenhagen eds., Topics in Current Physics 43 (Springer,Berlin, 1987).
11. J. Lapujoulade Surf. Sci. Rep. 20, 191 (1994).12. P. Nozi6res in Solids far from equilibrium, C. Godr6che ed. (Cambridge Uni-
versity Press, 1991). Shape and growth of crystals.13. J.b. Weeks in Ordering in Strongly Fluctuating Condensed Matter Systems T.
Riste ed. (Plenum, New York, 1980) p. 293. The roughening transition.14. J. Villain, D. GremPel, J. Lapujolade J. Phys. F 15, 806 (1985).15. W.K. Burton, N. Cabrera, F. Frank Phil. Trans. Roy. Soc. 243, 299 (1951).16. A.-L. BarabAsi, H.E. Stanley Fractal Concepts in Surface Growth Cambridge
University Press, Cambridge (UK), 1995.
17. Edwards', S.F., Wilkinson, D.R. Proc. Roy. Soc. A 381, 17 (1982).
18. Mullins, W.W. J. Appl. Phys. 30, 77 (1959).